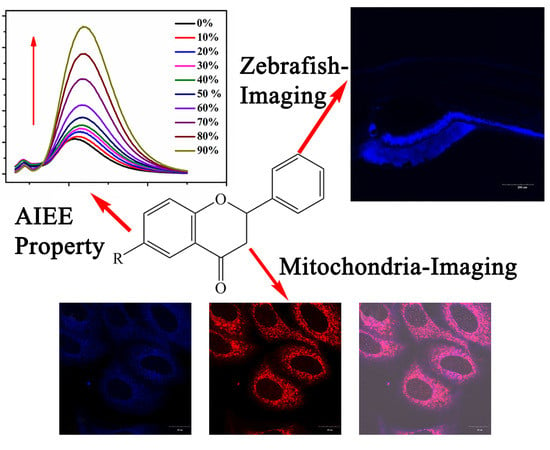
Flavanone-Based Fluorophores with Aggregation-Induced Emission Enhancement Characteristics for Mitochondria-Imaging and Zebrafish-Imaging


Abstract
:
1. Introduction
2. Results and Discussion
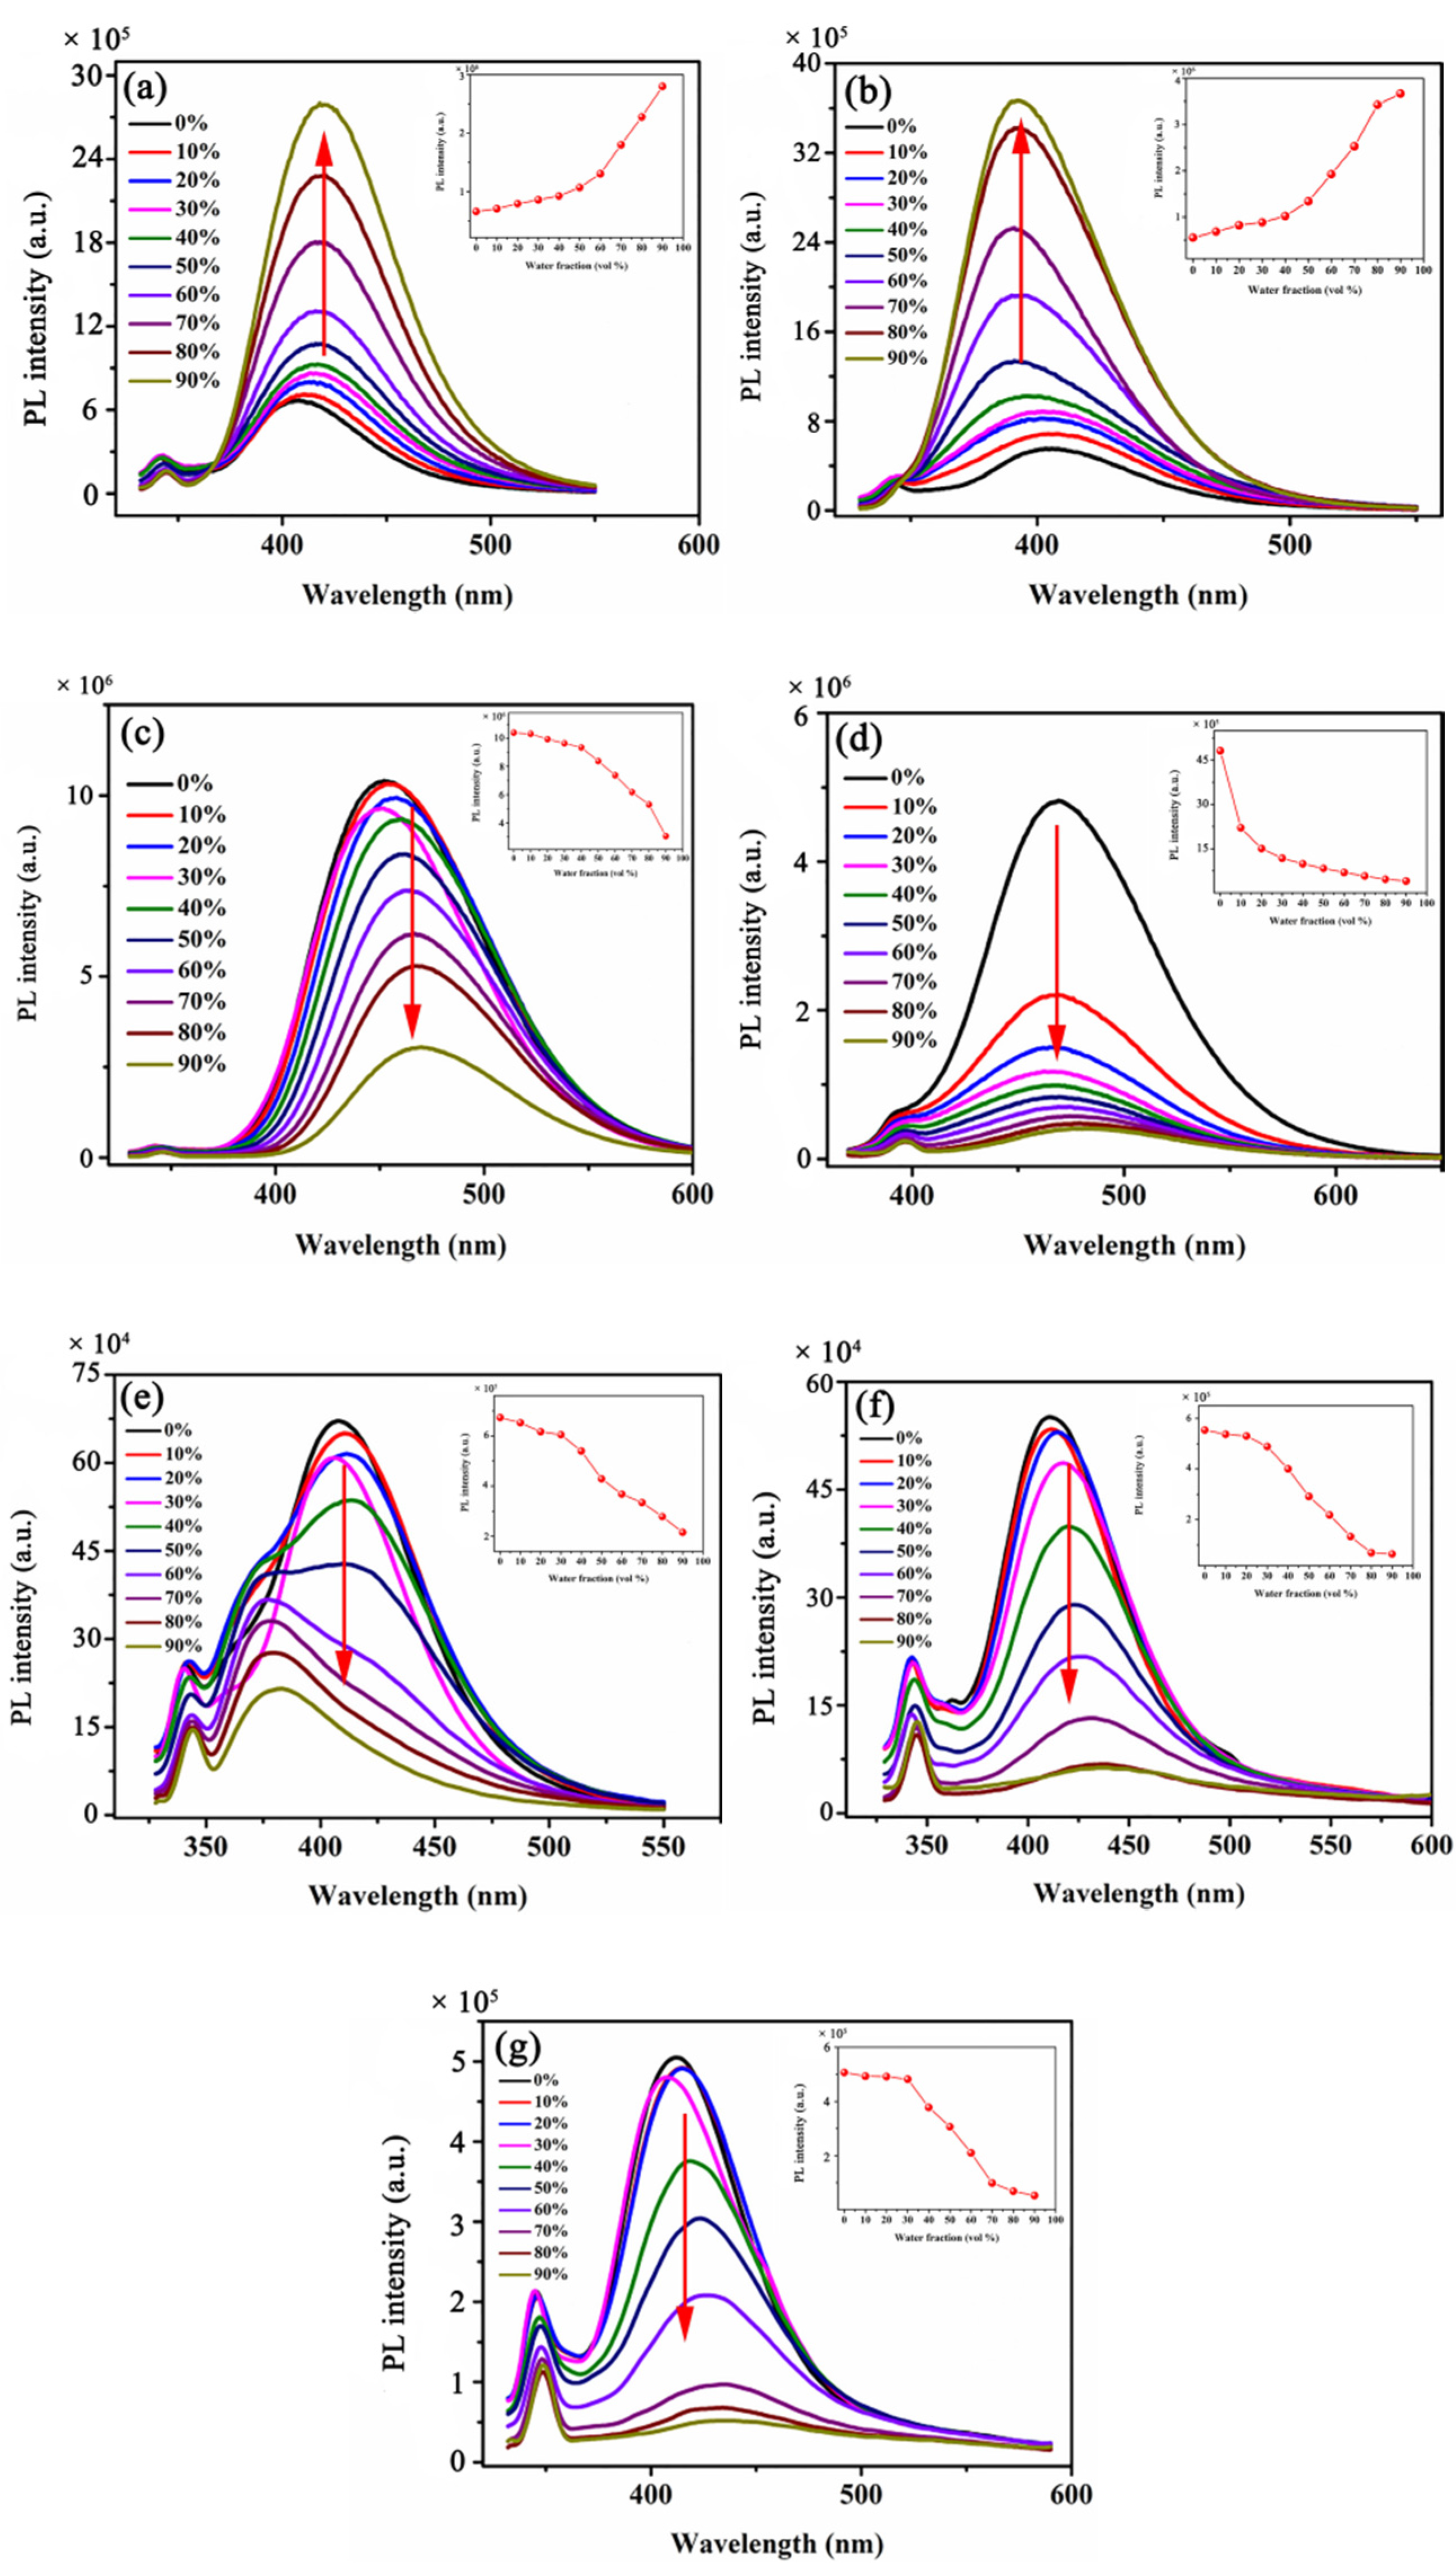
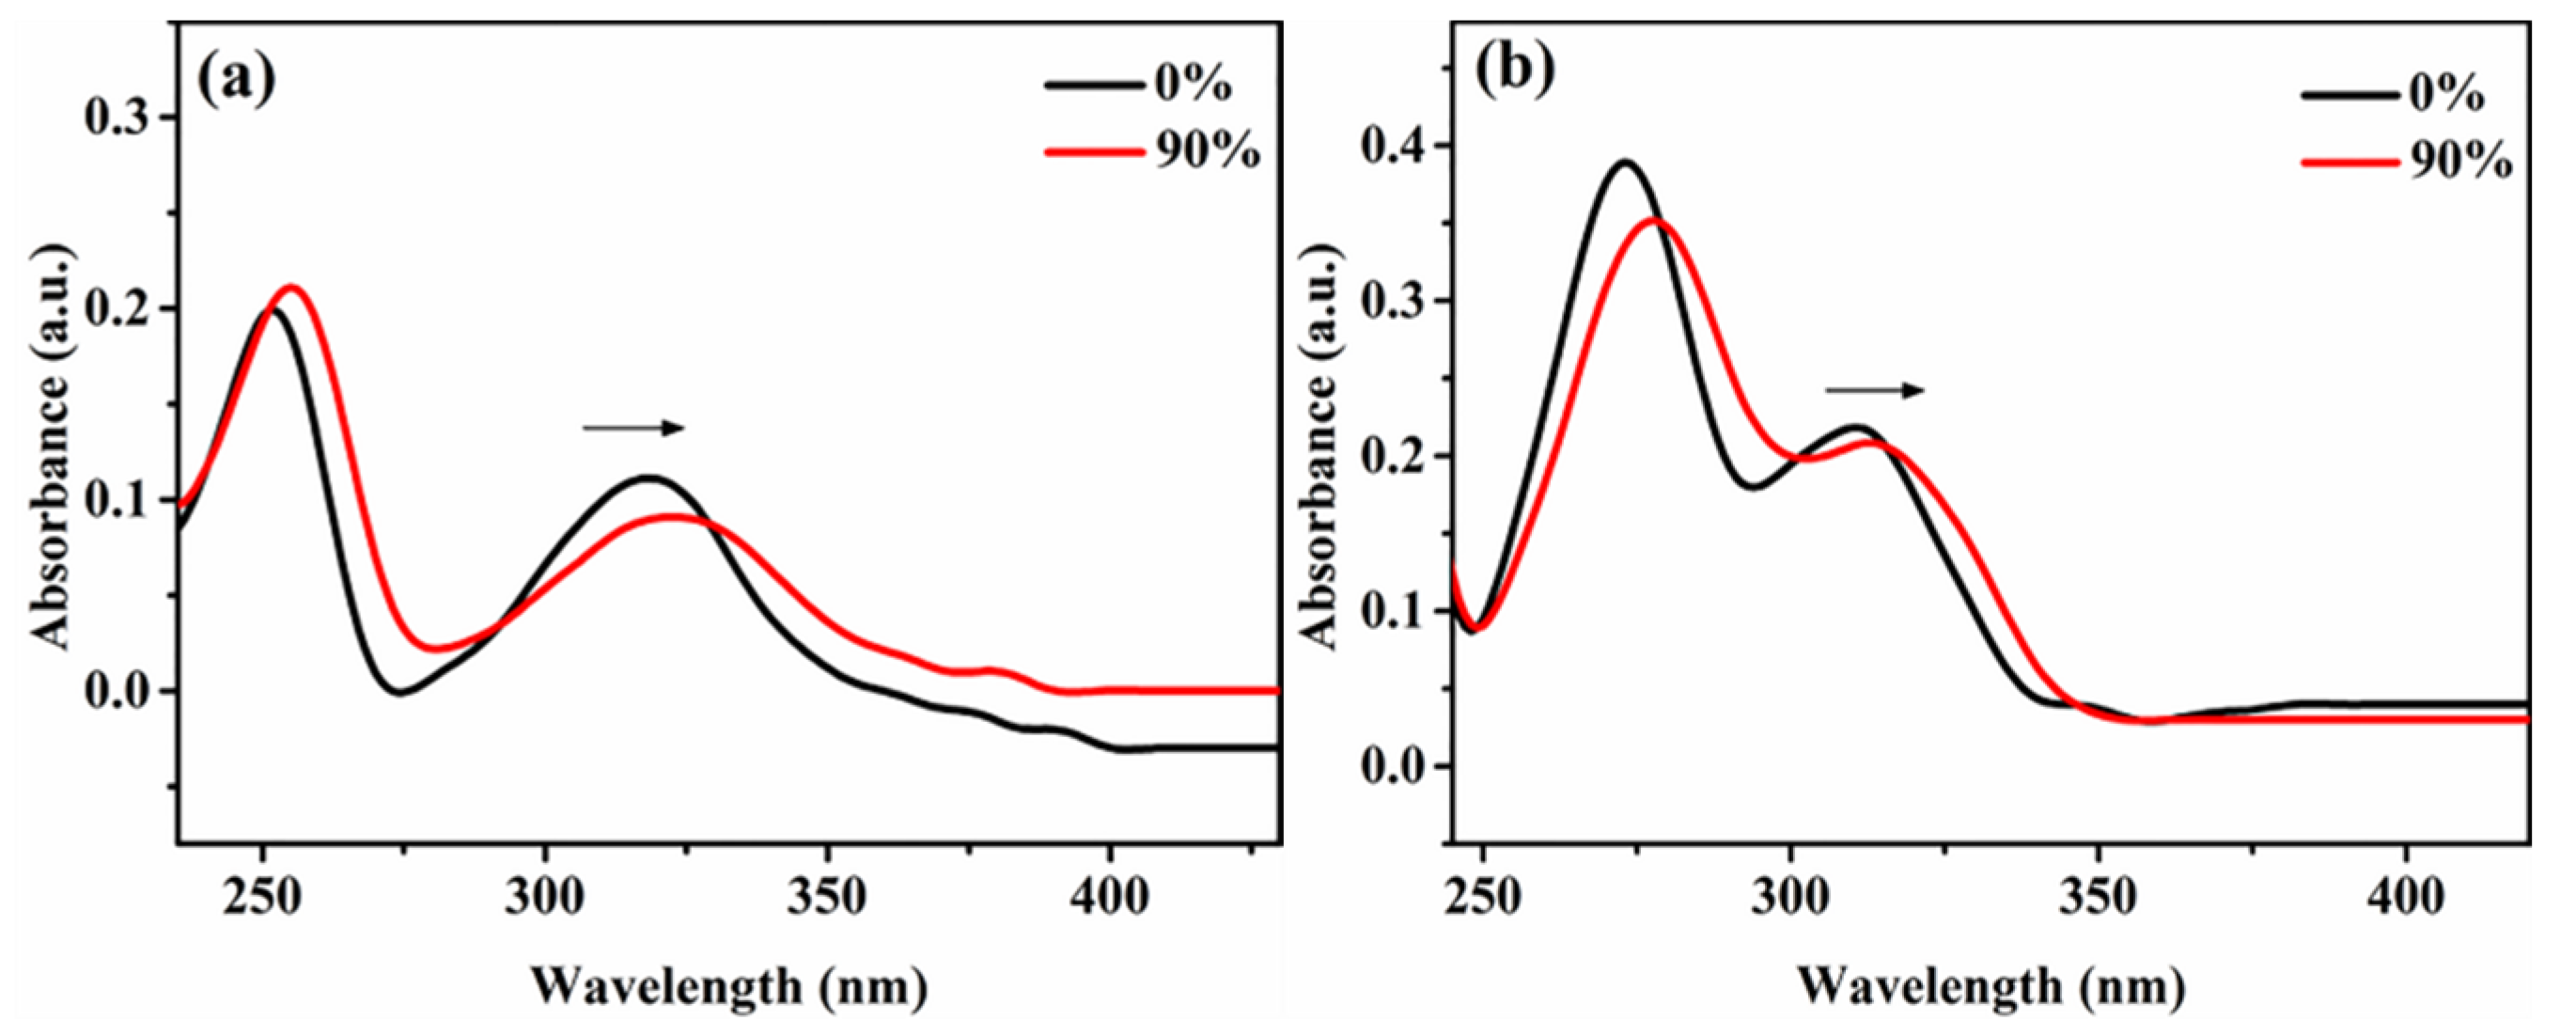
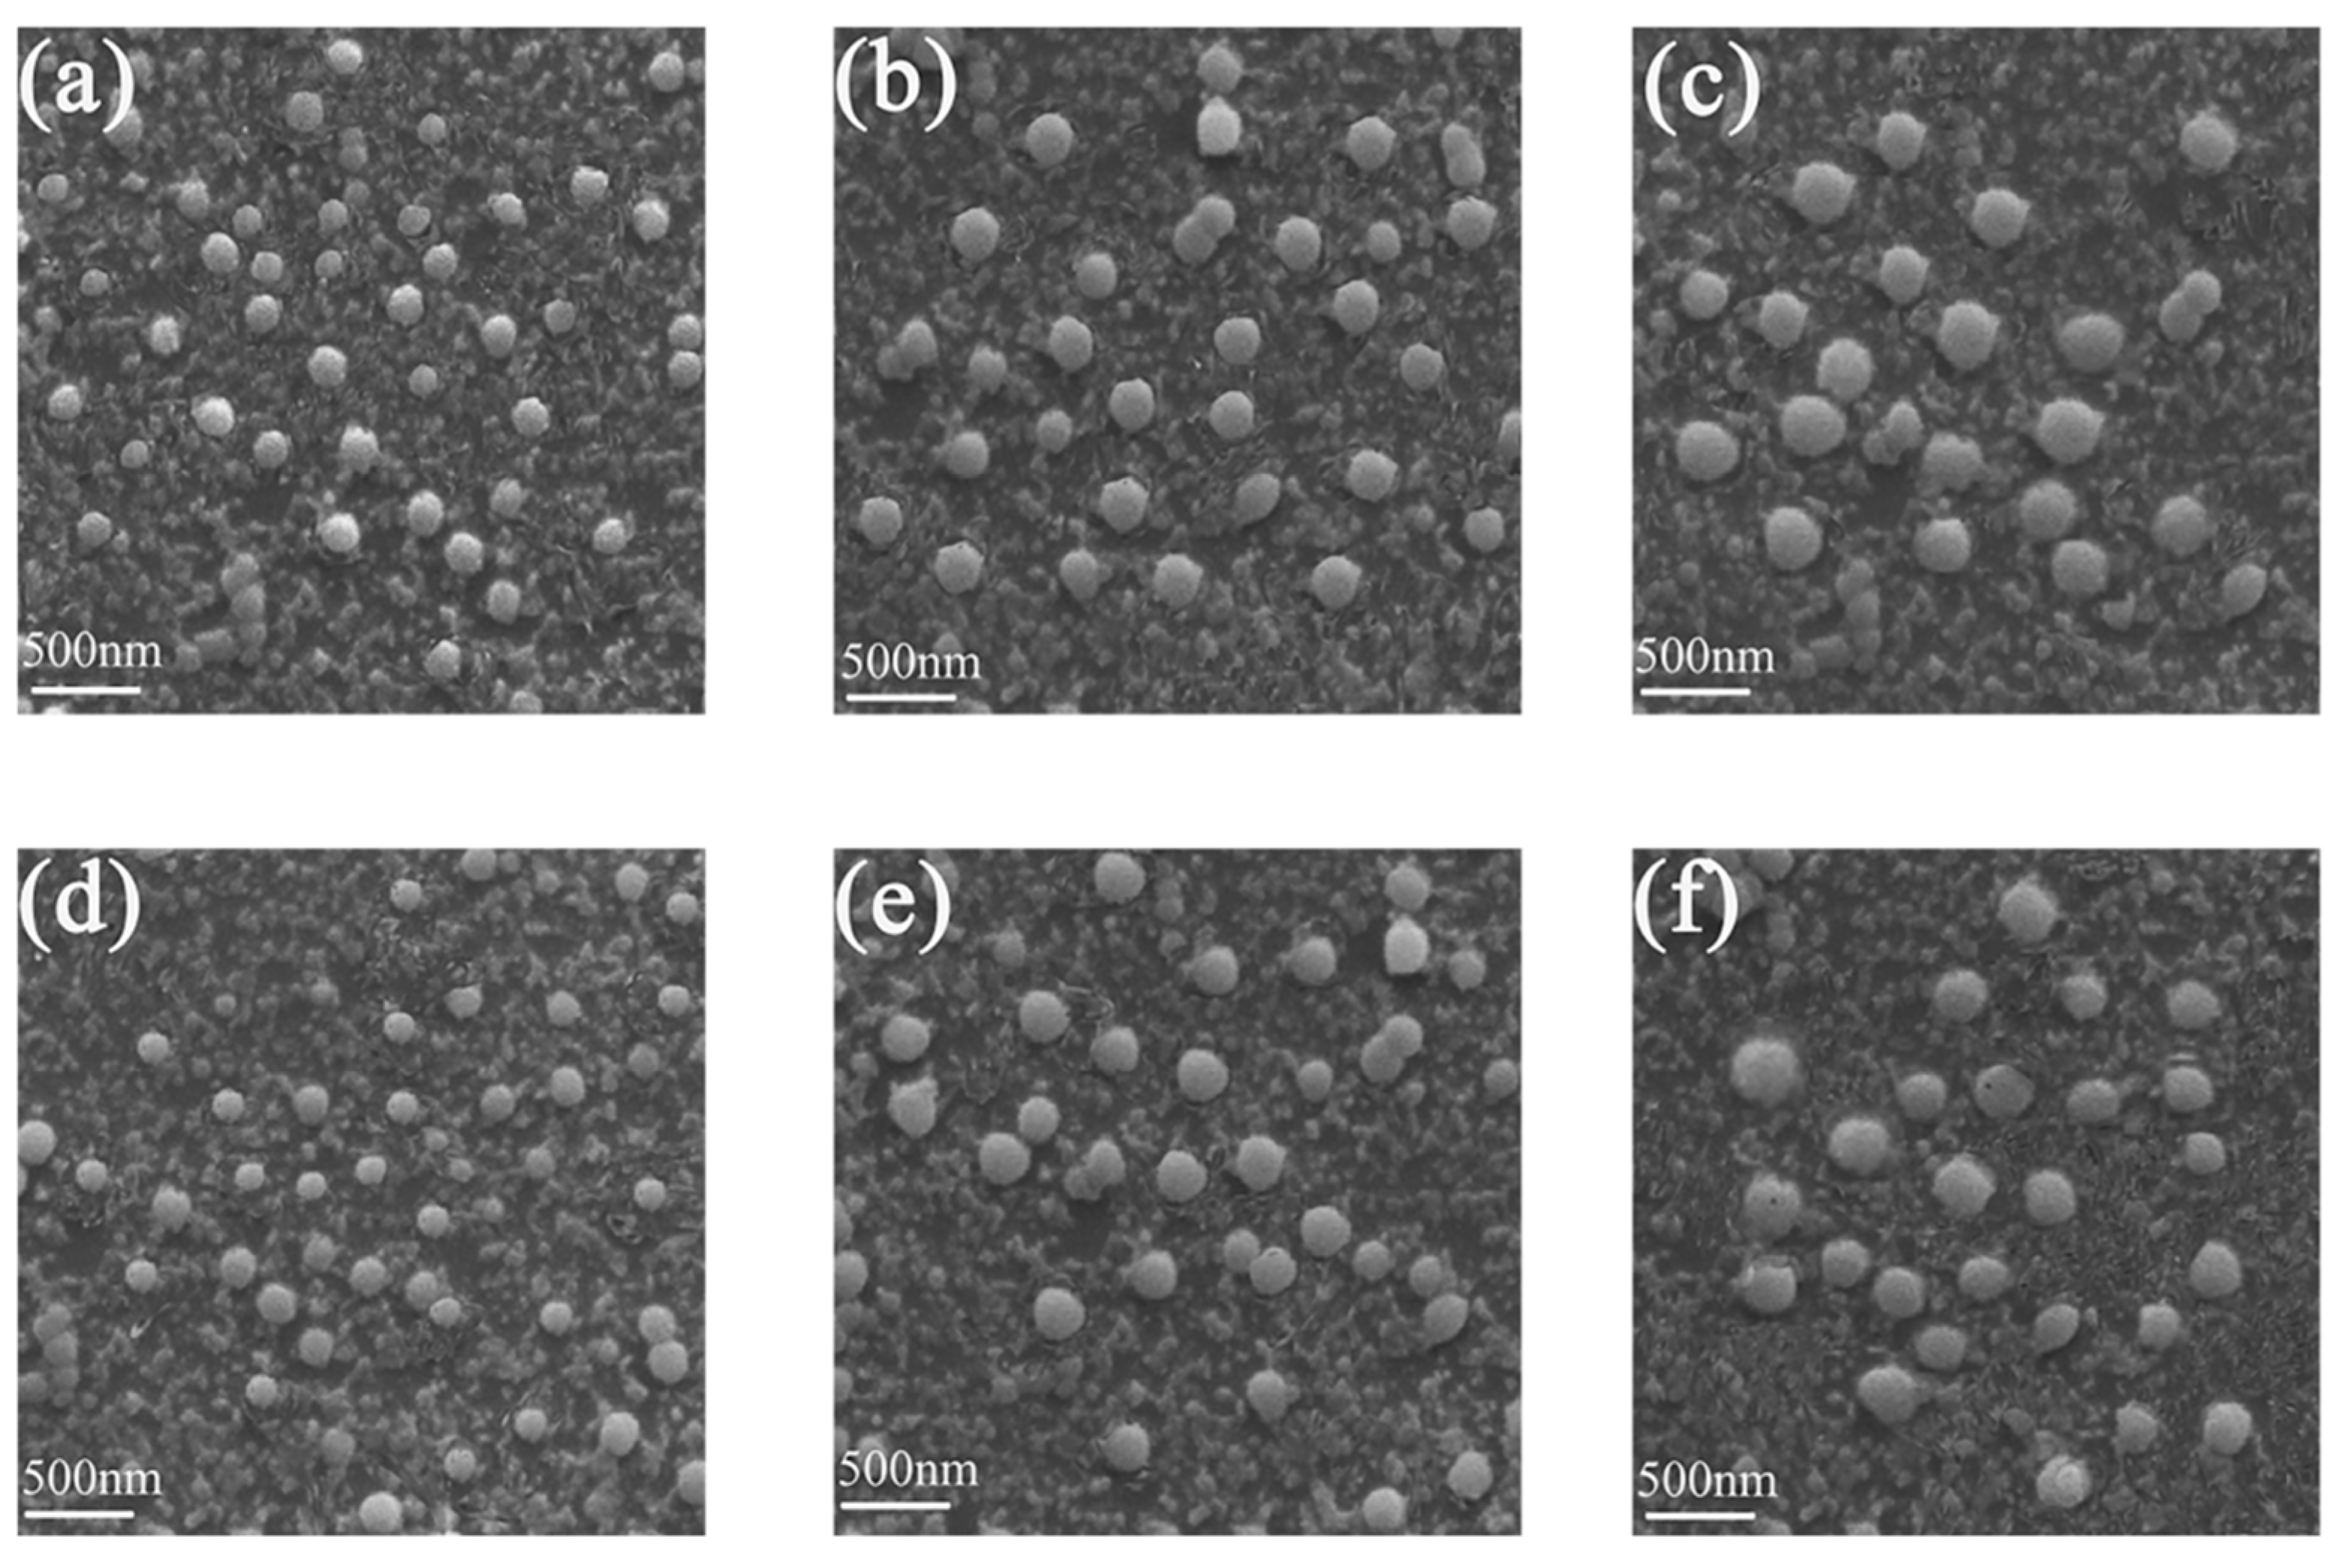
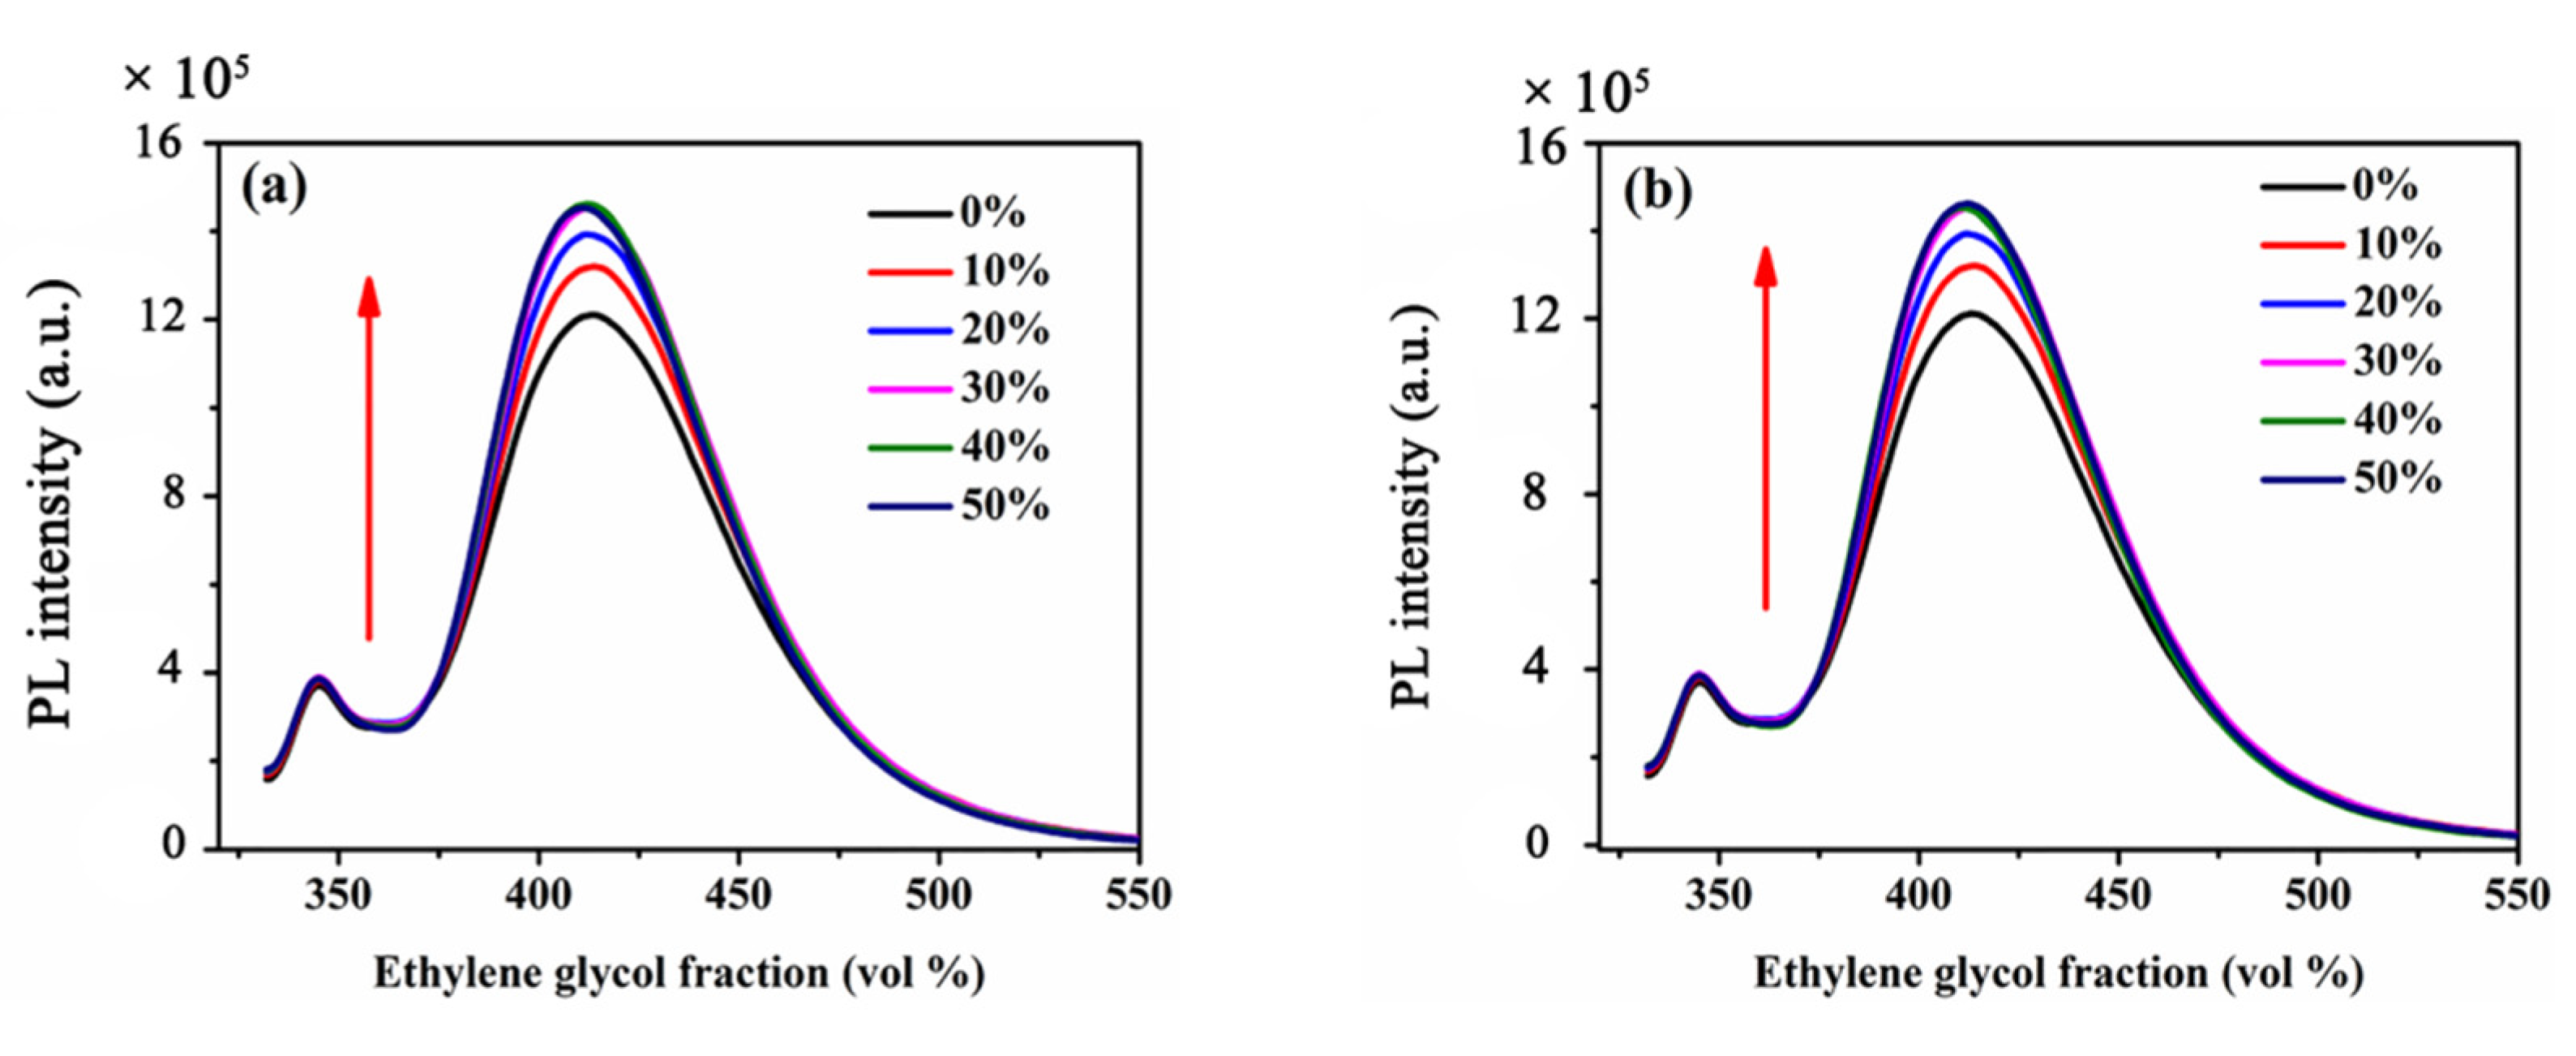
2.1. Optical Properties
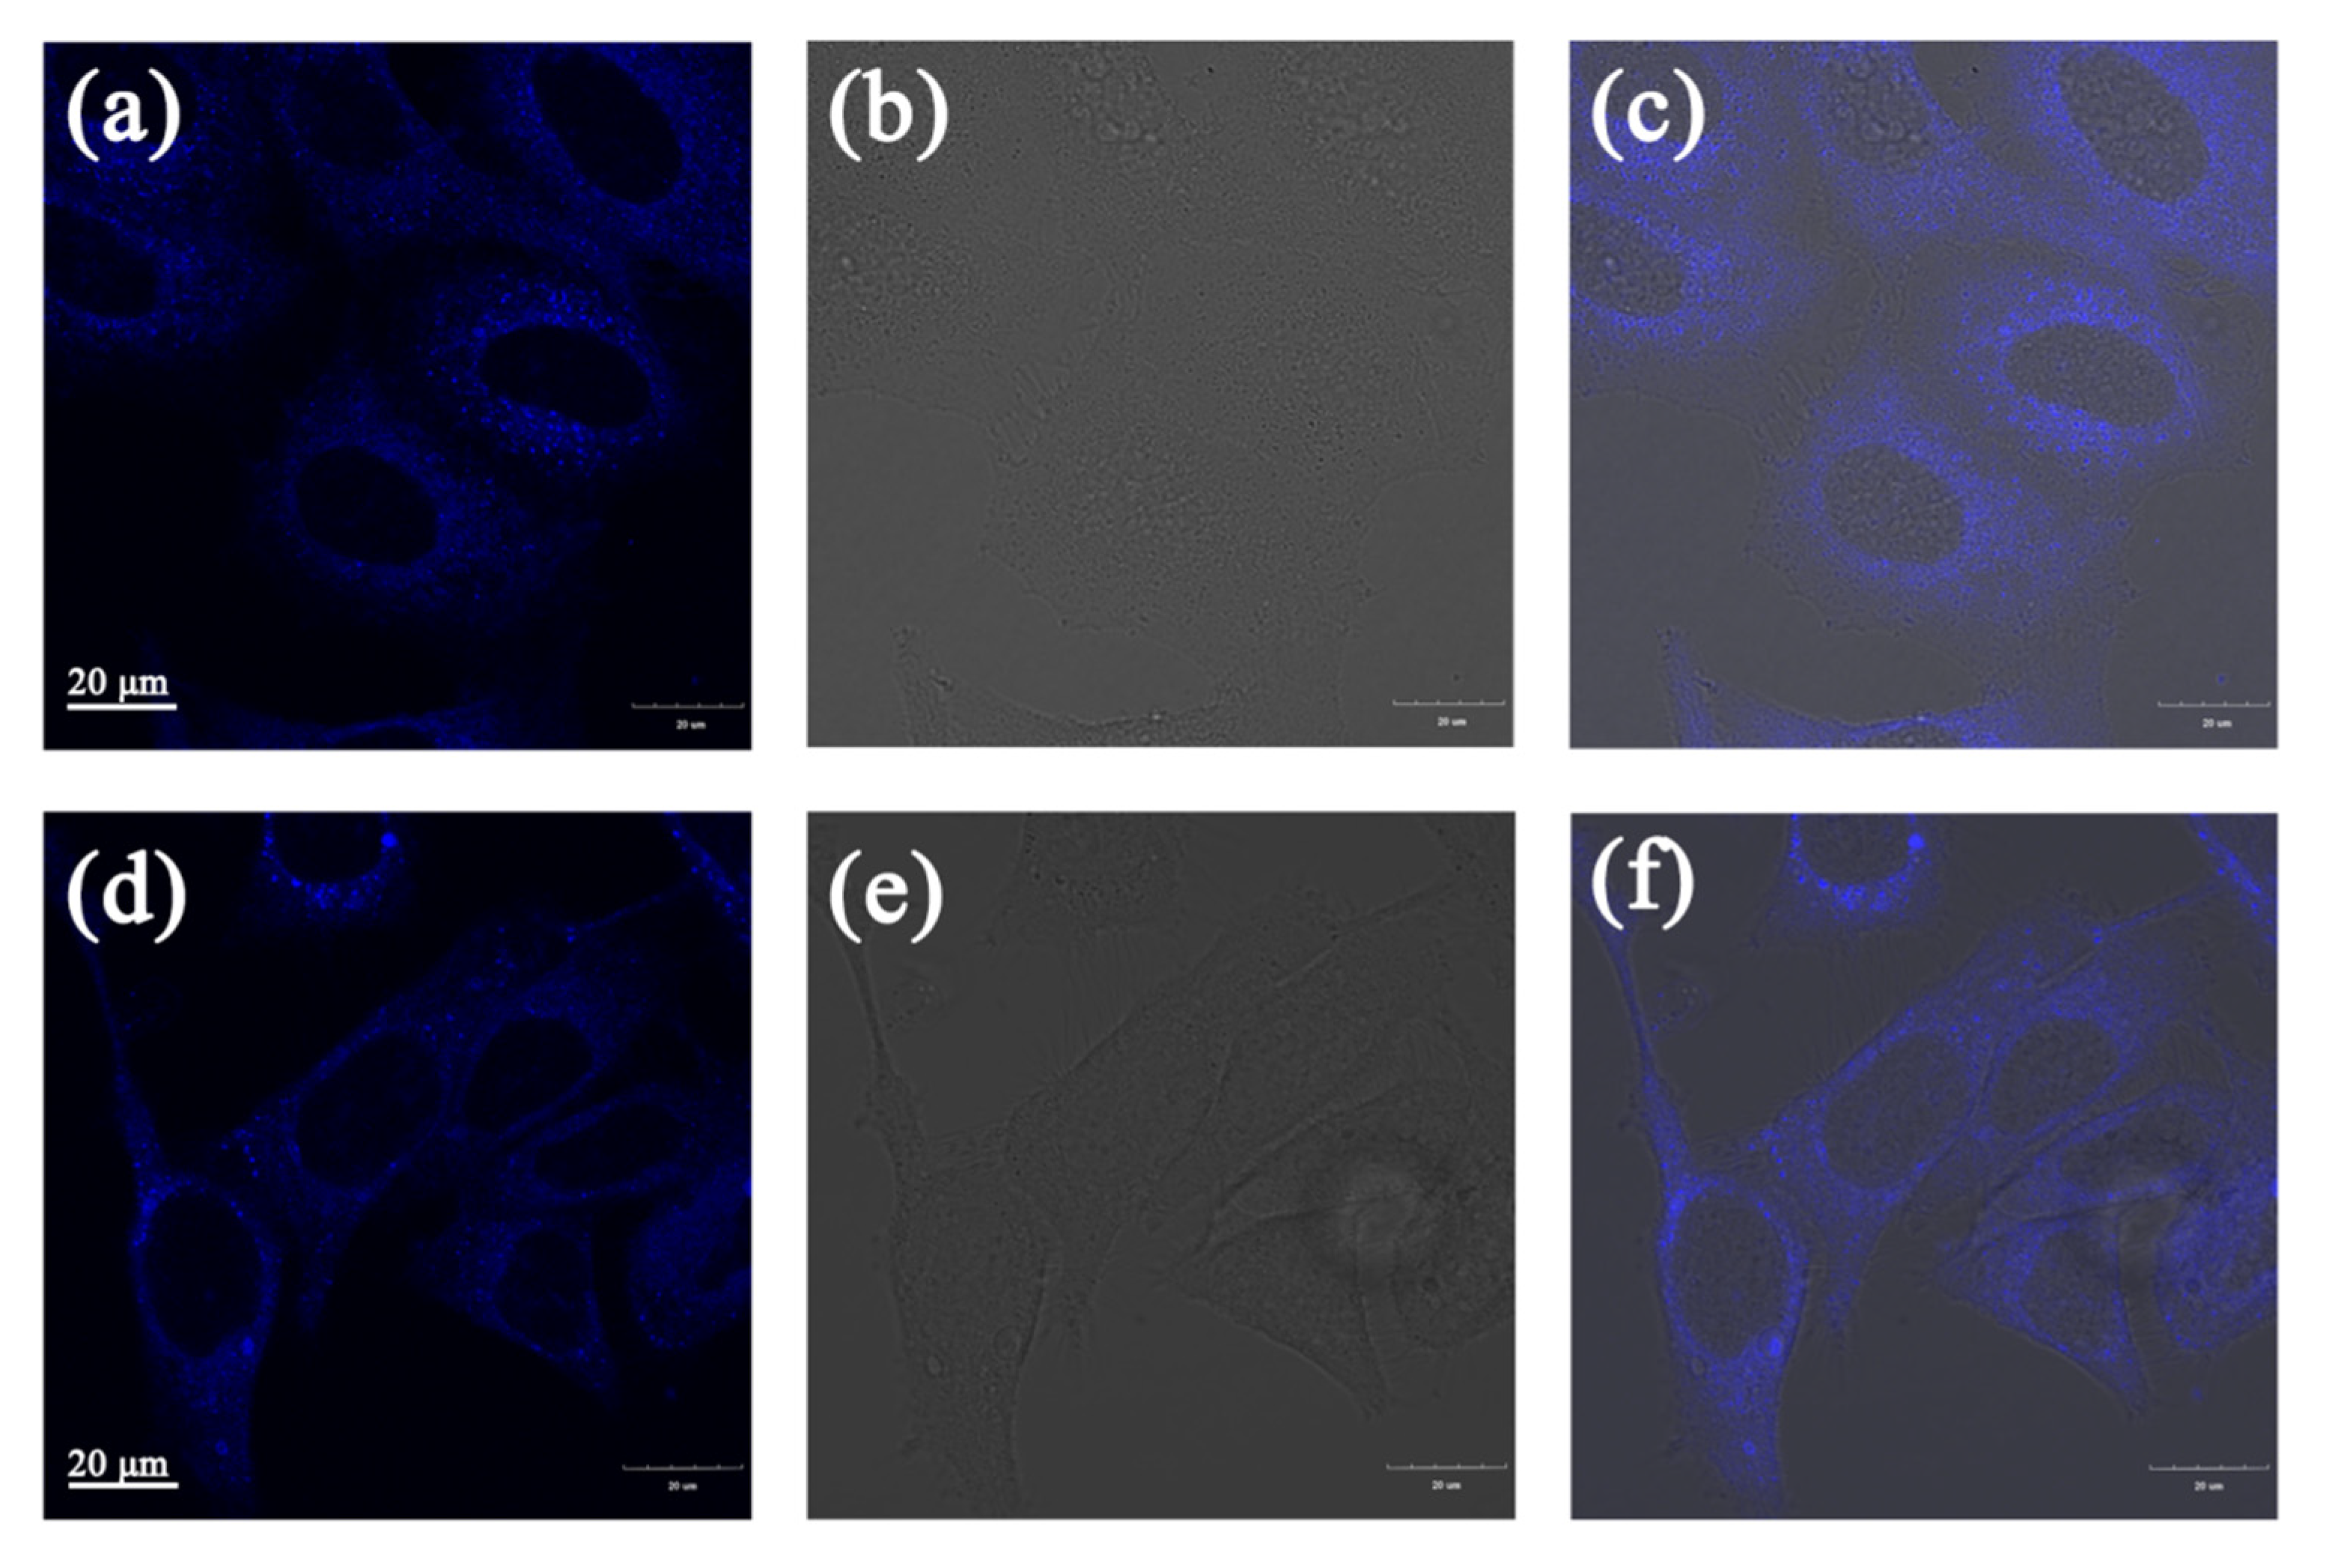
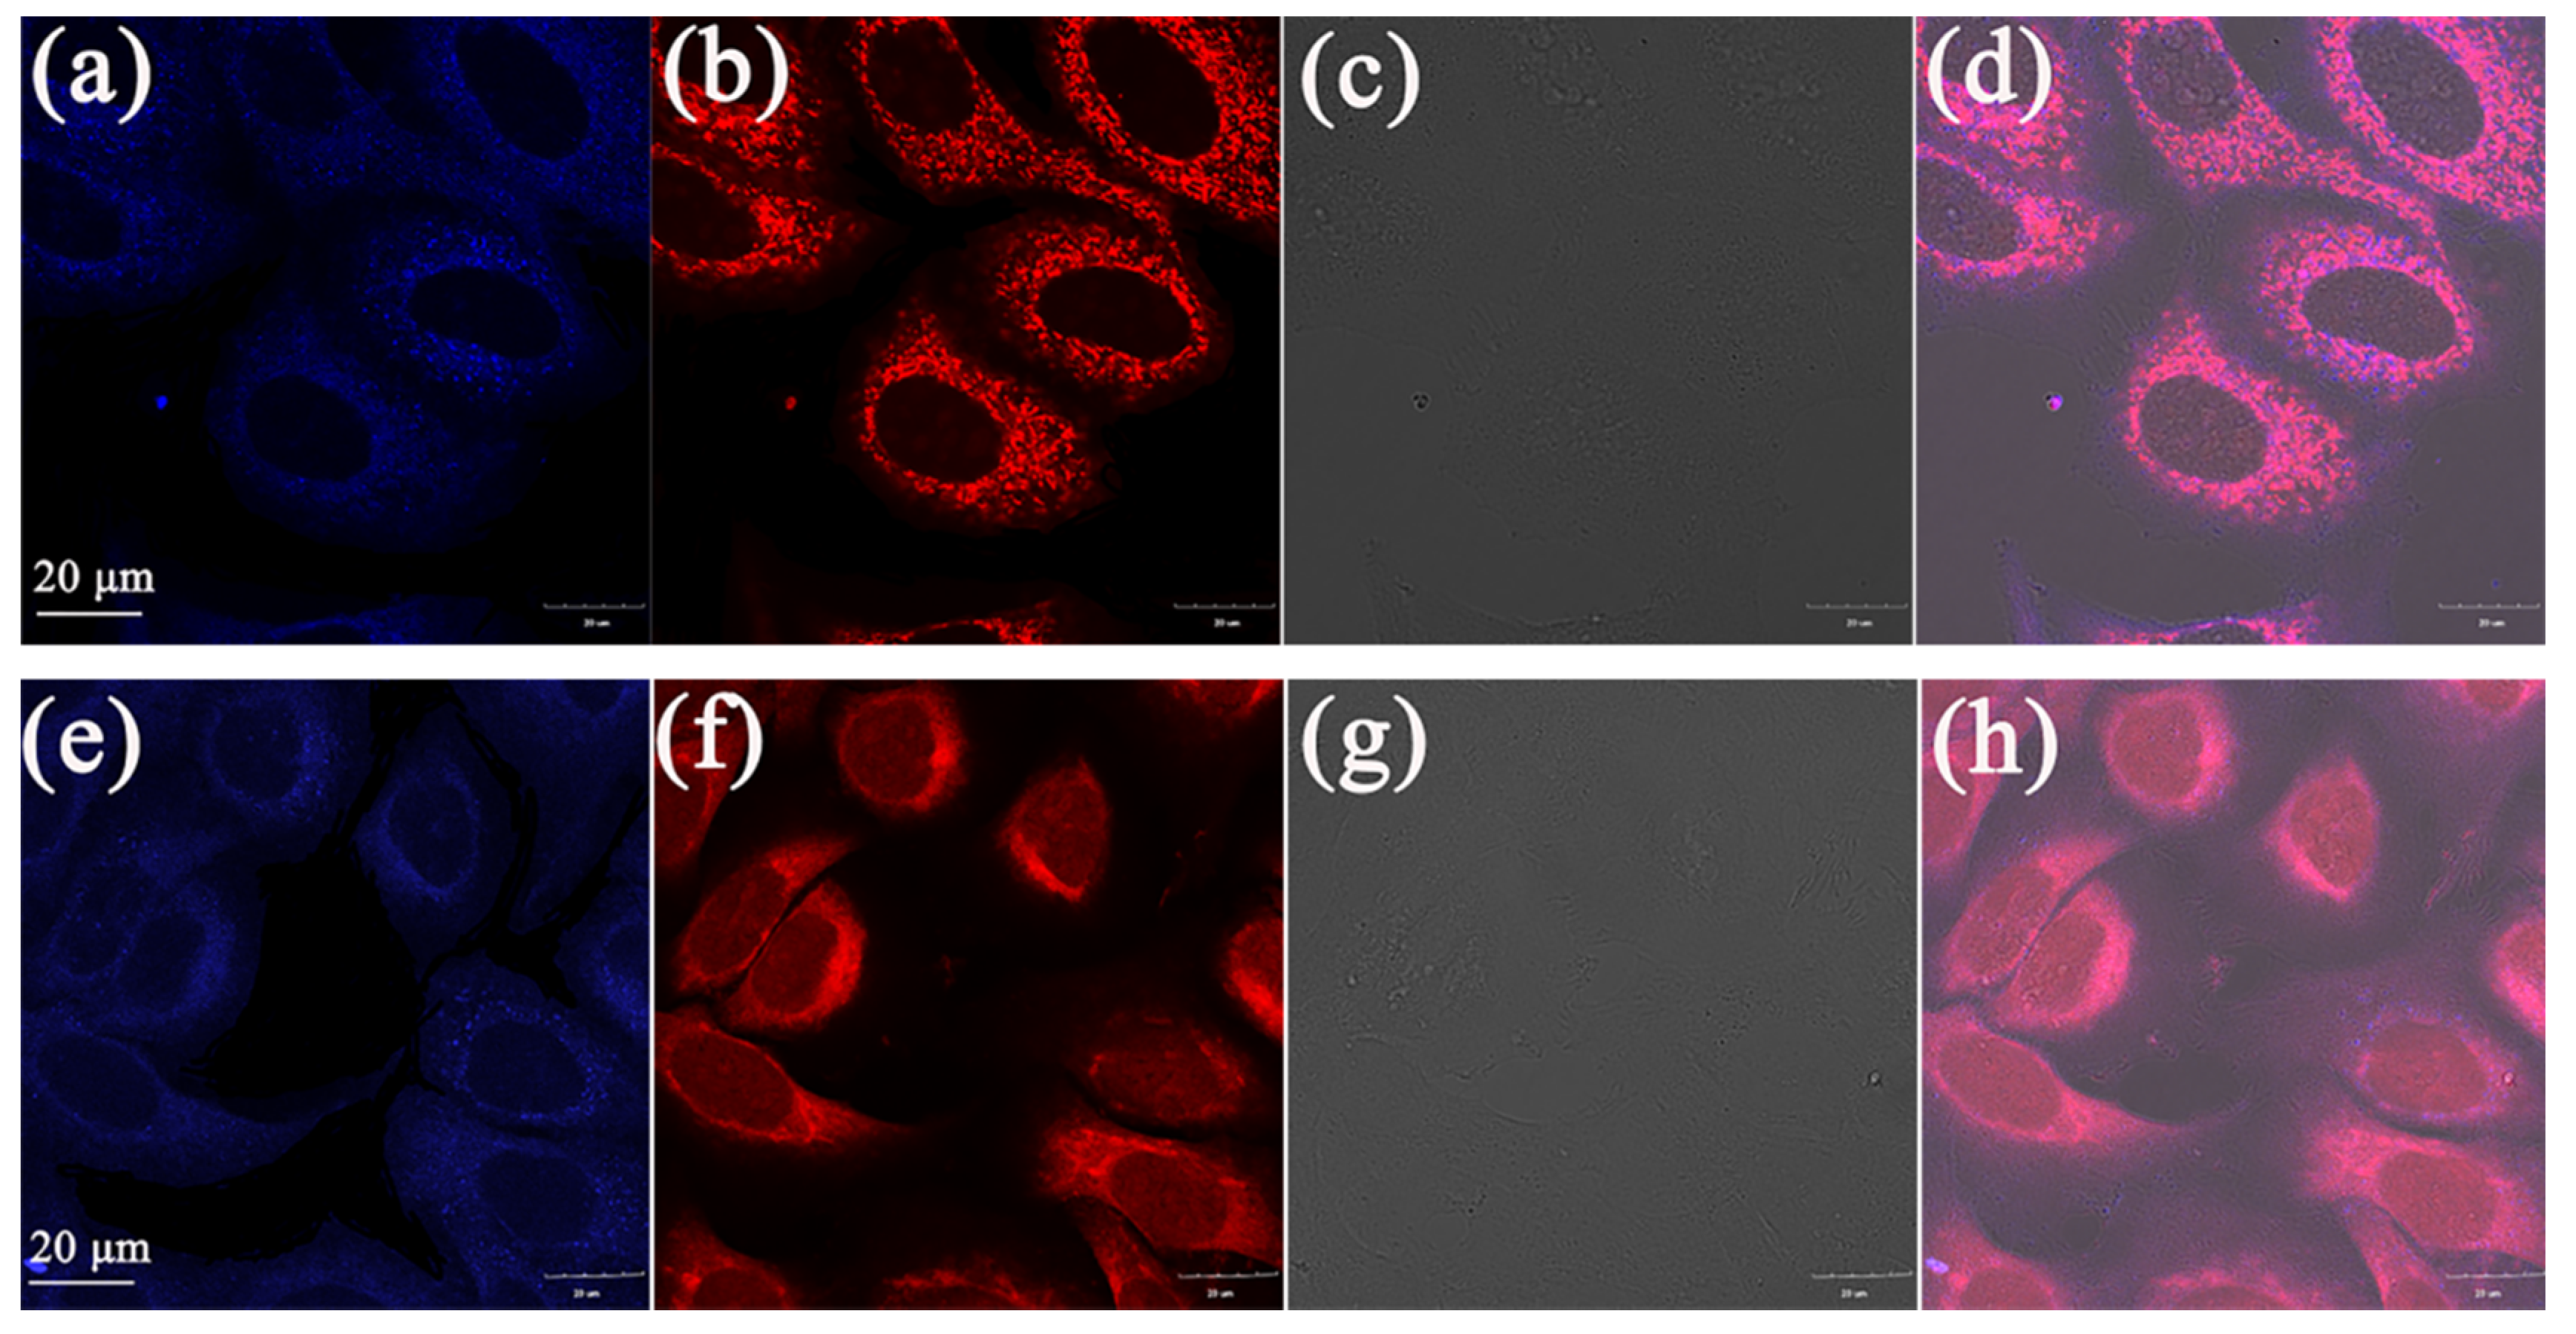
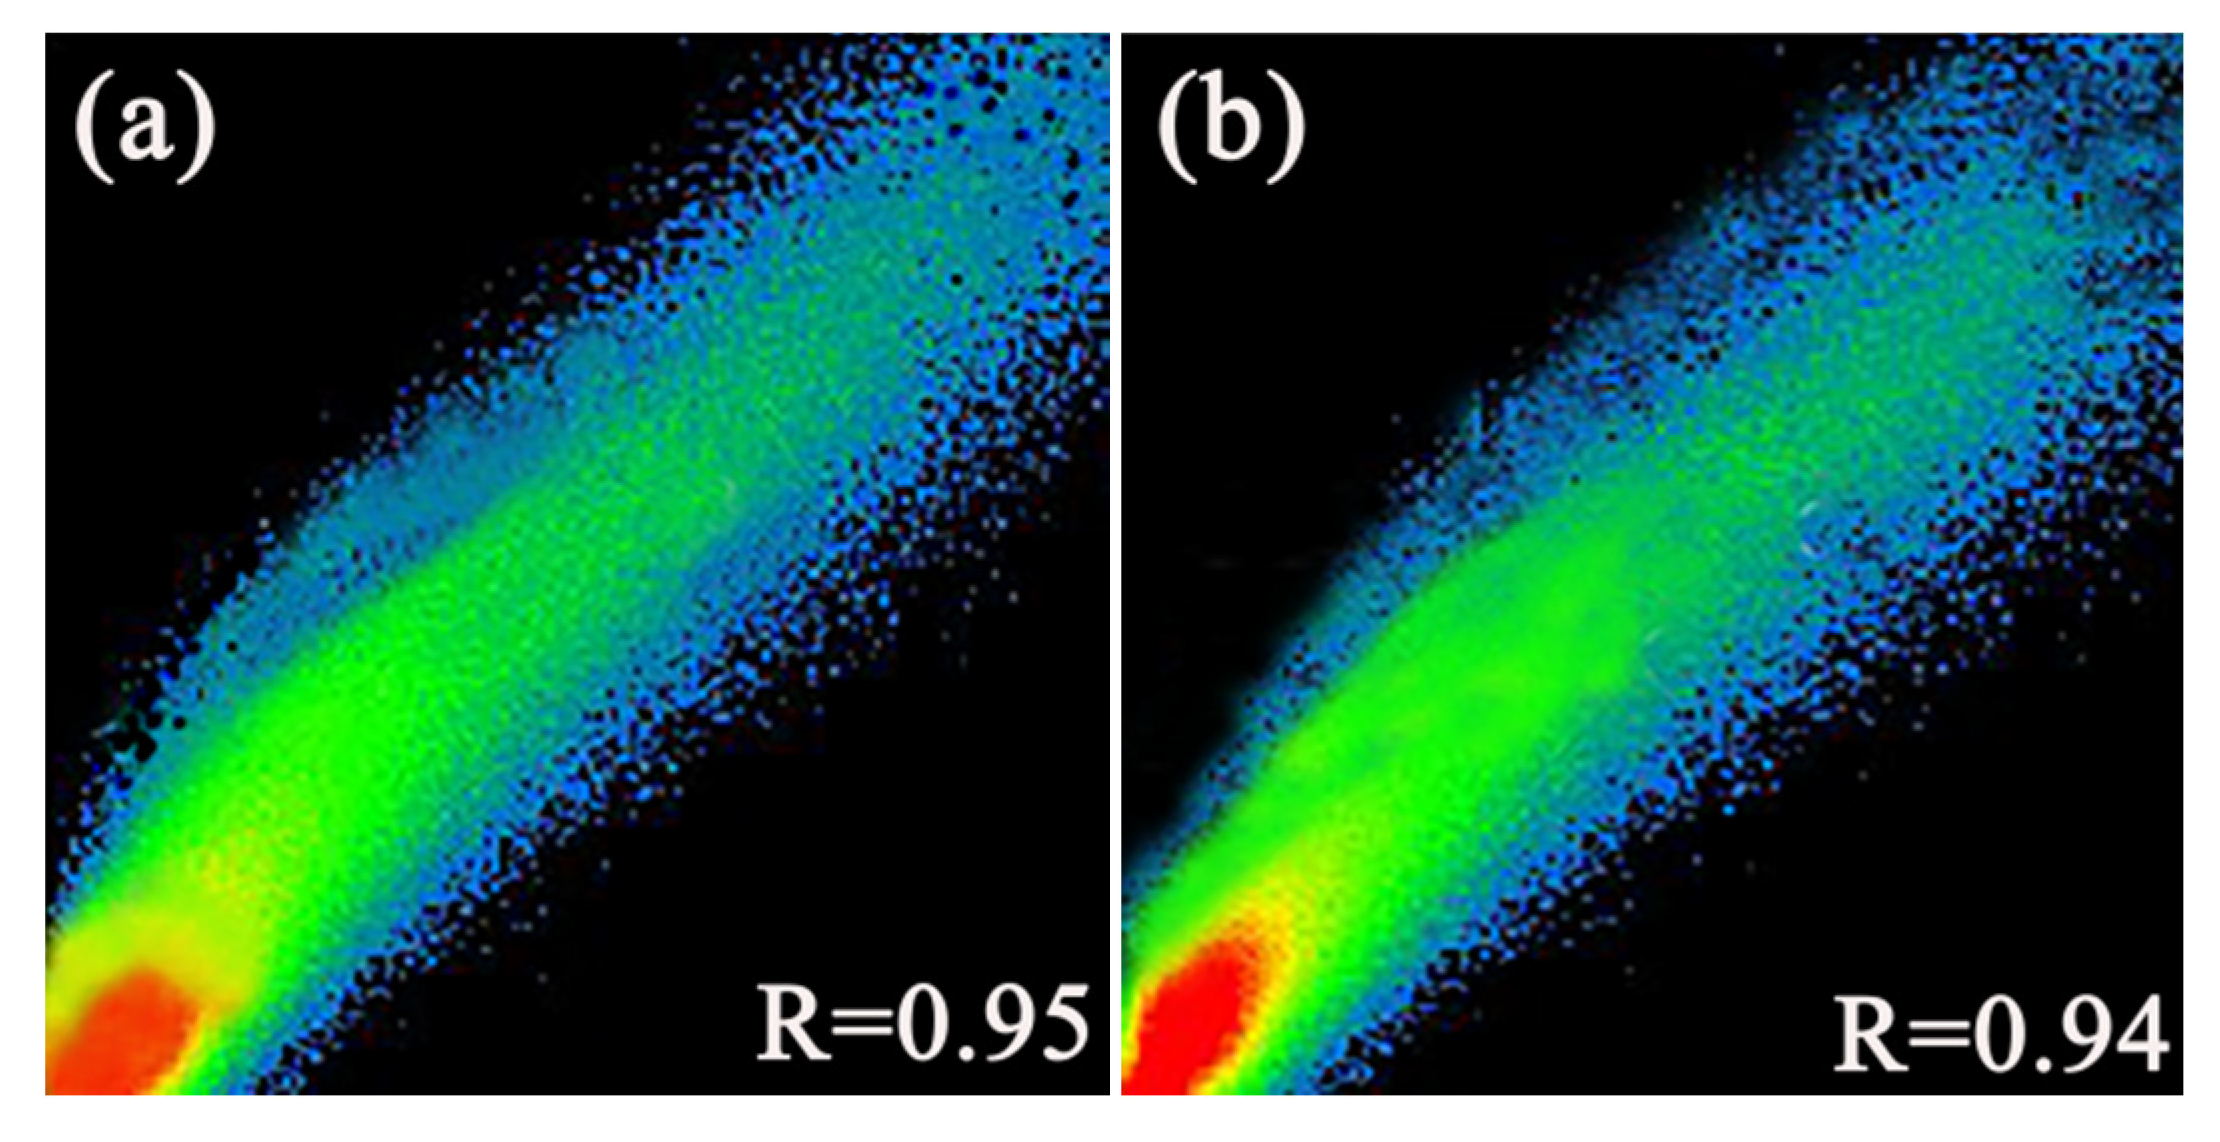
2.2. Cell Imaging
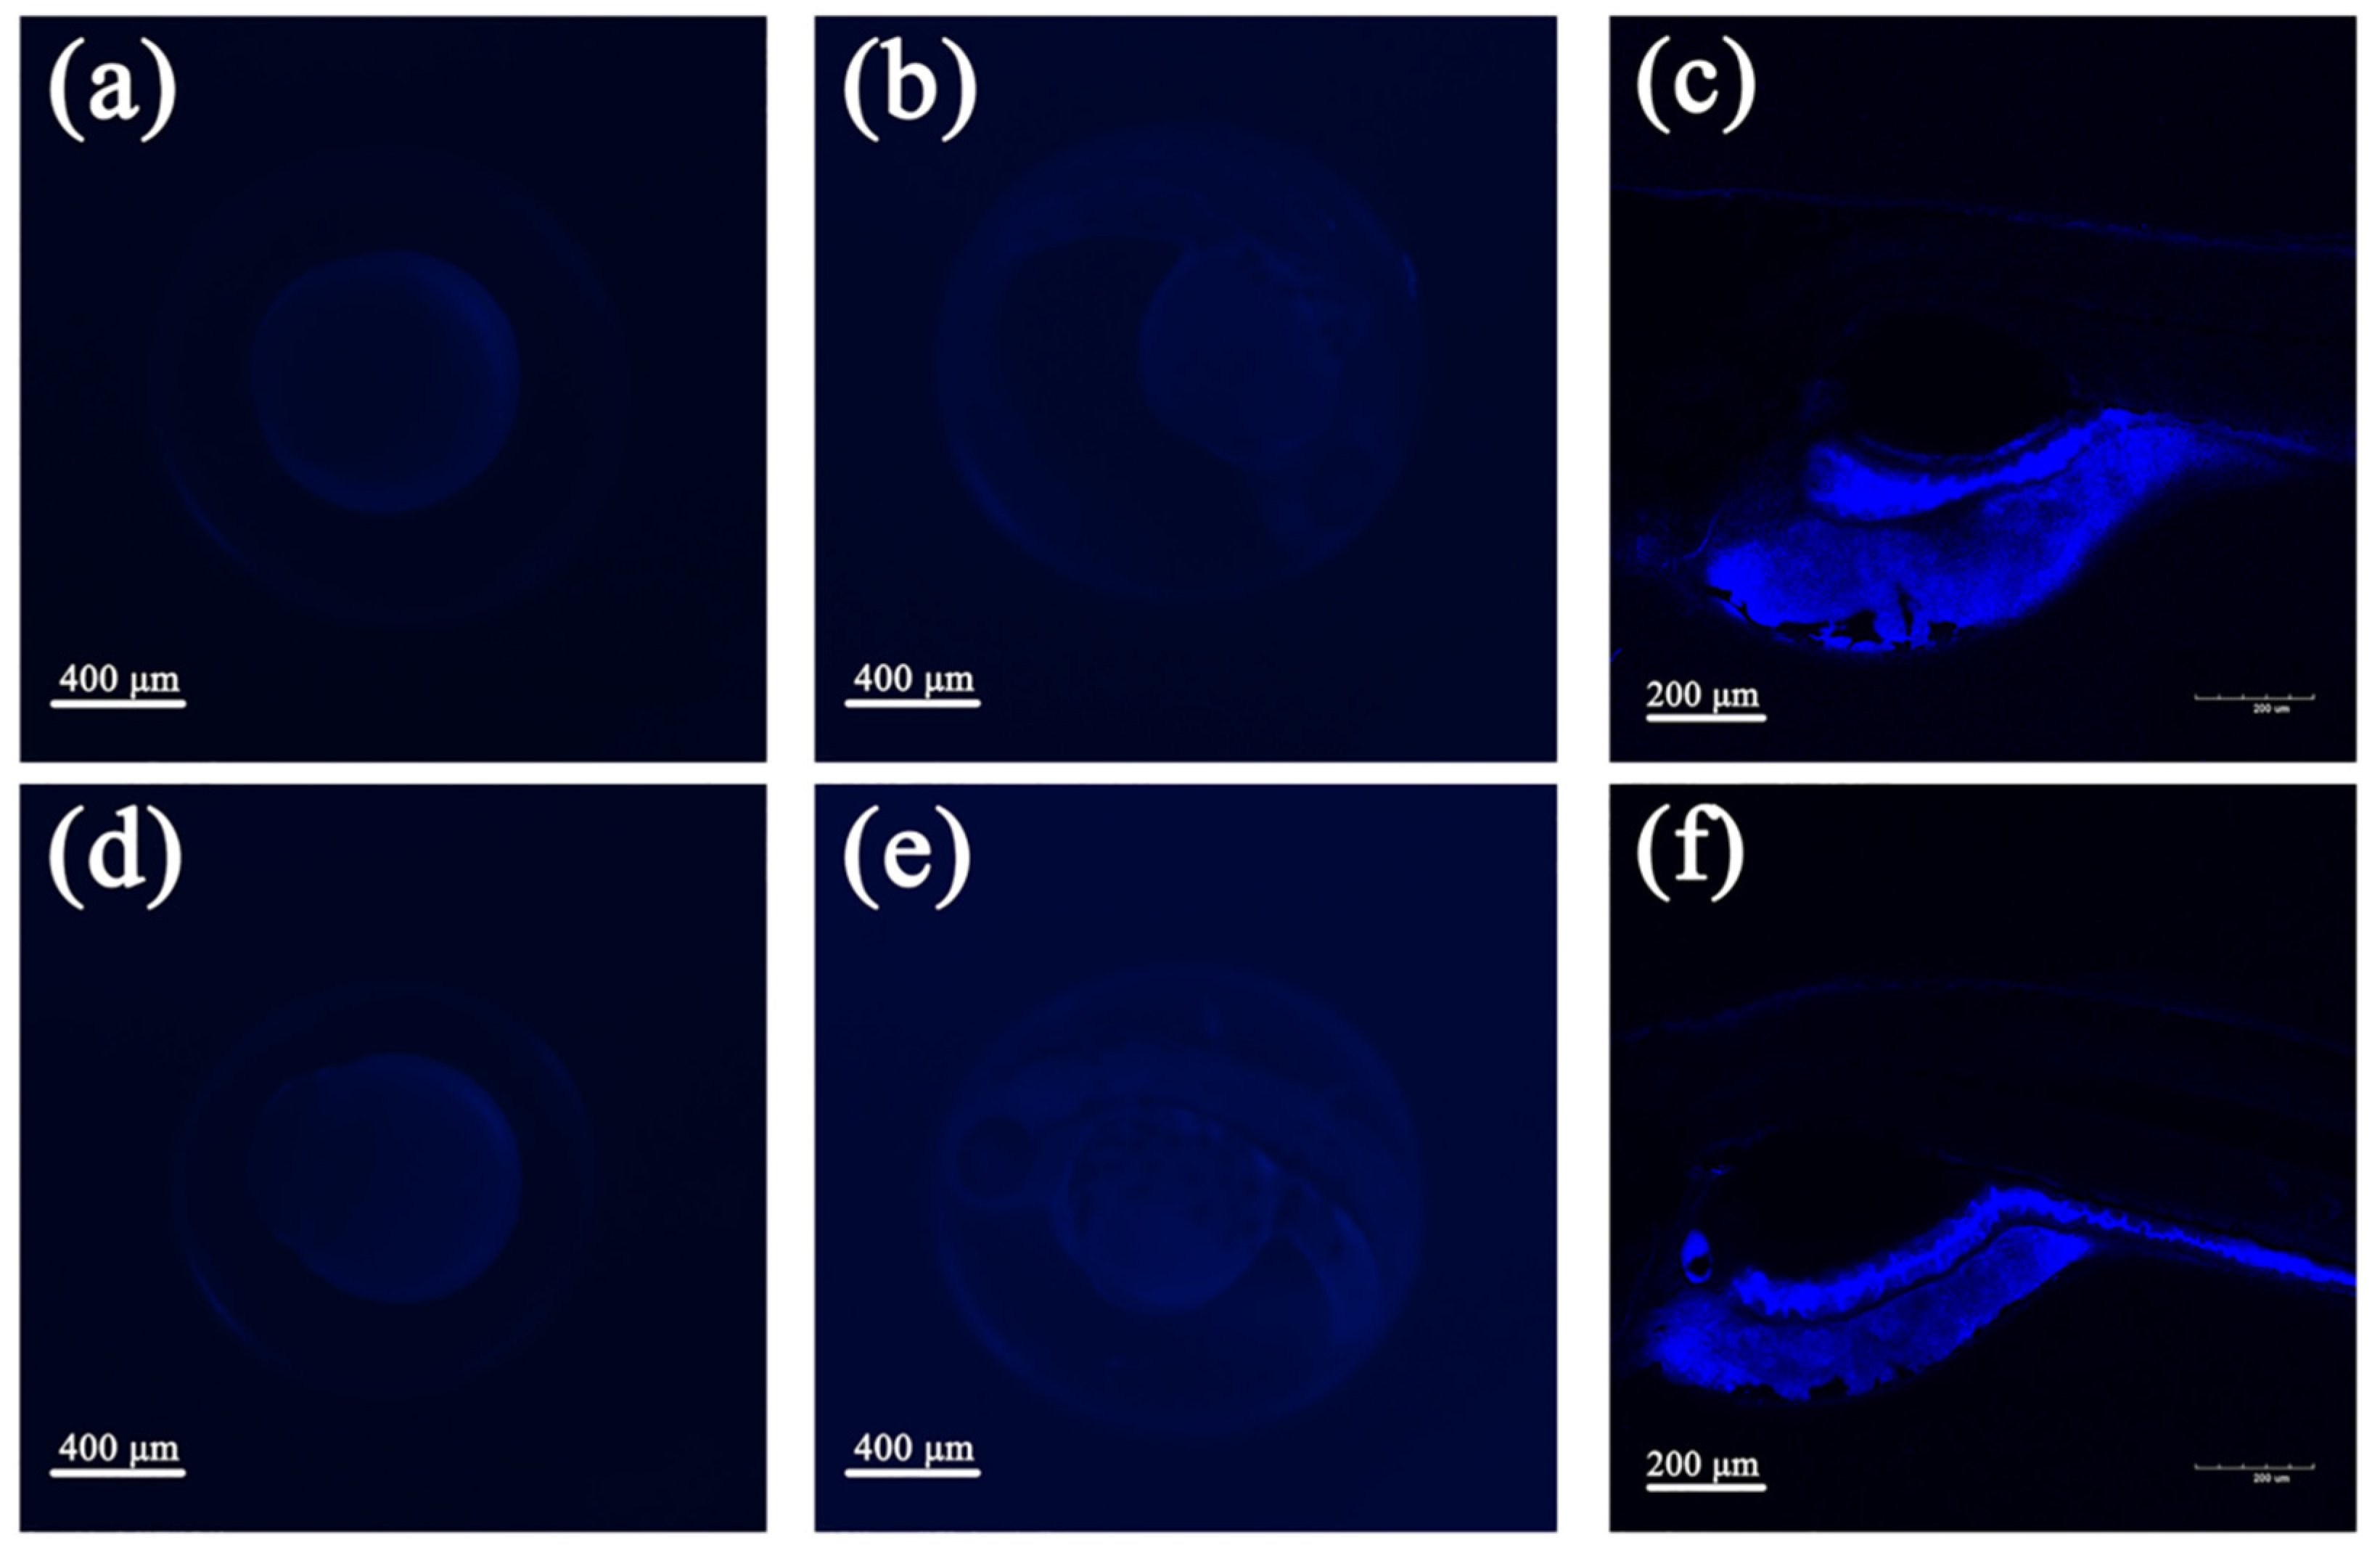
2.3. Zebrafish Imaging
3. Materials and Methods
3.1. Materials and Instruments
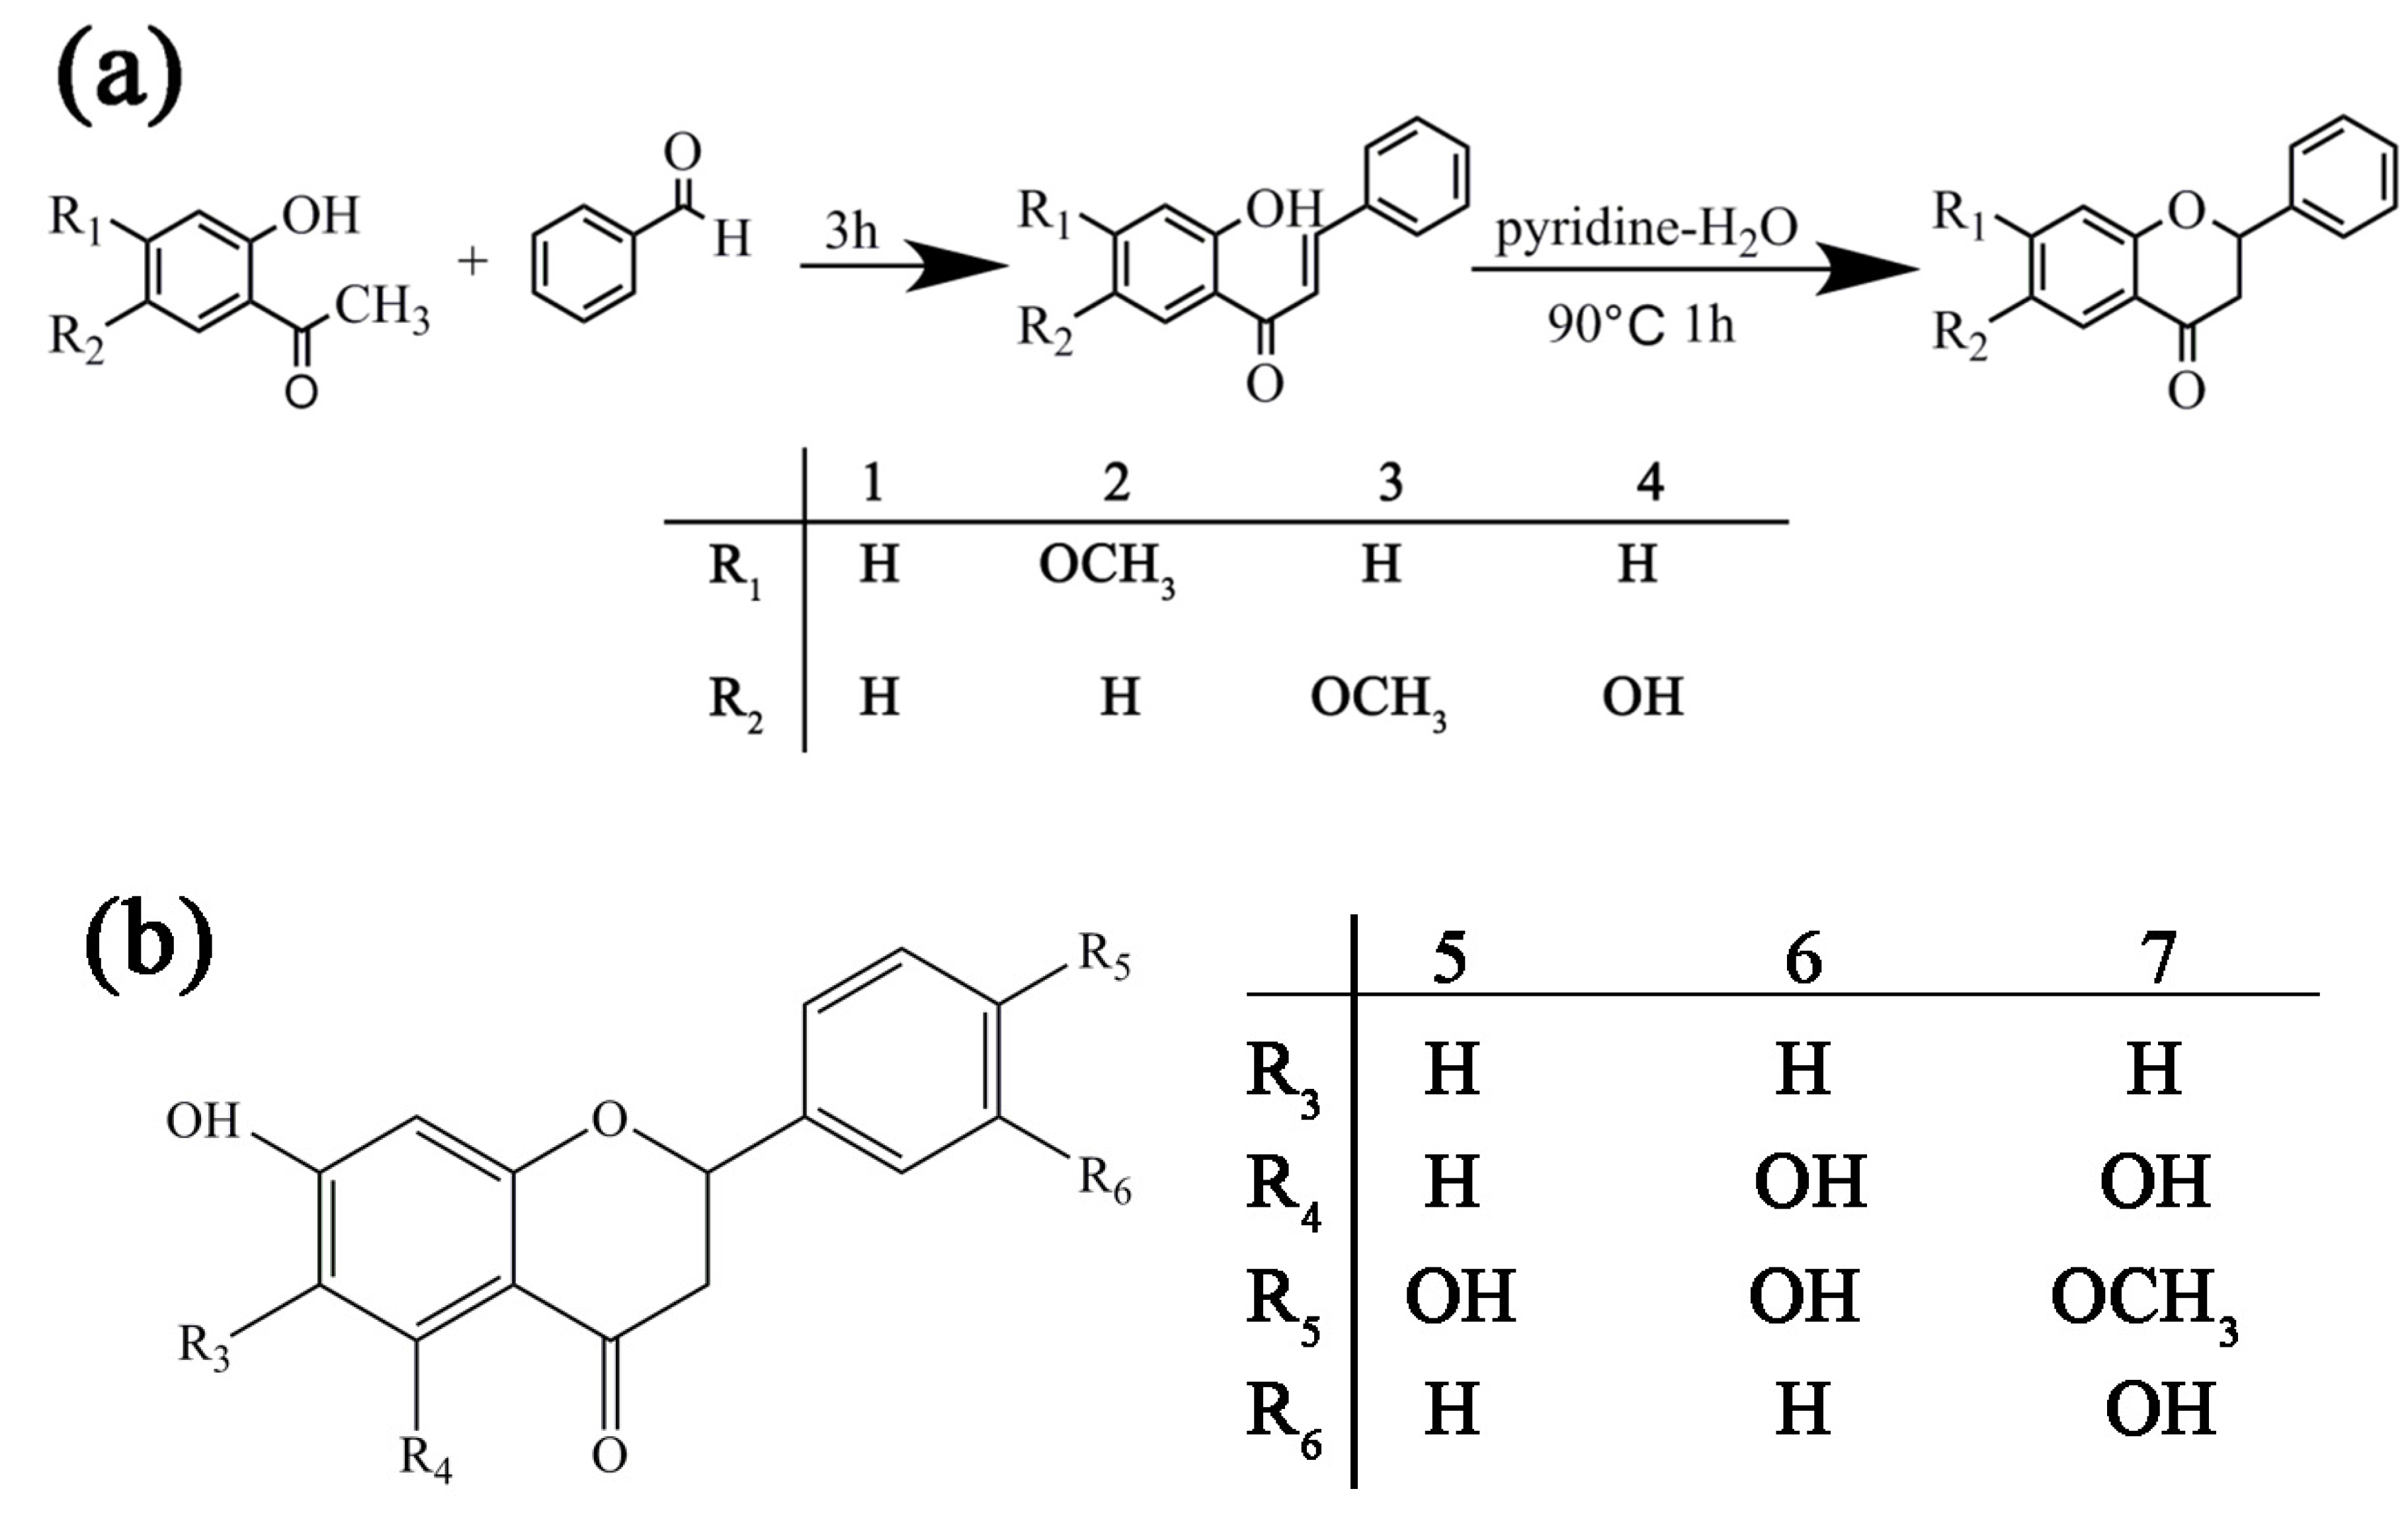
3.2. Synthesis of Flavanone Derivatives
3.2.1. Synthesis of Compound 1
3.2.2. Synthesis of Compound 2
3.2.3. Synthesis of Compound 3
3.2.4. Synthesis of Compound 4
3.3. Preparation for UV-Vis Spectra, PL Spectra, and SEM Measurements
3.3.1. Preparation for UV-Vis Spectra and PL Spectra
3.3.2. Preparation for SEM Measurements
3.4. Preparation for Ethylene Glycol (EG) Measurements
3.5. Cell Culture
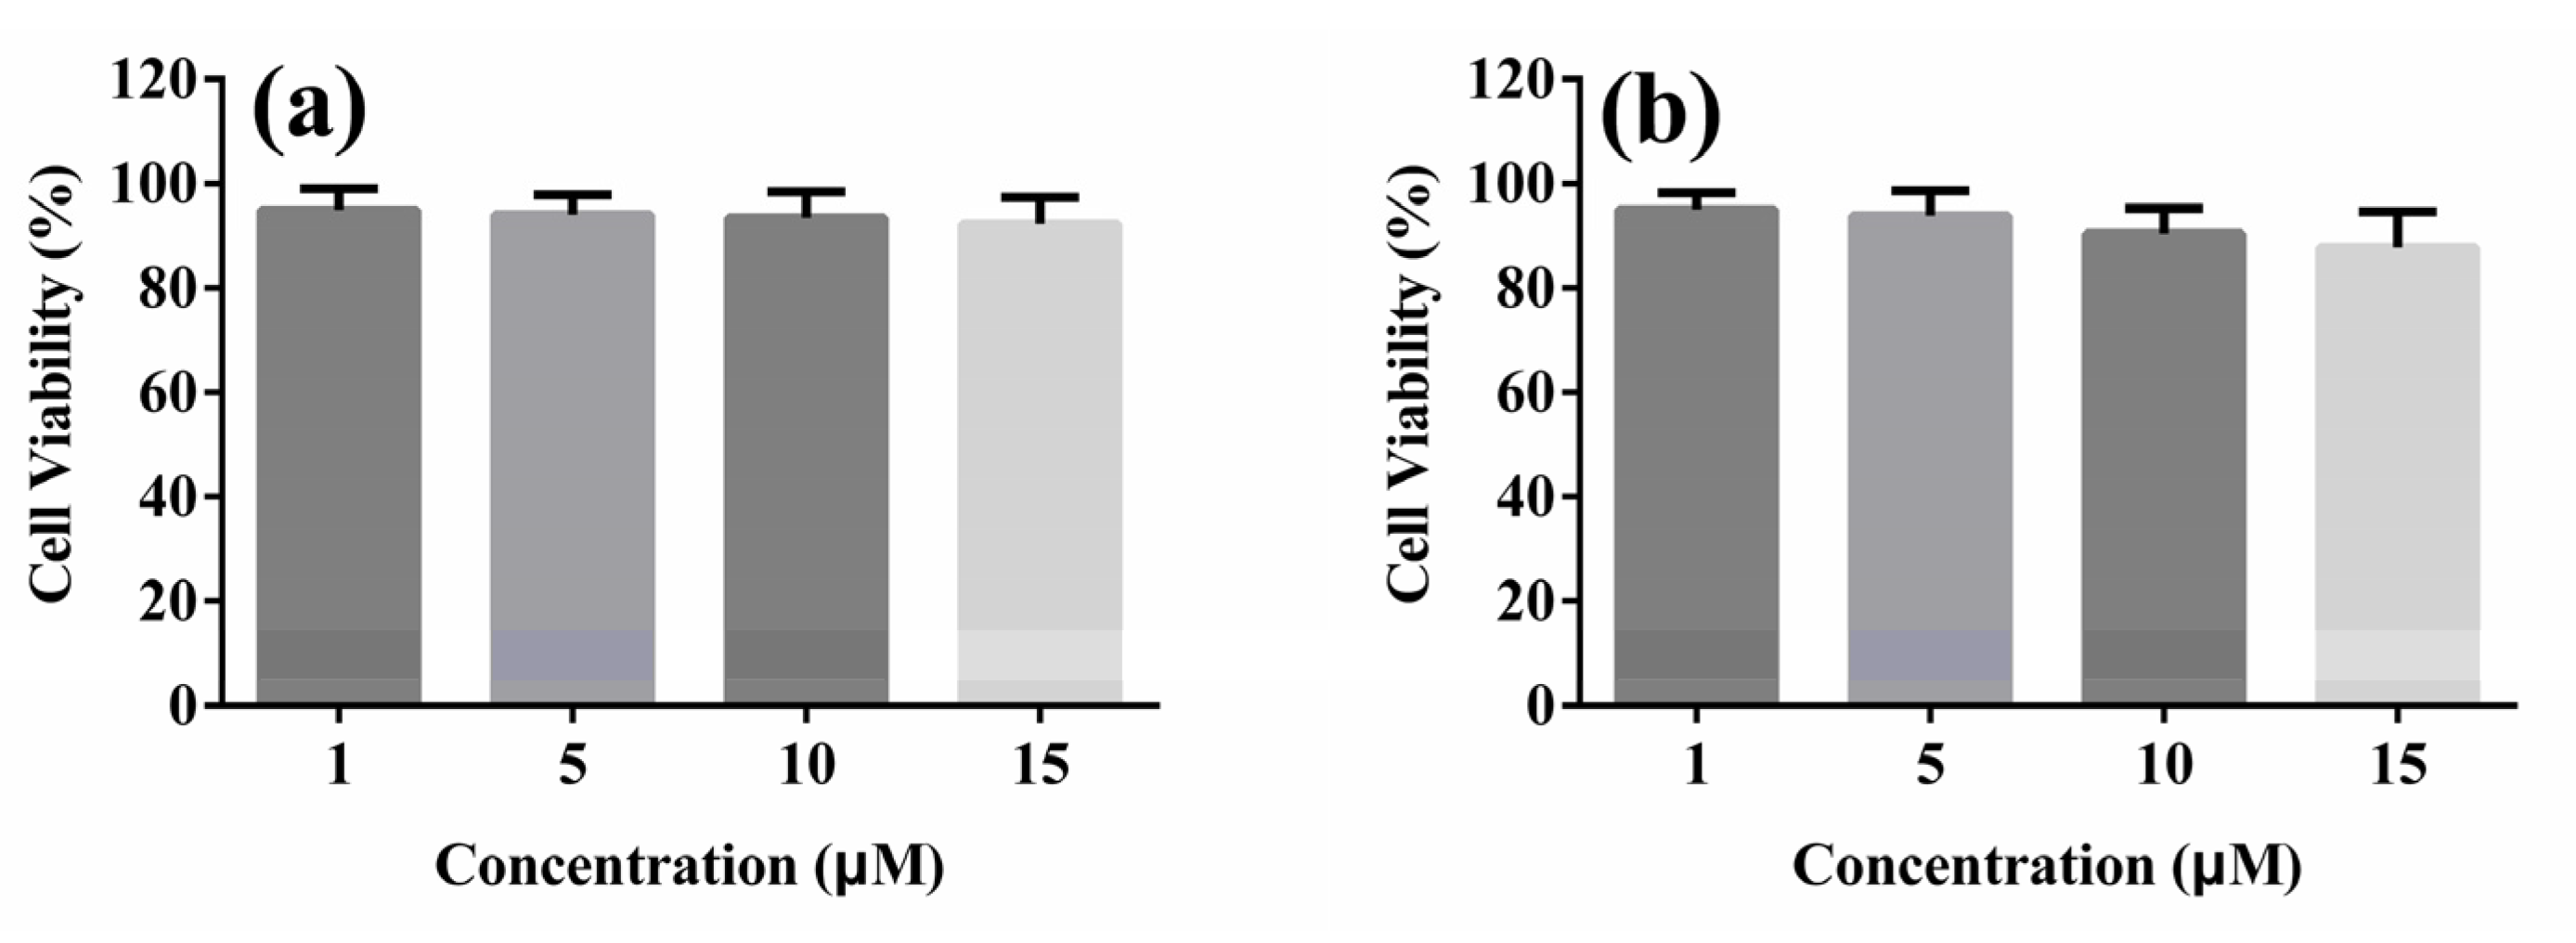
3.6. MTT Assay
3.7. Cell Imaging
3.8. Zebrafish Imaging
4. Conclusions
Supplementary Materials
Author Contributions
Funding
Conflicts of Interest
References
- Yuan, L.; Lin, W.; Zheng, K.; He, L.; Huang, W. Far-red to near infrared analyte-responsive fluorescent probes based on organic fluorophore platforms for fluorescence imaging. Chem. Soc. Rev. 2013, 42, 622–661. [Google Scholar] [CrossRef] [PubMed]
- Ueno, T.; Nagano, T. Fluorescent probes for sensing and imaging. Nat. Methods 2011, 8, 642–645. [Google Scholar] [CrossRef] [PubMed]
- Fan, J.; Hu, M.; Zhan, P.; Peng, X. Energy transfer cassettes based on organic fluorophores: Construction and applications in ratiometric sensing. Chem. Sov. Rev. 2013, 42, 29–43. [Google Scholar] [CrossRef]
- Yan, L.; Zhang, Y.; Xu, B.; Tian, W. Fluorescent nanoparticles based on AIE fluorogens for bioimaging. Nanoscale 2016, 8, 2471–2487. [Google Scholar] [CrossRef]
- Huang, X.; Li, Z.; Liu, Z.; Zeng, C.; Hu, L. A near-infrared fluorescent probe for endogenous hydrogen peroxide realtime imaging in living cells and zebrafish. Dyes Pigments 2019, 165, 518–523. [Google Scholar] [CrossRef]
- Svechkarev, D.; Mohs, A.M. Organic Fluorescent Dye-based Nanomaterials: Advances in the Rational Design for Imaging and Sensing Applications. Curr. Med. Chem. 2019, 26, 4042–4064. [Google Scholar] [CrossRef] [PubMed]
- Ma, X.; Sun, R.; Cheng, J.; Liu, J.; Gou, F.; Xiang, H.; Zhou, X. Fluorescence Aggregation-Caused Quenching versus Aggregation-Induced Emission: A Visual Teaching Technology for Undergraduate Chemistry Students. J. Chem. Educ. 2016, 93, 345–350. [Google Scholar] [CrossRef]
- Huang, Y.; Xing, J.; Gong, Q.; Chen, L.C.; Liu, G.; Yao, C.; Wang, Z.; Zhang, H.L.; Chen, Z.; Zhang, Q. Reducing aggregation caused quenching effect through co-assembly of PAH chromophores and molecular barriers. Nat. Commun. 2019, 10, 169. [Google Scholar] [CrossRef] [Green Version]
- Luo, J.; Xie, Z.; Lam, J.W.; Cheng, L.; Chen, H.; Qiu, C.; Kwok, H.S.; Zhan, X.; Liu, Y.; Zhu, D.; et al. Aggregation-induced emission of 1-methyl-1,2,3,4,5-pentaphenylsilole. Chem. Commun. 2001, 18, 1740–1741. [Google Scholar] [CrossRef] [PubMed]
- Dong, Y.; Lam, J.W.; Qin, A.; Li, Z.; Sun, J.; Dong, Y.; Tang, B.Z. Vapochromism and Crystallization-Enhanced Emission of 1,1-Disubstituted 2,3,4,5-Tetraphenylsiloles. J. Inorg. Organomet. Polym. 2007, 17, 673–678. [Google Scholar] [CrossRef]
- Mullin, J.L.; Tracy, H.J.; Ford, J.R.; Keenan, S.R.; Fridman, F. Characteristics of Aggregation Induced Emission in 1,1-Dimethyl-2,3,4,5-tetraphenyl and 1,1,2,3,4,5-Hexaphenyl Siloles and Germoles. J. Inorg. Organomet. Polym. 2007, 17, 201–213. [Google Scholar] [CrossRef]
- Tong, H.; Dong, Y.; Häußler, M.; Lam, J.W.; Sung, H.H.; Williams, I.D.; Sun, J.; Tang, B.Z. Tunable aggregation-induced emission of diphenyldibenzofulvenes. Chem. Commun. 2006, 10, 1133–1135. [Google Scholar] [CrossRef] [PubMed] [Green Version]
- Tong, H.; Häußler, M.; Dong, Y.Q.; Li, Z.; Mi, B.X.; Kwok, H.S.; Tang, B.Z. Aggregation-Induced Emission of 4-Dicyanomethylene-2,6-distyryl-4H-pyran. J. Chin. Chem. Soc. 2006, 53, 243–246. [Google Scholar] [CrossRef]
- Tong, H.; Dong, Y.; Häußler, M.; Li, Z.; Mi, B.; Kwok, H.S.; Tang, B.Z. Novel Linear and Cyclic Polyenes with Dramatic Aggregation-Induced Enhancements in Photoresponsiveness. Mol. Cryst. Liq. Cryst. 2006, 446, 183–191. [Google Scholar] [CrossRef]
- Hong, Y.; Lam, J.W.; Tang, B.Z. Aggregation-induced emission: Phenomenon, mechanism and applications. Chem. Commun. 2009, 29, 4332–4353. [Google Scholar] [CrossRef]
- Zhang, S.; Qin, A.J.; Sun, J.Z.; Tang, B.Z. Mechanism Study of Aggregation-Induced Emission. Prog. Chem. 2011, 23, 623–636. [Google Scholar]
- Song, P.; Xiang, Y.; Wei, R.R.; Tong, A. A fluorescent chemosensor for Cu2+ detection in solution based on aggregation-induced emission and its application in fabricating Cu2+ test papers. J. Lumin. 2014, 153, 215–220. [Google Scholar] [CrossRef]
- Huang, Y.; Zhang, P.; Gao, M.; Zeng, F.; Qin, A.; Wu, S.; Tang, B.Z. Ratiometric detection and imaging of endogenous hypochlorite in live cells and in vivo achieved by using an aggregation induced emission (AIE)-based nanoprobe. Chem. Commun. 2016, 52, 7288–7291. [Google Scholar] [CrossRef]
- Hu, J.; He, Z.; Wang, Z.; Li, X.; You, J.; Gao, G. A simple approach to aggregation-induced emission in difluoroboron dibenzoylmethane derivatives. Tetrahedron Lett. 2013, 54, 4167–4170. [Google Scholar] [CrossRef]
- Soufeena, P.P.; Nibila, T.A.; Aravindakshan, K.K. Coumarin based yellow emissive AIEE active probe: A colorimetric sensor for Cu2+ and fluorescent sensor for picric acid. Spectrochim. Acta A Mol. Biomol. Spectrosc. 2019, 223, 117201. [Google Scholar] [CrossRef] [PubMed]
- Tsuji, P.A.; Stephenson, K.K.; Wade, K.L.; Liu, H.; Fahey, J.W. Structure-Activity Analysis of Flavonoids: Direct and Indirect Antioxidant, and Antiinflammatory Potencies and Toxicities. Nutr. Cancer 2013, 65, 1014–1025. [Google Scholar] [CrossRef] [PubMed]
- Panche, A.N.; Diwan, A.D.; Chandra, S.R. Flavonoids: An overview. J. Nutr. Sci. 2016, 5, e47. [Google Scholar] [CrossRef] [PubMed] [Green Version]
- Wang, T.Y.; Li, Q.; Bi, K.S. Bioactive flavonoids in medicinal plants: Structure, activity and biological fate. Asian J. Pharm. Sci. 2018, 13, 12–23. [Google Scholar] [CrossRef]
- Castañeda-Ovando, A.; Pacheco-Hernández, M.; Páez-Hernández, M.; Rodríguez, J.; Galán-Vidal, C. Chemical studies of anthocyanins: A review. Food Chem. 2009, 113, 859–871. [Google Scholar] [CrossRef]
- Liu, L.; Lei, Y.; Zhang, J.; Li, N.; Zhang, F.; Wang, H.; He, F. Rational Design for Multicolor Flavone-Based Fluorophores with Aggregation-Induced Emission Enhancement Characteristics and Applications in Mitochondria-Imaging. Molecules 2018, 23, 2290. [Google Scholar] [CrossRef] [Green Version]
- Mei, J.; Leung, N.L.; Kwok, R.T.; Lam, J.W.; Tang, B.Z. Aggregation-Induced Emission: Together We Shine, United We Soar! Chem. Rev. 2015, 115, 11718–11940. [Google Scholar] [CrossRef]
- Niu, C.; Zhao, L.; Fang, T.; Deng, X.; Ma, H.; Zhang, J.; Na, N.; Han, J.; Ouyang, J. Color- and morphology-controlled self-assembly of new electron-donor-substituted aggregation-induced emission compounds. Langmuir 2014, 30, 2351–2359. [Google Scholar] [CrossRef]
- MacRae, C.; Peterson, R. Zebrafish as tools for drug discovery. Nat. Rev. Drug Discov. 2015, 14, 721–731. [Google Scholar] [CrossRef]
- Kang, Y.F.; Li, Y.H.; Fang, Y.W.; Xu, Y.; Wei, X.M.; Yin, X.B. Carbon Quantum Dots for Zebrafish Fluorescence Imaging. Sci. Rep. 2015, 5, 11835. [Google Scholar] [CrossRef]
- Li, Y.; Chen, T.; Miao, X.; Yi, X.; Wang, X.; Zhao, H.; Simon, M.-Y.L.; Zheng, Y. Zebrafish: A promising in vivo model for assessing the delivery of natural products, fluorescence dyes and drugs across the blood-brain barrier. Pharmacol. Res. 2017, 125, 246–257. [Google Scholar] [CrossRef]
- Chen, C.; Vijay, N.; Thirumalaivasan, N.; Velmathi, S.; Wu, S. Coumarin-based Hg2+ fluorescent probe: Fluorescence turn-on detection for Hg2+ bioimaging in living cells and zebrafish. Spectrochim. Acta. A. Mol. Biomol. Spectrosc. 2019, 219, 135–140. [Google Scholar] [CrossRef] [PubMed]
Sample Availability: Samples of the compounds 1–4 are available from the authors. |


| Compound | Solvents | Quantum Yields (φF) | Time/ns |
|---|---|---|---|
| CH3OH | 0.02 | 2.12 | |
| 1 | CH3OH/H2O (5:5) | 0.07 | 2.26 |
| CH3OH/H2O (1:9) | 0.13 | 2.98 | |
| CH3OH | 0.10 | 2.67 | |
| 2 | CH3OH/H2O (5:5) | 0.17 | 3.16 |
| CH3OH/H2O (1:9) | 0.21 | 3.24 |
© 2020 by the authors. Licensee MDPI, Basel, Switzerland. This article is an open access article distributed under the terms and conditions of the Creative Commons Attribution (CC BY) license (http://creativecommons.org/licenses/by/4.0/).
Share and Cite
Li, N.; Liu, L.; Luo, H.; Wang, H.; Yang, D.; He, F. Flavanone-Based Fluorophores with Aggregation-Induced Emission Enhancement Characteristics for Mitochondria-Imaging and Zebrafish-Imaging. Molecules 2020, 25, 3298. https://doi.org/10.3390/molecules25143298
Li N, Liu L, Luo H, Wang H, Yang D, He F. Flavanone-Based Fluorophores with Aggregation-Induced Emission Enhancement Characteristics for Mitochondria-Imaging and Zebrafish-Imaging. Molecules. 2020; 25(14):3298. https://doi.org/10.3390/molecules25143298
Chicago/Turabian StyleLi, Na, Liyan Liu, Huiqing Luo, Huaqiao Wang, Depo Yang, and Feng He. 2020. "Flavanone-Based Fluorophores with Aggregation-Induced Emission Enhancement Characteristics for Mitochondria-Imaging and Zebrafish-Imaging" Molecules 25, no. 14: 3298. https://doi.org/10.3390/molecules25143298