
Delivery of Alpha-Mangostin Using Cyclodextrins through a Biological Membrane: Molecular Dynamics Simulation

 ,
,
Abstract
:
1. Introduction
2. Results and Discussion
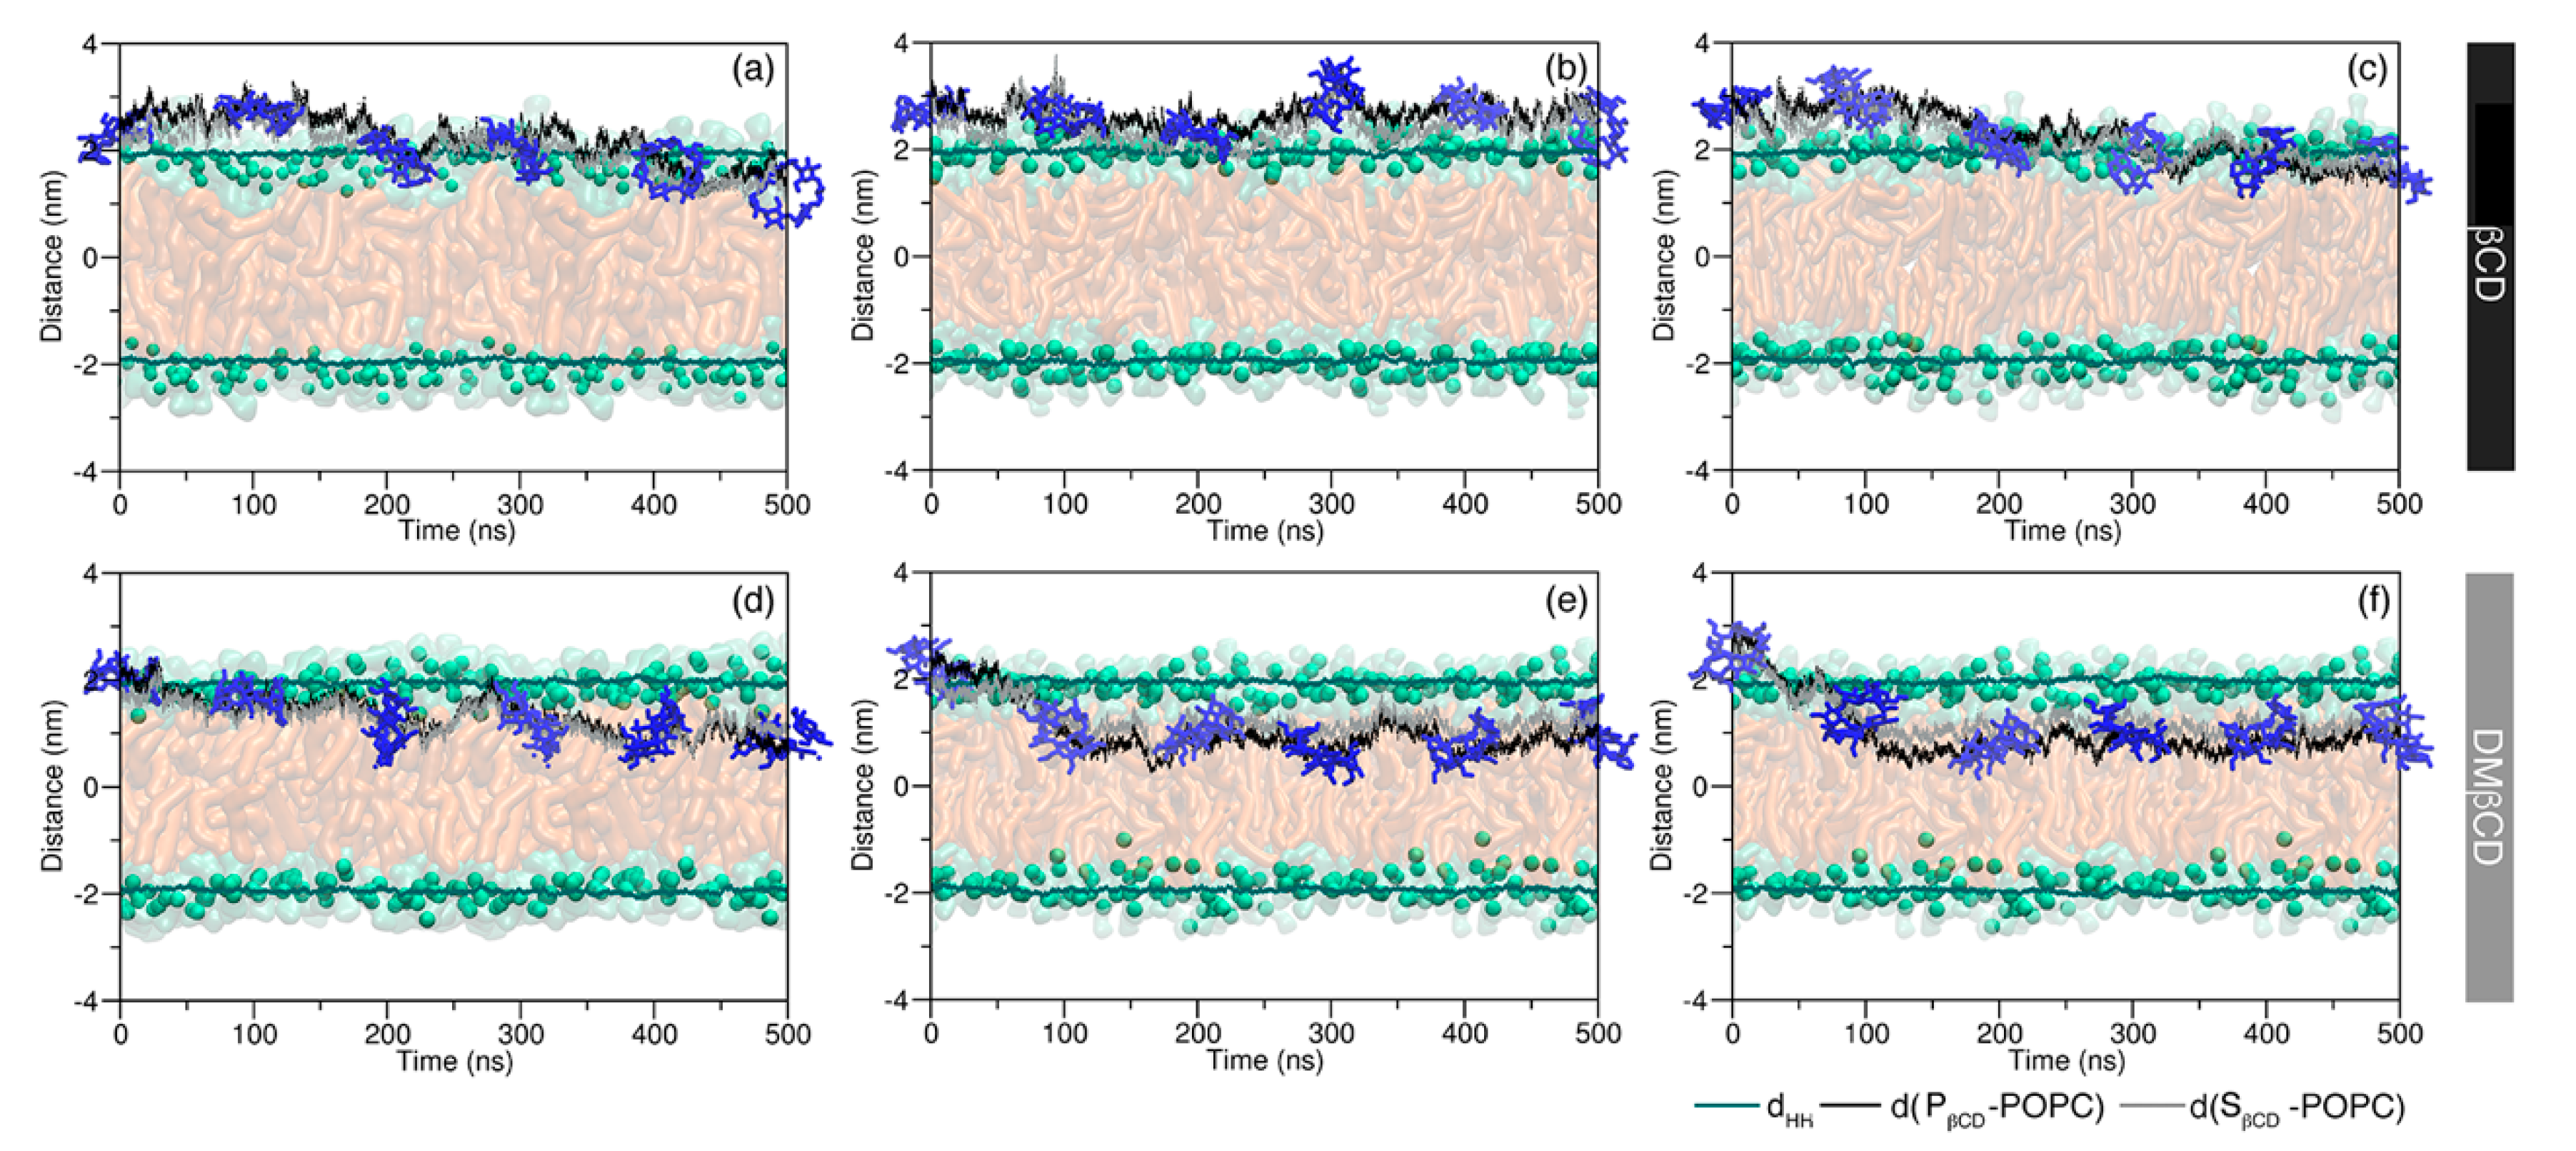
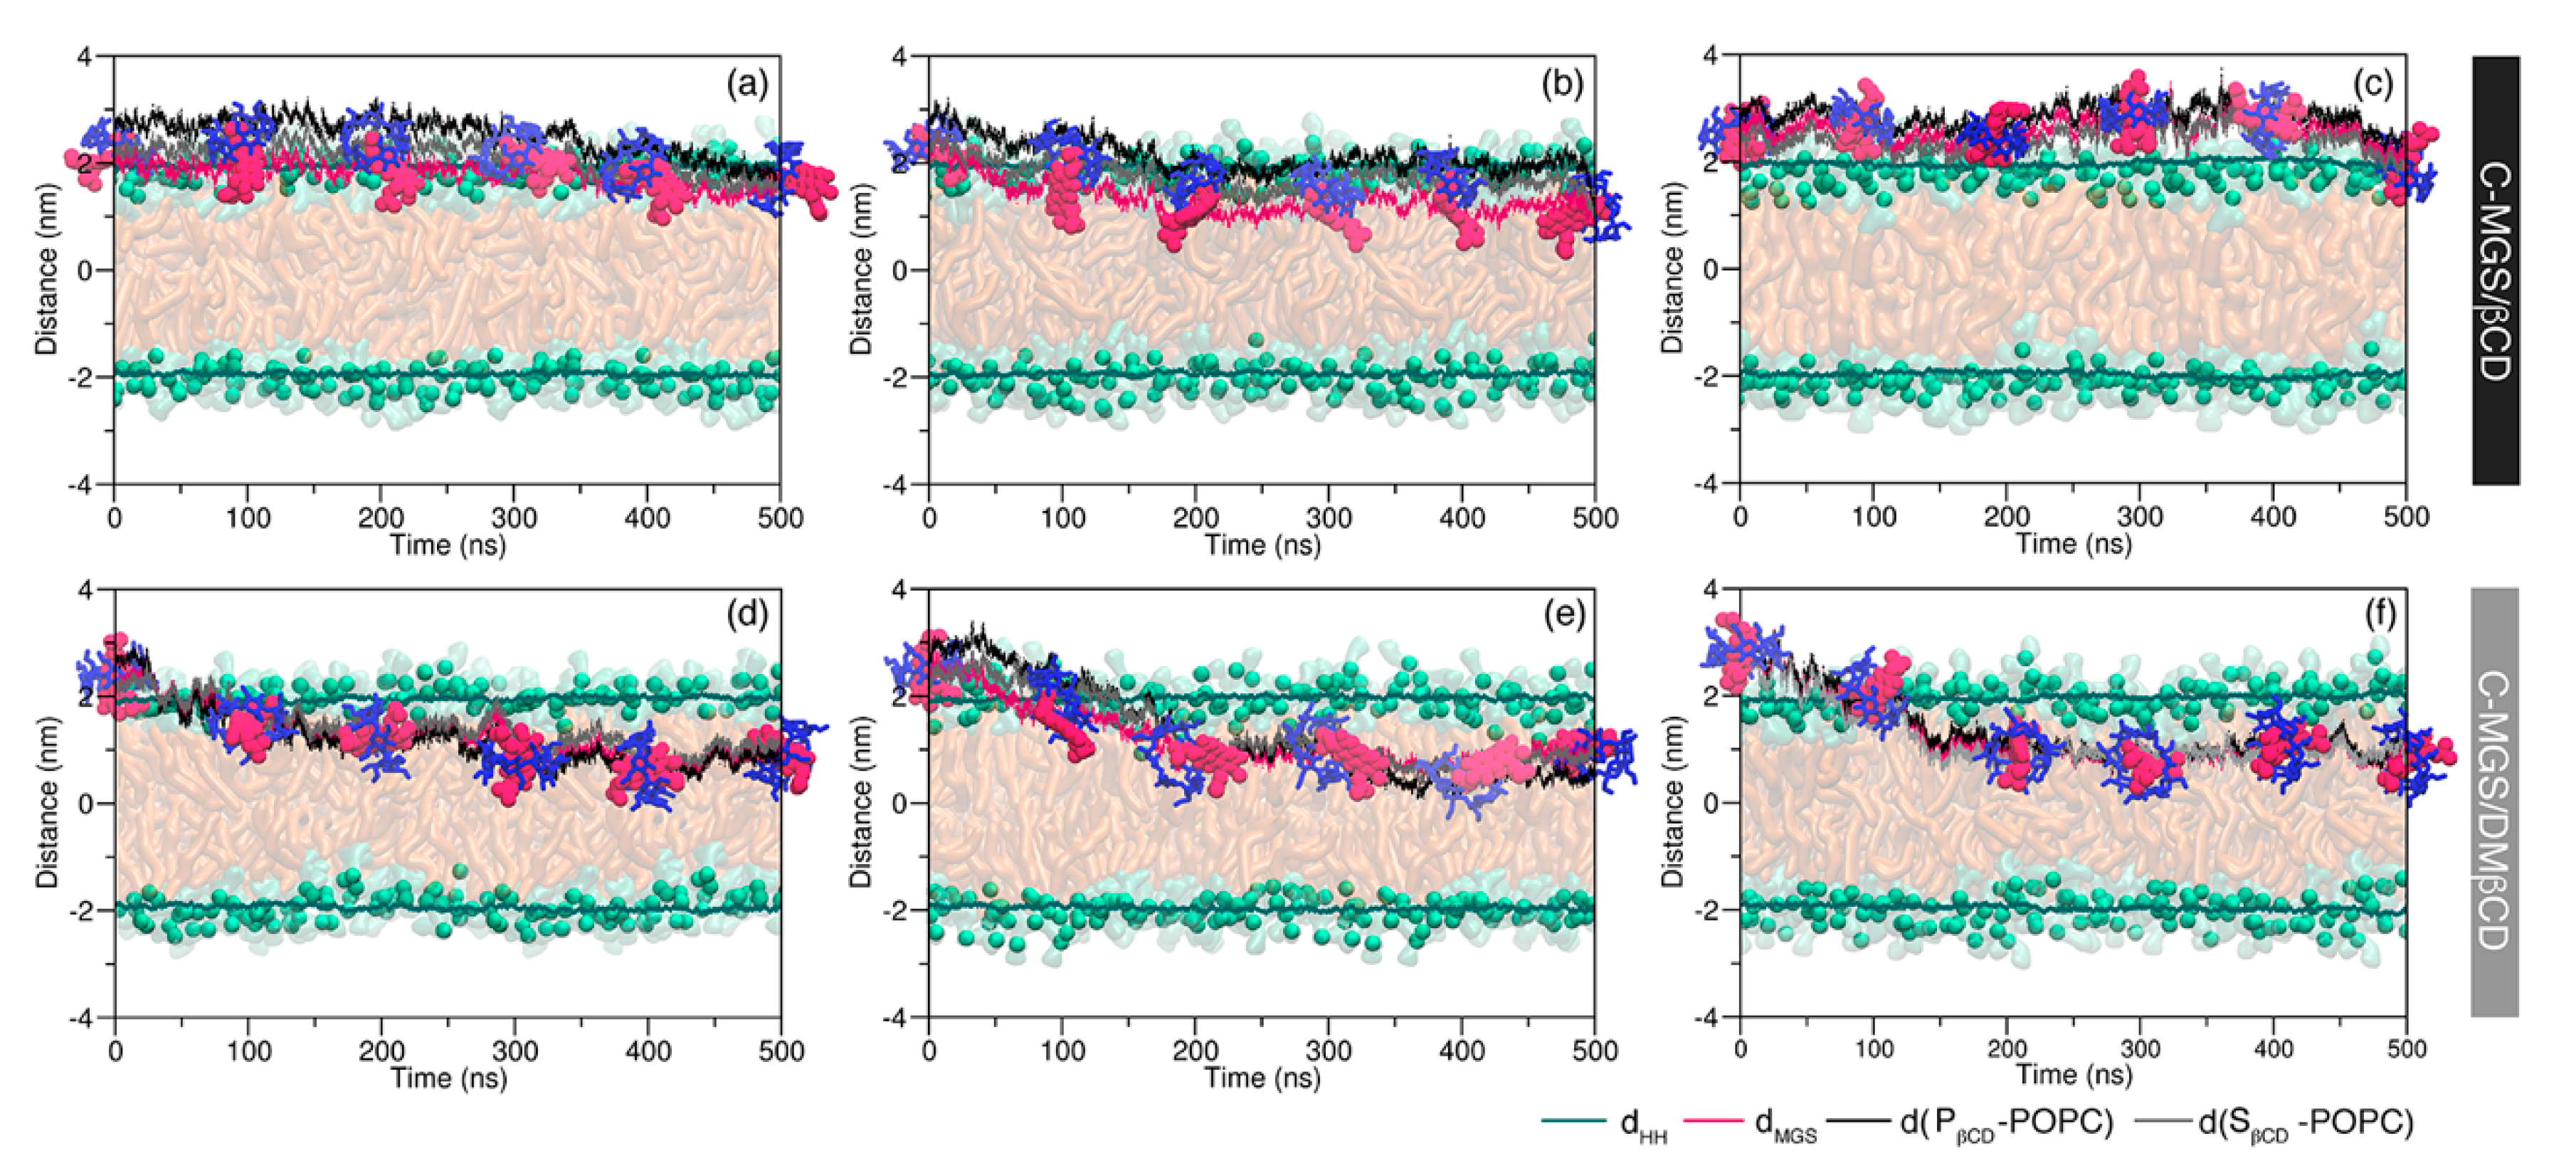
2.1. Permeability of MGS, βCDs, and MGS/βCDs on the POPC Membrane
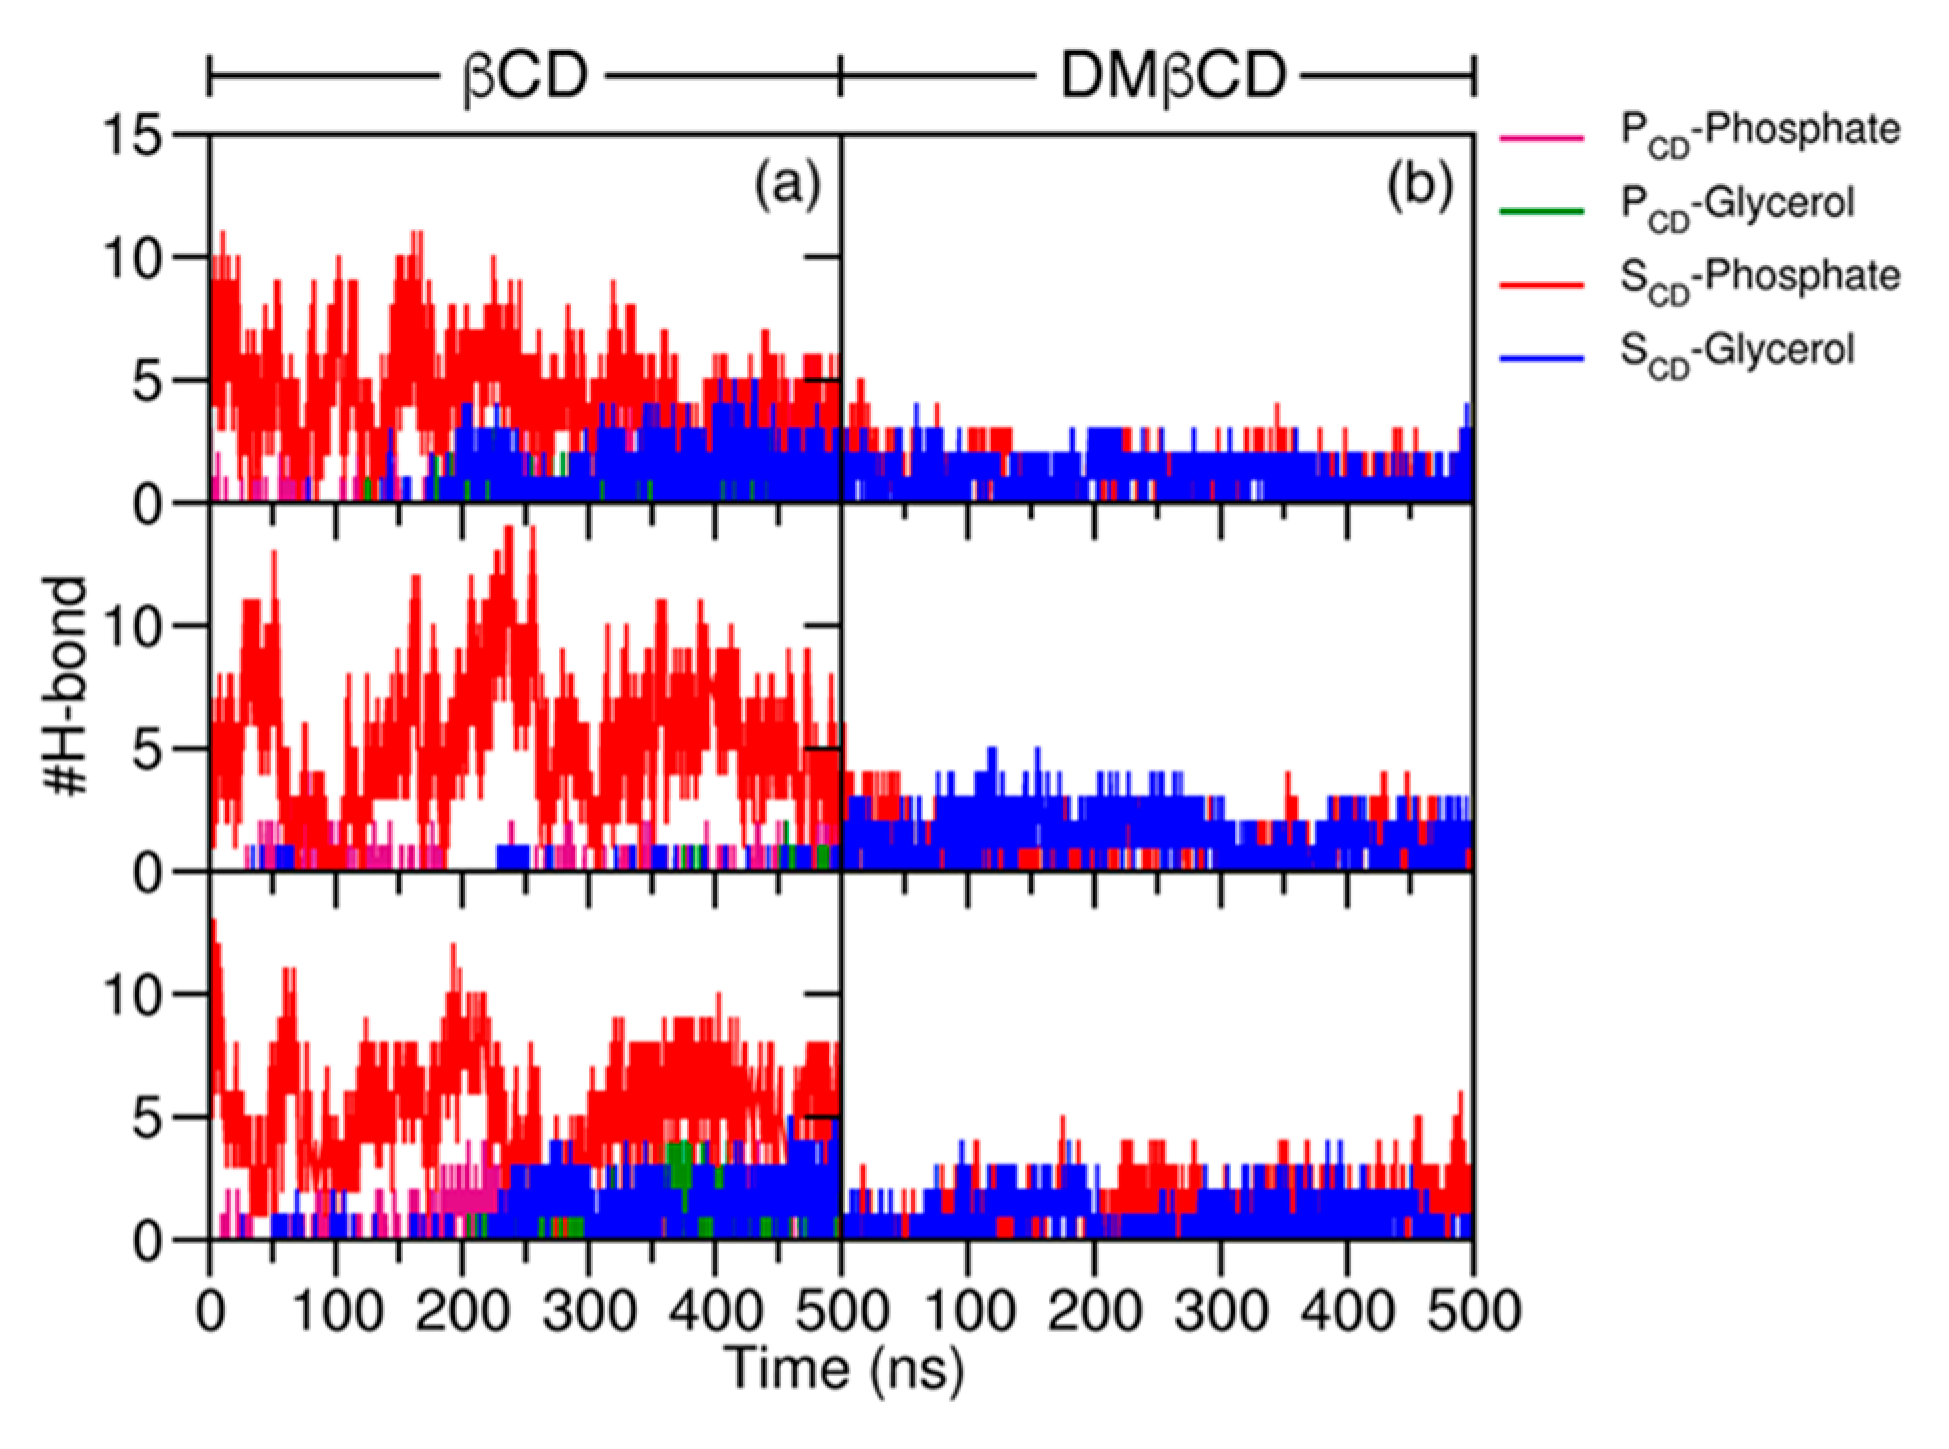
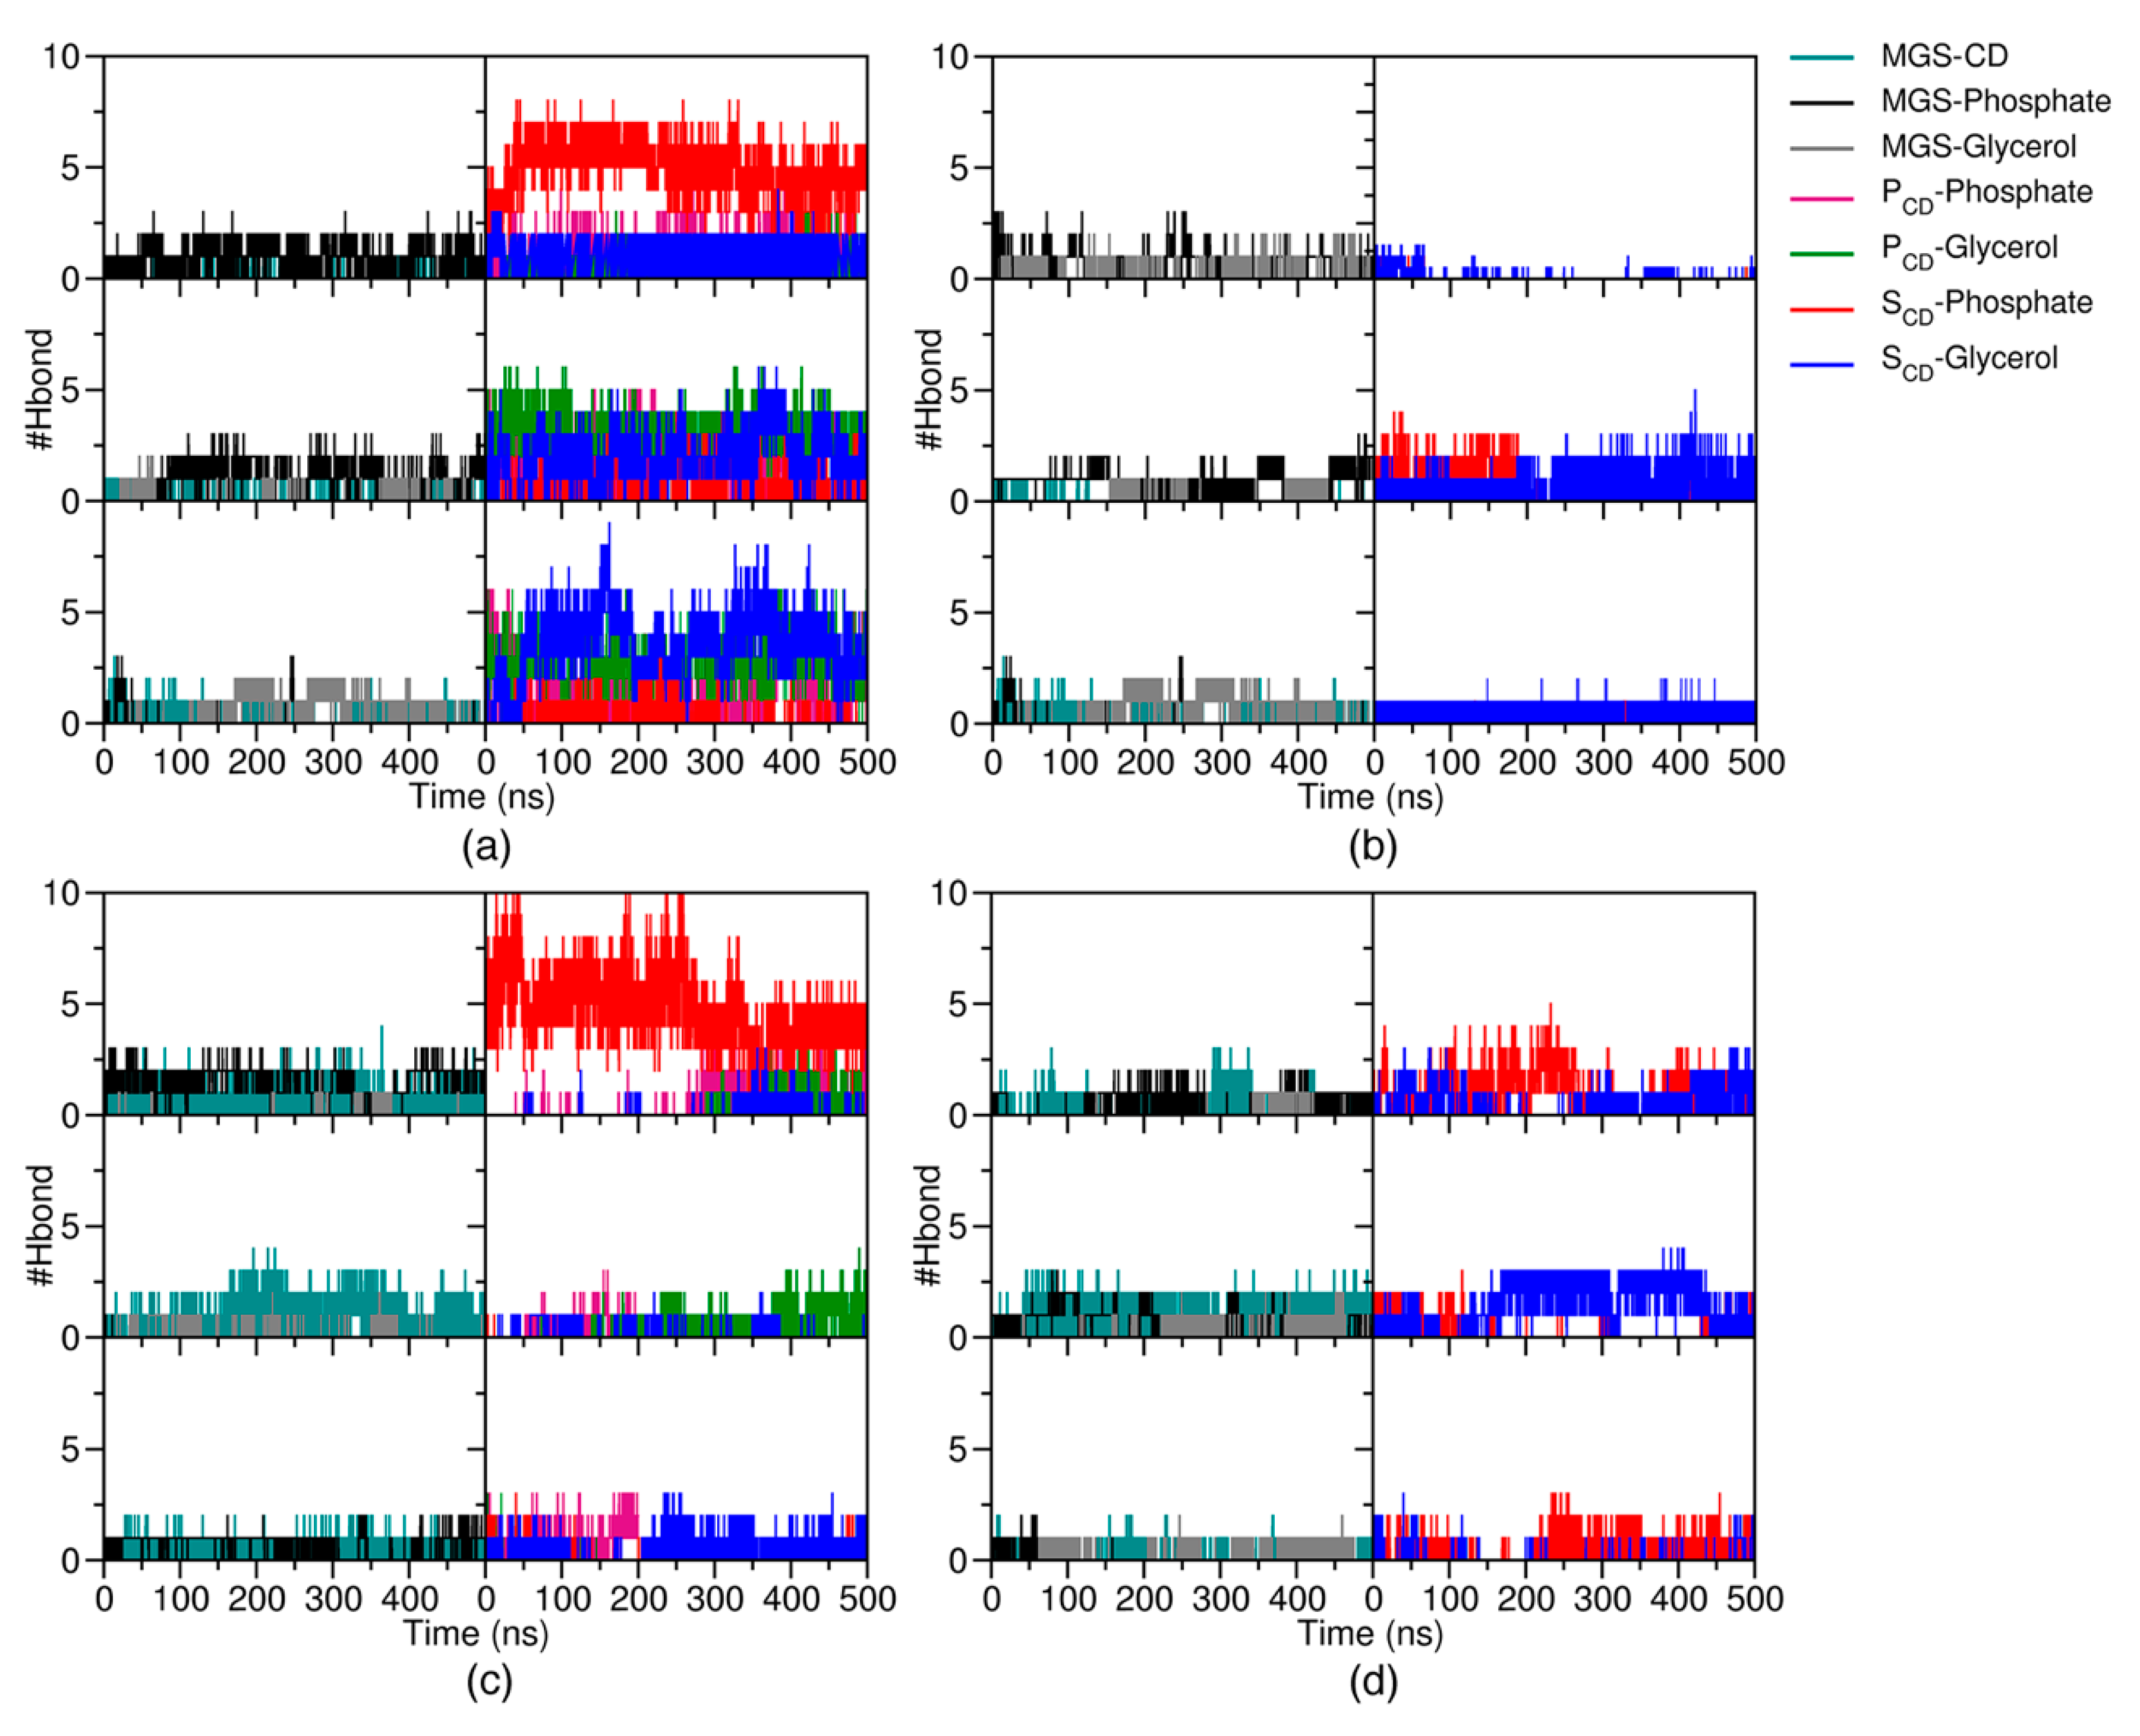
2.2. Intermolecular Interaction between CDs and MGS/CDs on the POPC Membrane
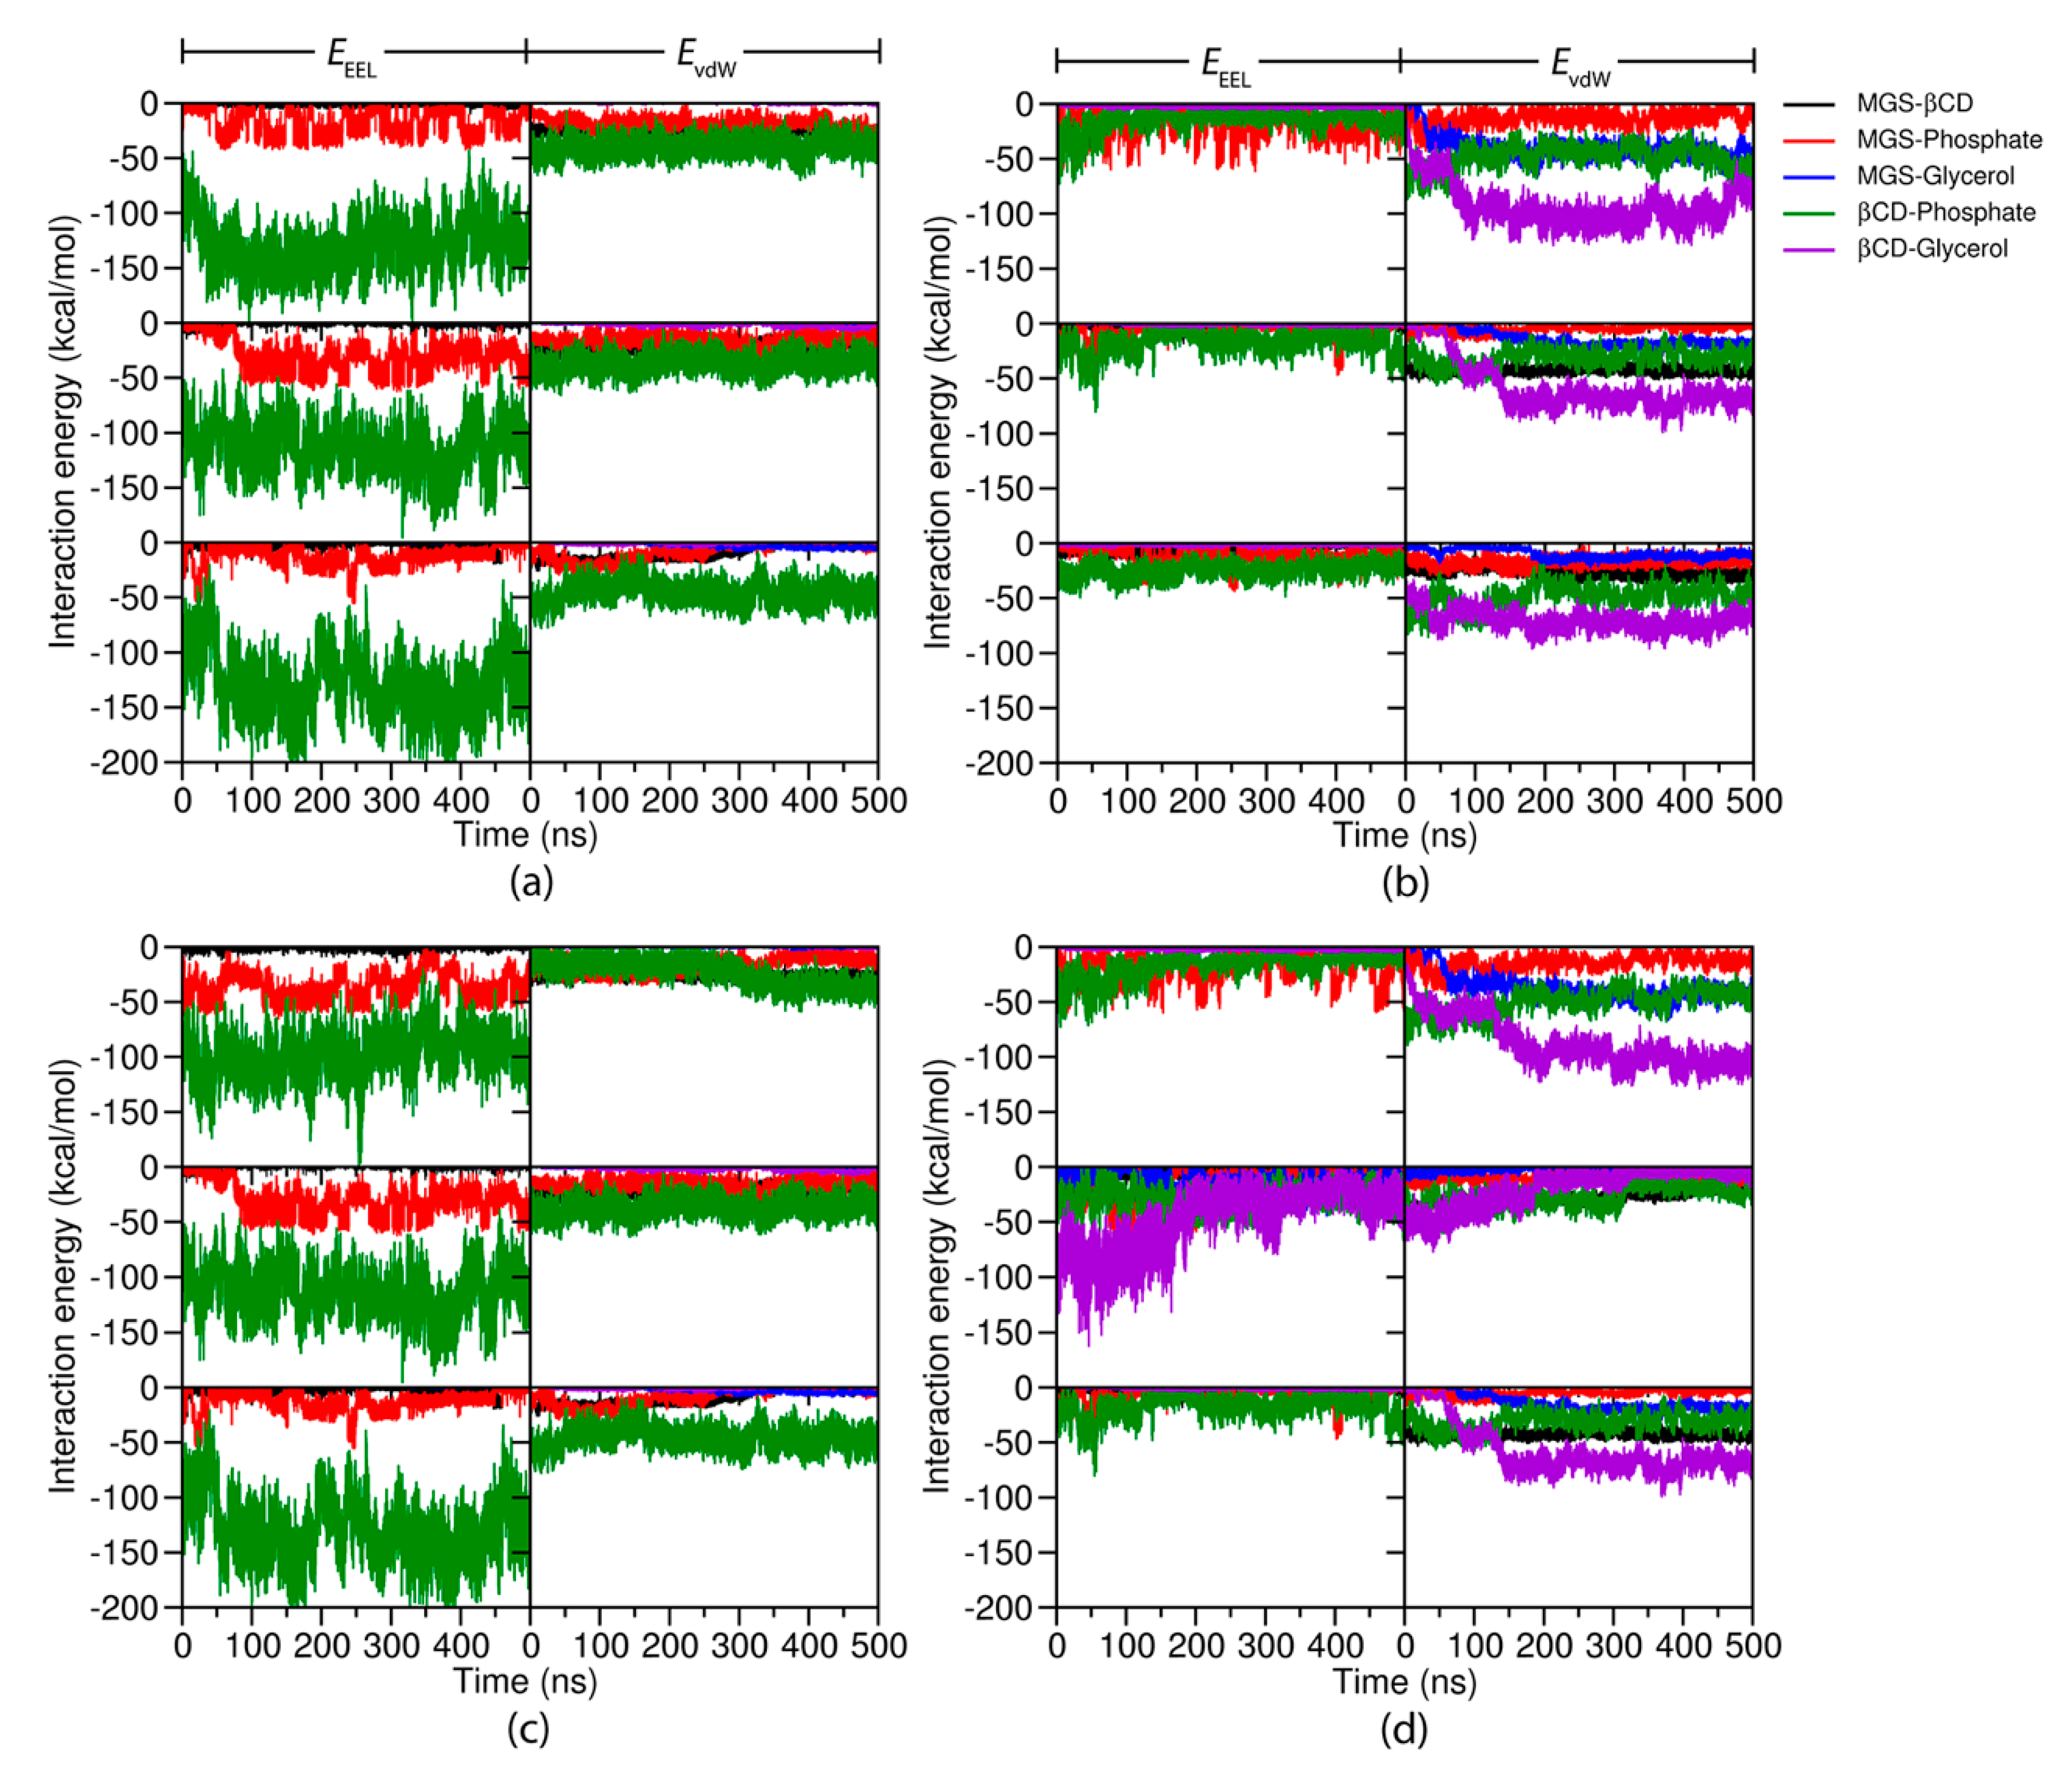
2.3. Interaction Energy
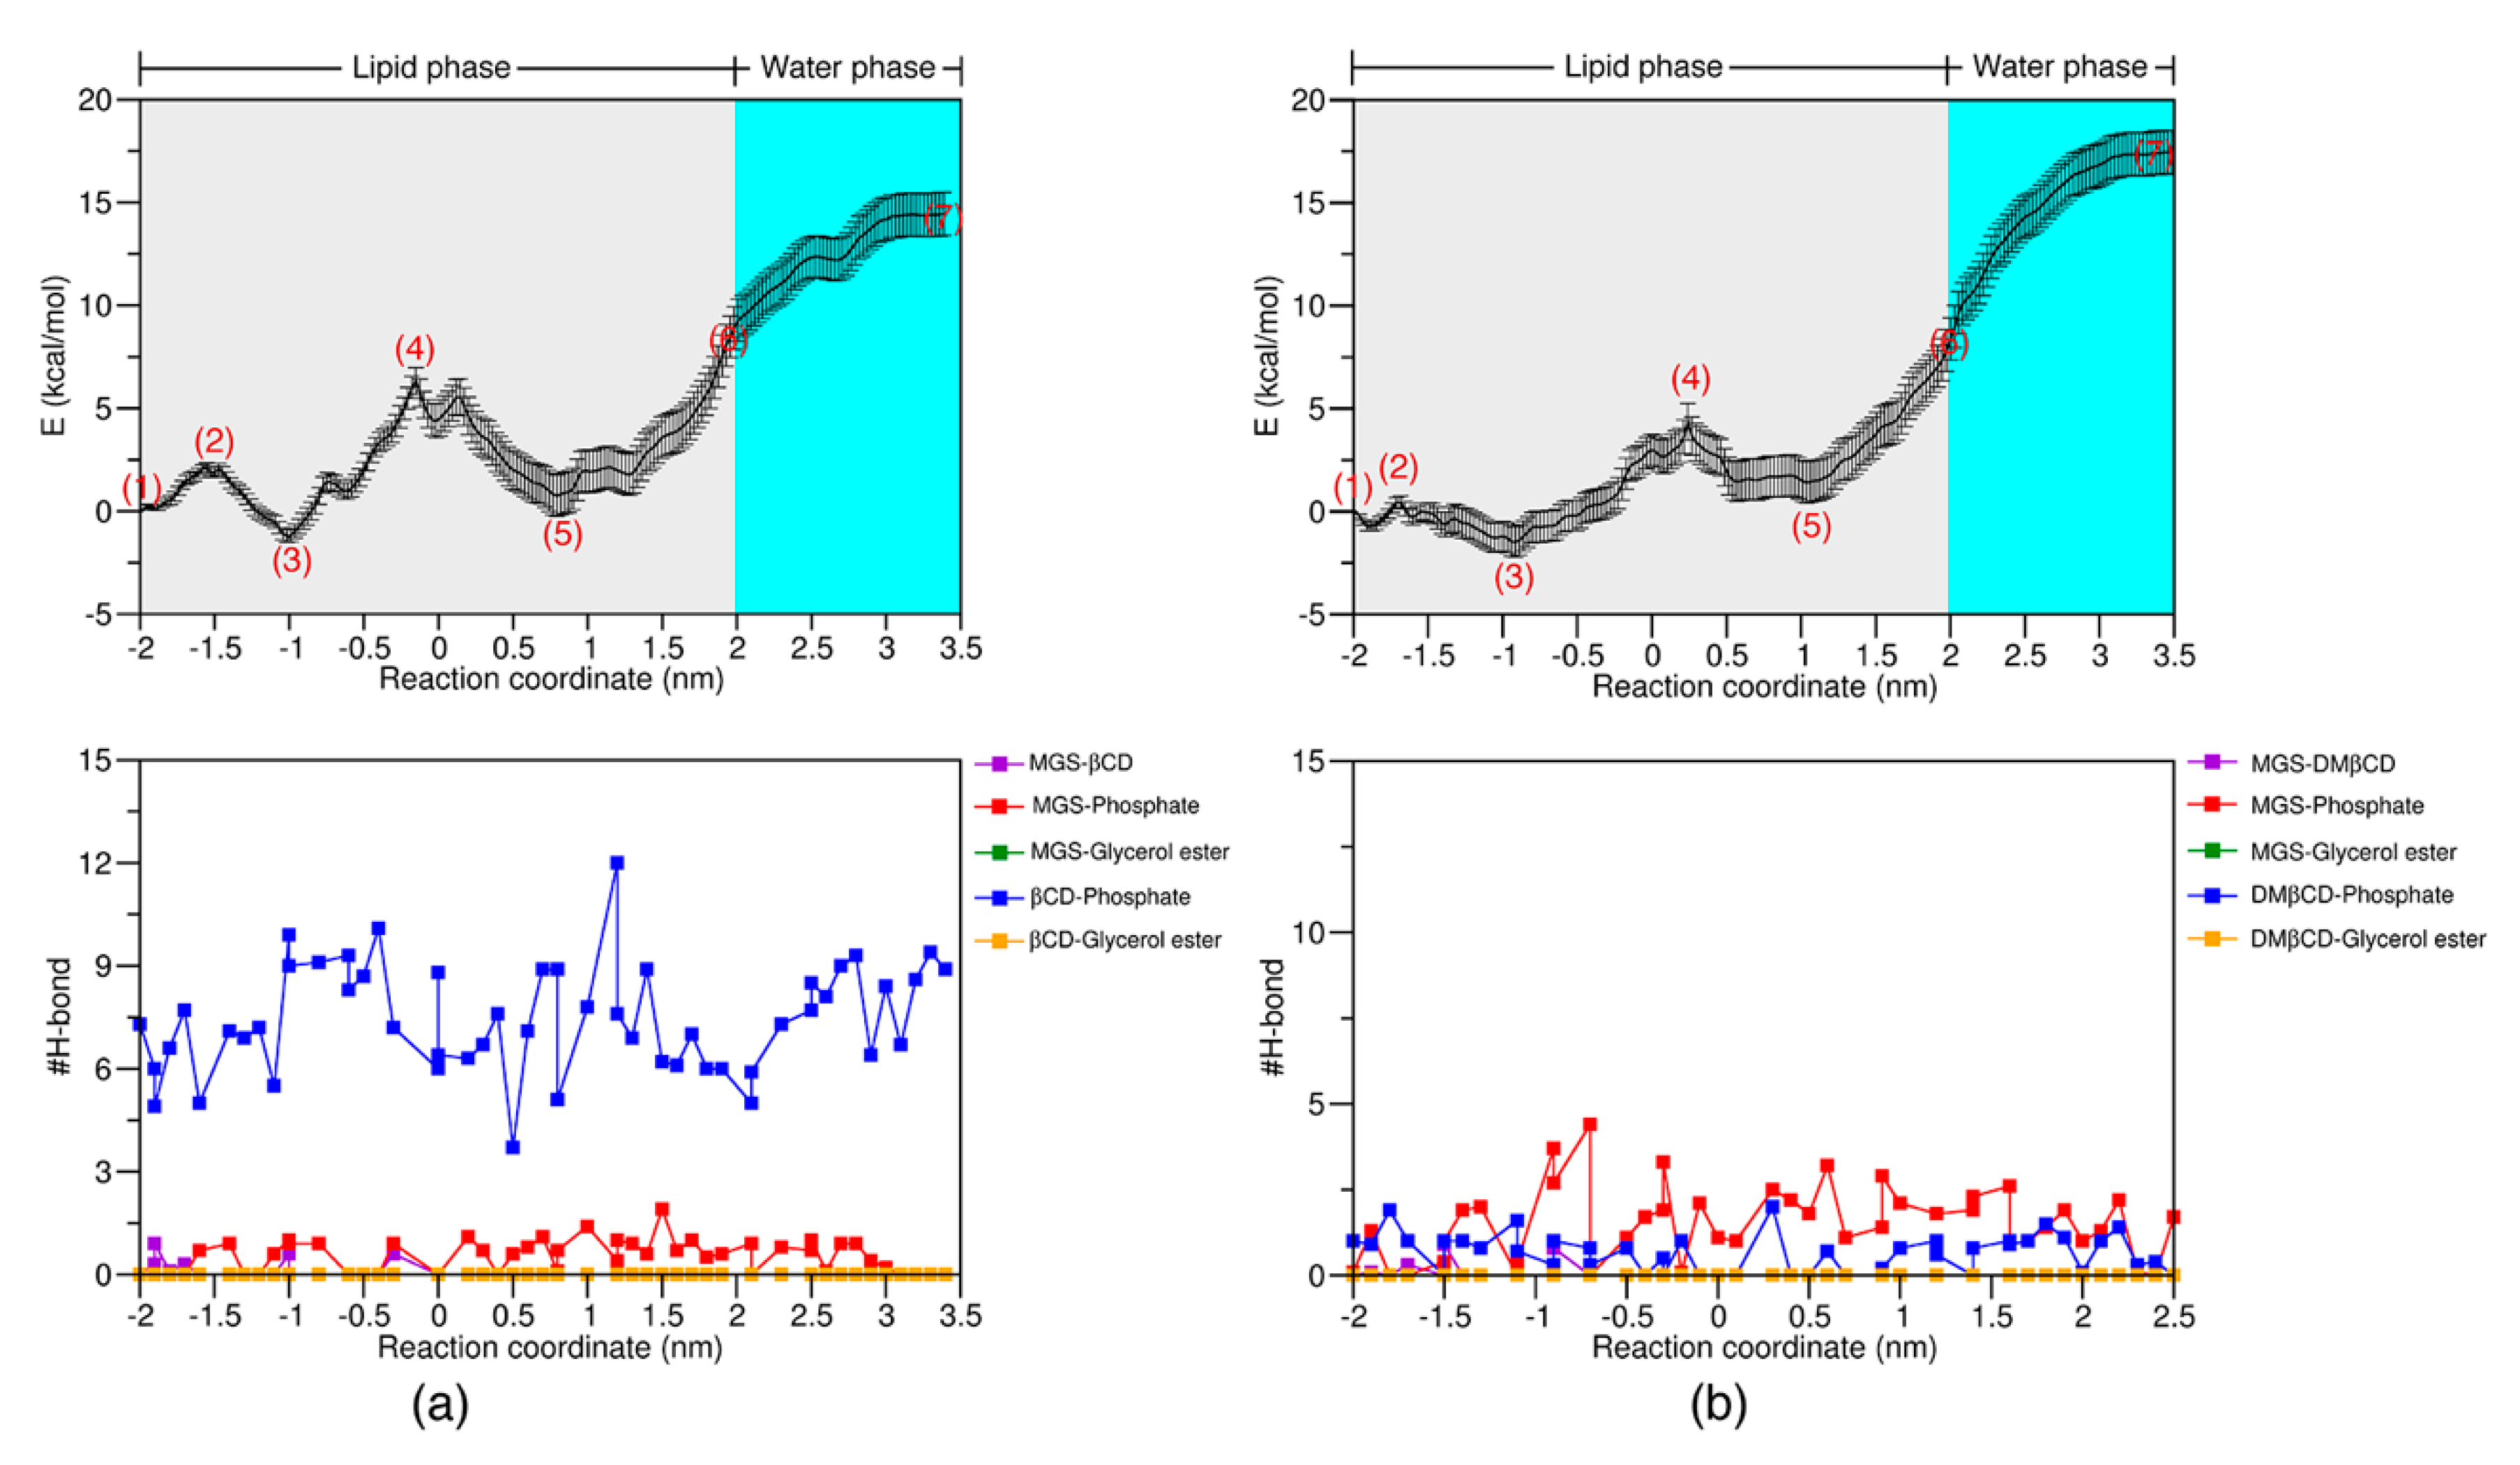
2.4. The PMF Calculation
3. Materials and Methods
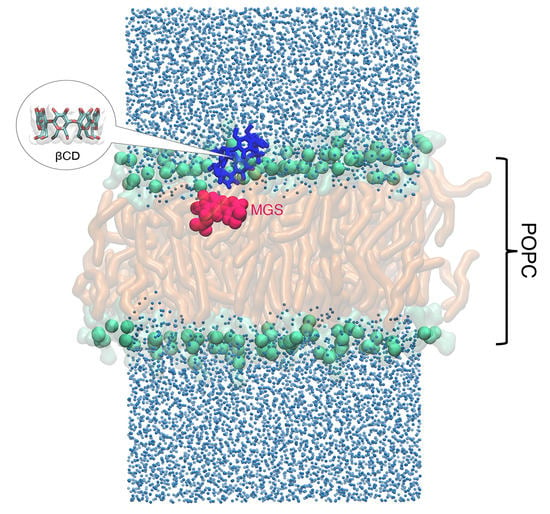
3.1. System Preparation
3.2. The MD Simulations
3.3. Free Energy Profile
4. Conclusions
Supplementary Materials
Author Contributions
Funding
Acknowledgments
Conflicts of Interest
References
- Chin, Y.W.; Kinghorn, A.D. Structural Characterization, Biological Effects, and Synthetic Studies on Xanthones from Mangosteen (Garcinia mangostana), a Popular Botanical Dietary Supplement. Mini Rev. Org. Chem. 2008, 5, 355–364. [Google Scholar] [CrossRef] [PubMed] [Green Version]
- Balasubramanian, K.; Rajagopalan, K. Novel xanthones from Garcinia mangostana, structures of BR-xanthone-A and BR-xanthone-B. Phytochemistry 1988, 27, 1552–1554. [Google Scholar]
- El-Seedi, H.R.; El-Barbary, M.A.; El-Ghorab, D.M.; Bohlin, L.; Borg-Karlson, A.K.; Goransson, U.; Verpoorte, R. Recent insights into the biosynthesis and biological activities of natural xanthones. Curr. Med. Chem. 2010, 17, 854–901. [Google Scholar] [CrossRef] [PubMed]
- Wang, M.H.; Zhang, K.J.; Gu, Q.L.; Bi, X.L.; Wang, J.X. Pharmacology of mangostins and their derivatives: A comprehensive review. Chin. J. Nat. Med. 2017, 15, 81–93. [Google Scholar]
- Sakagami, Y.; Iinuma, M.; Piyasena, K.G.; Dharmaratne, H.R. Antibacterial activity of alpha-mangostin against vancomycin resistant Enterococci (VRE) and synergism with antibiotics. Phytomedicine 2005, 12, 203–208. [Google Scholar] [CrossRef]
- Tjahjani, S.; Widowati, W.; Khiong, K.; Suhendra, A.; Tjokropranoto, R. Antioxidant Properties of Garcinia Mangostana L (Mangosteen) Rind. Procedia Chem. 2014, 13, 198–203. [Google Scholar]
- Chen, L.G.; Yang, L.L.; Wang, C.C. Anti-inflammatory activity of mangostins from Garcinia mangostana. Food Chem. Toxicol. 2008, 46, 688–693. [Google Scholar]
- Gutierrez-Orozco, F.; Chitchumroonchokchai, C.; Lesinski, G.B.; Suksamrarn, S.; Failla, M.L. alpha-Mangostin: Anti-inflammatory activity and metabolism by human cells. J. Agric. Food Chem. 2013, 61, 3891–3900. [Google Scholar] [CrossRef] [Green Version]
- Watanapokasin, R.; Jarinthanan, F.; Nakamura, Y.; Sawasjirakij, N.; Jaratrungtawee, A.; Suksamrarn, S. Effects of alpha-mangostin on apoptosis induction of human colon cancer. World J. Gastroenterol. 2011, 17, 2086–2095. [Google Scholar] [CrossRef]
- Martinez-Abundis, E.; Garcia, N.; Correa, F.; Hernandez-Resendiz, S.; Pedraza-Chaverri, J.; Zazueta, C. Effects of alpha-mangostin on mitochondrial energetic metabolism. Mitochondrion 2010, 10, 151–157. [Google Scholar] [CrossRef]
- Wang, J.J.; Sanderson, B.J.; Zhang, W. Cytotoxic effect of xanthones from pericarp of the tropical fruit mangosteen (Garcinia mangostana Linn.) on human melanoma cells. Food Chem. Toxicol. 2011, 49, 2385–2391. [Google Scholar] [CrossRef] [PubMed]
- Koh, J.-J.; Qiu, S.; Zou, H.; Lakshminarayanan, R.; Li, J.; Zhou, X.; Tang, C.; Saraswathi, P.; Verma, C.; Tan, D.T.H.; et al. Rapid bactericidal action of alpha-mangostin against MRSA as an outcome of membrane targeting. Biochim. Biophys. Acta (BBA) Biomembr. 2013, 1828, 834–844. [Google Scholar] [CrossRef] [PubMed] [Green Version]
- Aisha, A.F.; Ismail, Z.; Abu-Salah, K.M.; Majid, A.M. Solid dispersions of alpha-mangostin improve its aqueous solubility through self-assembly of nanomicelles. J. Pharm. Sci. 2012, 101, 815–825. [Google Scholar] [CrossRef]
- Li, J.; Liu, S.; Koh, J.J.; Zou, H.; Lakshminarayanan, R.; Bai, Y.; Pervushin, K.; Zhou, L.; Verma, C.; Beuerman, R.W. A novel fragment based strategy for membrane active antimicrobials against MRSA. Biochim. Biophys. Acta 2015, 1848, 1023–1031. [Google Scholar]
- Zou, H.; Koh, J.J.; Li, J.; Qiu, S.; Aung, T.T.; Lin, H.; Lakshminarayanan, R.; Dai, X.; Tang, C.; Lim, F.H.; et al. Design and synthesis of amphiphilic xanthone-based, membrane-targeting antimicrobials with improved membrane selectivity. J. Med. Chem. 2013, 56, 2359–2373. [Google Scholar] [CrossRef]
- Liu, L.; Guo, Q.-X. The Driving Forces in the Inclusion Complexation of Cyclodextrins. J. Incl. Phenom. Macrocycl. Chem. 2002, 42, 1–14. [Google Scholar] [CrossRef]
- Maeda, H.; Ogawa, Y.; Nakayama, H. Inclusion complexes of melatonin with modified cyclodextrins. J. Incl. Phenom. Macrocycl. Chem. 2014, 78, 217–224. [Google Scholar] [CrossRef]
- Yang, X.; Zhao, Y.; Chen, Y.; Liao, X.; Gao, C.; Xiao, D.; Qin, Q.; Yi, D.; Yang, B. Host-guest inclusion system of mangiferin with beta-cyclodextrin and its derivatives. Mater. Sci. Eng. C Mater. Biol. Appl. 2013, 33, 2386–2391. [Google Scholar] [CrossRef] [PubMed]
- Brewster, M.E.; Loftsson, T. Cyclodextrins as pharmaceutical solubilizers. Adv. Drug Deliv. Rev. 2007, 59, 645–666. [Google Scholar]
- Ren, B.; Zhang, M.; Gao, H.; Zheng, J.; Jia, L. Atomic elucidation of the cyclodextrin effects on DDT solubility and biodegradation. Phys. Chem. Chem. Phys. 2016, 18, 17380–17388. [Google Scholar]
- Szejtli, J. Introduction and General Overview of Cyclodextrin Chemistry. Chemical Reviews 1998, 98, 1743–1754. [Google Scholar] [CrossRef] [PubMed]
- Chatjigakis, A.K.; Donze, C.; Coleman, A.W.; Cardot, P. Solubility behavior of beta.-cyclodextrin in water/cosolvent mixtures. Anal. Chem. 1992, 64, 1632–1634. [Google Scholar] [CrossRef]
- Szejtli, J. The properties and potential uses of cyclodextrin derivatives. J. Incl. Phenom. Mol. Recognit. Chem. 1992, 14, 25–36. [Google Scholar] [CrossRef]
- Szente, L.; Szejtli, J. Highly soluble cyclodextrin derivatives: Chemistry, properties, and trends in development. Adv. Drug Deliv. Rev. 1999, 36, 17–28. [Google Scholar] [CrossRef]
- Schonbeck, C.; Westh, P.; Madsen, J.C.; Larsen, K.L.; Stade, L.W.; Holm, R. Hydroxypropyl-substituted beta-cyclodextrins: Influence of degree of substitution on the thermodynamics of complexation with tauroconjugated and glycoconjugated bile salts. Langmuir 2010, 26, 17949–17957. [Google Scholar] [CrossRef]
- Hotarat, W.; Phunpee, S.; Rungnim, C.; Wolschann, P.; Kungwan, N.; Ruktanonchai, U.; Rungrotmongkol, T.; Hannongbua, S. Encapsulation of alpha-mangostin and hydrophilic beta-cyclodextrins revealed by all-atom molecular dynamics simulations. J. Mol. Liq. 2019, 288, 110965. [Google Scholar] [CrossRef]
- Hammoud, Z.; Khreich, N.; Auezova, L.; Fourmentin, S.; Elaissari, A.; Greige-Gerges, H. Cyclodextrin-membrane interaction in drug delivery and membrane structure maintenance. Int. J. Pharm. 2019, 564, 59–76. [Google Scholar] [CrossRef]
- Loftsson, T.; Vogensen, S.B.; Brewster, M.E.; Konradsdottir, F. Effects of cyclodextrins on drug delivery through biological membranes. J. Pharm. Sci. 2007, 96, 2532–2546. [Google Scholar] [CrossRef]
- Loftsson, T. Drug permeation through biomembranes: Cyclodextrins and the unstirred water layer. Pharmazie 2012, 67, 363–370. [Google Scholar]
- Loftsson, T.; Brewster, M.E. Pharmaceutical applications of cyclodextrins: Effects on drug permeation through biological membranes. J. Pharm. Pharmacol. 2011, 63, 1119–1135. [Google Scholar] [CrossRef]
- Liu, X.; Testa, B.; Fahr, A. Lipophilicity and its relationship with passive drug permeation. Pharm. Res. 2011, 28, 962–977. [Google Scholar] [CrossRef]
- Gil, A.; Chamayou, A.; Leverd, E.; Bougaret, J.; Baron, M.; Couarraze, G. Evolution of the interaction of a new chemical entity, eflucimibe, with gamma-cyclodextrin during kneading process. Eur. J. Pharm. Sci. 2004, 23, 123–129. [Google Scholar] [CrossRef] [Green Version]
- Baatout, Z.; Teka, S.; Jaballah, N.; Sakly, N.; Sun, X.; Maurel, F.; Majdoub, M. Water-insoluble cyclodextrin membranes for humidity detection: Green synthesis, characterization and sensing performances. J. Mater. Sci. 2018, 53, 1455–1469. [Google Scholar] [CrossRef]
- Bozelli, J.C., Jr.; Hou, Y.H.; Epand, R.M. Thermodynamics of Methyl-beta-cyclodextrin-Induced Lipid Vesicle Solubilization: Effect of Lipid Headgroup and Backbone. Langmuir 2017, 33, 13882–13891. [Google Scholar] [CrossRef]
- Huang, Z.; London, E. Effect of cyclodextrin and membrane lipid structure upon cyclodextrin-lipid interaction. Langmuir 2013, 29, 14631–14638. [Google Scholar] [CrossRef]
- Brewster, M.E.; Noppe, M.; Peeters, J.; Loftsson, T. Effect of the unstirred water layer on permeability enhancement by hydrophilic cyclodextrins. Int. J. Pharm. 2007, 342, 250–253. [Google Scholar] [CrossRef]
- Egan, W.J.; Merz, K.M., Jr.; Baldwin, J.J. Prediction of drug absorption using multivariate statistics. J. Med. Chem. 2000, 43, 3867–3877. [Google Scholar] [CrossRef]
- Walter, A.; Gutknecht, J. Permeability of small nonelectrolytes through lipid bilayer membranes. J. Membr. Biol. 1986, 90, 207–217. [Google Scholar] [CrossRef]
- Brocke, S.A.; Degen, A.; MacKerell, A.D., Jr.; Dutagaci, B.; Feig, M. Prediction of Membrane Permeation of Drug Molecules by Combining an Implicit Membrane Model with Machine Learning. J. Chem. Inf. Model. 2019, 59, 1147–1162. [Google Scholar] [CrossRef]
- Wang, H.; Meng, F. Molecular simulation study on concentration effects of rofecoxib with POPC bilayer. J. Mol. Graph. Model. 2016, 70, 94–99. [Google Scholar] [CrossRef]
- Ma, J.; Domicevica, L.; Schnell, J.R.; Biggin, P.C. Position and orientational preferences of drug-like compounds in lipid membranes: A computational and NMR approach. Phys. Chem. Chem. Phys. 2015, 17, 19766–19776. [Google Scholar] [CrossRef] [Green Version]
- Shinoda, W. Permeability across lipid membranes. Biochim. Biophys. Acta (BBA) Biomembr. 2016, 1858, 2254–2265. [Google Scholar] [CrossRef]
- Lopez, C.A.; de Vries, A.H.; Marrink, S.J. Molecular mechanism of cyclodextrin mediated cholesterol extraction. PLoS Comput. Biol. 2011, 7, e1002020. [Google Scholar] [CrossRef] [Green Version]
- Blum, R.H.; Carter, S.K. Adriamycin. A new anticancer drug with significant clinical activity. Ann. Intern. Med. 1974, 80, 249–259. [Google Scholar] [CrossRef]
- Mayer, L.D.; Tai, L.C.; Ko, D.S.; Masin, D.; Ginsberg, R.S.; Cullis, P.R.; Bally, M.B. Influence of vesicle size, lipid composition, and drug-to-lipid ratio on the biological activity of liposomal doxorubicin in mice. Cancer Res. 1989, 49, 5922–5930. [Google Scholar]
- Li, J.; Beuerman, R.W.; Verma, C.S. Molecular Insights into the Membrane Affinities of Model Hydrophobes. ACS Omega 2018, 3, 2498–2507. [Google Scholar] [CrossRef]
- Khuntawee, W.; Wolschann, P.; Rungrotmongkol, T.; Wong-ekkabut, J.; Hannongbua, S. Molecular Dynamics Simulations of the Interaction of Beta Cyclodextrin with a Lipid Bilayer. J. Chem. Inf. Model. 2015, 55, 1894–1902. [Google Scholar] [CrossRef]
- Ren, B.; Gao, H.; Cao, Y.; Jia, L. In silico understanding of the cyclodextrin-phenanthrene hybrid assemblies in both aqueous medium and bacterial membranes. J. Hazard. Mater. 2015, 285, 148–156. [Google Scholar] [CrossRef]
- Meng, F.; Xu, W. Drug permeability prediction using PMF method. J. Mol. Model. 2013, 19, 991–997. [Google Scholar] [CrossRef]
- Yacoub, T.J.; Reddy, A.S.; Szleifer, I. Structural effects and translocation of doxorubicin in a DPPC/Chol bilayer: The role of cholesterol. Biophys. J. 2011, 101, 378–385. [Google Scholar] [CrossRef] [Green Version]
- Paloncyova, M.; Berka, K.; Otyepka, M. Molecular insight into affinities of drugs and their metabolites to lipid bilayers. J. Phys. Chem. B 2013, 117, 2403–2410. [Google Scholar] [CrossRef]
- Wang, H.; Ren, X.; Meng, F. Molecular dynamics simulation of six β-blocker drugs passing across POPC bilayer. Mol. Simul. 2016, 42, 56–63. [Google Scholar] [CrossRef]
- Jo, S.; Lim, J.B.; Klauda, J.B.; Im, W. CHARMM-GUI Membrane Builder for mixed bilayers and its application to yeast membranes. Biophys. J. 2009, 97, 50–58. [Google Scholar]
- Jo, S.; Kim, T.; Im, W. Automated builder and database of protein/membrane complexes for molecular dynamics simulations. PLoS ONE 2007, 2, e880. [Google Scholar] [CrossRef] [Green Version]
- Qi, Y.; Cheng, X.; Lee, J.; Vermaas, J.V.; Pogorelov, T.V.; Tajkhorshid, E.; Park, S.; Klauda, J.B.; Im, W. CHARMM-GUI HMMM Builder for Membrane Simulations with the Highly Mobile Membrane-Mimetic Model. Biophys. J. 2015, 109, 2012–2022. [Google Scholar] [CrossRef] [Green Version]
- Abraham, M.J.; Murtola, T.; Schulz, R.; Páll, S.; Smith, J.C.; Hess, B.; Lindahl, E. GROMACS: High performance molecular simulations through multi-level parallelism from laptops to supercomputers. SoftwareX 2015, 1–2, 19–25. [Google Scholar]
- Páll, S.; Abraham, M.J.; Kutzner, C.; Hess, B.; Lindahl, E. Tackling Exascale Software Challenges in Molecular Dynamics Simulations with GROMACS, Solving Software Challenges for Exascale; Markidis, S., Laure, E., Eds.; Springer: Berlin/Heidelberg, Germany, 2015; pp. 3–27. [Google Scholar]
- Pronk, S.; Pall, S.; Schulz, R.; Larsson, P.; Bjelkmar, P.; Apostolov, R.; Shirts, M.R.; Smith, J.C.; Kasson, P.M.; van der Spoel, D.; et al. GROMACS 4.5: A high-throughput and highly parallel open source molecular simulation toolkit. Bioinformatics 2013, 29, 845–854. [Google Scholar] [CrossRef]
- Sousa da Silva, A.W.; Vranken, W.F. ACPYPE-AnteChamber PYthon Parser interfacE. BMC Res. Notes 2012, 5, 367. [Google Scholar] [CrossRef] [Green Version]
- Evans, D.J.; Holian, B.L. The Nose–Hoover thermostat. J. Chem. Phys. 1985, 83, 4069–4074. [Google Scholar] [CrossRef]
- Nosé, S. A molecular dynamics method for simulations in the canonical ensemble. Mol. Phys. 1984, 52, 255–268. [Google Scholar]
- Parrinello, M.; Rahman, A. Polymorphic transitions in single crystals: A new molecular dynamics method. J. Appl. Phys. 1981, 52, 7182–7190. [Google Scholar] [CrossRef]
- Hess, B.; Bekker, H.; Berendsen Herman, J.C.; Fraaije Johannes, G.E.M. LINCS: A linear constraint solver for molecular simulations. J. Comput. Chem. 1998, 18, 1463–1472. [Google Scholar] [CrossRef]
- Darden, T.; York, D.; Pedersen, L. Particle mesh Ewald: An N⋅log(N) method for Ewald sums in large systems. J. Chem. Phys. 1993, 98, 10089–10092. [Google Scholar] [CrossRef] [Green Version]
- Essmann, U.; Perera, L.; Berkowitz, M.L.; Darden, T.; Lee, H.; Pedersen, L.G. A smooth particle mesh Ewald method. J. Chem. Phys. 1995, 103, 8577–8593. [Google Scholar] [CrossRef] [Green Version]
- Shankar, K.; Rosenberg, J.M.; Djamal, B.; Swendsen, R.H.; Kollman, P.A. THE weighted histogram analysis method for free-energy calculations on biomolecules. I. The method. J. Chem. Phys. 1992, 13, 1011–1021. [Google Scholar]
- Ferguson, A.L. BayesWHAM: A Bayesian approach for free energy estimation, reweighting, and uncertainty quantification in the weighted histogram analysis method. J. Comput. Chem. 2017, 38, 1583–1605. [Google Scholar] [CrossRef]
Sample Availability: Samples of the compounds are not available from the authors. |


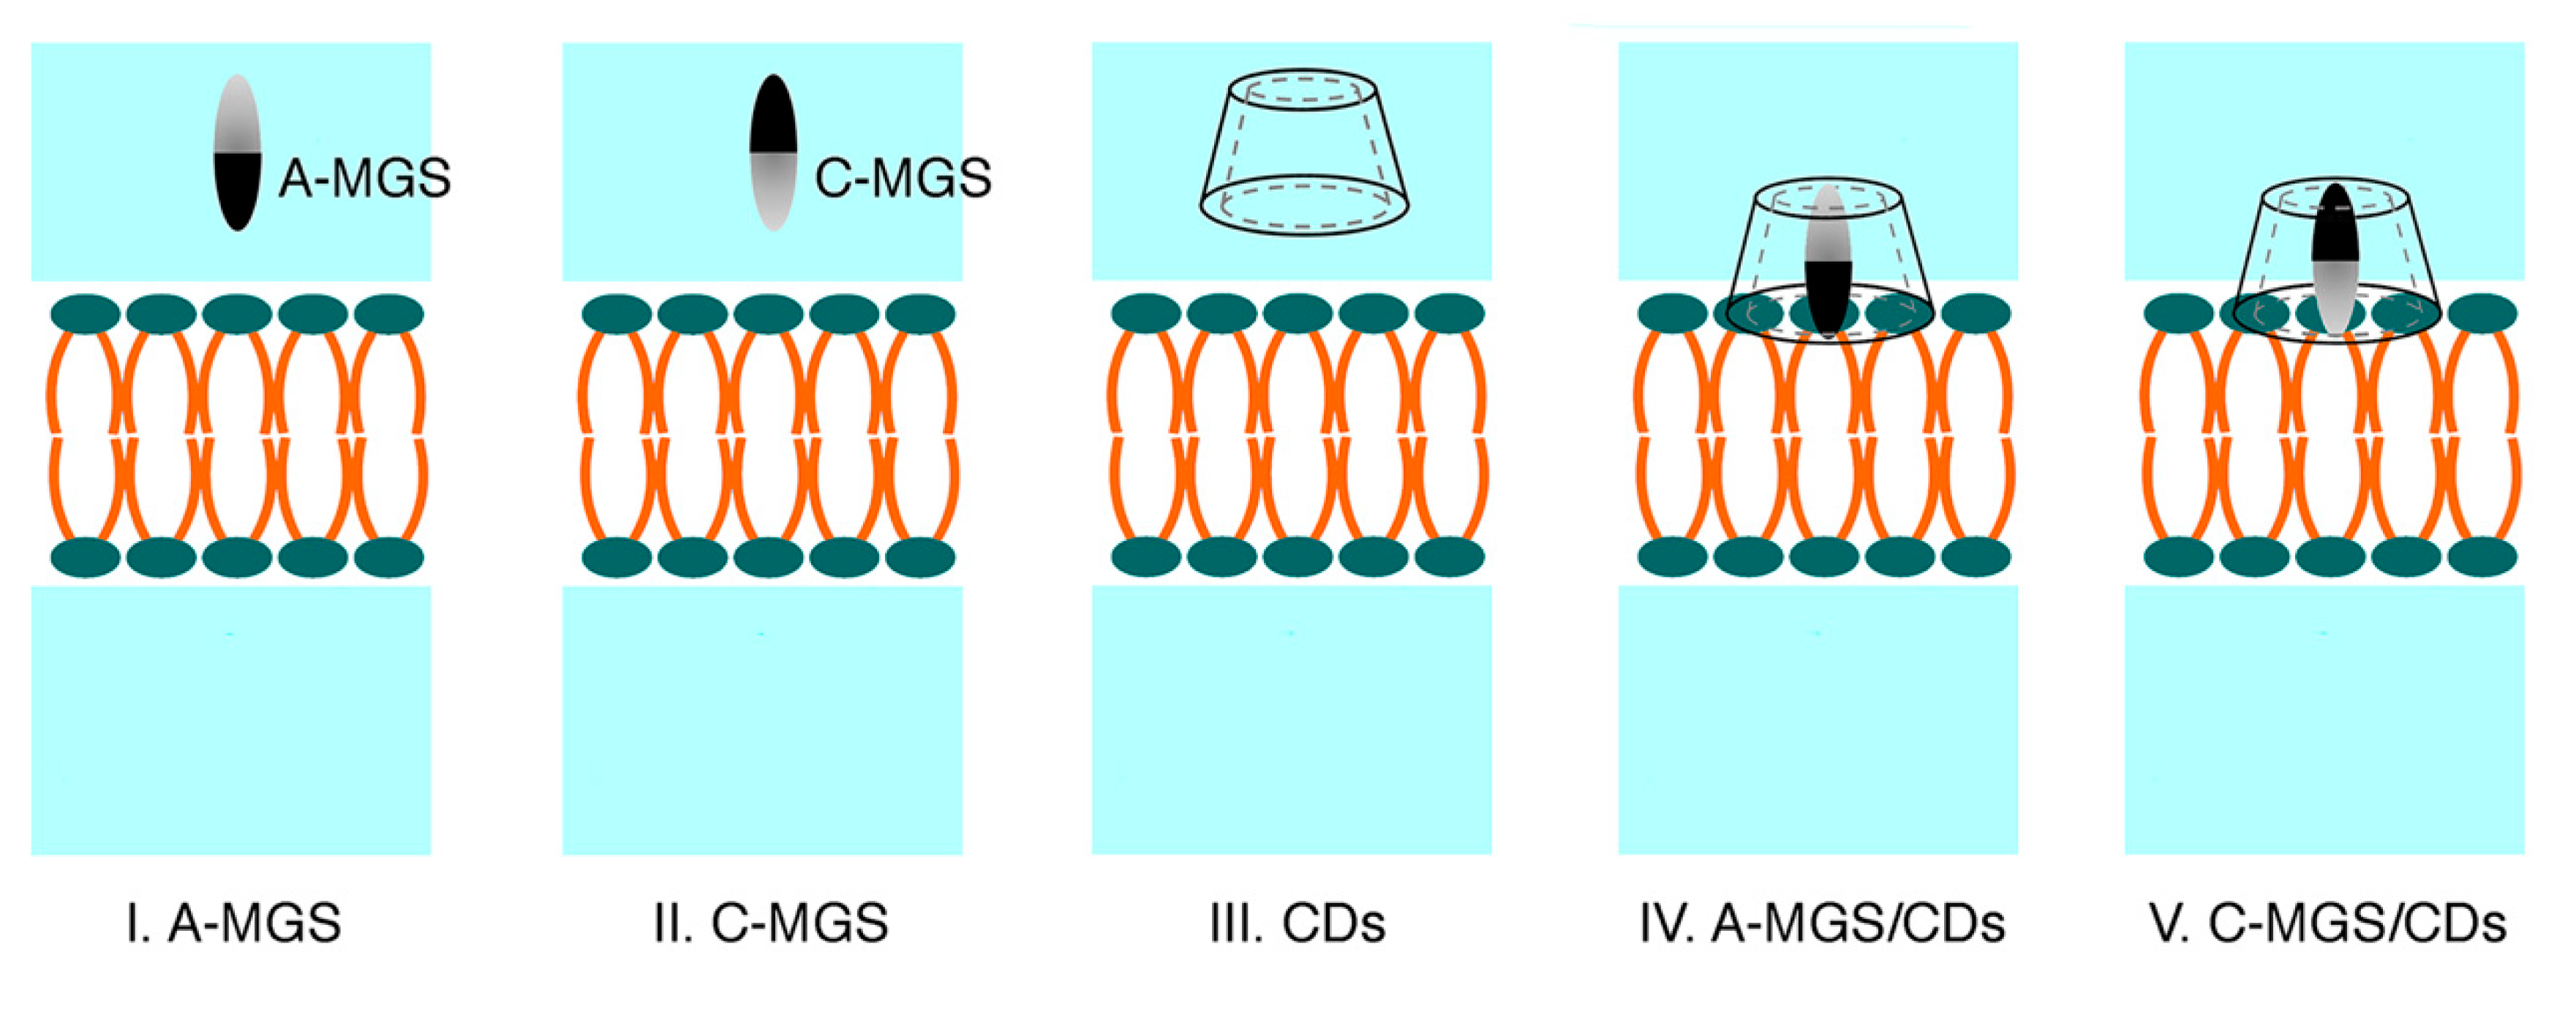
| Model | Name | Number of Molecules (MGS:CD:POPC) | Starting Distance (nm) a | Box size (nm × nm × nm) |
|---|---|---|---|---|
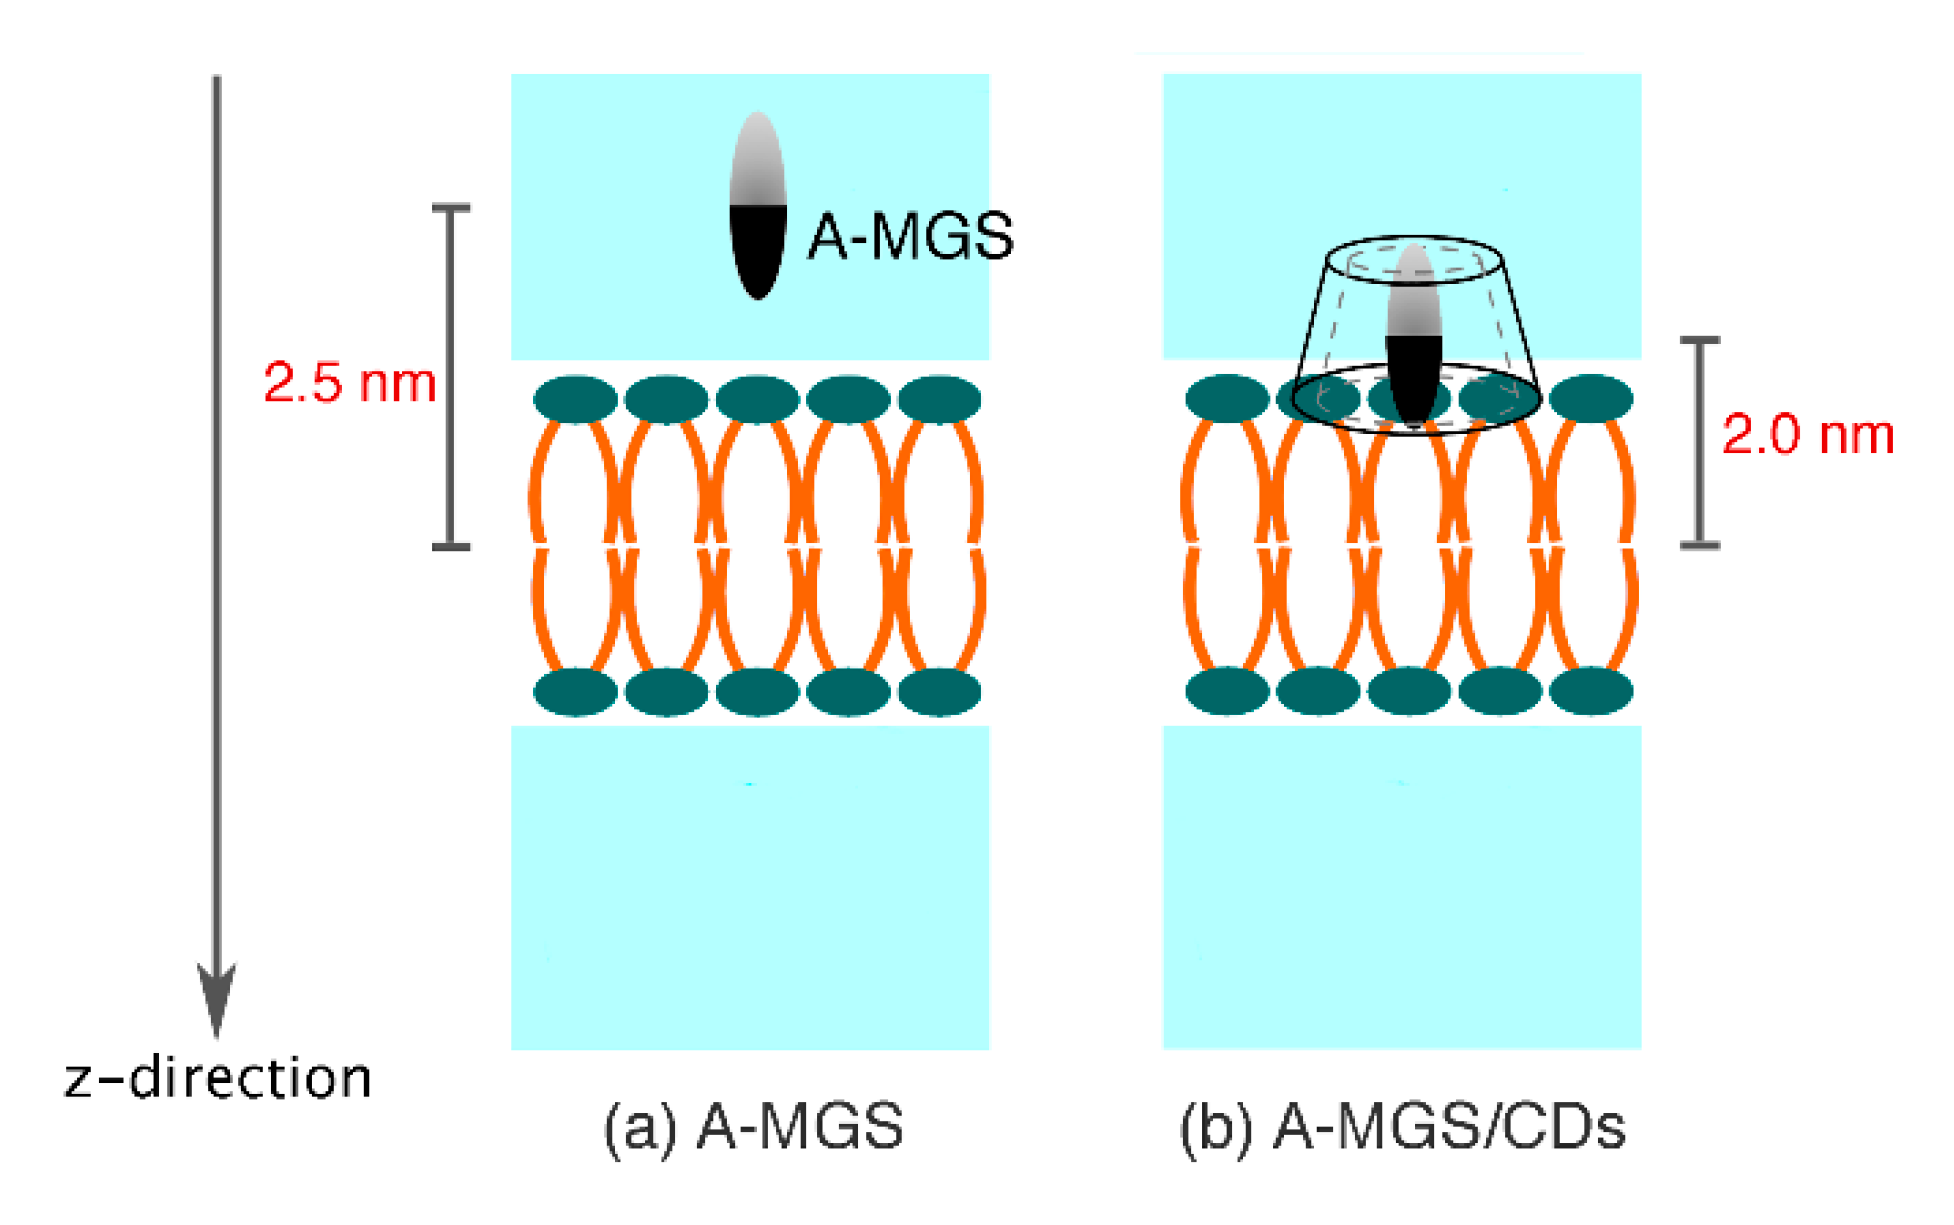
| I | A-MGS | 1:0:128 | 2.5 | 6.51 × 6.29 × 10.46 |
| II | C-MGS | 1:0:128 | 2.5 | 6.60 × 6.37 × 10.23 |
| III | βCD | 0:1:128 | 2.3 | 6.52 × 6.30 × 10.48 |
| DMβCD | 0:1:128 | 2.3 | 6.51 × 6.28 × 10.52 | |
| IV | A-MGS/βCD | 1:1:128 | 2.0 | 6.39 × 6.33 × 10.65 |
| A-MGS/DMβCD | 1:1:128 | 2.0 | 6.52 × 6.33 × 10.47 | |
| V | C-MGS/βCD | 1:1:128 | 2.0 | 6.48 × 6.23 × 10.61 |
| C-MGS/DMβCD | 1:1:128 | 2.0 | 6.52 × 6.32 × 10.47 |
| Model | # Windows | # Simulations | Equilibration (ns) | Sampling (ns) | Total (ns) |
|---|---|---|---|---|---|
| A-MGS | 61 | 1 | 10 | 20 | 1220 |
| A-MGS/βCD | 56 | 3 | 10 | 20 | 1120 (× 3) |
| A-MGS/DMβCD | 56 | 3 | 10 | 20 | 1120 (× 3) |
© 2020 by the authors. Licensee MDPI, Basel, Switzerland. This article is an open access article distributed under the terms and conditions of the Creative Commons Attribution (CC BY) license (http://creativecommons.org/licenses/by/4.0/).
Share and Cite
Hotarat, W.; Nutho, B.; Wolschann, P.; Rungrotmongkol, T.; Hannongbua, S. Delivery of Alpha-Mangostin Using Cyclodextrins through a Biological Membrane: Molecular Dynamics Simulation. Molecules 2020, 25, 2532. https://doi.org/10.3390/molecules25112532
Hotarat W, Nutho B, Wolschann P, Rungrotmongkol T, Hannongbua S. Delivery of Alpha-Mangostin Using Cyclodextrins through a Biological Membrane: Molecular Dynamics Simulation. Molecules. 2020; 25(11):2532. https://doi.org/10.3390/molecules25112532
Chicago/Turabian StyleHotarat, Wiparat, Bodee Nutho, Peter Wolschann, Thanyada Rungrotmongkol, and Supot Hannongbua. 2020. "Delivery of Alpha-Mangostin Using Cyclodextrins through a Biological Membrane: Molecular Dynamics Simulation" Molecules 25, no. 11: 2532. https://doi.org/10.3390/molecules25112532