
HILIC-ESI-FTMS with All Ion Fragmentation (AIF) Scans as a Tool for Fast Lipidome Investigations

 ,
,  , and
, and
Abstract
: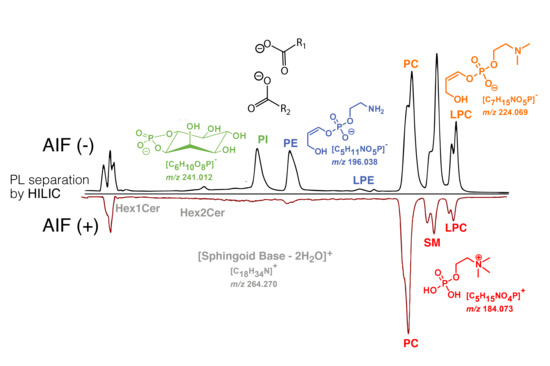
Graphical Abstract
1. Introduction
2. Results and Discussion
2.1. Separation of Standard PL Species
2.2. HILIC-ESI-FTMS AIF Analysis of Human Plasma Lipid Species
2.3. AIF MS Scans of Linked Fatty Acyl Chains in Phospholipids
2.4. AIF in Untargeted and Targeted Analysis
3. Material and Methods
3.1. Chemicals
3.2. Lipid Nomenclature
3.3. Lipid Standard Samples
3.4. Human Plasma and Dermal Fibroblast Samples
3.5. Lipid Extraction
3.6. HILIC-ESI-MS Instrumentation and Operating Conditions
3.7. Data Analysis
4. Conclusions
Supplementary Materials
Author Contributions
Funding
Acknowledgments
Conflicts of Interest
References
- Fahy, E.; Subramaniam, S.; Murphy, R.C.; Nishijima, M.; Raetz, C.R.H.; Shimizu, T.; Spener, F.; van Meer, G.; Wakelam, M.J.O.; Dennis, E.A. Update of the LIPID MAPS comprehensive classification system for lipids. J. Lipid Res. 2009, 50, S9–S14. [Google Scholar] [CrossRef] [PubMed] [Green Version]
- Han, X. Lipidomics for studying metabolism. Nat. Rev. Endocrinol. 2016, 12, 668–679. [Google Scholar] [CrossRef] [PubMed]
- Van Meer, G.; Voelker, D.R.; Feigenson, G.W. Membrane lipids: Where they are and how they behave. Nat. Rev. Mol. Cell Biol. 2008, 9, 112–124. [Google Scholar] [CrossRef]
- Wang, J.; Wang, C.; Han, X. Tutorial on lipidomics. Anal. Chim. Acta 2019, 1061, 28–41. [Google Scholar] [CrossRef] [PubMed]
- Kremmyda, L.S.; Tvrzicka, E.; Stankova, B.; Zak, A. Fatty acids as biocompounds: Their role in human metabolism, health and disease - a review. part 2: Fatty acid physiological roles and applications in human health and disease. Biomed. Pap. 2011, 155, 195–218. [Google Scholar] [CrossRef] [Green Version]
- Wang, M.; Han, R.H.; Han, X. Fatty acidomics: Global analysis of lipid species containing a carboxyl group with a charge-remote fragmentation-assisted approach. Anal. Chem. 2013, 85, 9312–9320. [Google Scholar] [CrossRef] [Green Version]
- Losito, I.; Facchini, L.; Valentini, A.; Cataldi, T.R.I.; Palmisano, F. Fatty acidomics: Evaluation of the effects of thermal treatments on commercial mussels through an extended characterization of their free fatty acids by liquid chromatography – Fourier transform mass spectrometry. Food Chem. 2018, 255, 309–322. [Google Scholar] [CrossRef]
- Brondz, I. Development of fatty acid analysis by high-performance liquid chromatography, gas chromatography, and related techniques. Anal. Chim. Acta 2002, 465, 1–37. [Google Scholar] [CrossRef]
- Seppänen-Laakso, T.; Laakso, I.; Hiltunen, R. Analysis of fatty acids by gas chromatography, and its relevance to research on health and nutrition. Anal. Chim. Acta 2002, 465, 39–62. [Google Scholar] [CrossRef]
- Christie, W.W.; Han, X. Preparation of derivatives of fatty acids. In Lipid Analysis, 4th ed.; Elsevier: Amsterdam, The Netherlands, 2012; pp. 145–158. [Google Scholar]
- Dodds, E.D.; McCoy, M.R.; Rea, L.D.; Kennish, J.M. Gas chromatographic quantification of fatty acid methyl esters: Flame ionization detection vs. electron impact mass spectrometry. Lipids 2005, 40, 419–428. [Google Scholar] [CrossRef]
- Fuchs, B.; Süß, R.; Teuber, K.; Eibisch, M.; Schiller, J. Lipid analysis by thin-layer chromatography-A review of the current state. J. Chromatogr. A 2011, 1218, 2754–2774. [Google Scholar] [CrossRef] [PubMed]
- Kokotou, M.G.; Mantzourani, C.; Kokotos, G. Development of a Liquid Chromatography–High Resolution Mass Spectrometry Method for the Determination of Free Fatty Acids in Milk. Molecules 2020, 25, 1548. [Google Scholar] [CrossRef] [PubMed] [Green Version]
- Eliuk, S.; Makarov, A. Evolution of Orbitrap Mass Spectrometry Instrumentation. Annu. Rev. Anal. Chem. 2015, 8, 61–80. [Google Scholar] [CrossRef] [PubMed]
- Granafei, S.; Losito, I.; Palmisano, F.; Cataldi, T.R.I. Identification of isobaric lyso-phosphatidylcholines in lipid extracts of gilthead sea bream (Sparus aurata) fillets by hydrophilic interaction liquid chromatography coupled to high-resolution Fourier-transform mass spectrometry. Anal. Bioanal. Chem. 2015, 407, 6391–6404. [Google Scholar] [CrossRef]
- Gallart-Ayala, H.; Courant, F.; Severe, S.; Antignac, J.P.; Morio, F.; Abadie, J.; Le Bizec, B. Versatile lipid profiling by liquid chromatography-high resolution mass spectrometry using all ion fragmentation and polarity switching. Preliminary application for serum samples phenotyping related to canine mammary cancer. Anal. Chim. Acta 2013, 796, 75–83. [Google Scholar] [CrossRef]
- Chaleckis, R.; Naz, S.; Meister, I.; Wheelock, C.E. LC-MS-based metabolomics of biofluids using all-ion fragmentation (AIF) acquisition. In Methods in Molecular Biology; Giera, M., Ed.; Humana Press: New York, NY, USA, 2018; Volume 1730, pp. 45–58. ISBN 9781493975921. [Google Scholar]
- Schwalbe-Herrmann, M.; Willmann, J.; Leibfritz, D. Separation of phospholipid classes by hydrophilic interaction chromatography detected by electrospray ionization mass spectrometry. J. Chromatogr. A 2010, 1217, 5179–5183. [Google Scholar] [CrossRef]
- Granafei, S.; Azzone, P.; Spinelli, V.A.V.A.; Losito, I.; Palmisano, F.; Cataldi, T.R.I.T.R.I. Hydrophilic interaction and reversed phase mixed-mode liquid chromatography coupled to high resolution tandem mass spectrometry for polar lipids analysis. J. Chromatogr. A 2016, 1477, 47–55. [Google Scholar] [CrossRef]
- Losito, I.; Conte, E.; Cataldi, T.R.I.; Cioffi, N.; Megli, F.M.; Palmisano, F. The phospholipidomic signatures of human blood microparticles, platelets and platelet-derived microparticles: A comparative HILIC-ESI-MS investigation. Lipids 2015, 50, 71–84. [Google Scholar] [CrossRef]
- Losito, I.; Patruno, R.; Conte, E.; Cataldi, T.R.I.; Megli, F.M.; Palmisano, F. Phospholipidomics of human blood microparticles. Anal. Chem. 2013, 85, 6405–6413. [Google Scholar] [CrossRef]
- Calvano, C.D.; Bianco, M.; Ventura, G.; Losito, I.; Palmisano, F.; Cataldi, T.R.I. Analysis of phospholipids, lysophospholipids, and their linked fatty acyl chains in yellow lupin seeds (Lupinus luteus L.) by liquid chromatography and tandem mass spectrometry. Molecules 2020, 25, 1–24. [Google Scholar] [CrossRef] [Green Version]
- Calvano, C.D.; Sardanelli, A.M.; Ventura, G.; Glaciale, M.; Savino, L.; Losito, I.; Palmisano, F.; Cataldi, T. Trends in Analytical Research Development and use of advanced mass spectrometry techniques for the characterization of cellular and mitochondrial lipidomic profiling in control fibroblasts and Parkinson’s disease patients. Trends Anal. Res. 2018, 1, 1–10. [Google Scholar]
- Kiełbowicz, G.; Trziszka, T.; Wawrzeńczyk, C. Separation and quantification of phospholipid and neutral lipid classes by HPLC-CAD: Application to egg yolk lipids. J. Liq. Chromatogr. Relat. Technol. 2015, 38, 898–903. [Google Scholar] [CrossRef]
- Hsu, F.-F.; Turk, J. Characterization of phosphatidylinositol, phosphatidylinositol-4-phosphate, and phosphatidylinositol-4,5-bisphosphate by electrospray ionization tandem mass spectrometry: A mechanistic study. J. Am. Soc. Mass Spectrom. 2000, 11, 986–999. [Google Scholar] [CrossRef] [Green Version]
- Murphy, R.C. Tandem Mass Spectrometry of Lipids: Molecular Analysis of Complex Lipids; Murphy, R.C., Ed.; Royal Society of Chemistry: London, UK, 2014; ISBN 1849738270. [Google Scholar]
- Han, X. Lipidomics: Comprehensive Mass Spectrometry of Lipids; John Wiley & Sons, Inc.: Hoboken, NJ, US, 2016; ISBN 9781119085263. [Google Scholar]
- Quehenberger, O.; Armando, A.M.; Brown, A.H.; Milne, S.B.; Myers, D.S.; Merrill, A.H.; Bandyopadhyay, S.; Jones, K.N.; Kelly, S.; Shaner, R.L.; et al. Lipidomics reveals a remarkable diversity of lipids in human plasma. J. Lipid Res. 2010, 51, 3299–3305. [Google Scholar] [CrossRef] [Green Version]
- Calvano, C.D.; Glaciale, M.; Palmisano, F.; Cataldi, T.R.I. Glycosphingolipidomics of donkey milk by hydrophilic interaction liquid chromatography coupled to ESI and multistage MS. Electrophoresis 2018, 39, 1634–1644. [Google Scholar] [CrossRef]
- Calvano, C.D.; Ventura, G.; Sardanelli, A.M.M.; Savino, L.; Losito, I.; De Michele, G.; Palmisano, F.; Cataldi, T.R.I. Searching for potential lipid biomarkers of parkinson’s disease in parkin-mutant human skin fibroblasts by HILIC-ESI-MS/MS: Preliminary findings. Int. J. Mol. Sci. 2019, 20. [Google Scholar] [CrossRef] [Green Version]
- Quehenberger, O.; Dennis, E.A. The human plasma lipidome. N. Engl. J. Med. 2011, 365, 1812–1823. [Google Scholar] [CrossRef]
- Checa, A.; Bedia, C.; Jaumot, J. Lipidomic data analysis: Tutorial, practical guidelines and applications. Anal. Chim. Acta 2015, 885, 1–16. [Google Scholar] [CrossRef]
- Naz, S.; Gallart-Ayala, H.; Reinke, S.N.; Mathon, C.; Blankley, R.; Chaleckis, R.; Wheelock, C.E. Development of a Liquid Chromatography-High Resolution Mass Spectrometry Metabolomics Method with High Specificity for Metabolite Identification Using All Ion Fragmentation Acquisition. Anal. Chem. 2017, 89, 7933–7942. [Google Scholar] [CrossRef] [Green Version]
- Hannun, Y.A.; Obeid, L.M. Sphingolipids and their metabolism in physiology and disease. Nat. Rev. Mol. Cell Biol. 2018, 19, 175–191. [Google Scholar] [CrossRef]
- Bilgin, M.; Born, P.; Fezza, F.; Heimes, M.; Mastrangelo, N.; Wagner, N.; Schultz, C.; Maccarrone, M.; Eaton, S.; Nadler, A.; et al. Lipid Discovery by Combinatorial Screening and Untargeted LC-MS/MS. Sci. Rep. 2016, 6, 1–6. [Google Scholar] [CrossRef] [PubMed] [Green Version]
- Cajka, T.; Fiehn, O. Toward Merging Untargeted and Targeted Methods in Mass Spectrometry-Based Metabolomics and Lipidomics. Anal. Chem. 2016, 88. [Google Scholar] [CrossRef] [PubMed]
- Tsugawa, H.; Cajka, T.; Kind, T.; Ma, Y.; Higgins, B.; Ikeda, K.; Kanazawa, M.; VanderGheynst, J.; Fiehn, O.; Arita, M. MS-DIAL: Data-independent MS/MS deconvolution for comprehensive metabolome analysis. Nat. Methods 2015, 12, 523–526. [Google Scholar] [CrossRef] [PubMed]
- Sentandreu, E.; Peris-Díaz, M.D.; Sweeney, S.R.; Chiou, J.; Muñoz, N.; Tiziani, S. A Survey of Orbitrap All Ion Fragmentation Analysis Assessed by an R MetaboList Package to Study Small-Molecule Metabolites. Chromatographia 2018, 81, 981–994. [Google Scholar] [CrossRef]
- Hoehn, M.M.; Yahr, M.D. Parkinsonism: Onset, progression, and mortality. Neurology 1967, 17, 427–442. [Google Scholar] [CrossRef] [PubMed] [Green Version]
- Liebisch, G.; Vizcaíno, J.A.; Köfeler, H.; Trötzmüller, M.; Griffiths, W.J.; Schmitz, G.; Spener, F.; Wakelam, M.J.O.; Vizcaino, J.A.; Kofeler, H.; et al. Shorthand notation for lipid structures derived from mass spectrometry. J. Lipid Res. 2013, 54, 1523–1530. [Google Scholar] [CrossRef] [Green Version]
- Liebisch, G.; Ekroos, K.; Hermansson, M.; Ejsing, C.S. Reporting of lipidomics data should be standardized. Biochim. Biophys. Acta Mol. Cell Biol. Lipids 2017, 1862, 747–751. [Google Scholar] [CrossRef]
- Bligh, E.G.; Dyer, W.J. A rapid method of total lipid extraction and purification. Can. J. Biochem. Physiol. 1959, 37, 911–917. [Google Scholar] [CrossRef] [Green Version]
- Shane, R.E.; Martin, R.L.P.; Gert, B.E.; Josch, K.P.; Peter, H.; Mark, W.J.; Martin, H.; Christer, S.E.; Ron, M.A.H. Automated, parallel mass spectrometry imaging and structural identification of lipids. Nat. Methods. 2018, 15, 515–518. [Google Scholar]
- Husen, P.; Tarasov, K.; Katafiasz, M.; Sokol, E.; Vogt, J.; Baumgart, J.; Nitsch, R.; Ekroos, K.; Ejsing, C.S. Analysis of lipid experiments (ALEX): A software framework for analysis of high-resolution shotgun lipidomics data. PLoS ONE 2013, 8, e79736. [Google Scholar] [CrossRef] [Green Version]
Sample Availability: Samples of the extract lipid compounds from plasma are available from the authors. |


| Fatty Acyl Chain | Carboxylate Anion (m/z) | Data Estimated by AIF Scan (%) | Seller Declared (%) |
|---|---|---|---|
| FA C16:0 | 255.233 | 6.3 | − |
| FA C16:1 | 253.217 | 0.5 | − |
| FA C17:0 | 269.249 | 1.5 | − |
| FA C18:0 | 283.264 | 37.6 | ̴46.0 |
| FA C18:1 | 281.249 | 12.0 | ̴8.0 |
| FA C18:2 | 279.233 | 11.6 | ̴6.0 |
| FA C18:3 | 277.217 | 0.7 | − |
| FA C20:2 | 307.264 | 1.6 | − |
| FA C20:3 | 305.248 | 10.6 | ̴13.0 |
| FA C20:4 | 303.233 | 17.0 | ̴17.0 |
| FA C20:5 | 301.217 | 0.7 | − |
| FA C22:4 | 331.264 | 1.6 | − |
| FA C22:5 | 329.249 | 1.2 | − |
| Others | <1 | ̴10.0 |
| Fatty Acyl Chains | Theoretical m/z | PI (%) | PE (%) | PC (%) | LPC (%) |
|---|---|---|---|---|---|
| FA C14:0 | 227.202 | − | 0.14 ± 0.01 | 1.65 ± 0.07 | 0.27 ± 0.01 |
| FA C16:0 | 255.233 | 11.7 ± 1.2 | 4.79 ± 0.06 | 19.43 ± 0.16 | 40.0 ± 0.3 |
| FA C16:1 | 253.217 | − | 0.79 ± 0.08 | 1.66 ± 0.01 | 0.71 ± 0.11 |
| FA C17:0 | 269.249 | − | 0.18 ± 0.01 | 0.44 ± 0.01 | 1.21 ± 0.01 |
| FA C17:1 | 267.233 | − | 0.33 ± 0.12 | 0.31 ± 0.01 | 0.21 ± 0.02 |
| FA C18:0 | 283.264 | 29.2 ± 1.7 | 4.85 ± 0.04 | 6.07 ± 0.07 | 26.51 ± 0.12 |
| FA C18:1 | 281.249 | 9.8 ± 0.7 | 14.7 ± 0.4 | 14.55 ± 0.05 | 16.55 ± 0.08 |
| FA C18:2 | 279.233 | 6.64 ± 0.19 | 21.7 ± 0.7 | 29.2 ± 0.2 | 12.1 ± 0.2 |
| FA C18:3 | 277.217 | 0.11 ± 0.01 | 0.36 ± 0.01 | 0.46 ± 0.01 | 0.11 ± 0.01 |
| FA C20:1 | 309.280 | − | 0.20 ± 0.01 | 0.11 ± 0.01 | 0.22 ± 0.01 |
| FA C20:2 | 307.264 | 0.22 ± 0.03 | 0.15 ± 0.01 | 0.29 ± 0.01 | 0.21 ± 0.01 |
| FA C20:3 | 305.249 | 4.16 ± 0.10 | 4.30 ± 0.03 | 4.56 ± 0.05 | 1.14 ± 0.07 |
| FA C20:4 | 303.233 | 34.4 ± 0.7 | 33.9 ± 0.3 | 15.8 ± 0.2 | 0.77 ± 0.04 |
| FA C20:5 | 301.217 | − | 1.17 ± 0.02 | 0.58 ± 0.01 | − |
| FA C22:3 | 333.280 | − | 0.06 ± 001 | 0.01 ± 0.01 | − |
| FA C22:4 | 331.264 | 0.34 ± 0.05 | 1.89 ± 0.02 | 0.48 ± 0.02 | − |
| FA C22:5 | 329.249 | 0.99 ± 0.03 | 4.00 ± 0.08 | 1.25 ± 0.01 | − |
| FA C22:6 | 327.233 | 2.44 ± 0.12 | 6.53 ± 0.14 | 3.12 ± 0.04 | − |
© 2020 by the authors. Licensee MDPI, Basel, Switzerland. This article is an open access article distributed under the terms and conditions of the Creative Commons Attribution (CC BY) license (http://creativecommons.org/licenses/by/4.0/).
Share and Cite
Ventura, G.; Bianco, M.; Calvano, C.D.; Losito, I.; Cataldi, T.R.I. HILIC-ESI-FTMS with All Ion Fragmentation (AIF) Scans as a Tool for Fast Lipidome Investigations. Molecules 2020, 25, 2310. https://doi.org/10.3390/molecules25102310
Ventura G, Bianco M, Calvano CD, Losito I, Cataldi TRI. HILIC-ESI-FTMS with All Ion Fragmentation (AIF) Scans as a Tool for Fast Lipidome Investigations. Molecules. 2020; 25(10):2310. https://doi.org/10.3390/molecules25102310
Chicago/Turabian StyleVentura, Giovanni, Mariachiara Bianco, Cosima Damiana Calvano, Ilario Losito, and Tommaso R. I. Cataldi. 2020. "HILIC-ESI-FTMS with All Ion Fragmentation (AIF) Scans as a Tool for Fast Lipidome Investigations" Molecules 25, no. 10: 2310. https://doi.org/10.3390/molecules25102310