
1H-NMR Metabolomics Analysis of the Effects of Sulfated Polysaccharides from Masson Pine Pollen in RAW264.7 Macrophage Cells


Abstract
:1. Introduction
2. Material and Methods
2.1. Materials and Reagents
2.2. Instrument
2.3. Effects of SPPM60-D on RAW264.7 Cell Proliferation
2.4. 1H-NMR Metabolomics Analysis of the Effects of SPPM60-D on RAW264.7 Cells
2.5. Data Analysis
3. Results
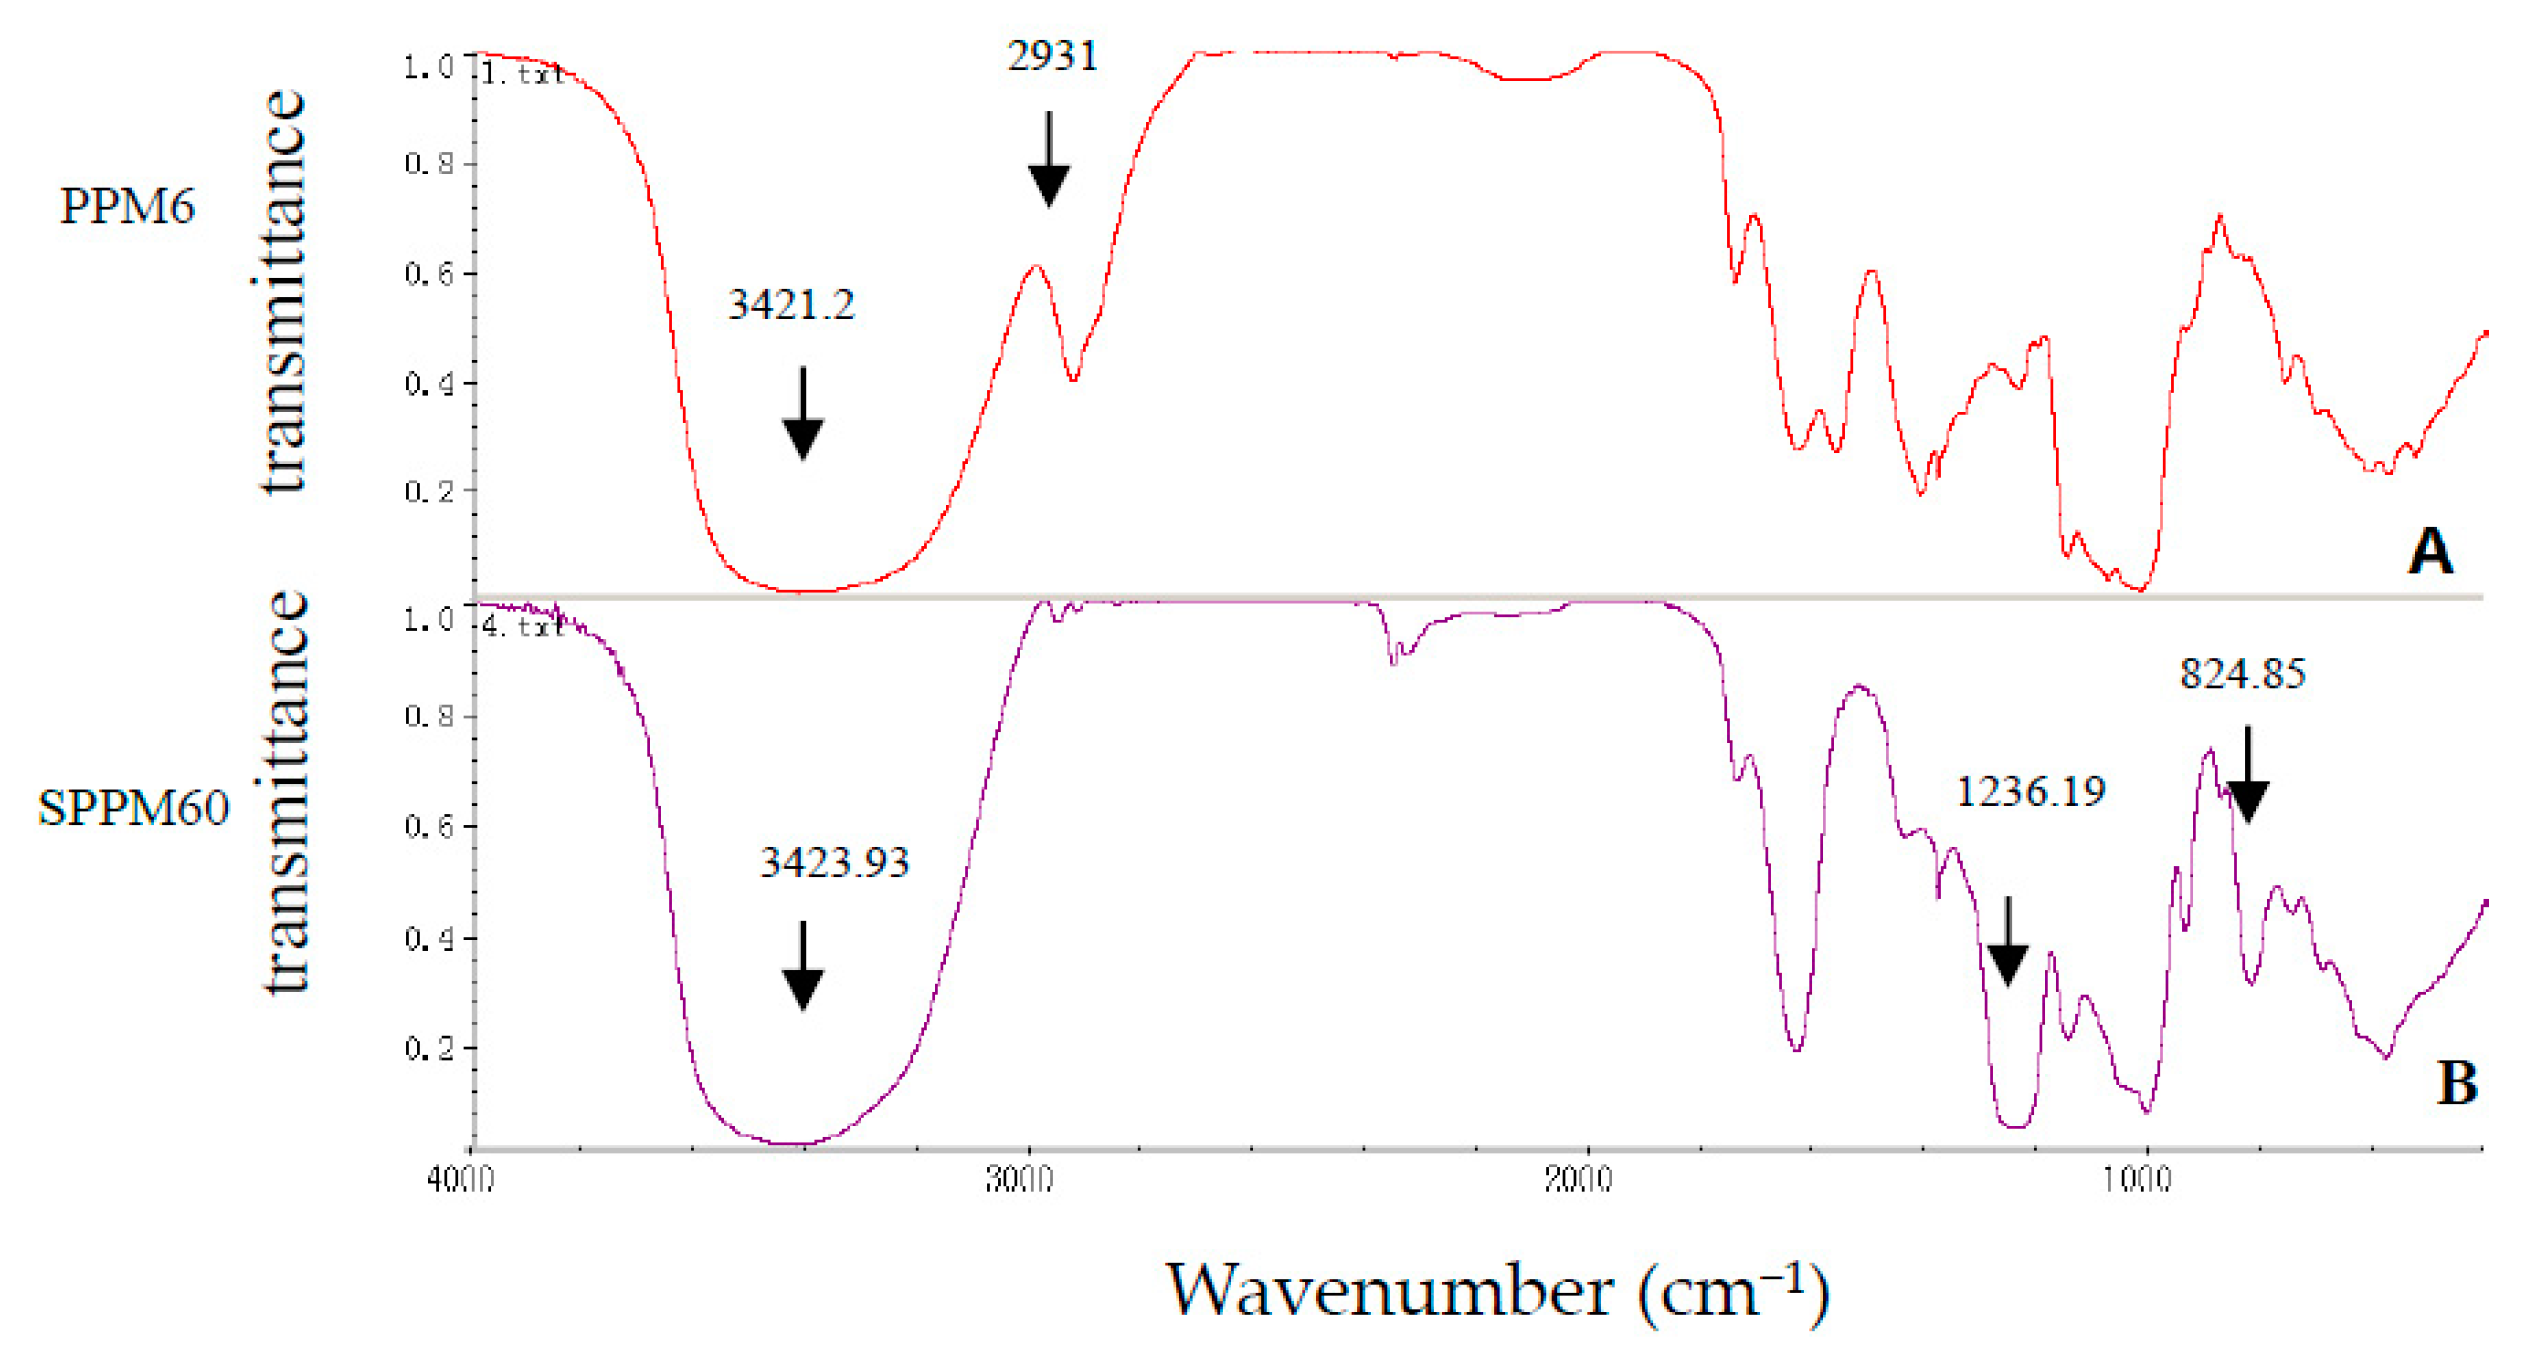
3.1. SPPM60-D Characterization
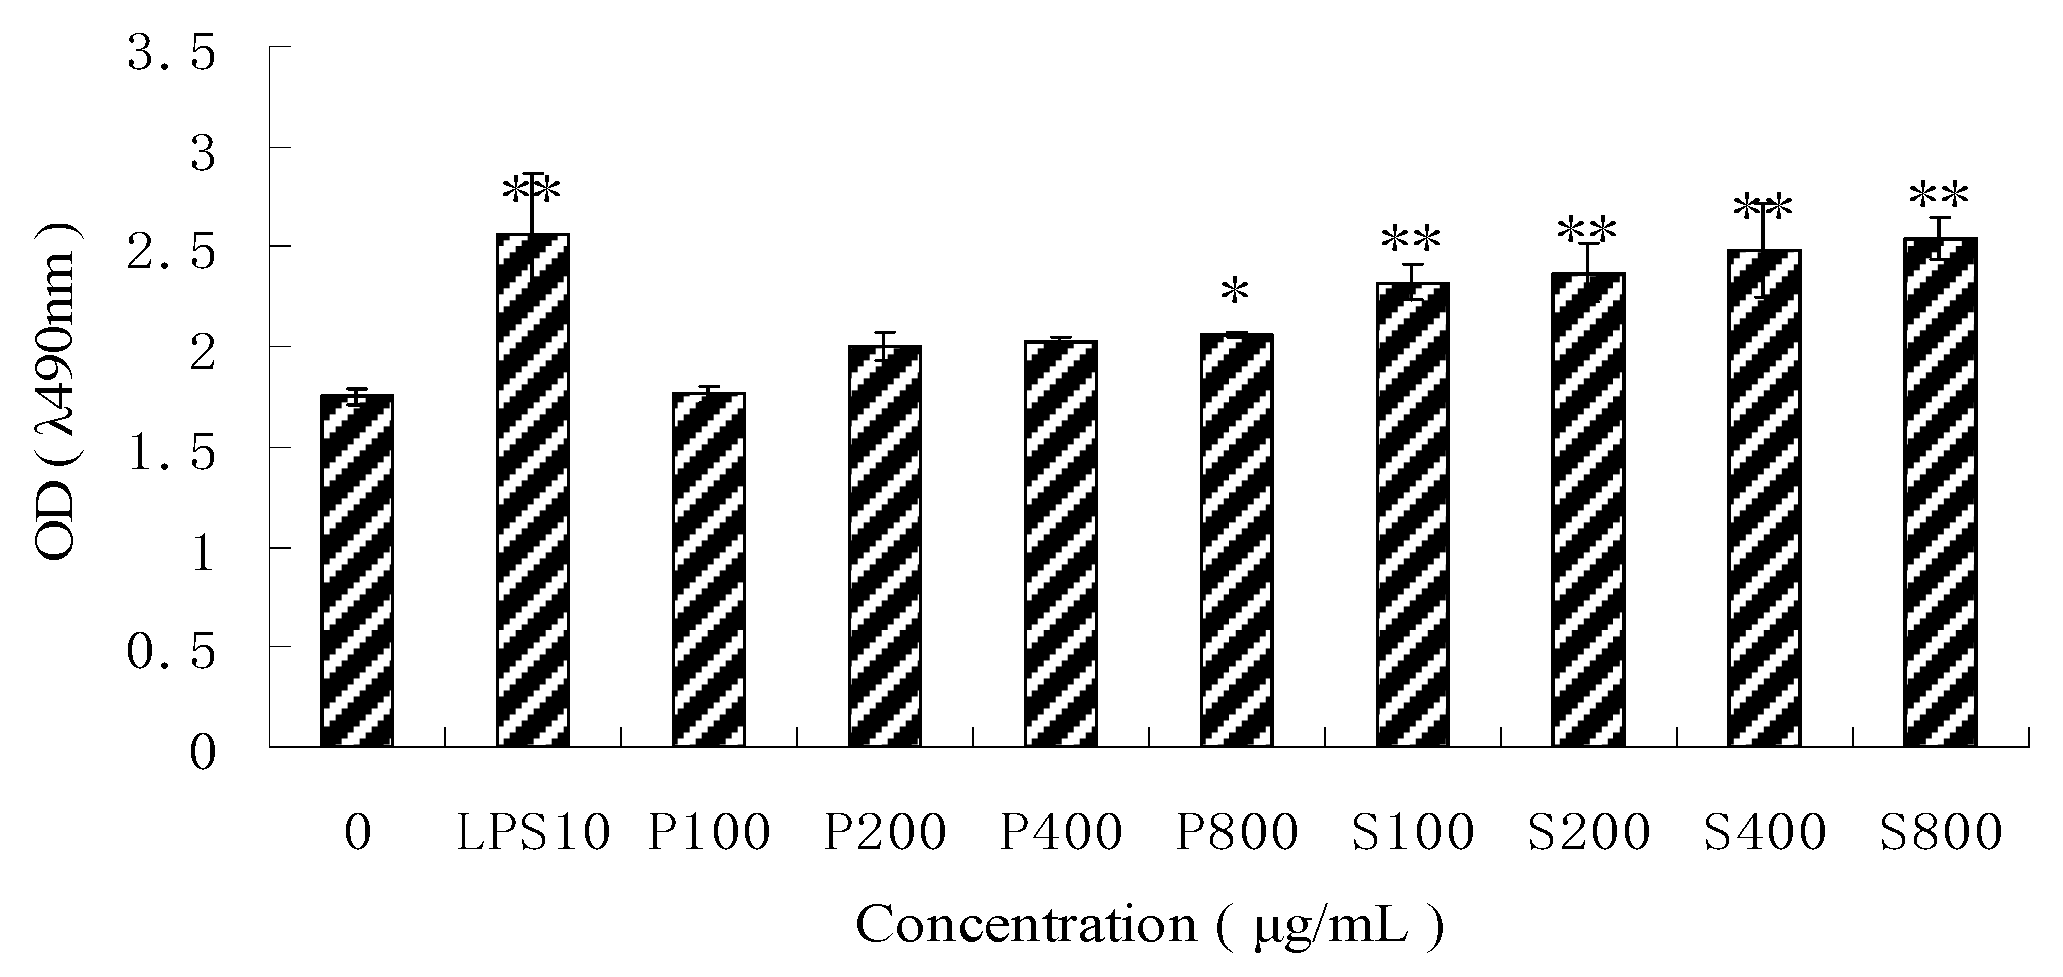
3.2. Effects of PPM60-D and SPPM60-D on RAW264.7 Cell Proliferation
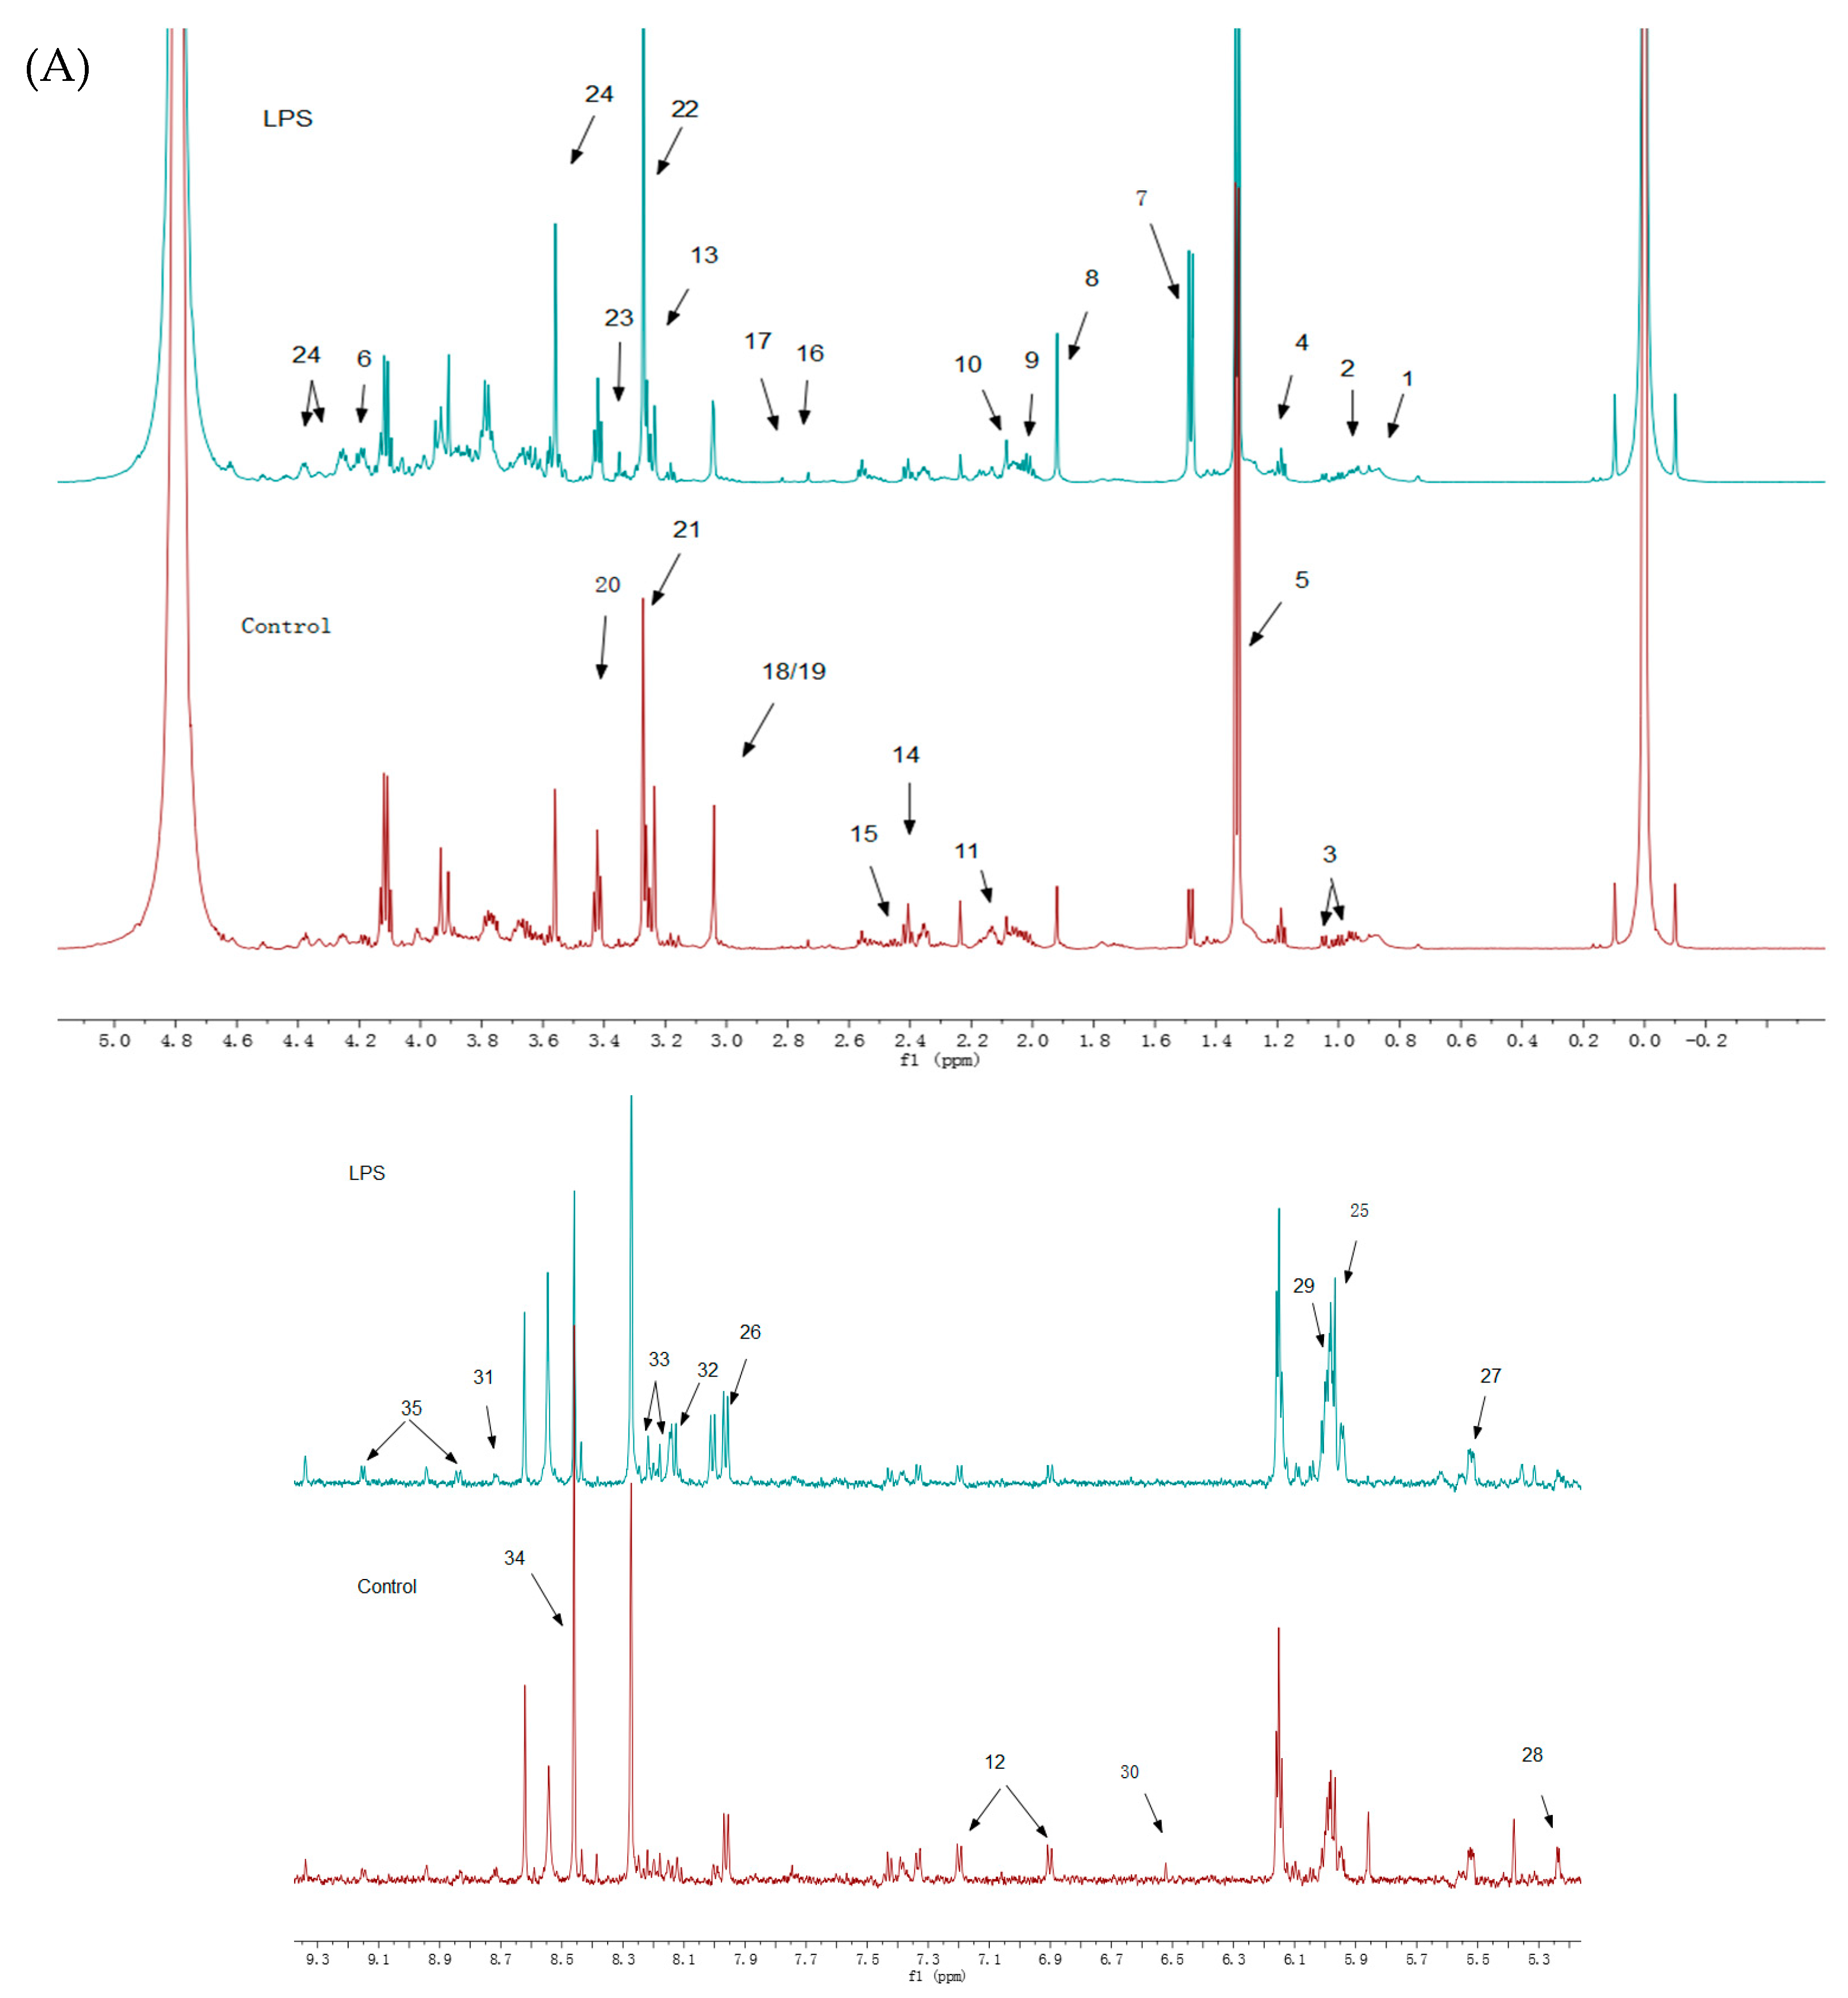
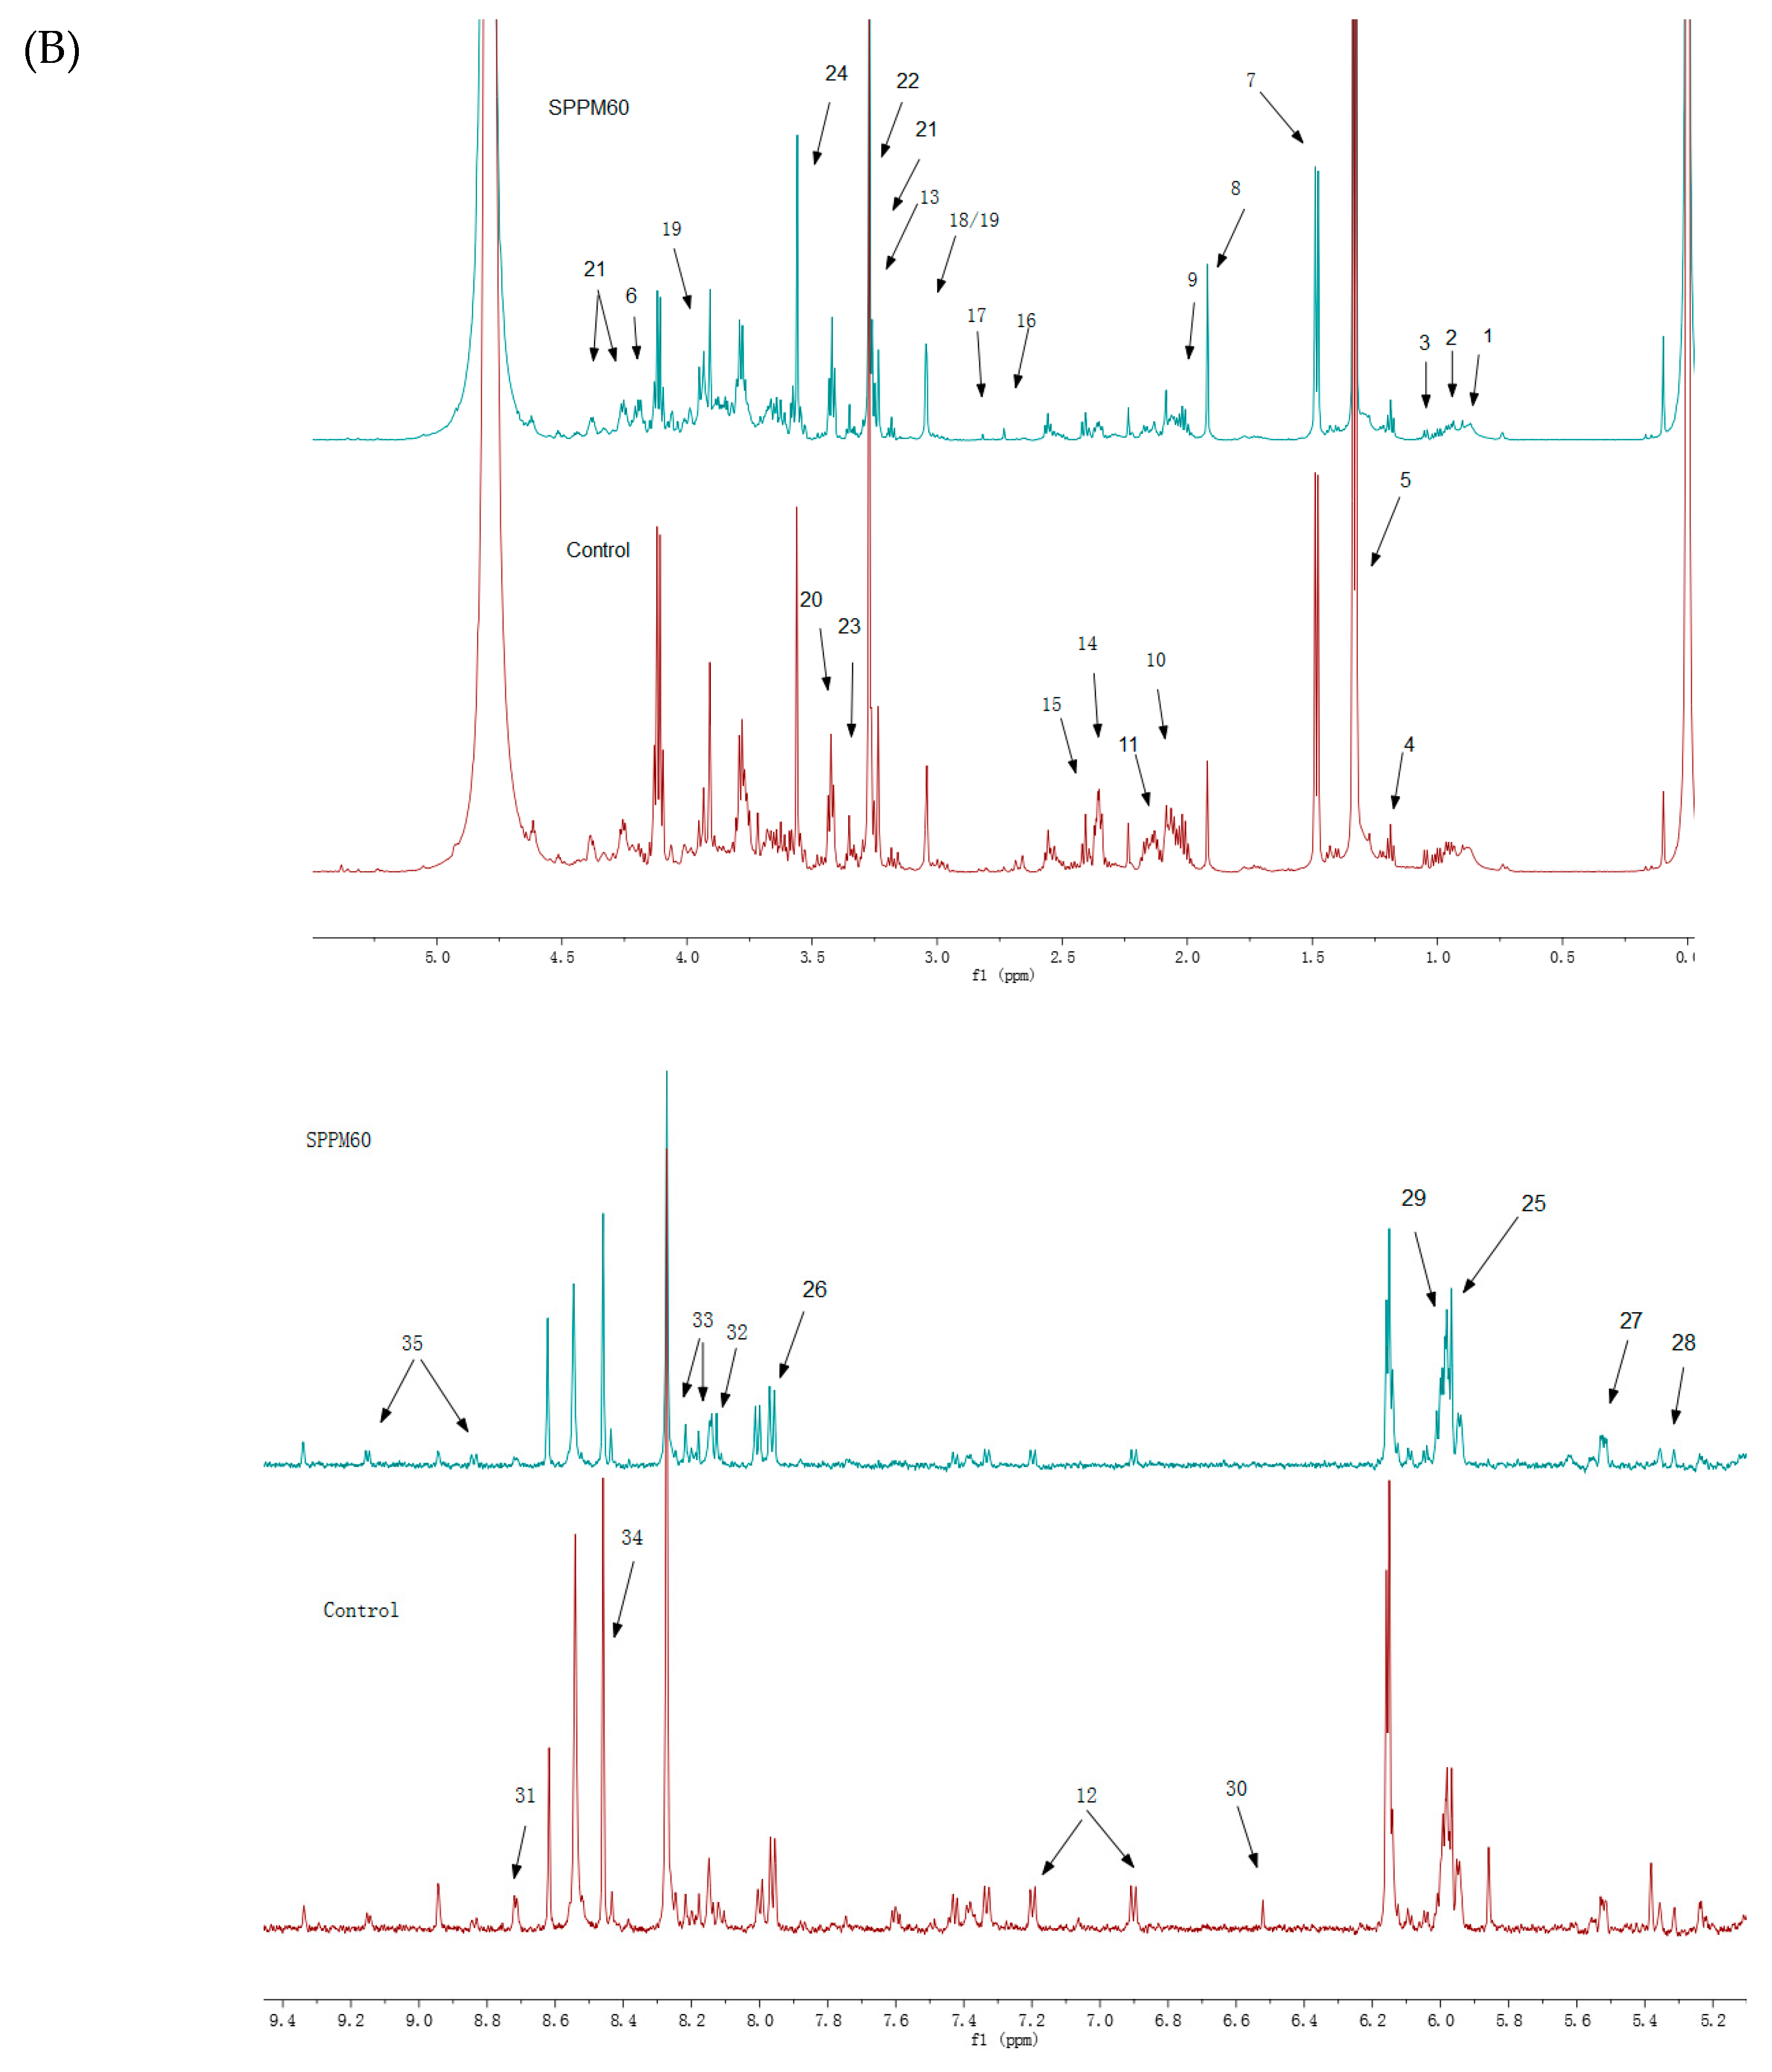
3.3. Intracellular Metabolites Identified by Nuclear Magnetic Resonance Spectroscopy (NMR)
3.4. Data Analysis
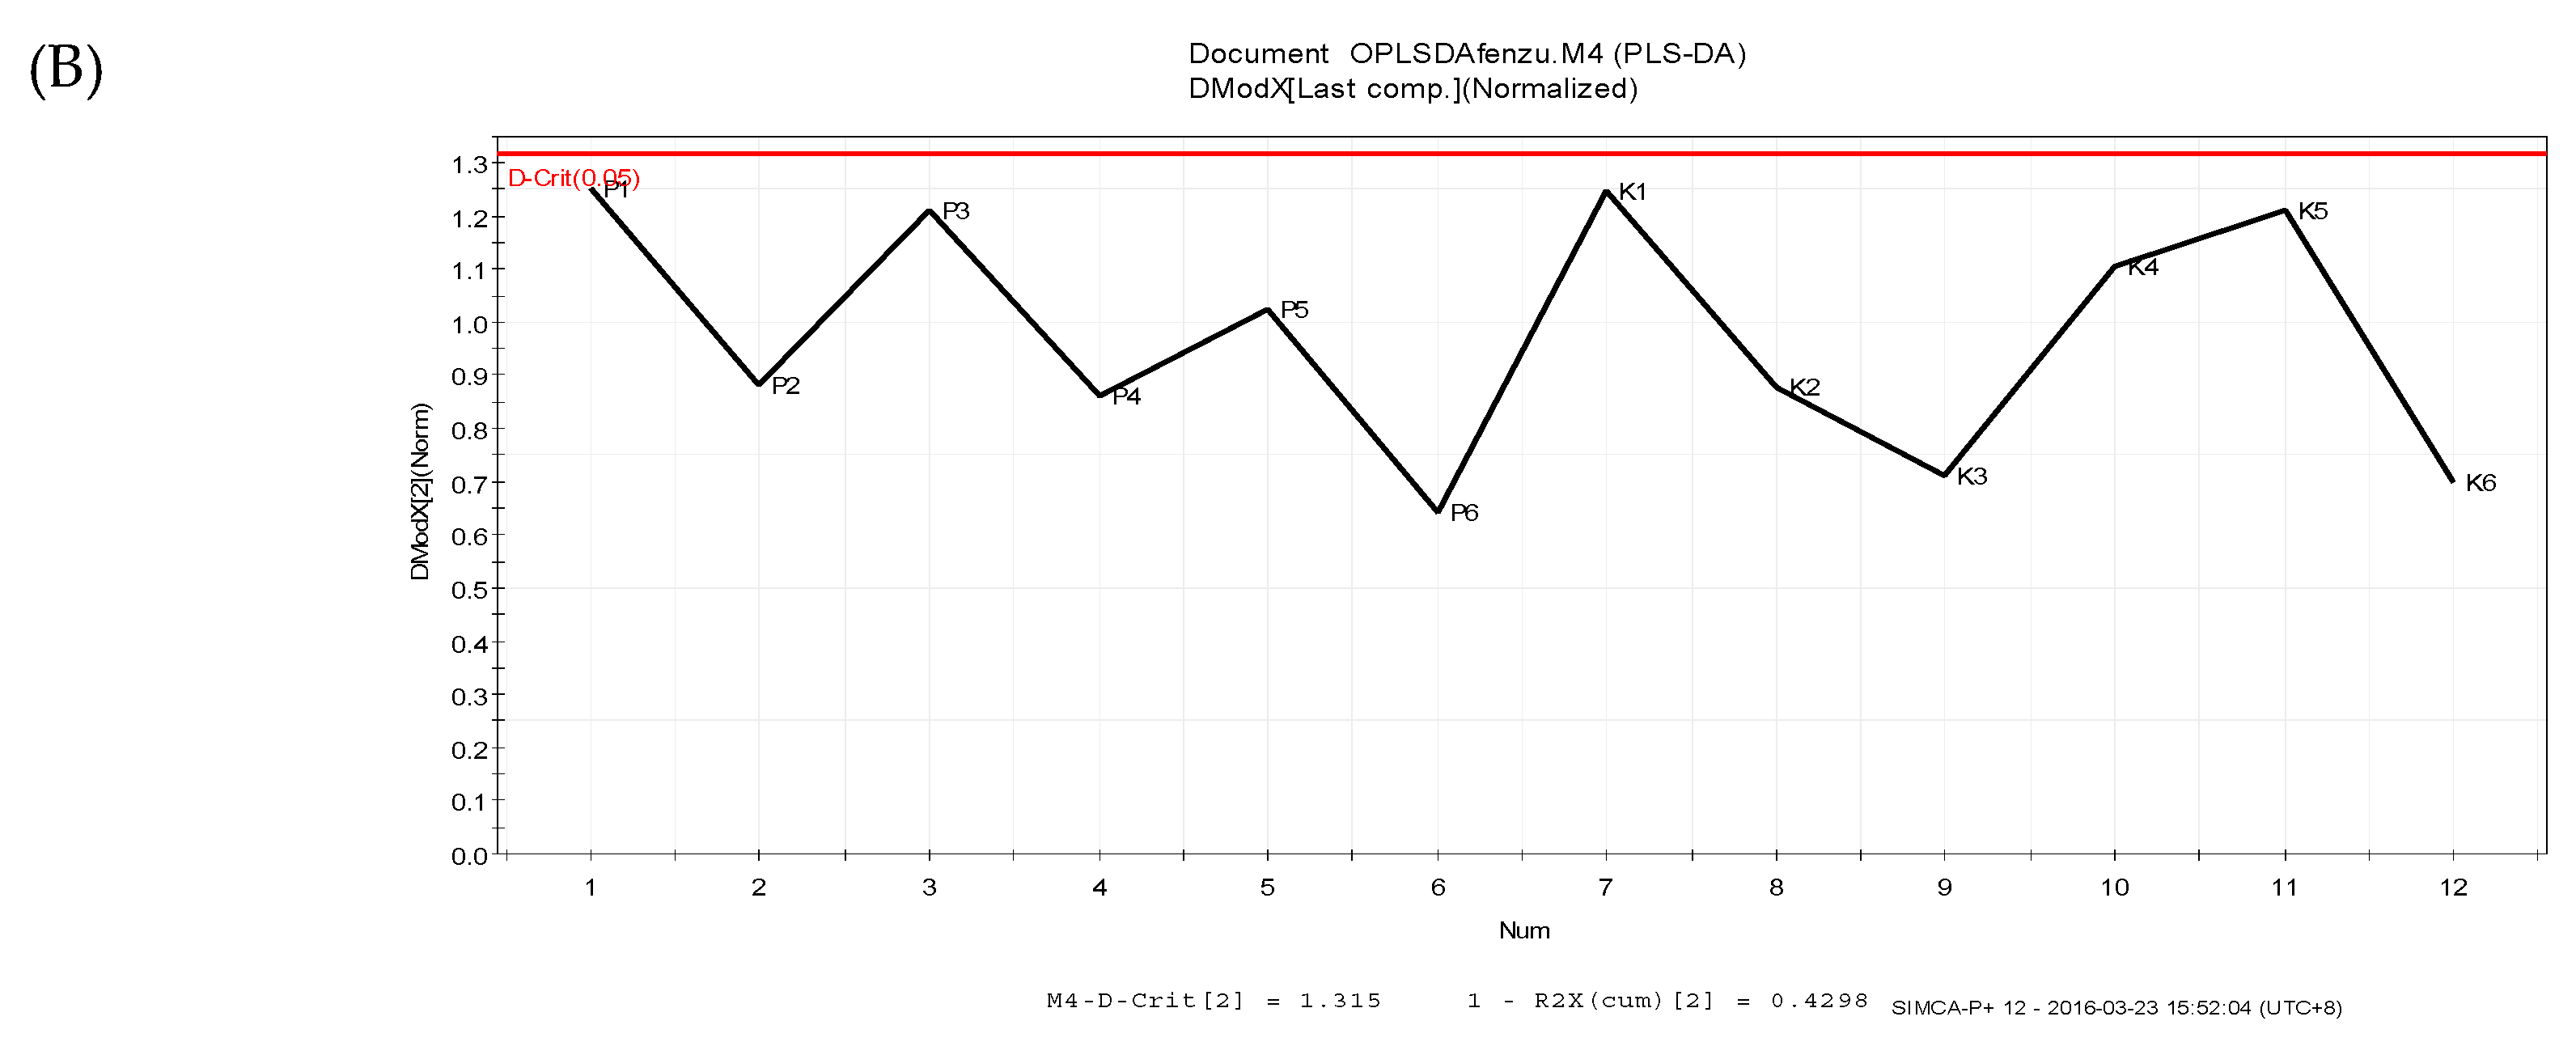
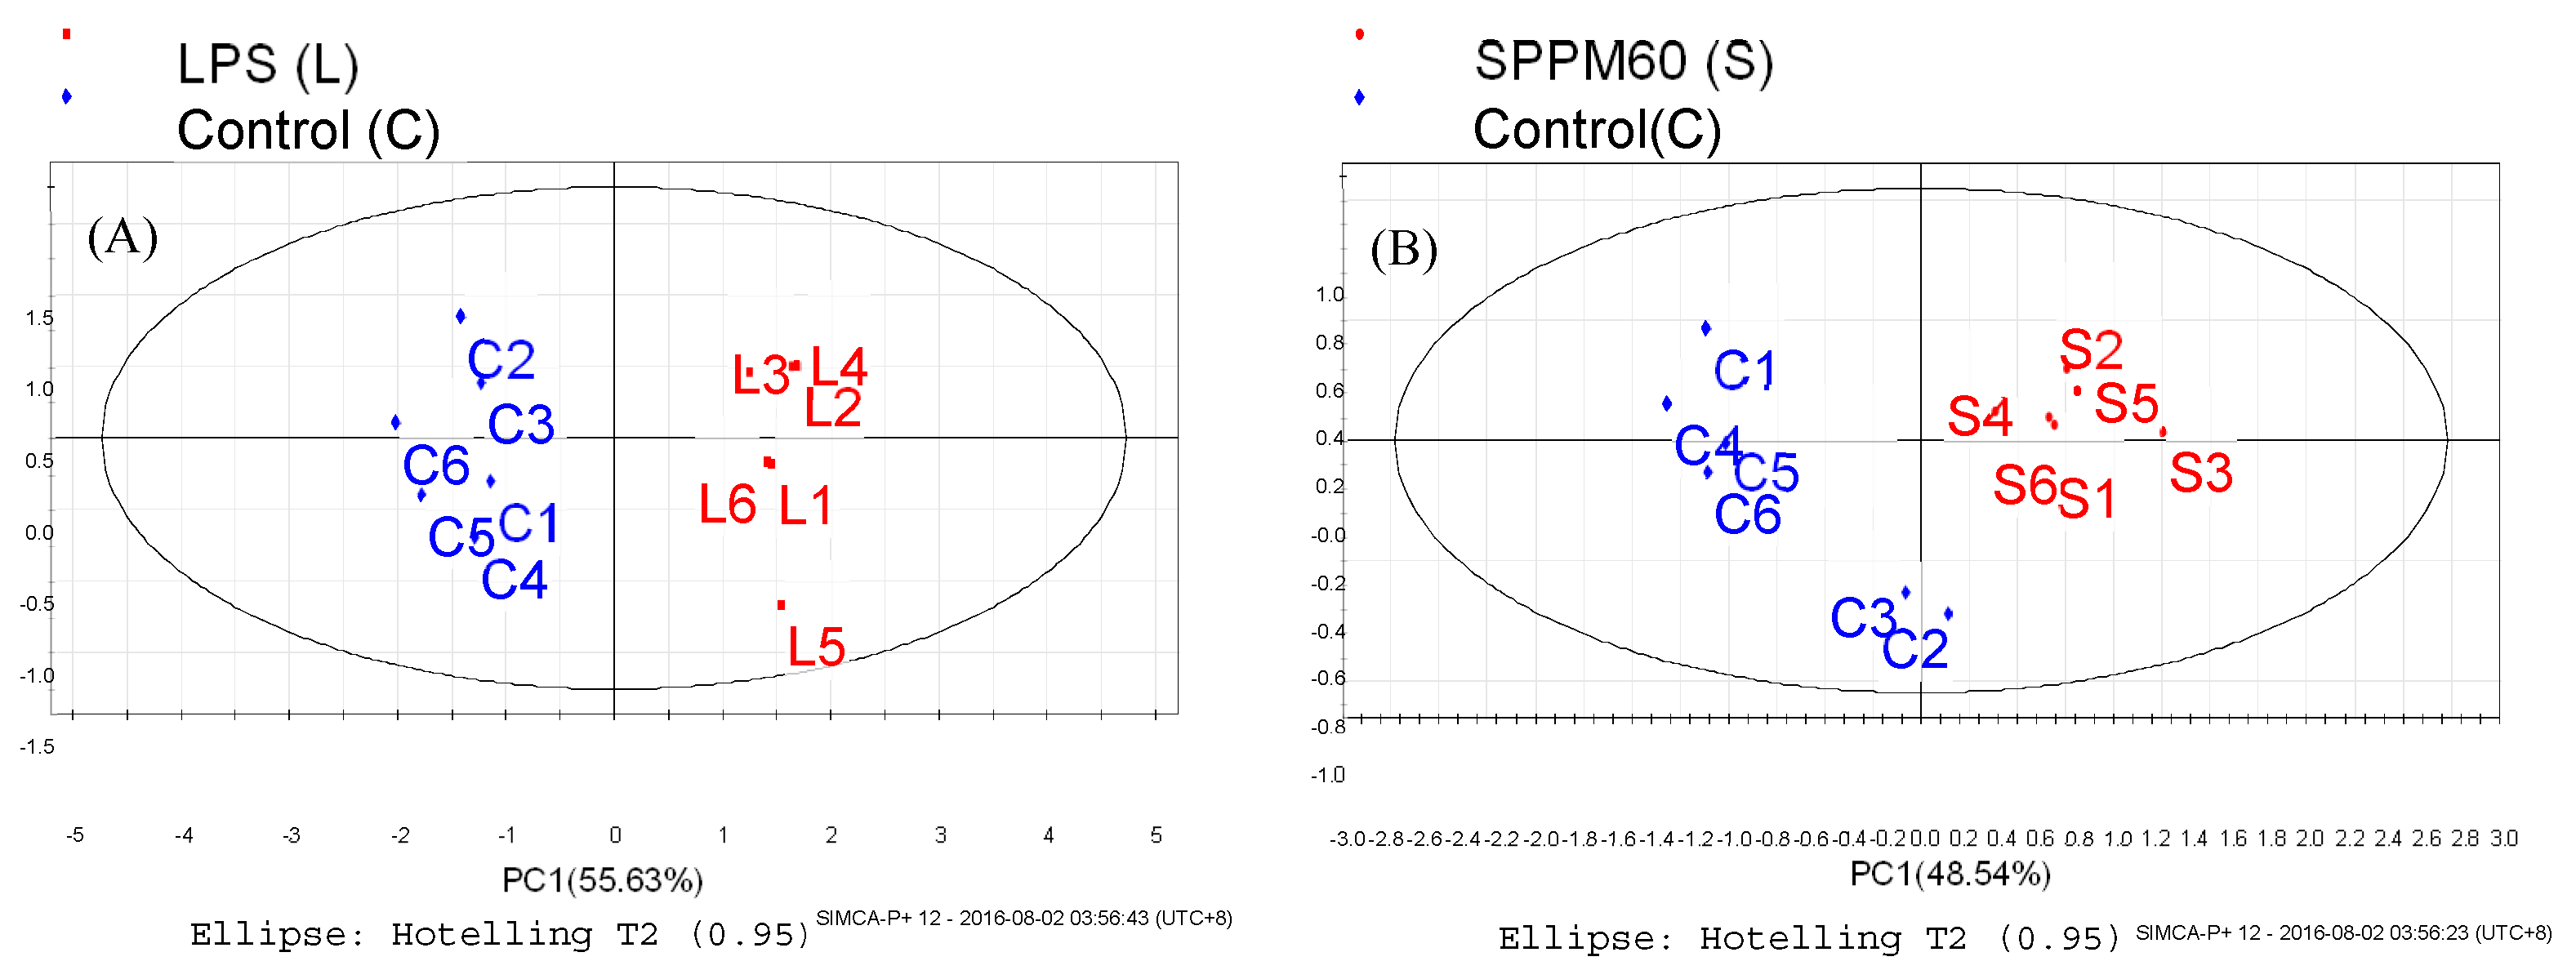
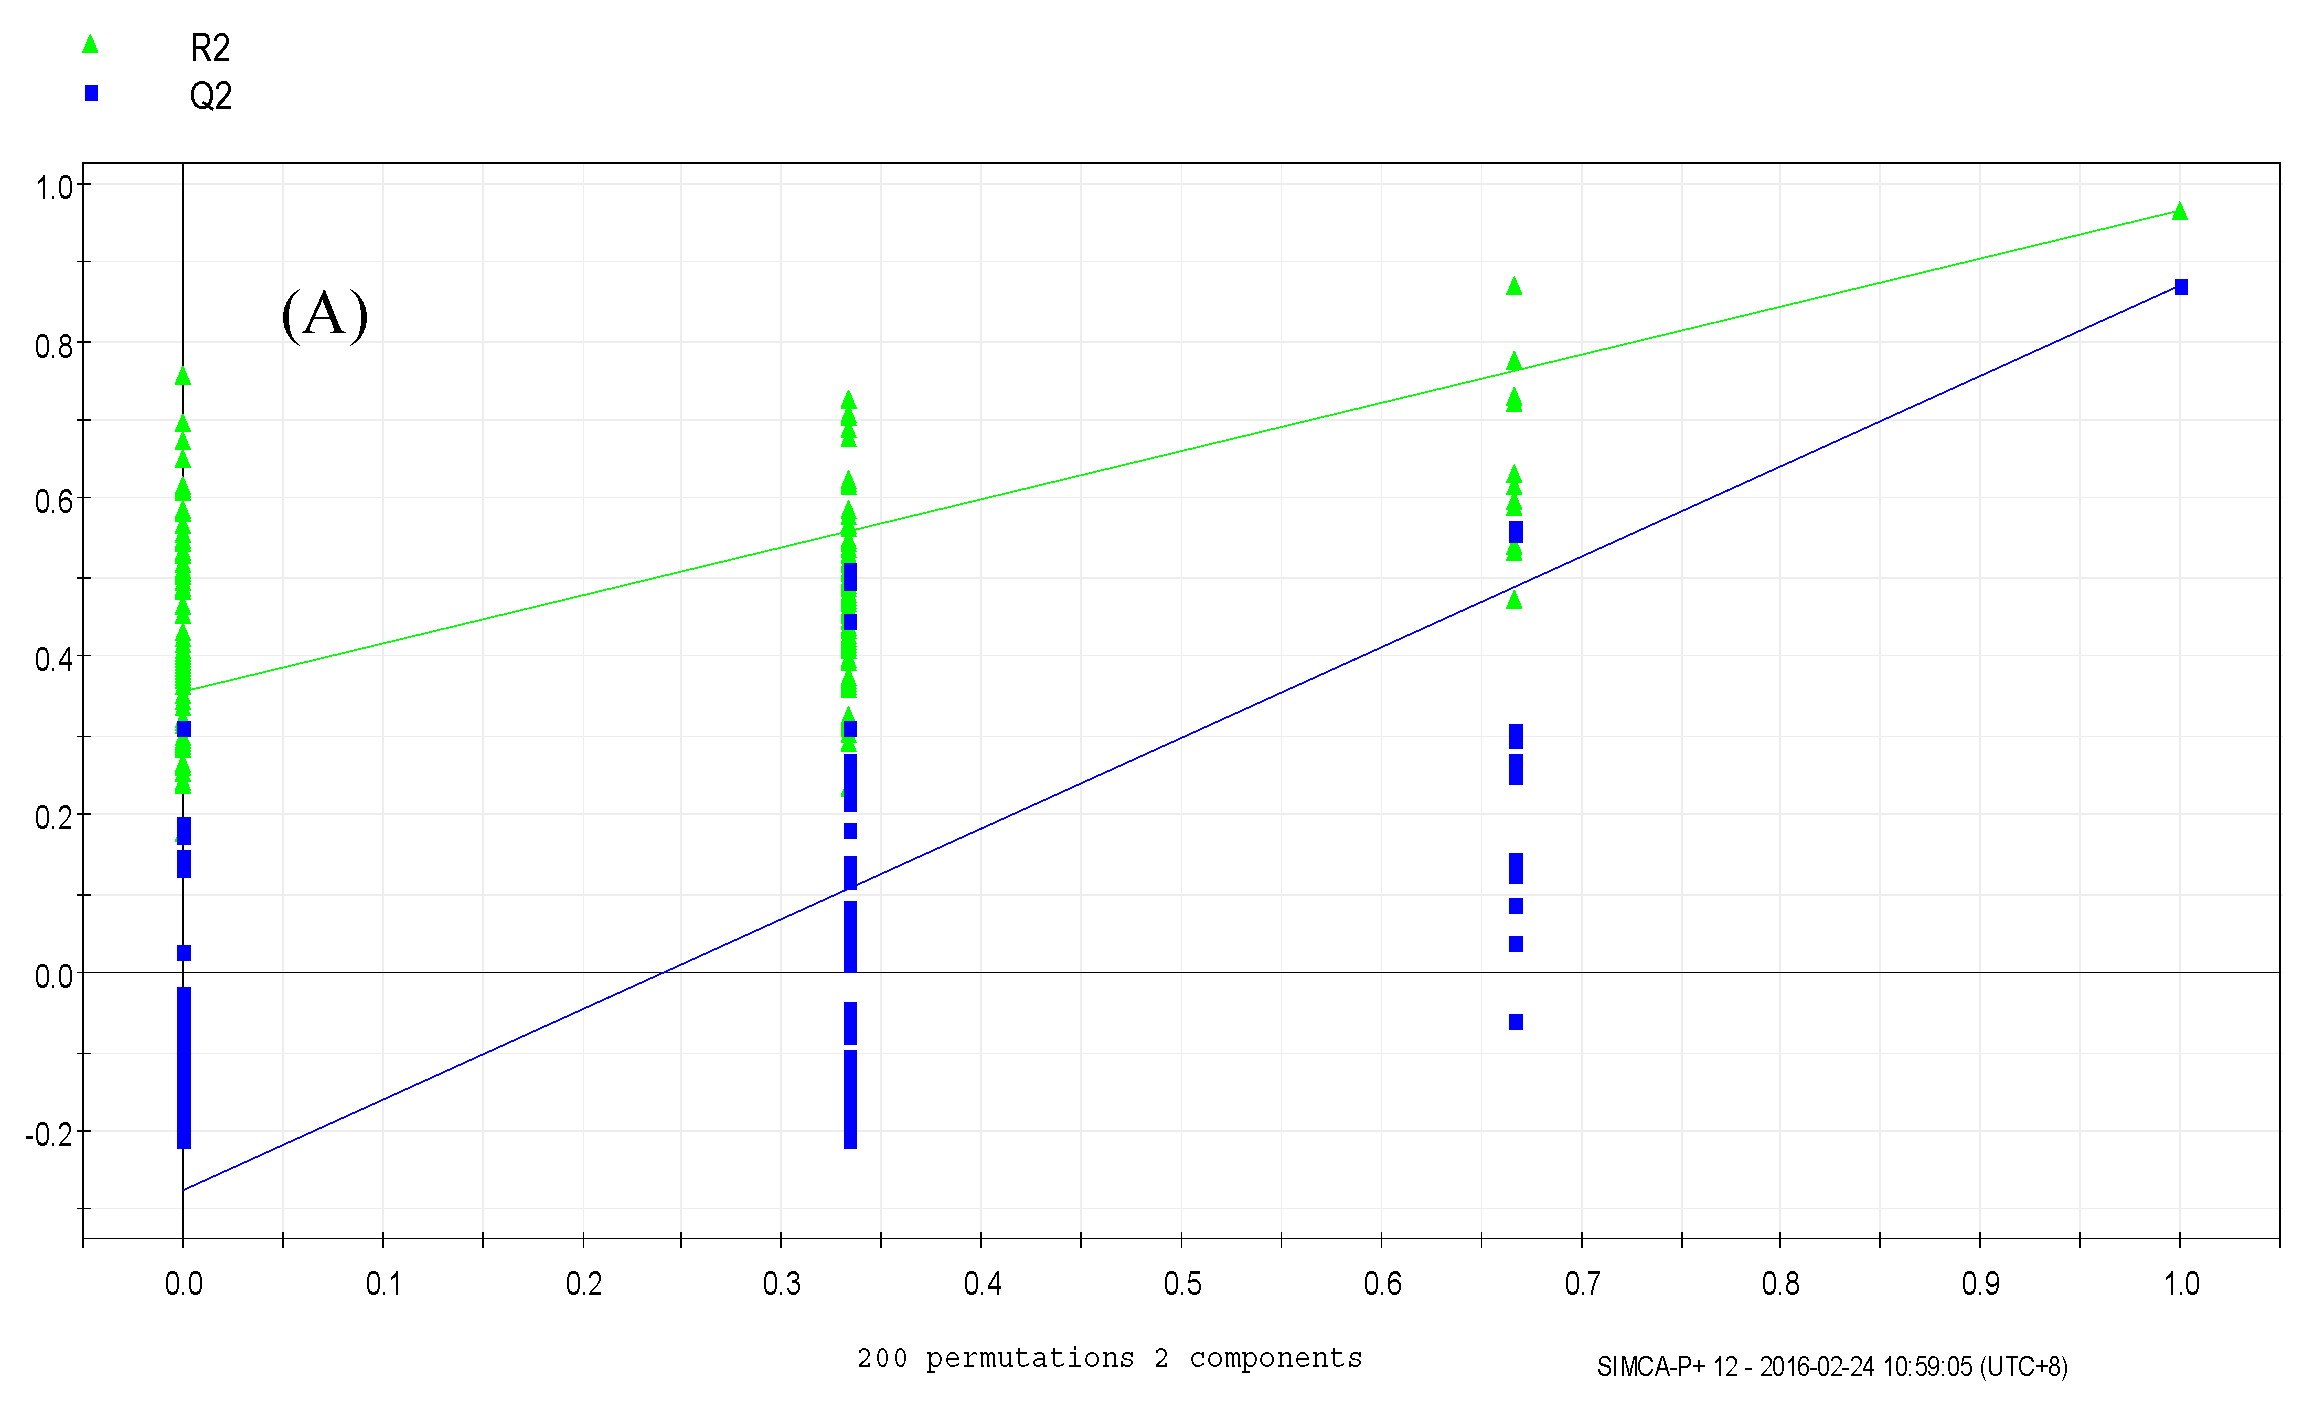
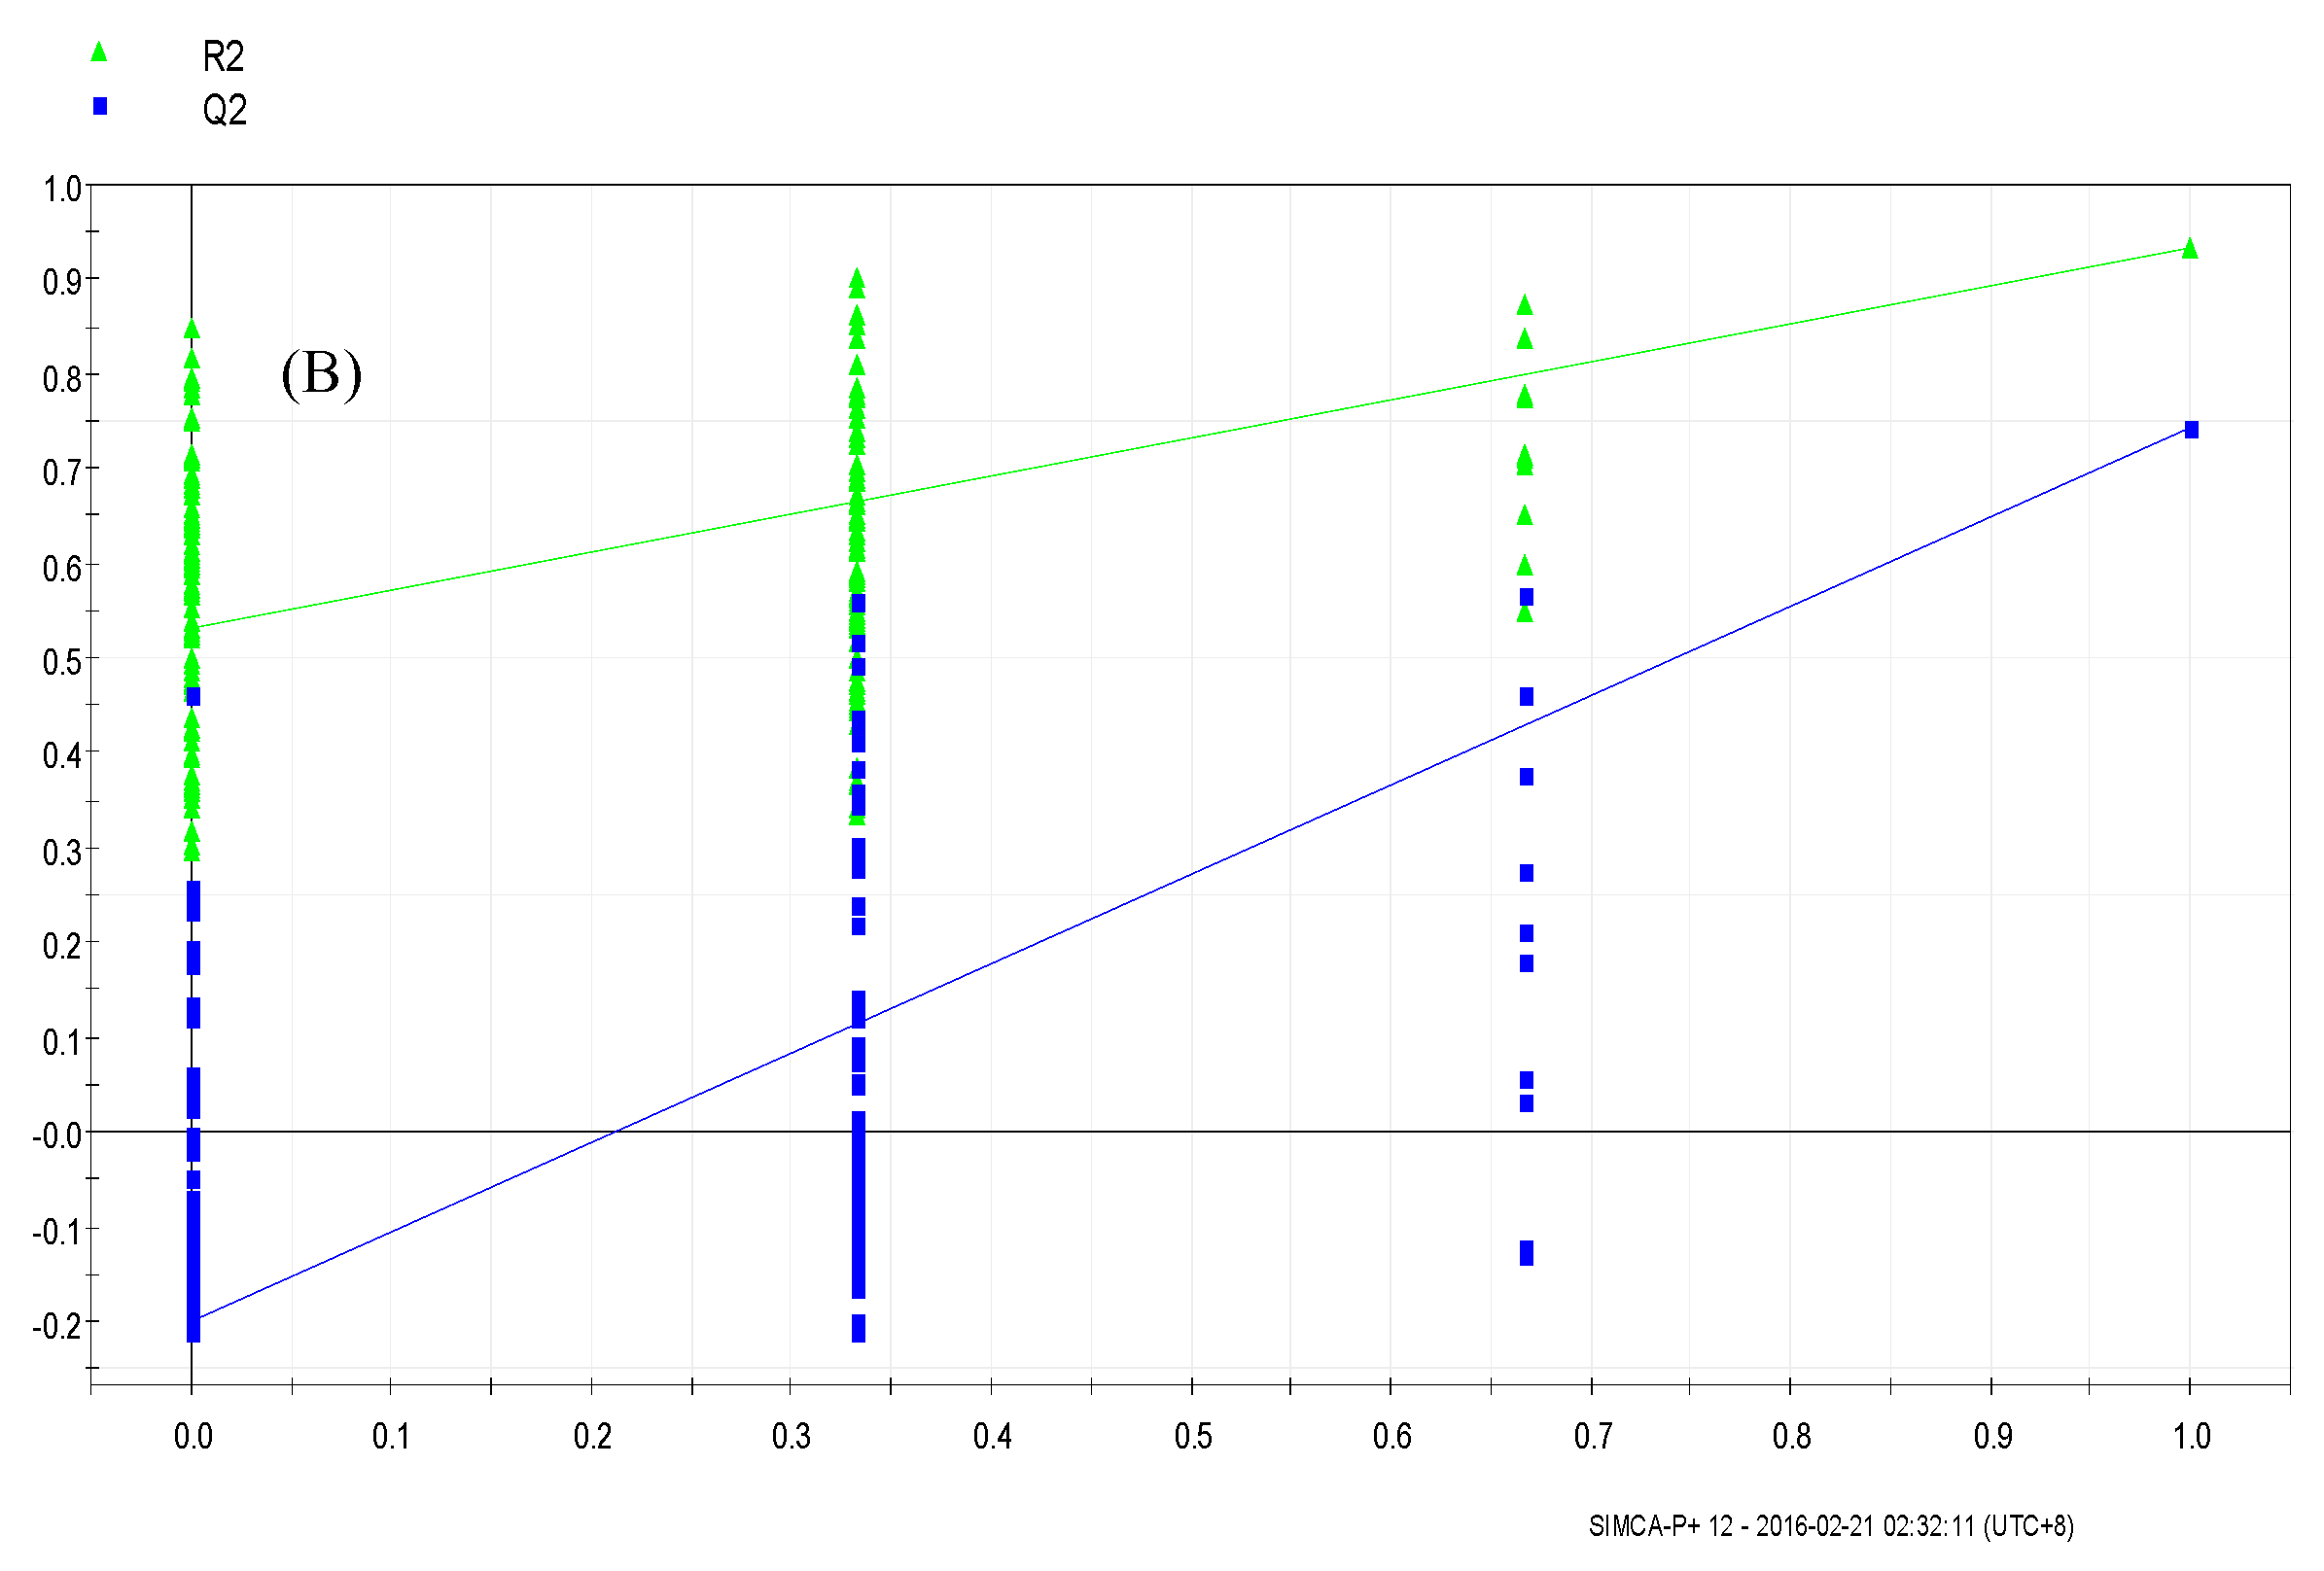
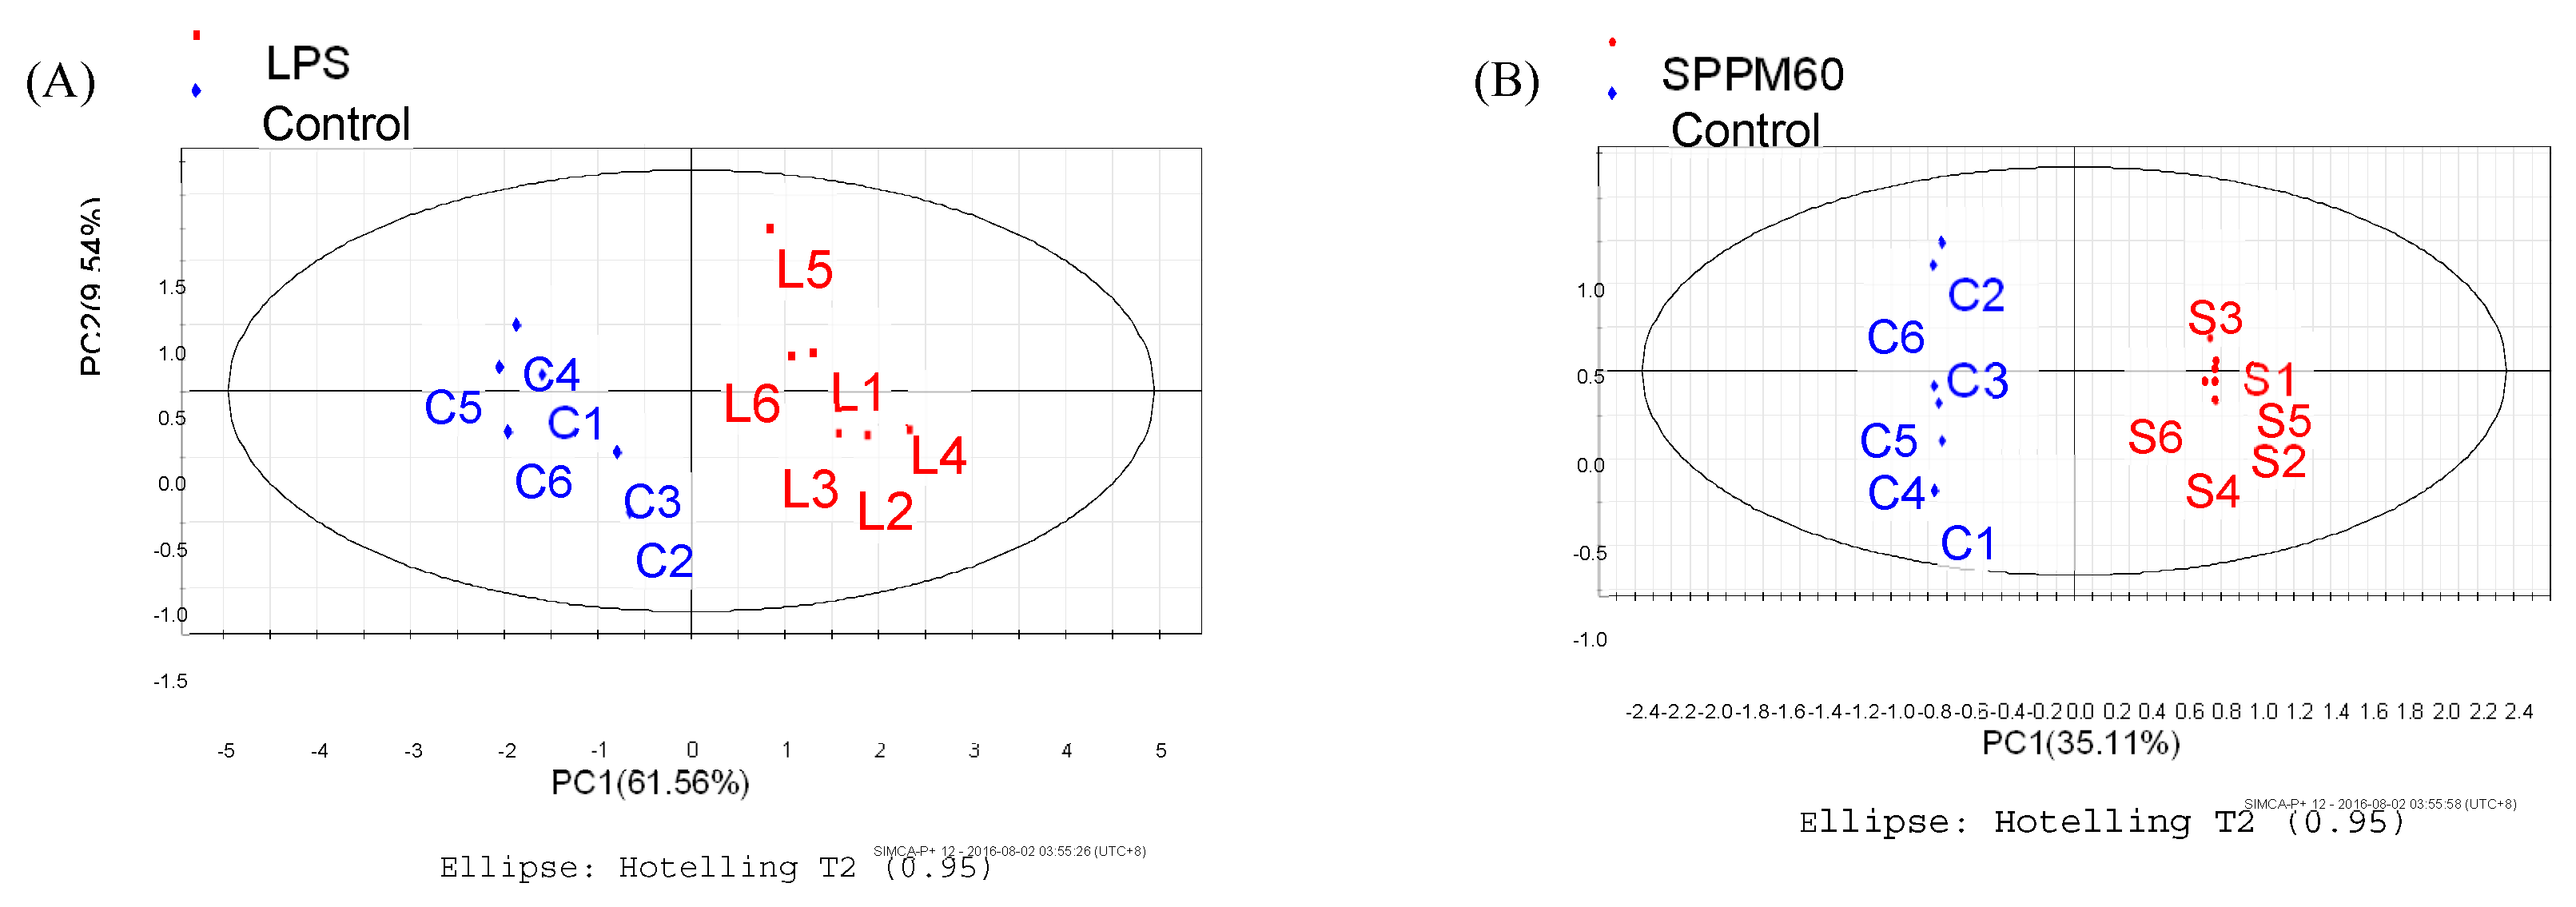
3.4.1. Supervised Partial Least Squares Discriminate Analysis (PLS-DA)
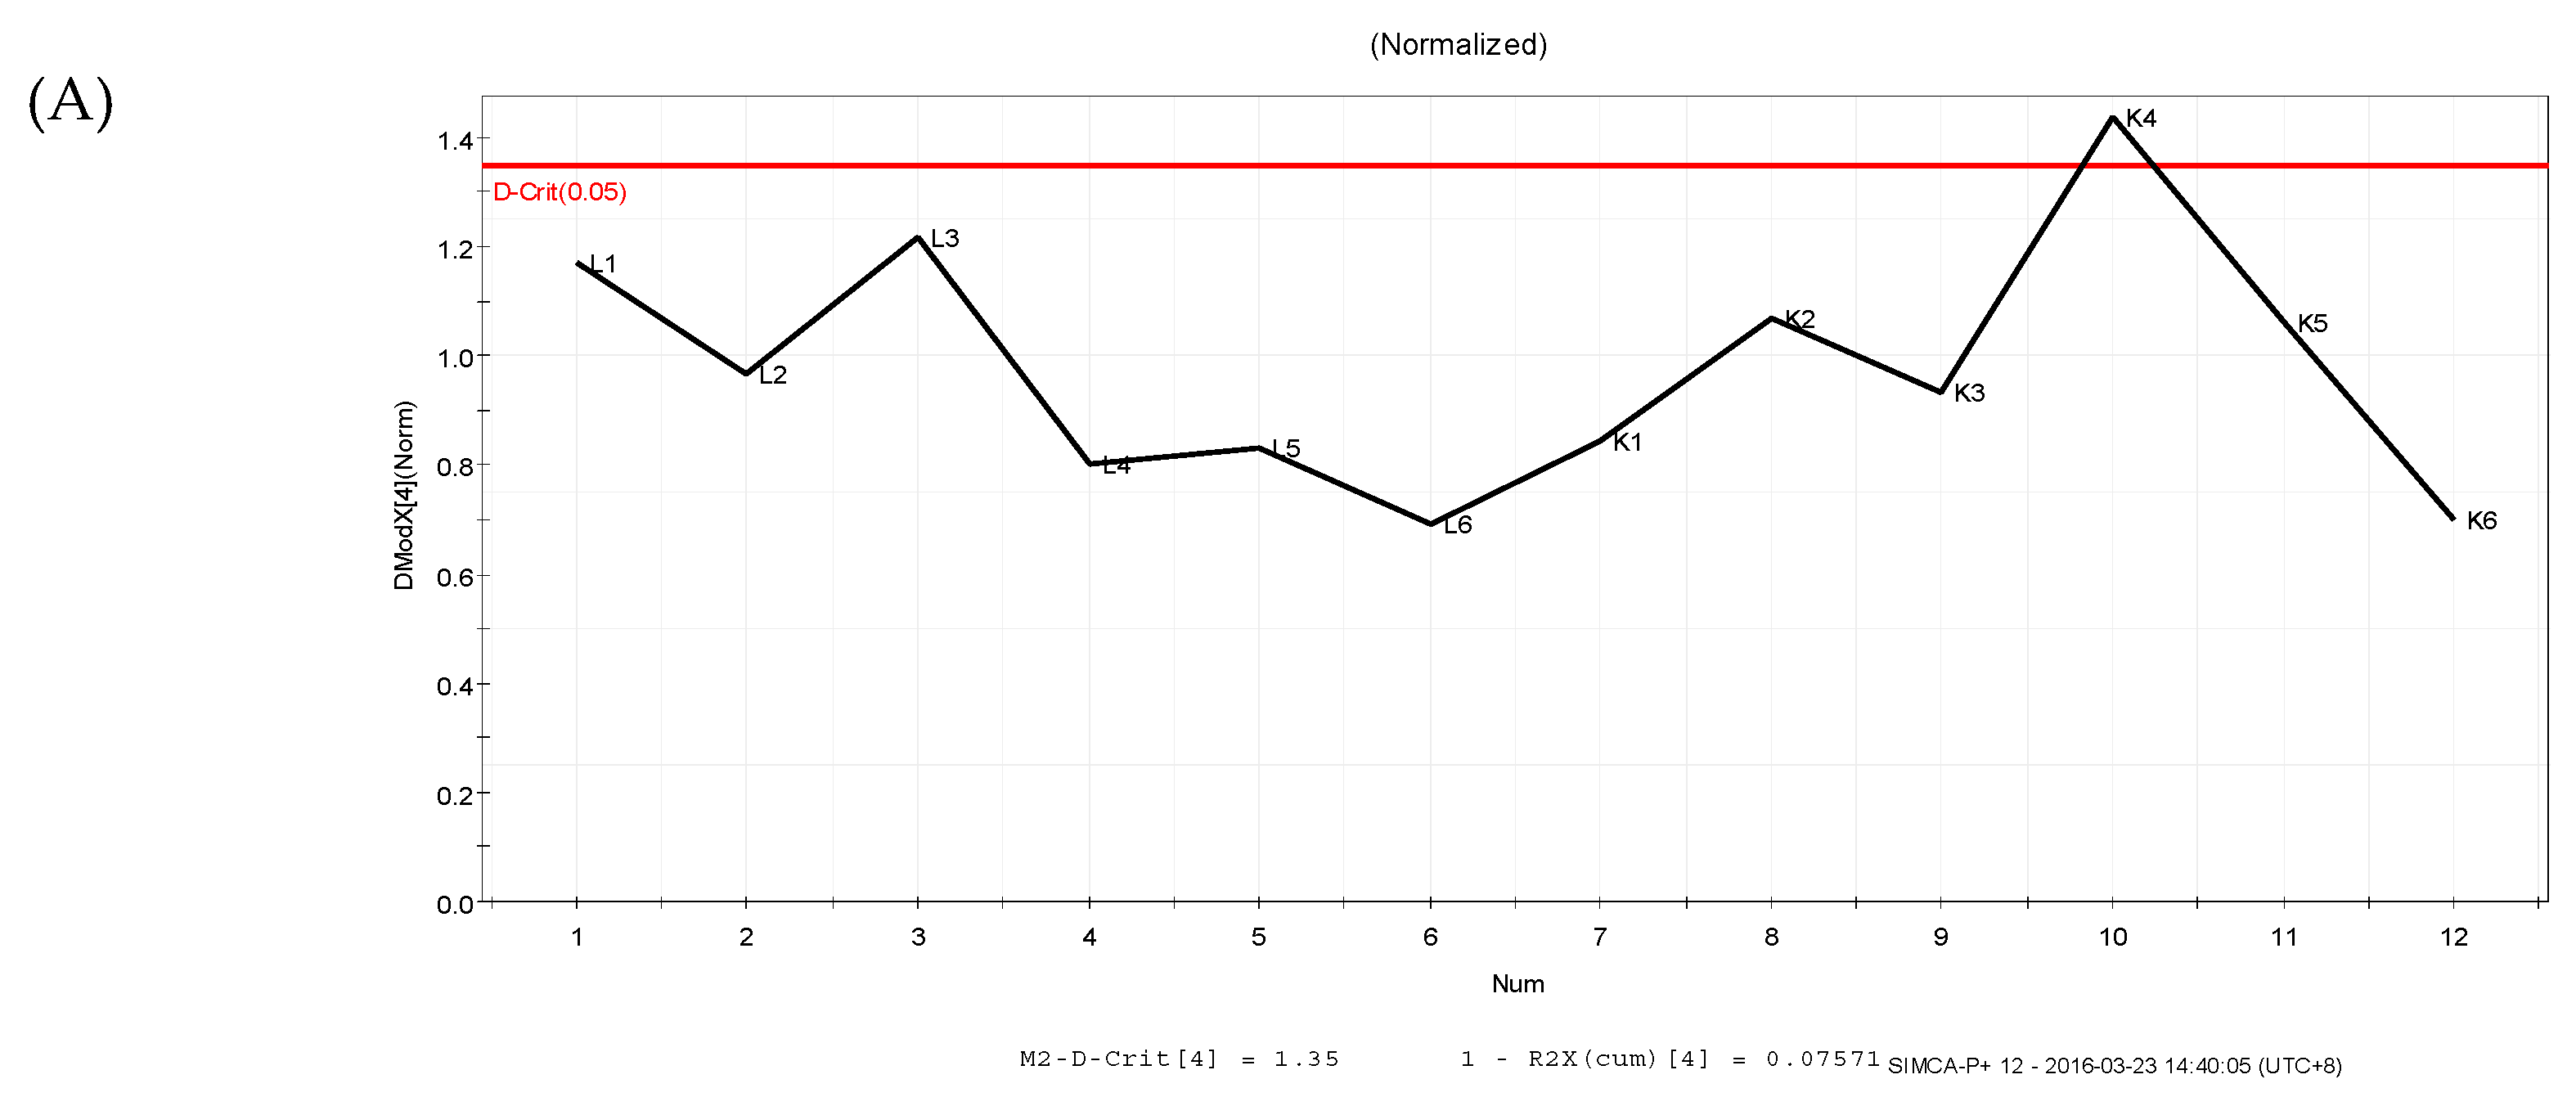
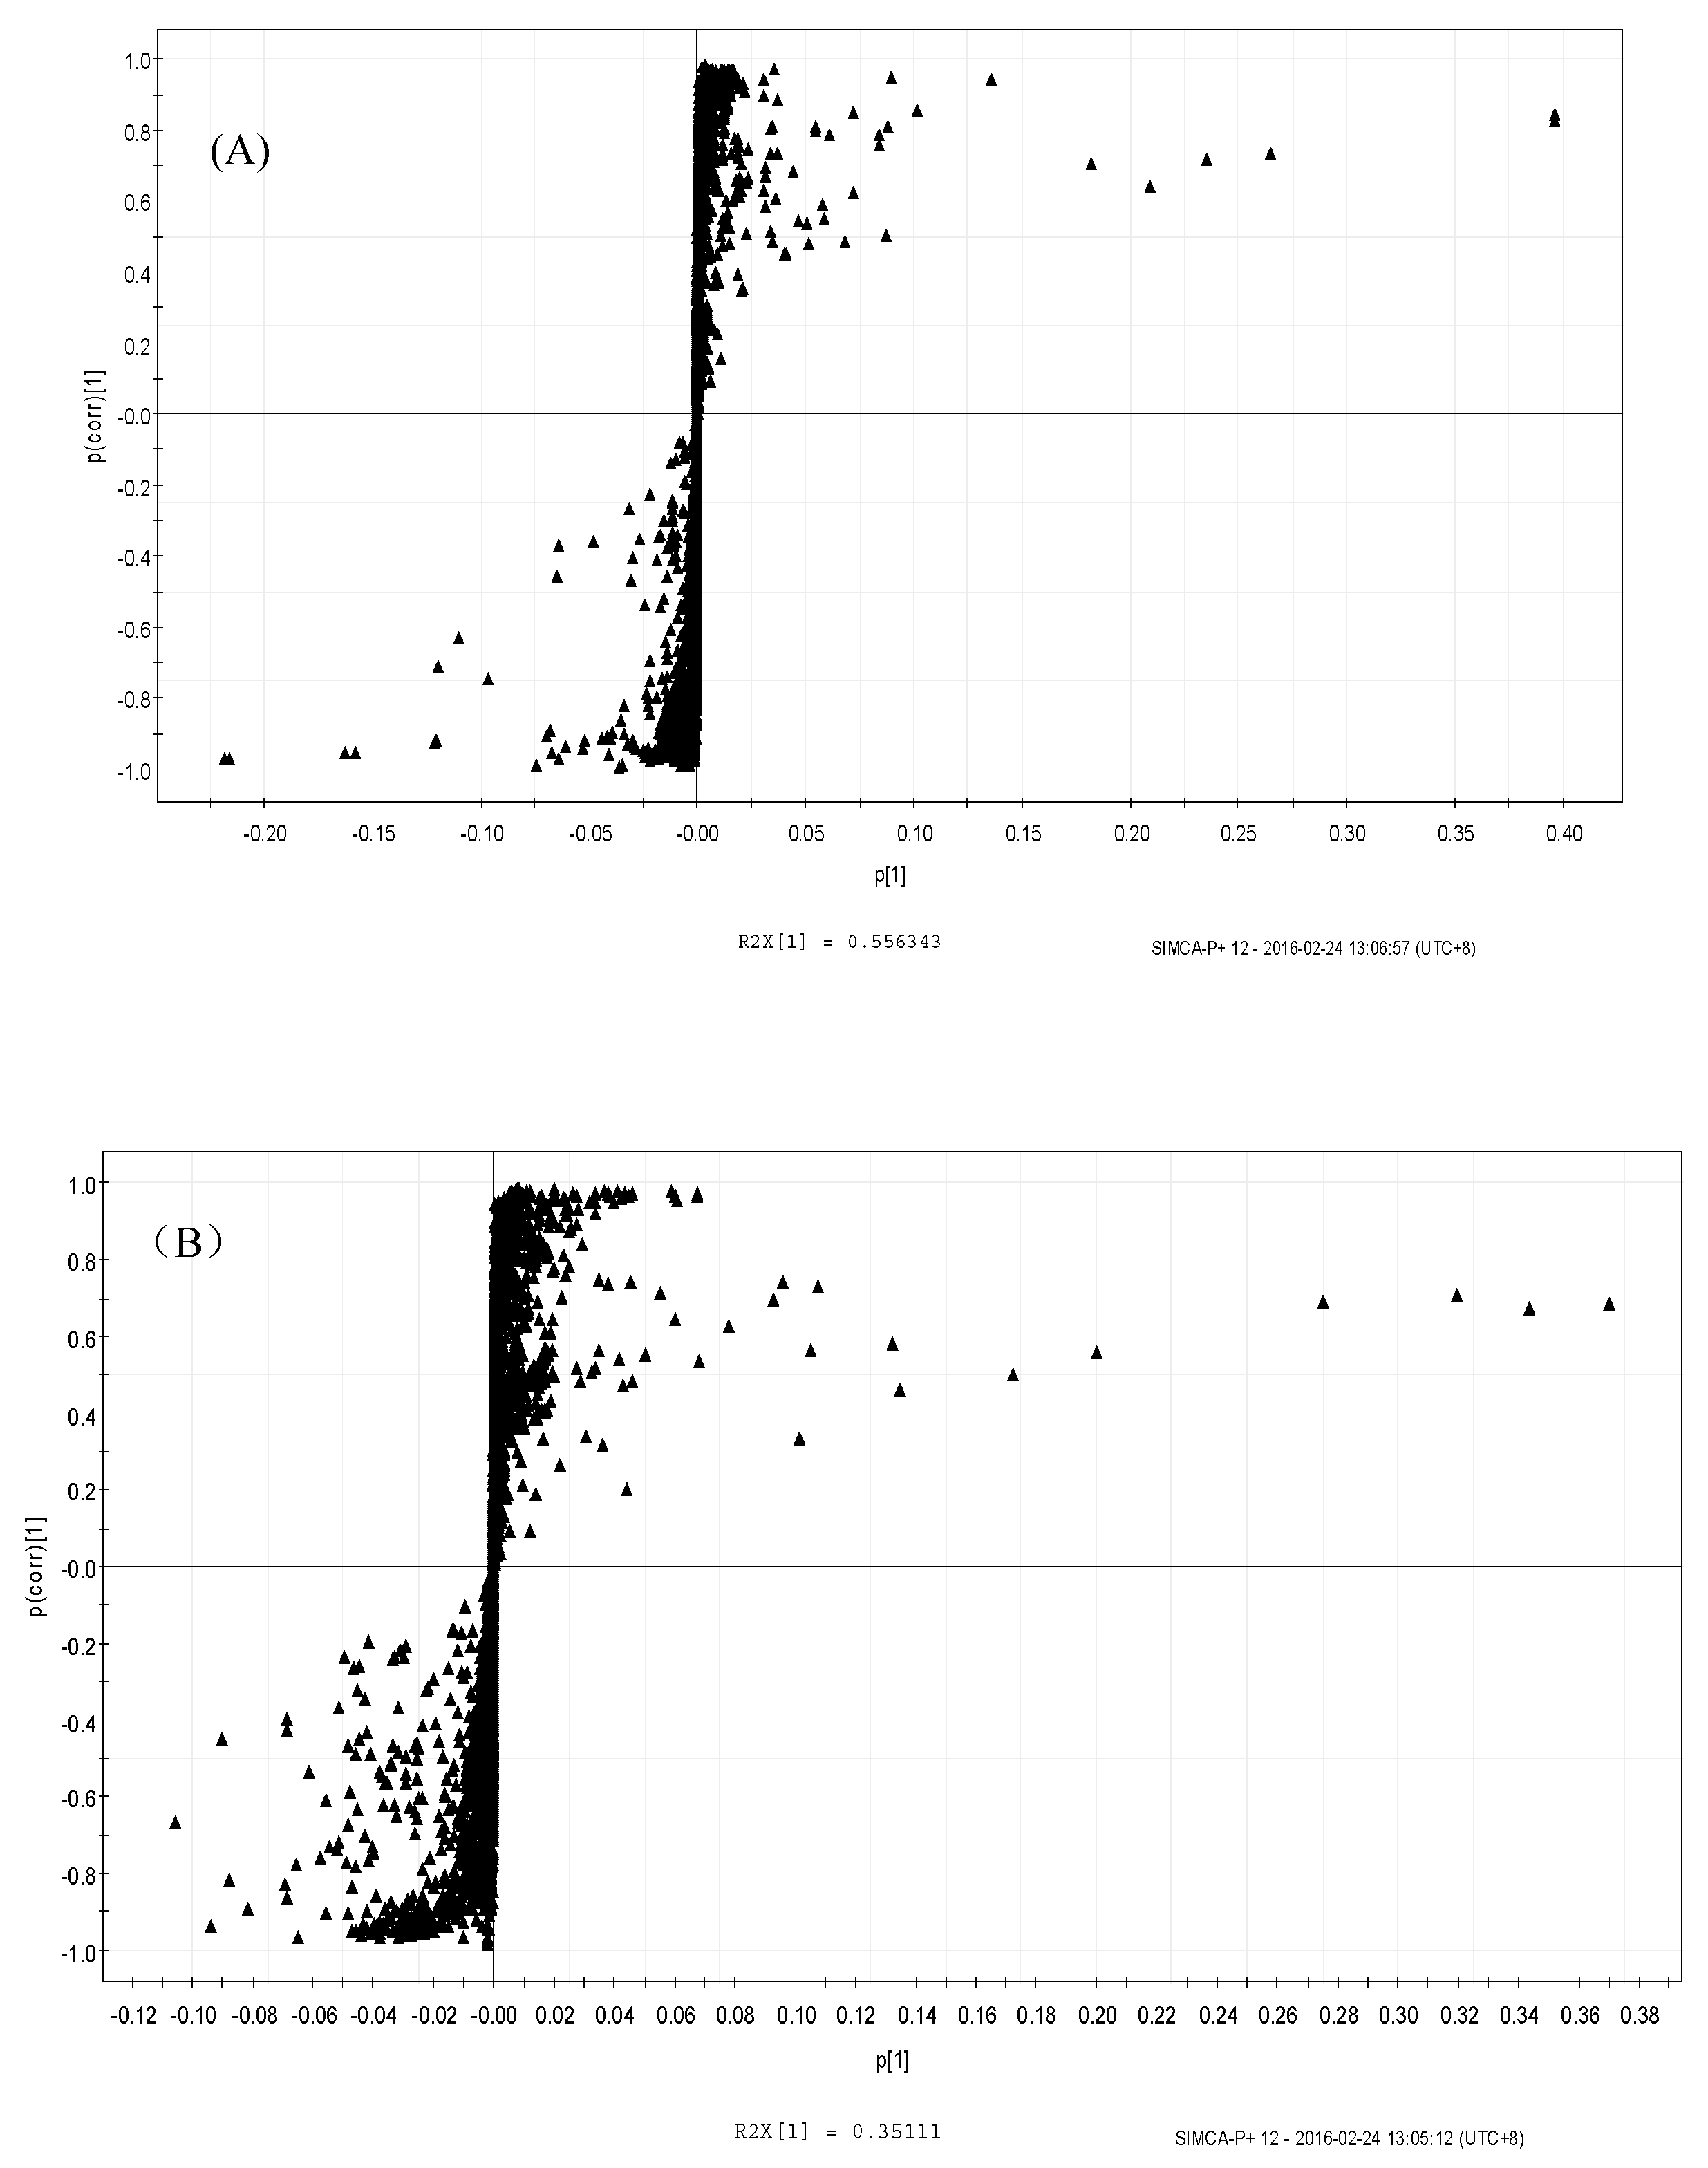
3.4.2. Orthogonal Partial Least Squares Discriminant Analysis (OPLS-DA)
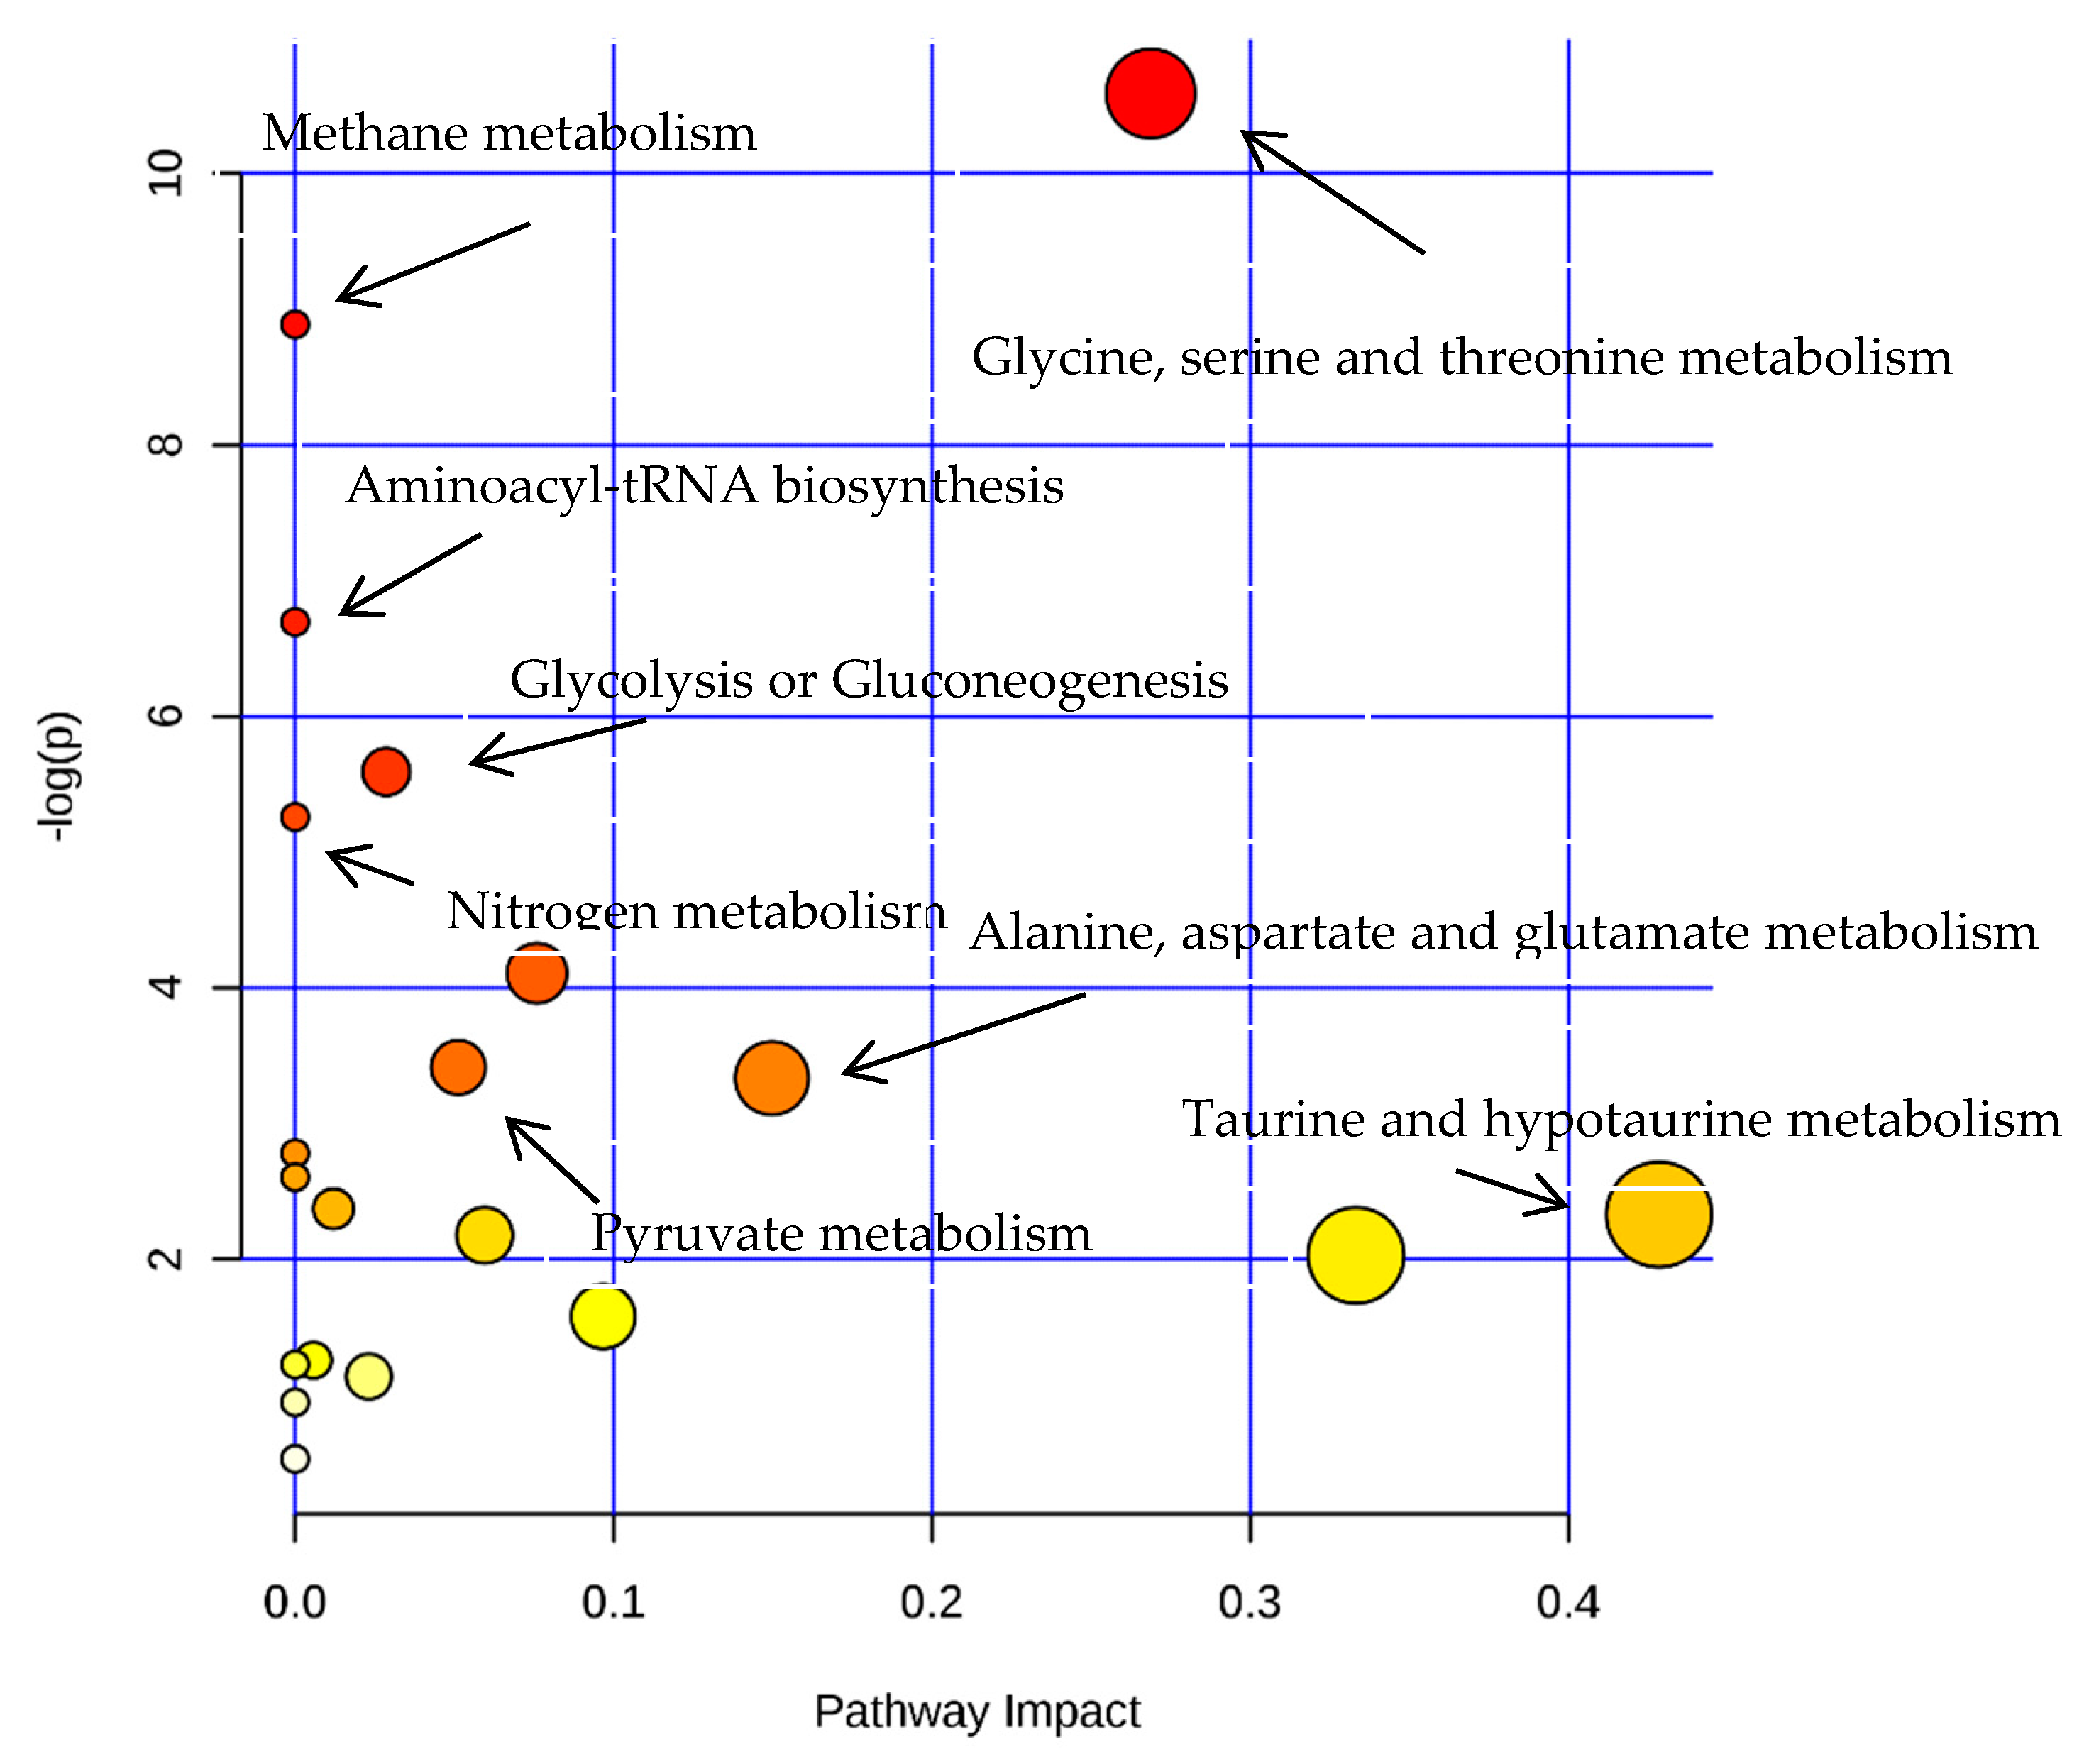
3.4.3. Analysis of Differential Metabolites
4. Discussion
Author Contributions
Funding
Conflicts of Interest
References
- Bao, H.; Choi, W.S.; You, S. Effect of sulfated modification on the molecular characteristics and biological activities of polysaccharides from Hypsizigus marmoreus. Biosci. Biotechnol. Biochem. 2010, 74, 1408–1414. [Google Scholar] [CrossRef] [PubMed]
- Yan, Y.; Rang, L.; Liu, L.; Li, X. Progress in Sulfated Polysaccharides Biological Activity and Structure-activity Relationship. J. Anhui Agri. Sci. 2009, 37, 11374–11375. [Google Scholar]
- Geng, Y.; Xing, L.; Sun, M.; Su, F. Immunomodulatory effects of sulfated polysaccharides of pine pollen on mouse macrophages. Int. J. Biol. Macromol. 2016, 91, 846–855. [Google Scholar] [CrossRef] [PubMed]
- Bu, Q.; Huang, Y.; Yan, G.; Cen, X.; Zhao, Y.L. Metabolomics: A revolution for novel cancer marker identification. Comb. Chem. High. Throughput Screen. 2012, 15, 266–275. [Google Scholar] [CrossRef] [PubMed]
- Go, E.P. Database Resources in Metabolomics: An Overview. J. Neuroimmune Pharmacol. 2010, 5, 18–30. [Google Scholar] [CrossRef] [PubMed]
- Strelko, C.L.; Lu, W.; Dufort, F.J.; Seyfried, T.N.; Chiles, T.C.; Rabinowitz, J.D.; Roberts, M.F. Itaconic acid is a mammalian metabolite induced during macrophage activation. J. Am. Chem. Soc. 2011, 133, 16386–16389. [Google Scholar] [CrossRef] [PubMed] [Green Version]
- Bordbar, A.; Mo, M.L.; Nakayasu, E.S.; Schrimpe-Rutledge, A.C.; Kim, Y.M.; Metz, T.O.; Jones, M.B.; Frank, B.C.; Smith, R.D.; Peterson, S.N.; et al. Model-driven multi-omic data analysis elucidates metabolic immunomodulators of macrophage activation. Mol. Syst. Biol. 2012, 8, 287–299. [Google Scholar] [CrossRef] [PubMed]
- Wu, X.; Zhao, L.; Peng, H.; She, Y.; Feng, Y. Search for Potential Biomarkers by UPLC/Q-TOF-MS Analysis of Dynamic Changes of Glycerophospholipid Constituents of RAW264.7 Cells Treated With NSAID. Chromatographia 2015, 78, 211–220. [Google Scholar] [CrossRef]
- Geng, Y.; Cai, Y. Study of Structure of Masson Pine Pollen Polysaccharide and Its Sulfated Derivative by Atomic Force Microscopy. Biotechnol. Front. 2013, 2, 47–51. [Google Scholar]
- Teng, Q.; Huang, W.; Collette, T.W.; Ekman, D.R.; Tan, C. A direct cell quenching method for cell-culture based metabolomics. Metabolomics 2009, 5, 199–208. [Google Scholar] [CrossRef]
- Woo, C.H.; Lim, J.H.; Kim, J.H. Lipopolysaccharide Induces Matrix Metalloproteinase-9 Expression via a Mitochondrial Reactive Oxygen Species-p38 Kinase-Activator Protein-1 Pathway in Raw 264.7 Cells. J. Immunol. 2004, 173, 6973–6980. [Google Scholar] [CrossRef] [PubMed] [Green Version]
- Ripps, H.; Shen, W. Review: Taurine: A “very essential” amino acid. Mol. Vis. 2012, 18, 2673–2686. [Google Scholar] [PubMed]
- Huxtable, R.J. Physiological actions of taurine. Physiol. Rev. 1992, 72, 101–144. [Google Scholar] [CrossRef] [PubMed]
- Vaitheesvaran, B.; Xu, J.; Yee, J.; Lu, Q.Y.; Go, V.L.; Xiao, G.G.; Lee, W.N. The Warburg effect: A balance of flux analysis. Metabolomics 2014, 11, 1–10. [Google Scholar] [CrossRef] [PubMed]
- Upadhyay, M.; Samal, J.; Kandpal, M.; Singh, O.V.; Vivekanandan, P. The Warburg effect: Insights from the past decade. Pharmacol. Ther. 2013, 137, 318–330. [Google Scholar] [CrossRef] [PubMed]
- Lv, H.; Tang, X. Research progress on metabolism and regulation of homocysteine in vivo. Contemp. Med. 2015, 383, 9–14. [Google Scholar]
- Jara-Oseguera, A.; Nieto-Posadas, A.; Szallasi, A.; Islas, L.D.; Rosenbaum, T. Molecular Mechanisms of TRPV1 Channel Activation. Open Pain J. 2010, 3, 68–81. [Google Scholar] [CrossRef]
- Yancey, P.H. Organic osmolytes as compatible, metabolic and counteracting cytoprotectantsin high osmolarity and other stresses. J. Exp. Biol. 2005, 208, 2819–2830. [Google Scholar] [CrossRef] [PubMed]
- Ye, L.; Kleiner, S.; Wu, J.; Sah, R.; Gupta, R.K.; Banks, A.S.; Cohen, P.; Khandekar, M.J.; Boström, P.; Mepani, R.J.; et al. TRPV4 is a regulator of adipose oxidative metabolism, inflammation, and energy homeostasis. Cell 2012, 151, 96–110. [Google Scholar] [CrossRef] [PubMed]
- Zhao, Q. Effects of TRPV1 on M1 Macrophages and the role of Evodiamine in regulation of TRPV1. Henan College Tradit. Chin. Med. 2014. Available online: http://cdmd.cnki.com.cn/Article/CDMD-10471-1014364267.htm (accessed on 13 March 2019).
Sample Availability: Samples of the compounds PPM60-D are available from the authors. |


| No. | Metabolites | Group | δH (Multiplicity) | Loading (SPPM60-D vs. Control) | Loading (LPS Group vs. Control) |
|---|---|---|---|---|---|
| 1 | Isoleucine | CH3 | 0.94 (t) | 64.9 | 9.64 |
| CH3 | 0.99 (d) | ||||
| CH2 | 1.28 (m) | ||||
| CH2 | 1.46 (m) | ||||
| CH | 1.99 (m) | ||||
| CH | 3.66 (d) | ||||
| 2 | Leucine | CH3 | 0.96 (d) | 10.73 | 22.66 |
| CH3 | 0.97 (d) | ||||
| CH | 1.7 (m) | ||||
| CH2 | 3.77 (m) | ||||
| CH | 3.722 (m) | ||||
| 3 | Valine | CH3 | 0.99 (d) | 11.7 | 20.34 |
| CH3 | 1.05 (d) | ||||
| CH | 2.25 (m) | ||||
| CH | 3.61 (d) | ||||
| 4 | Ethanol | CH3 | 1.19 (t) | −150.81 | 146.23 |
| CH2 | 3.65 (q) | ||||
| 5 | (R)-Lactate | CH3 | 1.33 (d) | −1175 | −1020.86 |
| CH | 4.11 (q) | ||||
| 6 | Threonine | CH3 | 1.33 (d) | 41.35 | 40.5984 |
| CH | 3.58 (d), | ||||
| CH | 4.25 (m) | ||||
| 7 | Alanine | CH3 | 1.48 (d) | 51.01 | 137.05 |
| CH | 3.78 (q) | ||||
| 8 | Acetate | CH3 | 1.92 (s) | 76.87 | 98.77 |
| 9 | Proline | CH2 | 2.01 (m) | 476.19 | 22.39 |
| CH2 | 2.05 (m) | ||||
| CH2 | 2.34 (m) | ||||
| CH2 | 3.42 (td) | ||||
| CH2 | 3.45 (m) | ||||
| CH | 4.12 (m) | ||||
| 10 | L-Glutamic acid | CH2 | 2.04 (m) | −15.76 | −17.08 |
| CH2 | 2.11 (m) | ||||
| CH2 | 2.34 (m) | ||||
| CH | 3.77 (m) | ||||
| 11 | L-Glutamine | CH2 | 2.13 (m) | −18.93 | −35.01 |
| CH2 | 2.44 (m) | ||||
| CH | 3.77 (m) | ||||
| 12 | Tyrosine | CH2 | 3.06 (dd) | 2.306 | 6.27 |
| CH2 | 3.15 (dd) | ||||
| CH | 3.94 (dd) | ||||
| 3,5-CH | 6.91 (d) | ||||
| 2,6-CH | 7.2 (d) | ||||
| 13 | Choline | N(CH3)3 | 3.23 (s) | 306.01 | 263.07 |
| N CH2 | 3.56 (s) | ||||
| O CH2 | 4.07 (t) | ||||
| 14 | Succinate | CH2 | 2.393 (s) | 10.04 | 17.12 |
| 15 | Pyruvate | CH3 | 2.46 (s) | 10.48 | 28.31 |
| 16 | Sarcosine | CH3 | 2.73 (s) | 32.18 | 11.84 |
| CH2 | 3.6 (s) | ||||
| 17 | Aspartate | CH2 | 2.68 (m) | 67.57 | 118.274 |
| CH2 | 2.82 (m) | ||||
| CH | 3.91 (m) | ||||
| 18 | Phosphocreatine | CH3 | 3.05 (s) | 201.21 | 142.58 |
| CH2 | 3.95 (s) | ||||
| 19 | Creatine | CH3 | 3.04 (s) | 259.98 | 226.48 |
| CH2 | 3.94 (s) | ||||
| 20 | Taurine | CH2SO3 | 3.25 (t) | −304.83 | −244.785 |
| NCH2 | 3.43 (t) | ||||
| 21 | Trimethylamine N-oxide (TMAO) | CH3 | 3.26 (s) | 54.23 | −189.45 |
| 22 | Betaine | CH3 | 3.27 (s) | 294.88 | 529.127 |
| CH2 | 3.89 (s) | ||||
| 23 | Methanol | CH3 | 3.352 (s) | −14.48 | 29.20 |
| 24 | Glycine | CH2 | 3.56 (s) | 306.01 | 263.07 |
| 25 | Uridine | CH2 | 3.81 (d) | 23.93 | 118.274 |
| CH2 | 3.92 (d) | ||||
| 4-CH | 4.18 (q) | ||||
| 3-CH | 4.25 (t) | ||||
| 2-CH | 4.38 (t) | ||||
| 5-CH | 5.95 (d) | ||||
| 6-CH | 5.97 (d) | ||||
| 1-CH | 7.87 (d) | ||||
| 26 | Uridine diphosphate (UDP) | CH2 | 4.22 (m) | 12.87 | 23.33 |
| 4-CH | 4.28 (m) | ||||
| 3-CH | 4.37 (m) | ||||
| 2-CH | 4.37 (m) | ||||
| 5-CH | 5.98 (d) | ||||
| 6-CH | 5.99 (d) | ||||
| 1-CH | 7.96 (d) | ||||
| 27 | Fumaric acid | 4,5-CH | 5.52 (s) | 2.66 | 1.91 |
| 28 | α-glucose | 1-CH | 5.24 (s) | −1.05 | −11.43 |
| 29 | Cytidine | 3-CH | 6.09 (d) | 1.81 | 2.09 |
| 2-CH | 7.87 (d) | ||||
| 30 | Fumarate | CH | 6.522 (s) | 2.20 | 2.07 |
| 31 | Niacinamide | 5-CH | 7.6 (dd) | −2.28 | 0.75 |
| 6-CH | 8.72 (d) | ||||
| 32 | Adenine | 2-CH | 8.11 (s) | 4.47 | 4.78 |
| 6-CH | 8.12 (s) | ||||
| 33 | Hypoxanthine | 2-CH | 8.22 (s) | 2.31 | 37.64 |
| 7-CH | 8.272 (s) | ||||
| 34 | Formate | CH | 8.46 (s) | 34 | −105.611 |
| 35 | NADP | 6-CH | 8.84 (d) | 4.54 | 1.71 |
| 4-CH | 9.15 (d) |
| LPS vs. Control | SPPM60-D vs. Control | |||||
|---|---|---|---|---|---|---|
| NO. | Metabolites | VIP | Trend | Metabolites | VIP | Trend |
| 1 | Lactate | 25.36 | ↓ | Lactate | 24.06 | ↓ |
| 2 | Alanine | 14.19 | ↑ | Betaine | 12.84 | ↑ |
| 3 | Choline | 6.61 | ↑ | Proline | 7.58 | ↑ |
| 4 | Proline | 5.46 | ↑ | Creatine phosphate | 6.36 | ↑ |
| 5 | Betaine | 4.27 | ↑ | Creatine | 6.14 | ↑ |
| 6 | Glycine | 4.23 | ↑ | choline | 5.90 | ↑ |
| 7 | Creatine | 4.07 | ↓ | Glycine | 5.89 | ↑ |
| 8 | Taurine | 3.84 | ↓ | Alanine | 4.36 | ↑ |
| 9 | Acetate | 2.45 | ↑ | Taurine | 3.21 | ↓ |
| 10 | Aspartate | 1.82 | ↑ | Acetate | 3.10 | ↑ |
| 11 | Uridine | 1.62 | ↑ | Aspartate | 2.81 | ↑ |
| 12 | Threonine | 1.67 | ↑ | Trimethylamino oxide (TMAO) | 2.48 | ↑ |
| 13 | Formate | 1.51 | ↓ | Isoleucine | 2.34 | ↑ |
| 14 | Trimethylamine N-oxide (TMAO) | 1.43 | ↓ | Threonine | 1.23 | ↑ |
| 15 | Methanol | 1.40 | ↑ | Ethanol | 1.05 | ↓ |
| 16 | leucine | 1.31 | ↑ | |||
| 17 | Ethanol | 1.22 | ↑ | |||
| 18 | Glutamine | 1.13 | ↓ | |||
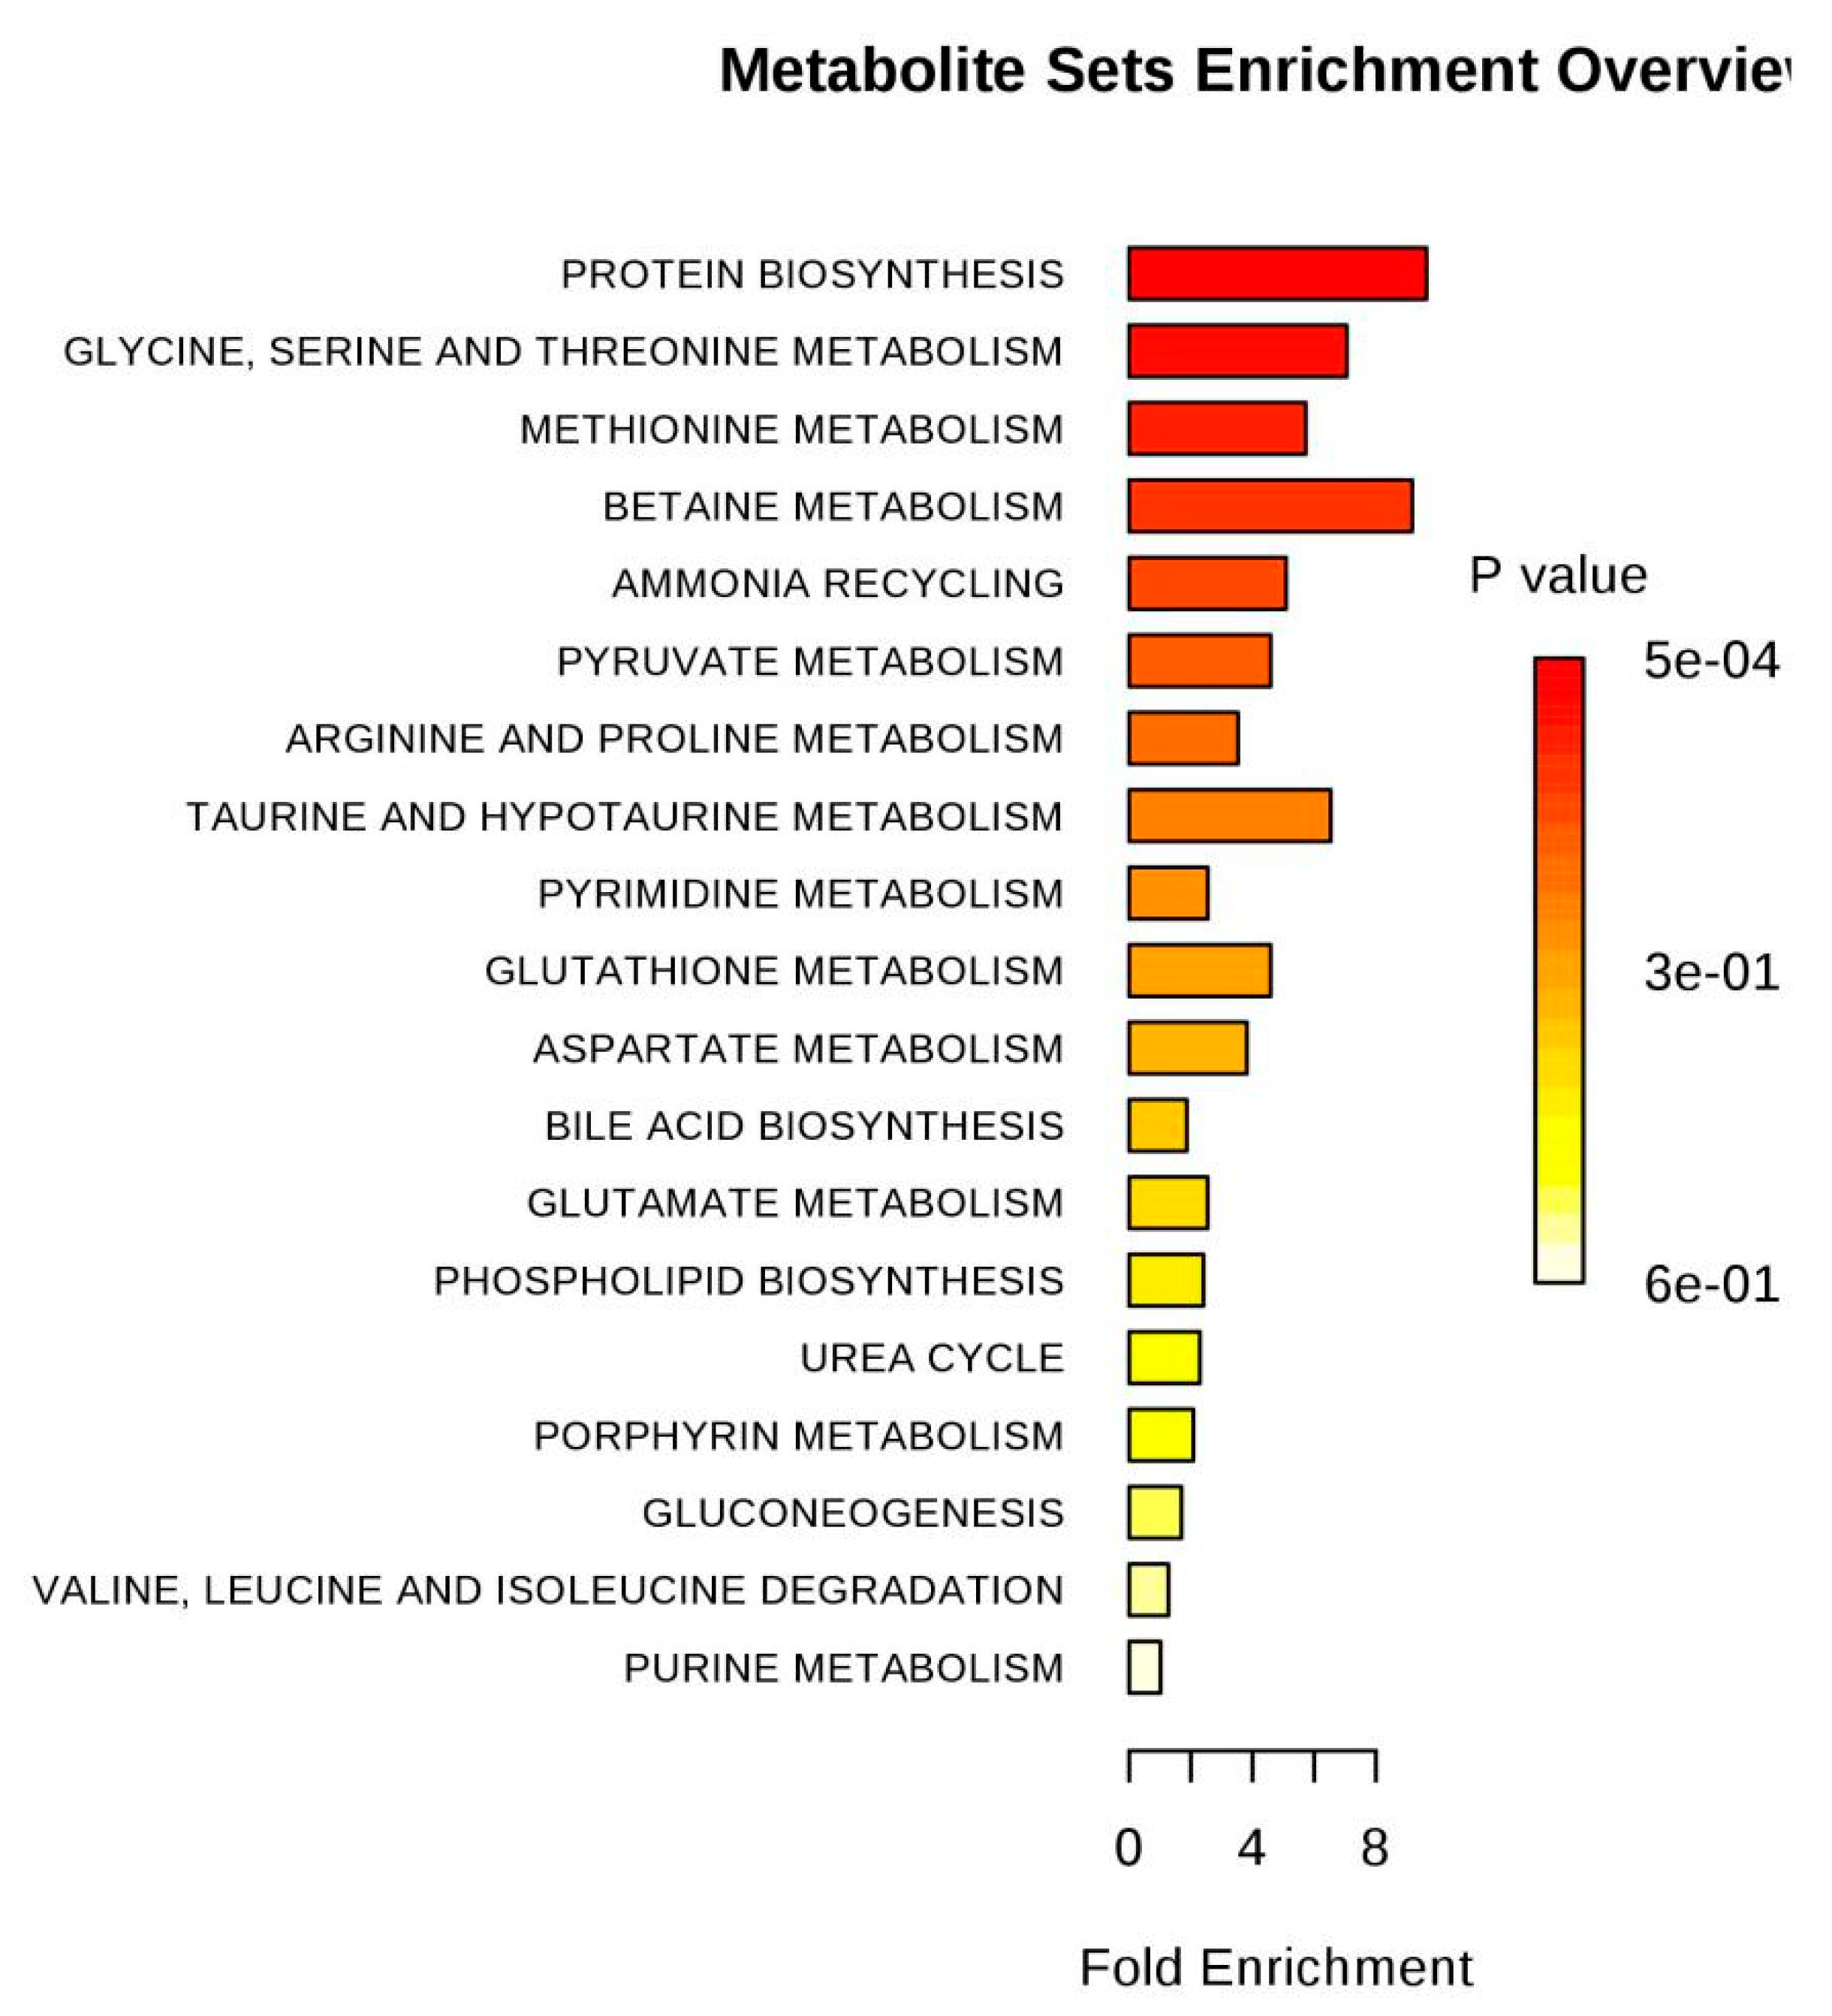
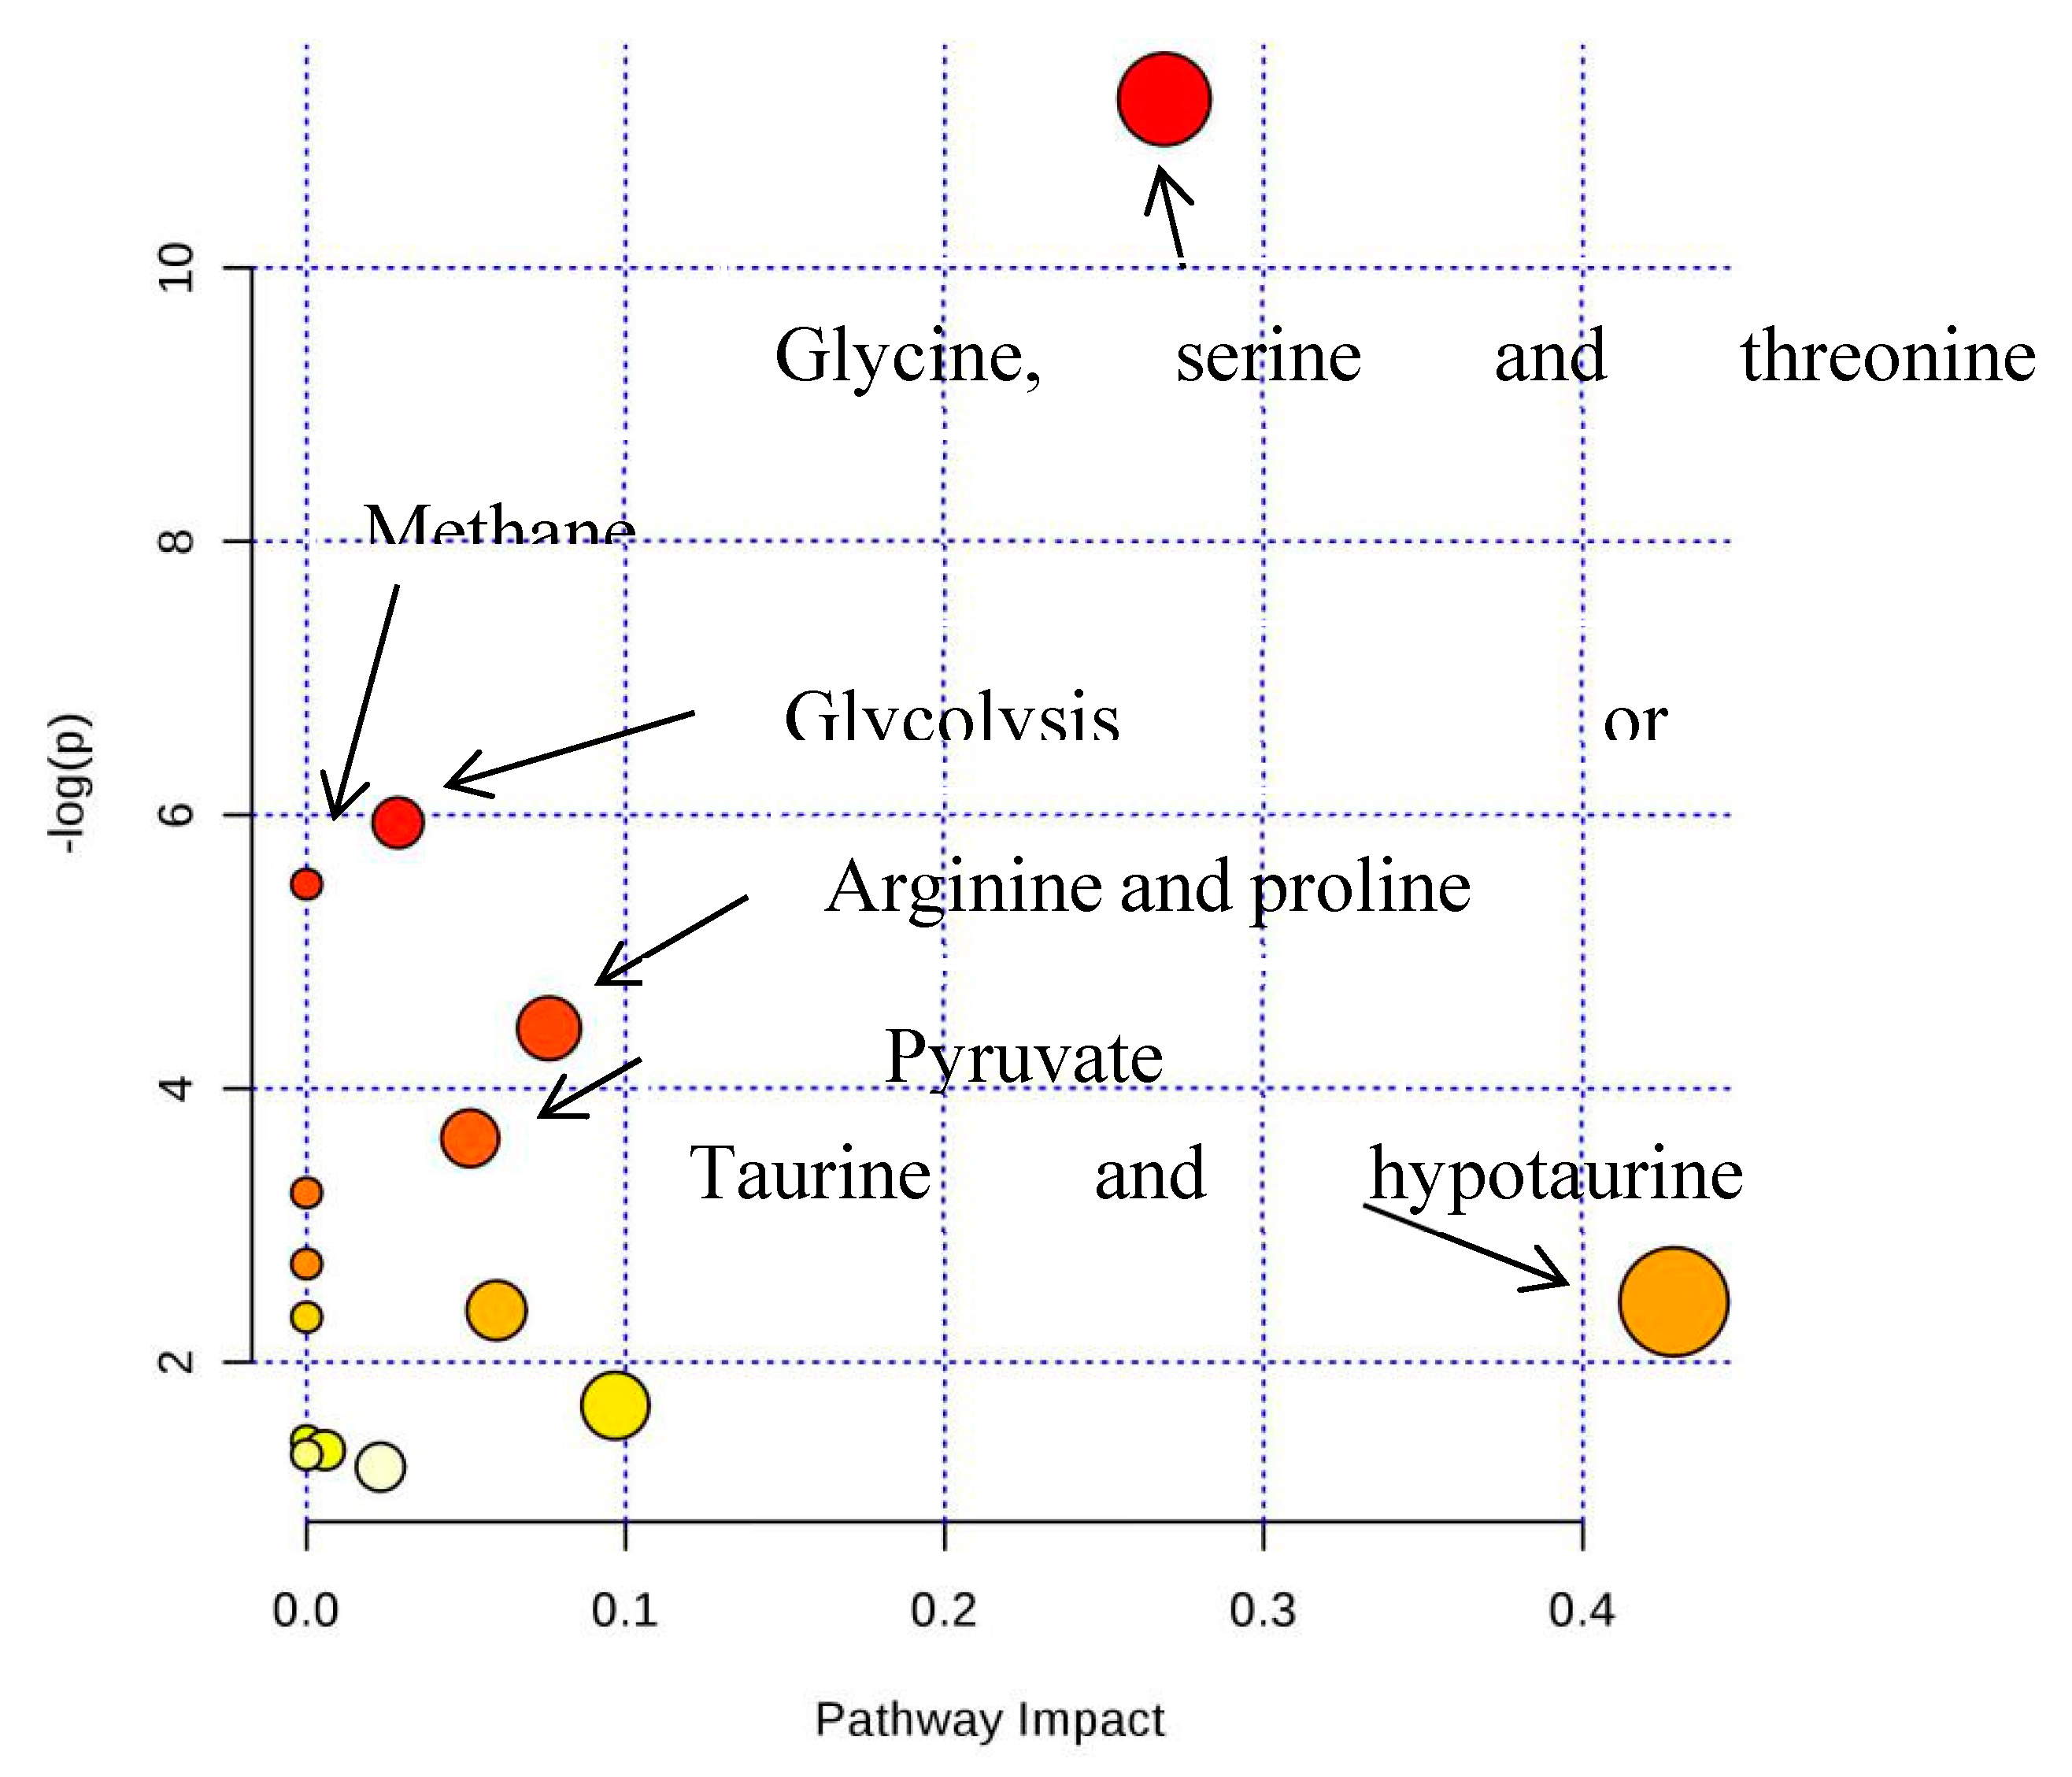
| Name | Total | Expected | Hits | Raw p | −LOG (p) |
|---|---|---|---|---|---|
| Glycine, serine and threonine metabolism | 31 | 0.39379 | 5 | 2.52E-05 | 10.589 |
| Methane metabolism | 9 | 0.11433 | 3 | 0.00013807 | 8.8877 |
| Aminoacyl-tRNA biosynthesis | 69 | 0.8765 | 5 | 0.001237 | 6.6951 |
| Glycolysis or Gluconeogenesis | 26 | 0.33028 | 3 | 0.003731 | 5.5911 |
| Nitrogen metabolism | 9 | 0.11433 | 2 | 0.0052073 | 5.2577 |
| Arginine and proline metabolism | 44 | 0.55893 | 3 | 0.01646 | 4.1068 |
| Pyruvate metabolism | 23 | 0.29217 | 2 | 0.032939 | 3.4131 |
| Alanine, aspartate and glutamate metabolism | 24 | 0.30487 | 2 | 0.035665 | 3.3336 |
| D-Glutamine and D-glutamate metabolism | 5 | 0.063514 | 1 | 0.062007 | 2.7805 |
| Cyanoamino acid metabolism | 6 | 0.076217 | 1 | 0.073964 | 2.6042 |
| Pyrimidine metabolism | 41 | 0.52082 | 2 | 0.09334 | 2.3715 |
| Taurine and hypotaurine metabolism | 8 | 0.10162 | 1 | 0.097448 | 2.3284 |
| Primary bile acid biosynthesis | 46 | 0.58433 | 2 | 0.11353 | 2.1757 |
| Valine, leucine and isoleucine biosynthesis | 11 | 0.13973 | 1 | 0.13162 | 2.0278 |
| Glyoxylate and dicarboxylate metabolism | 18 | 0.22865 | 1 | 0.20667 | 1.5766 |
| Glutathione metabolism | 26 | 0.33028 | 1 | 0.28493 | 1.2555 |
| Porphyrin and chlorophyll metabolism | 27 | 0.34298 | 1 | 0.29419 | 1.2235 |
| Glycerophospholipid metabolism | 30 | 0.38109 | 1 | 0.32127 | 1.1355 |
| Valine, leucine and isoleucine degradation | 38 | 0.48271 | 1 | 0.38878 | 0.94474 |
| Purine metabolism | 68 | 0.8638 | 1 | 0.58963 | 0.52826 |
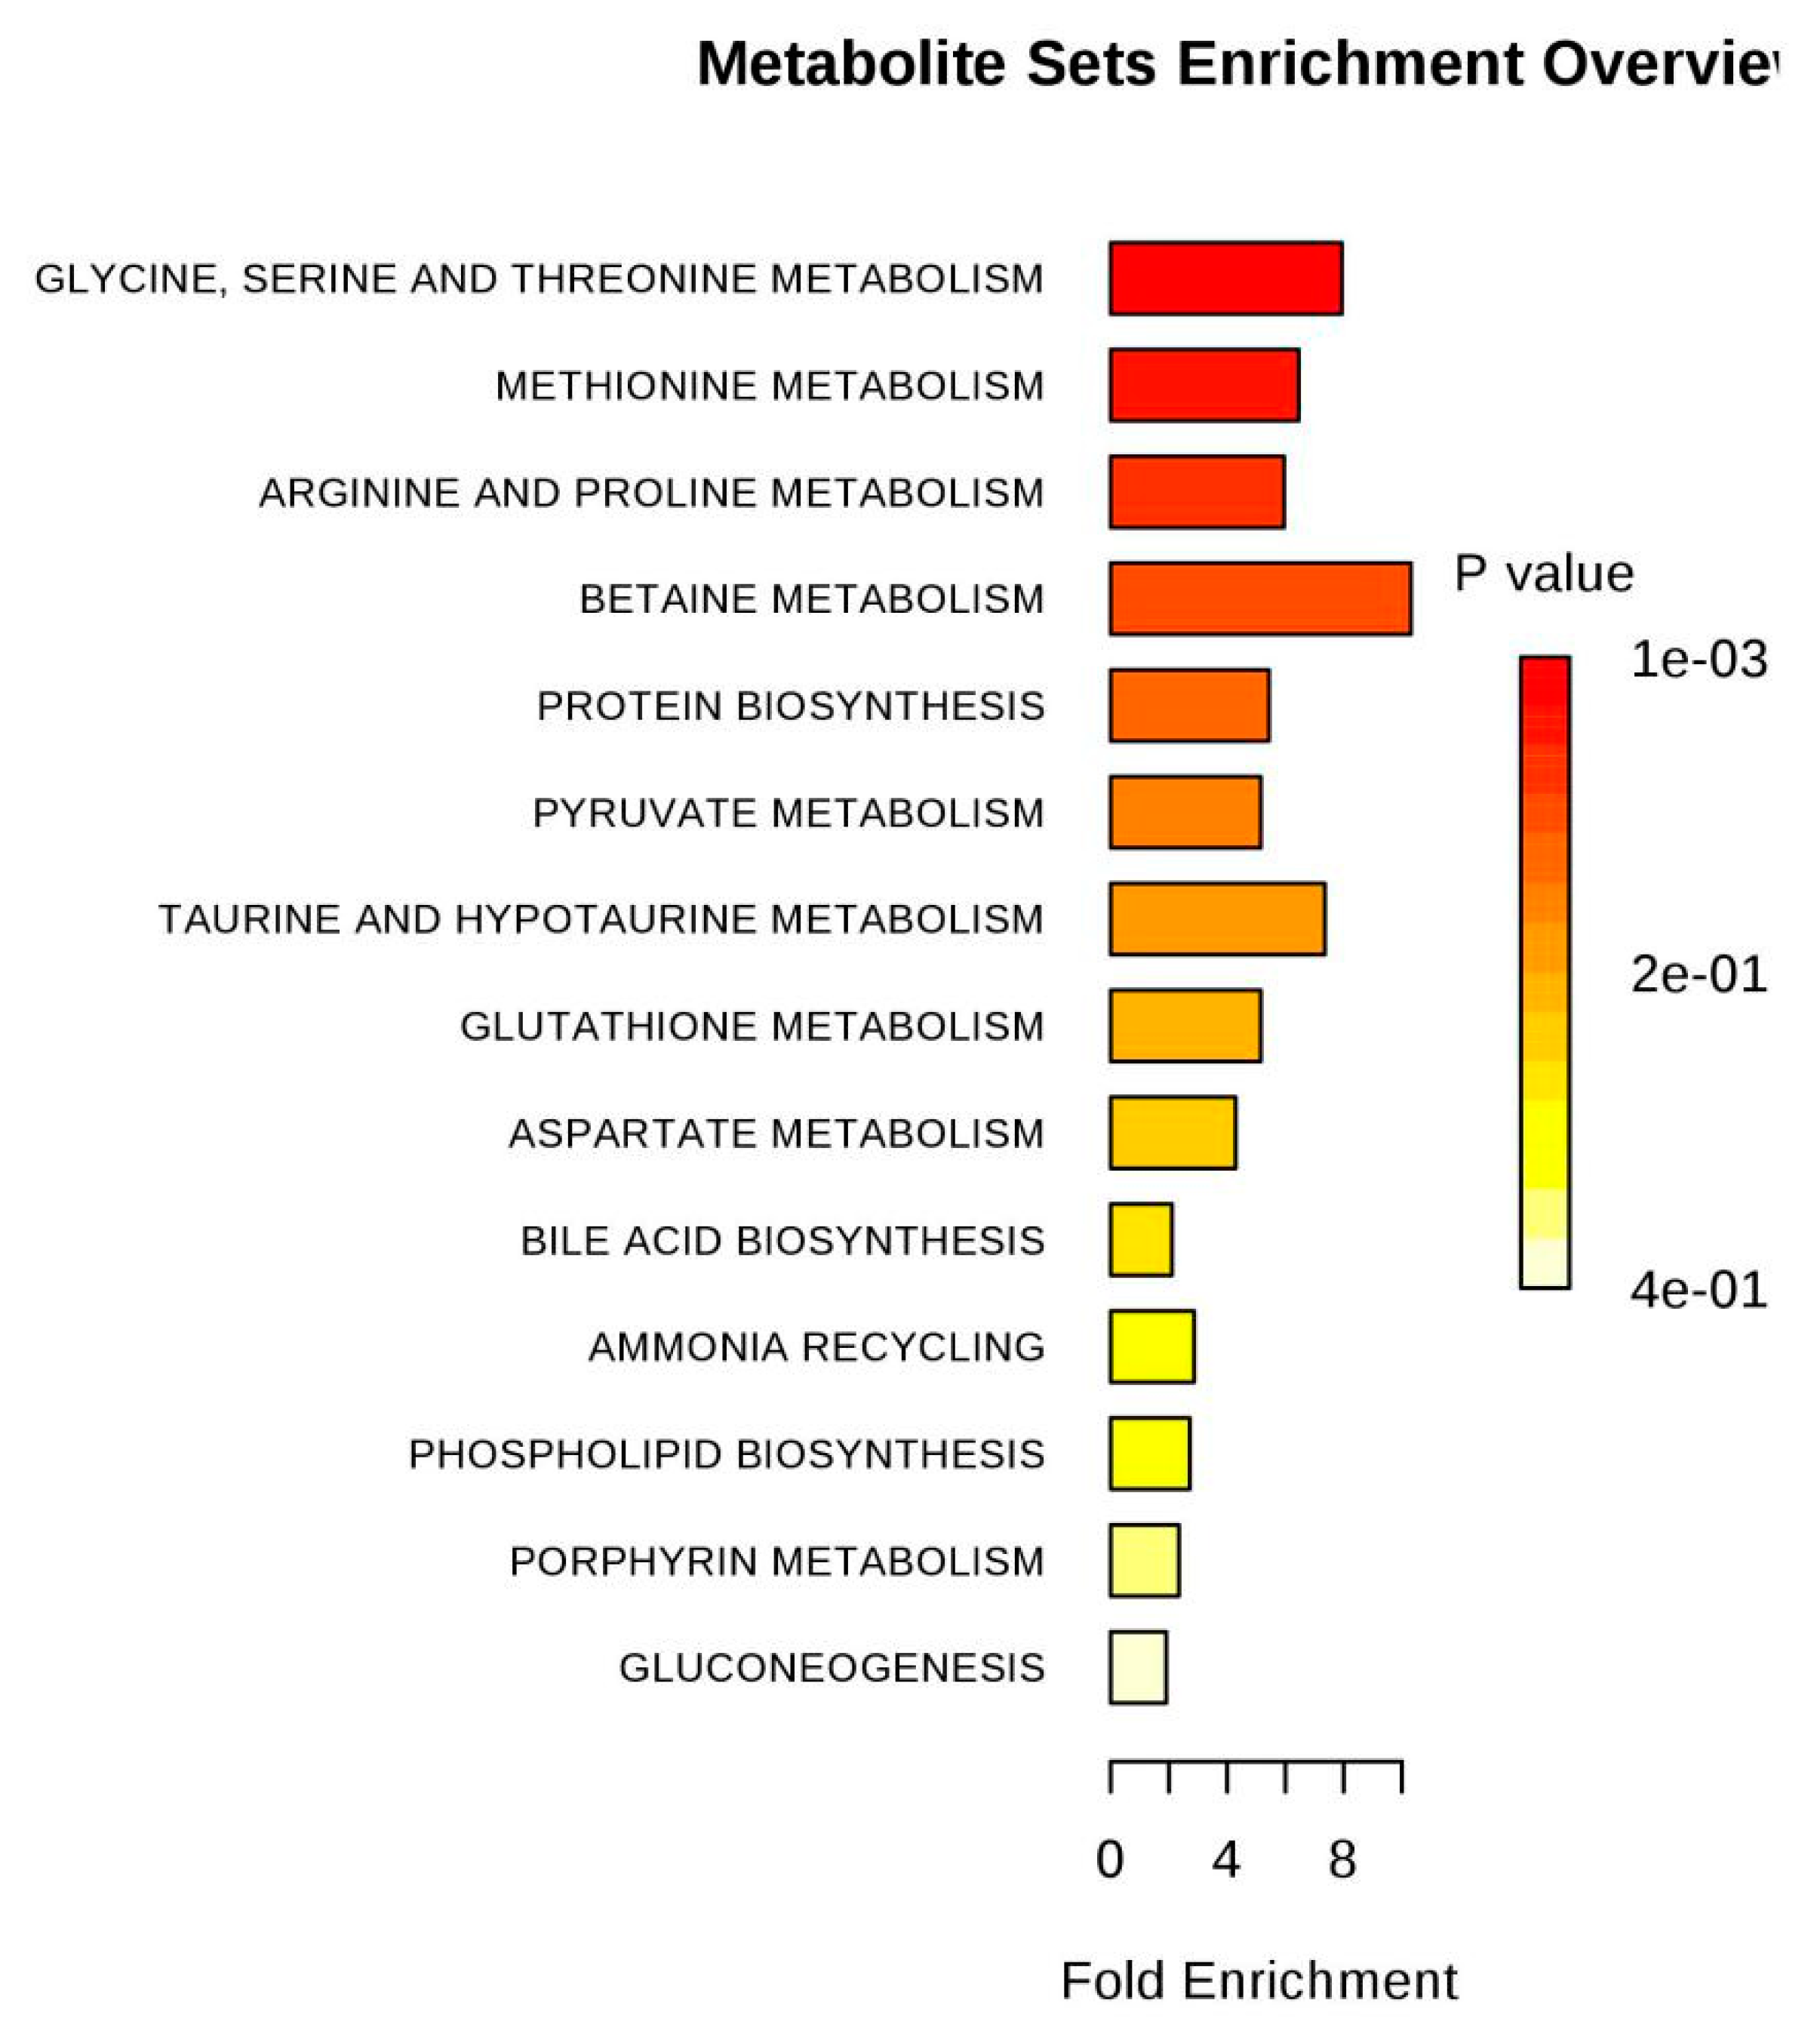
| Name | Total | Expected | Hits | Raw p | −LOG (p) |
|---|---|---|---|---|---|
| Glycine, serine and threonine metabolism | 31 | 0.35004 | 5 | 1.32E-05 | 11.232 |
| Glycolysis or Gluconeogenesis | 26 | 0.29358 | 3 | 0.0026238 | 5.9431 |
| Methane metabolism | 9 | 0.10162 | 2 | 0.0041113 | 5.494 |
| Arginine and proline metabolism | 44 | 0.49682 | 3 | 0.011797 | 4.4399 |
| Pyruvate metabolism | 23 | 0.2597 | 2 | 0.026347 | 3.6364 |
| Aminoacyl-tRNA biosynthesis | 69 | 0.77911 | 3 | 0.039232 | 3.2383 |
| Cyanoamino acid metabolism | 6 | 0.067749 | 1 | 0.065978 | 2.7184 |
| Taurine and hypotaurine metabolism | 8 | 0.090332 | 1 | 0.087048 | 2.4413 |
| Primary bile acid biosynthesis | 46 | 0.51941 | 2 | 0.092722 | 2.3782 |
| Nitrogen metabolism | 9 | 0.10162 | 1 | 0.097415 | 2.3288 |
| Glyoxylate and dicarboxylate metabolism | 18 | 0.20325 | 1 | 0.18588 | 1.6827 |
| Alanine, aspartate and glutamate metabolism | 24 | 0.271 | 1 | 0.24027 | 1.426 |
| Glutathione metabolism | 26 | 0.29358 | 1 | 0.25762 | 1.3563 |
| Porphyrin and chlorophyll metabolism | 27 | 0.30487 | 1 | 0.26616 | 1.3236 |
| Glycerophospholipid metabolism | 30 | 0.33874 | 1 | 0.29123 | 1.2336 |
© 2019 by the authors. Licensee MDPI, Basel, Switzerland. This article is an open access article distributed under the terms and conditions of the Creative Commons Attribution (CC BY) license (http://creativecommons.org/licenses/by/4.0/).
Share and Cite
Su, F.; Sun, M.; Geng, Y. 1H-NMR Metabolomics Analysis of the Effects of Sulfated Polysaccharides from Masson Pine Pollen in RAW264.7 Macrophage Cells. Molecules 2019, 24, 1841. https://doi.org/10.3390/molecules24091841
Su F, Sun M, Geng Y. 1H-NMR Metabolomics Analysis of the Effects of Sulfated Polysaccharides from Masson Pine Pollen in RAW264.7 Macrophage Cells. Molecules. 2019; 24(9):1841. https://doi.org/10.3390/molecules24091841
Chicago/Turabian StyleSu, Fangchen, Mengmeng Sun, and Yue Geng. 2019. "1H-NMR Metabolomics Analysis of the Effects of Sulfated Polysaccharides from Masson Pine Pollen in RAW264.7 Macrophage Cells" Molecules 24, no. 9: 1841. https://doi.org/10.3390/molecules24091841