
A UHPLC-UV Method Development and Validation for Determining Kavalactones and Flavokavains in Piper methysticum (Kava)

Abstract
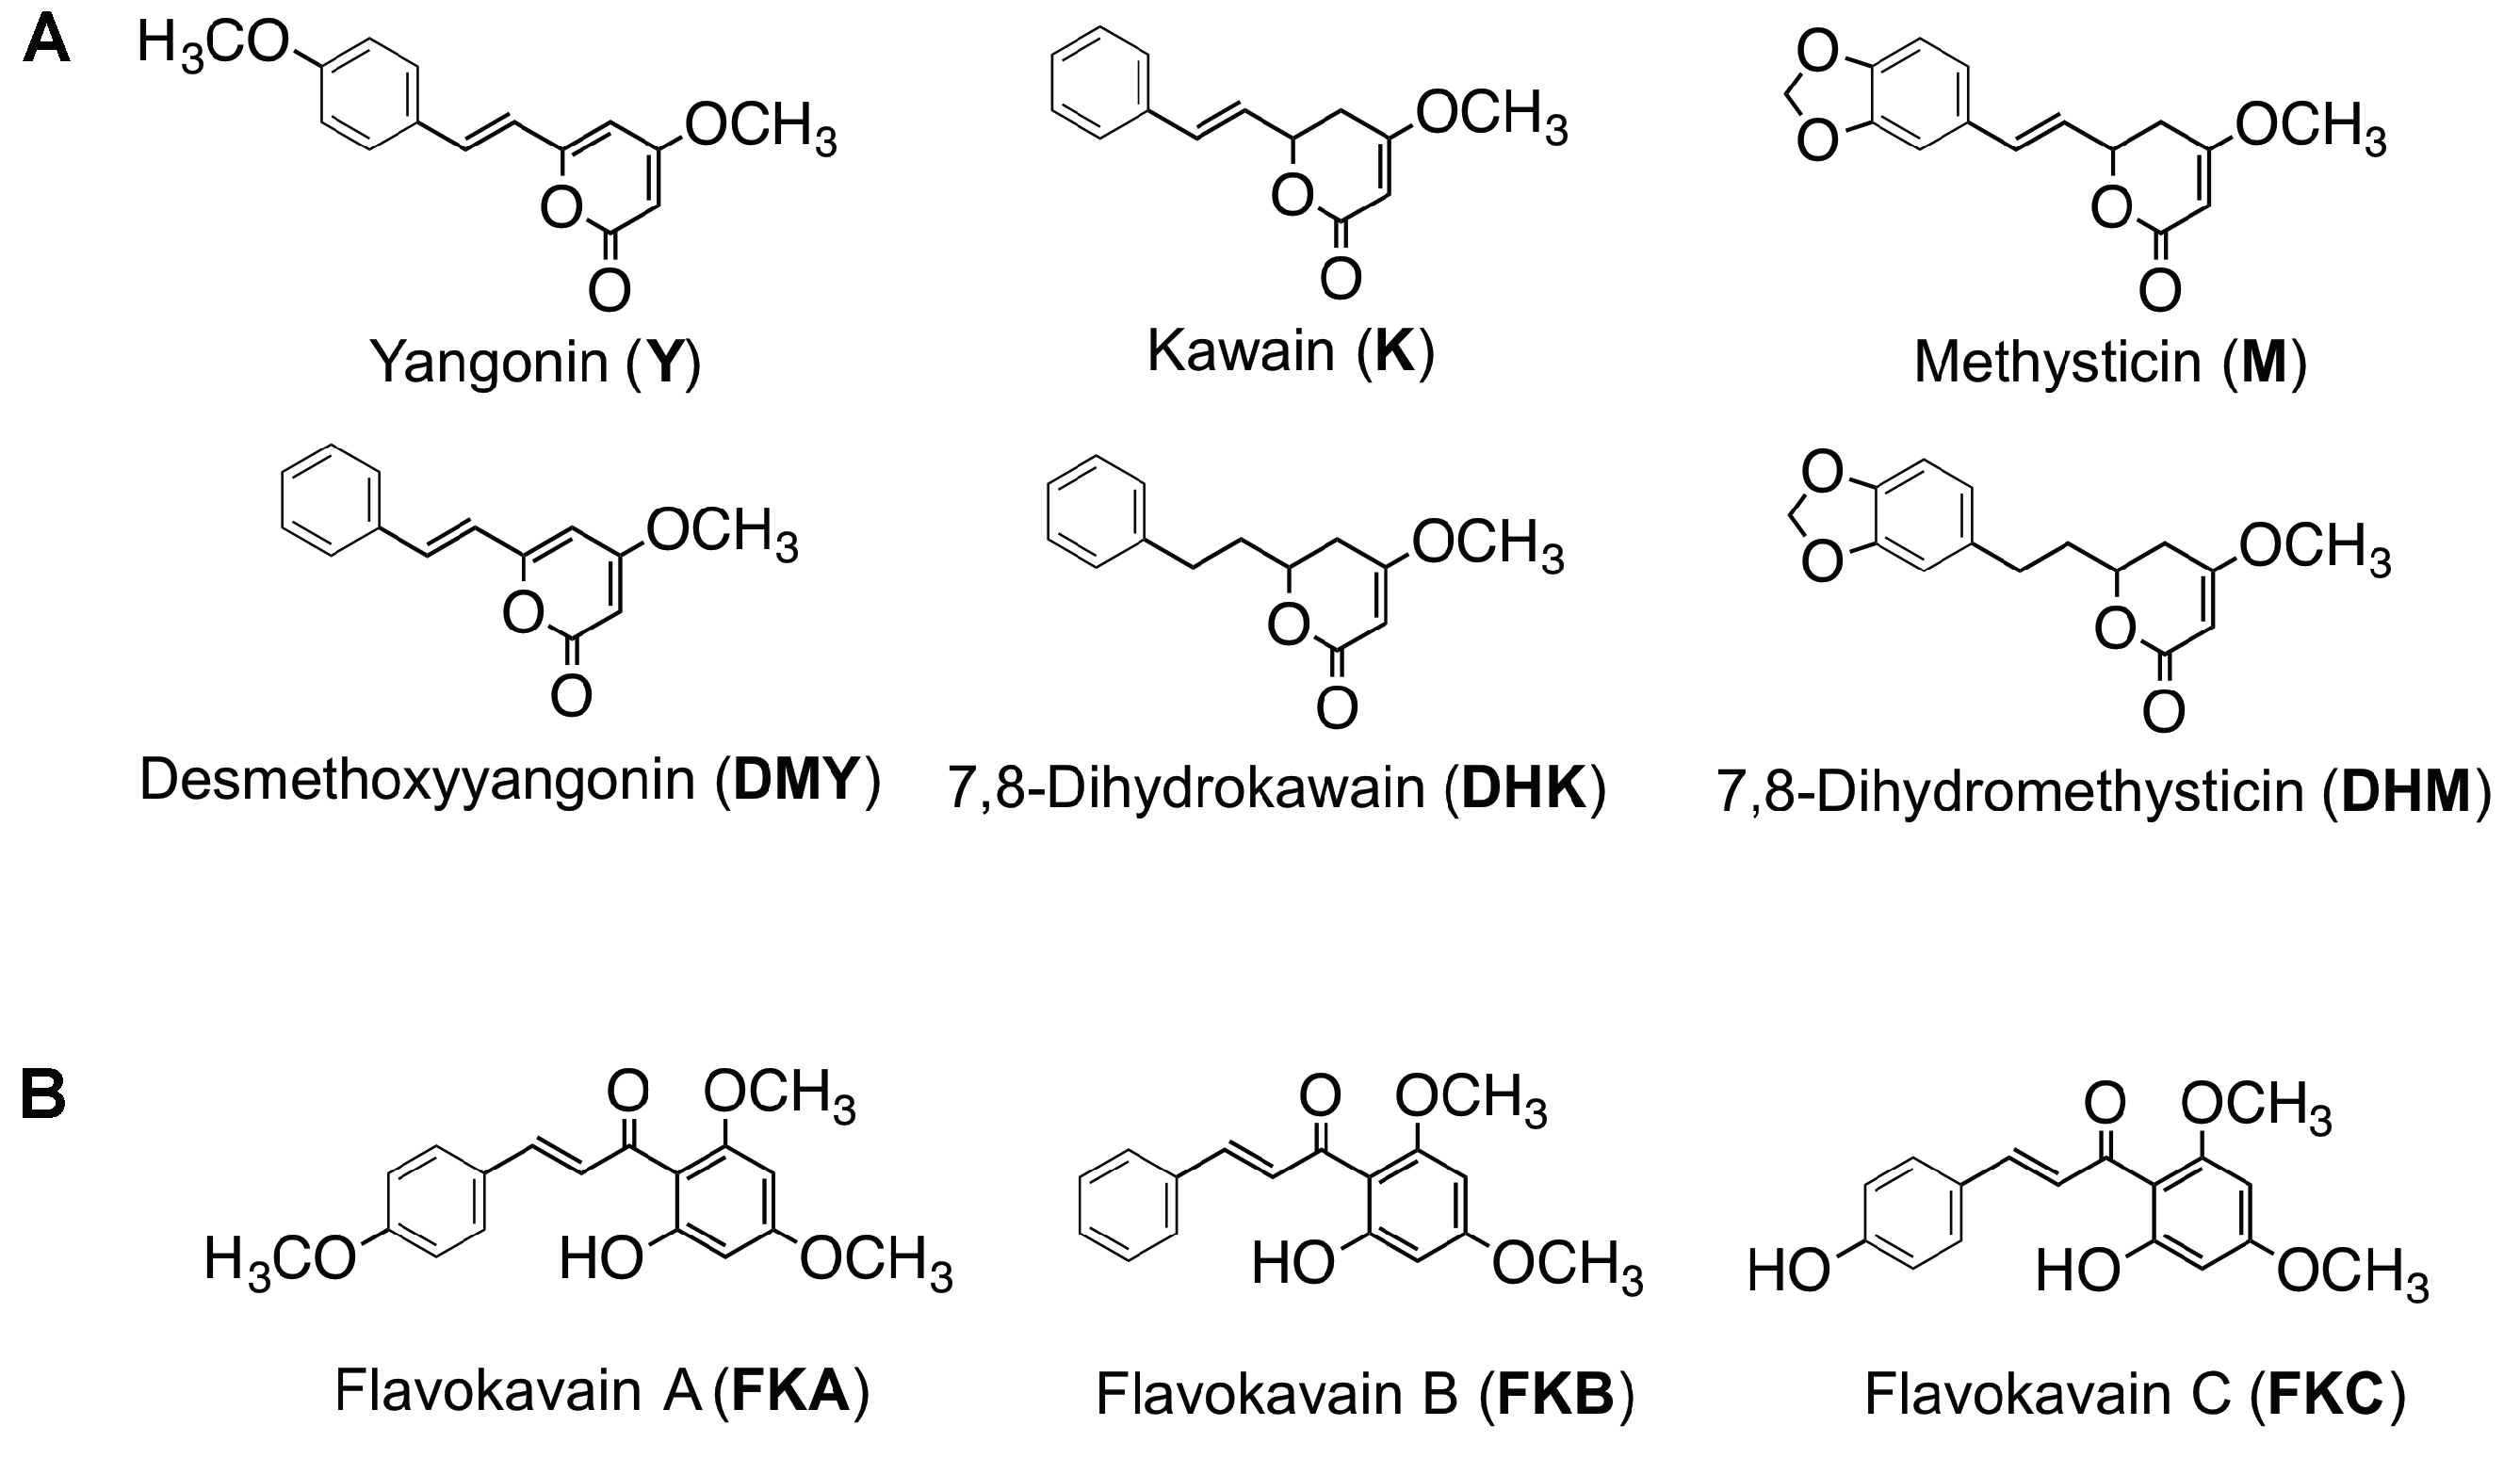
:1. Introduction
2. Results and Discussions
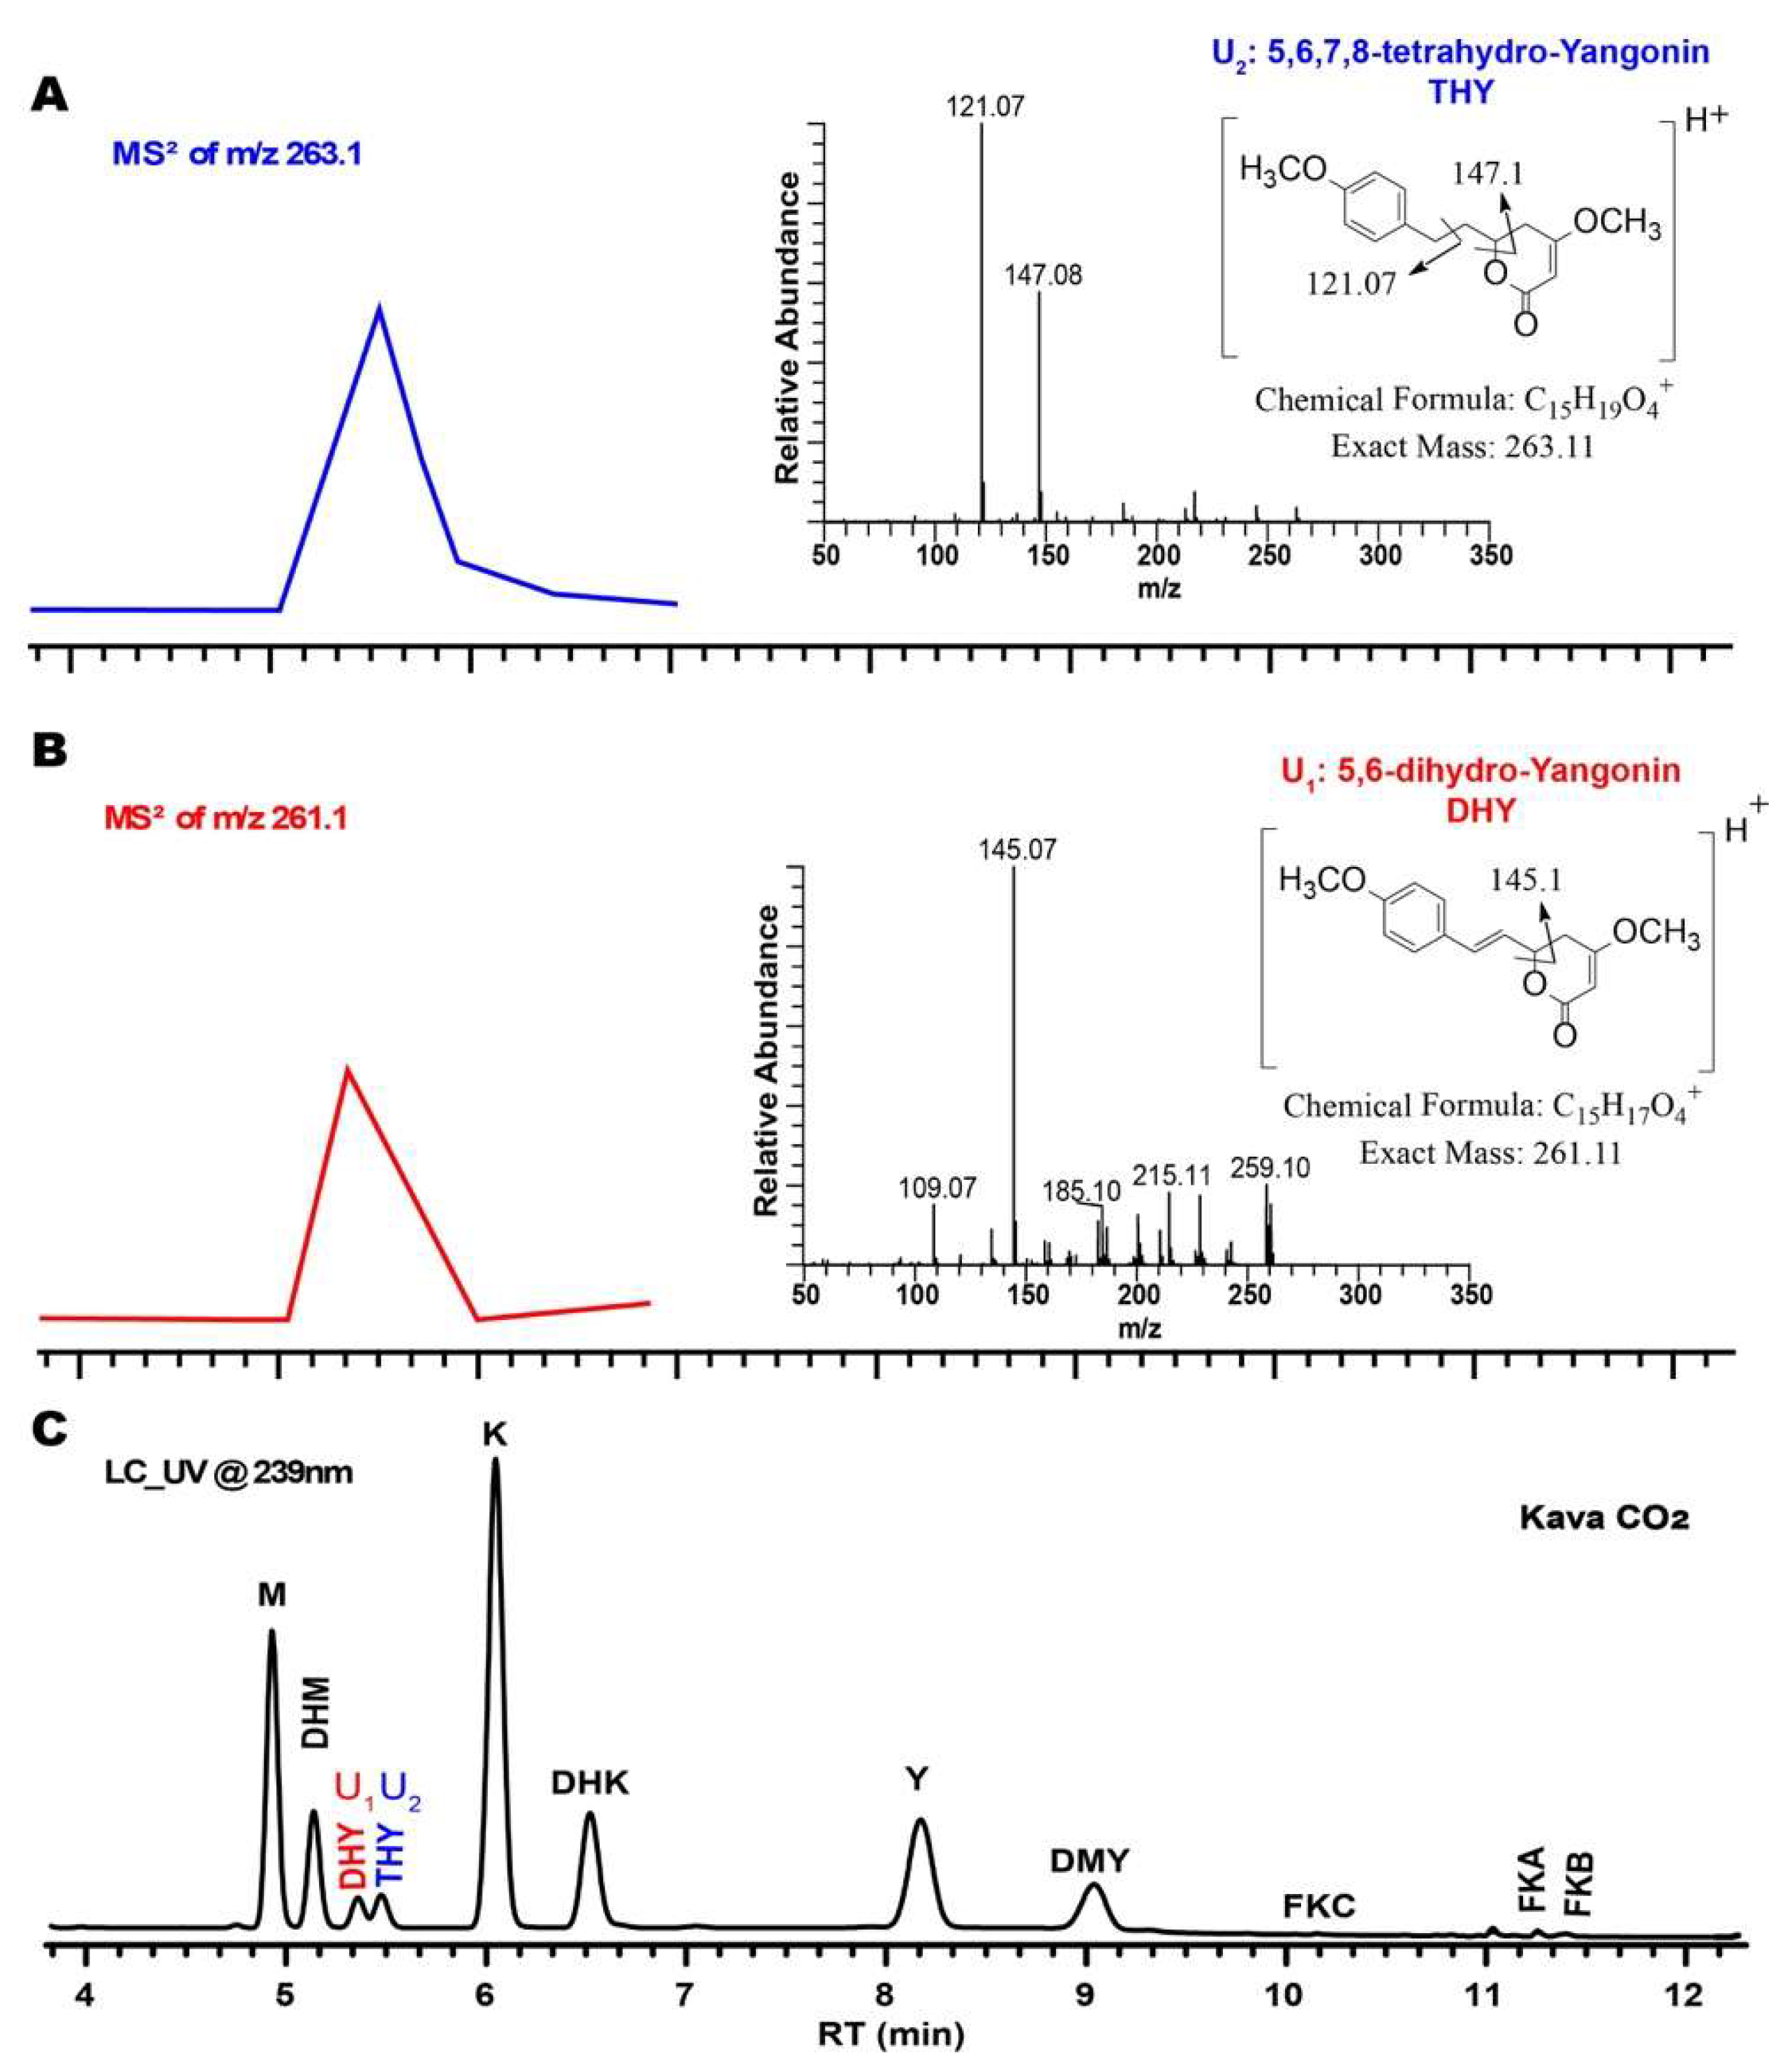
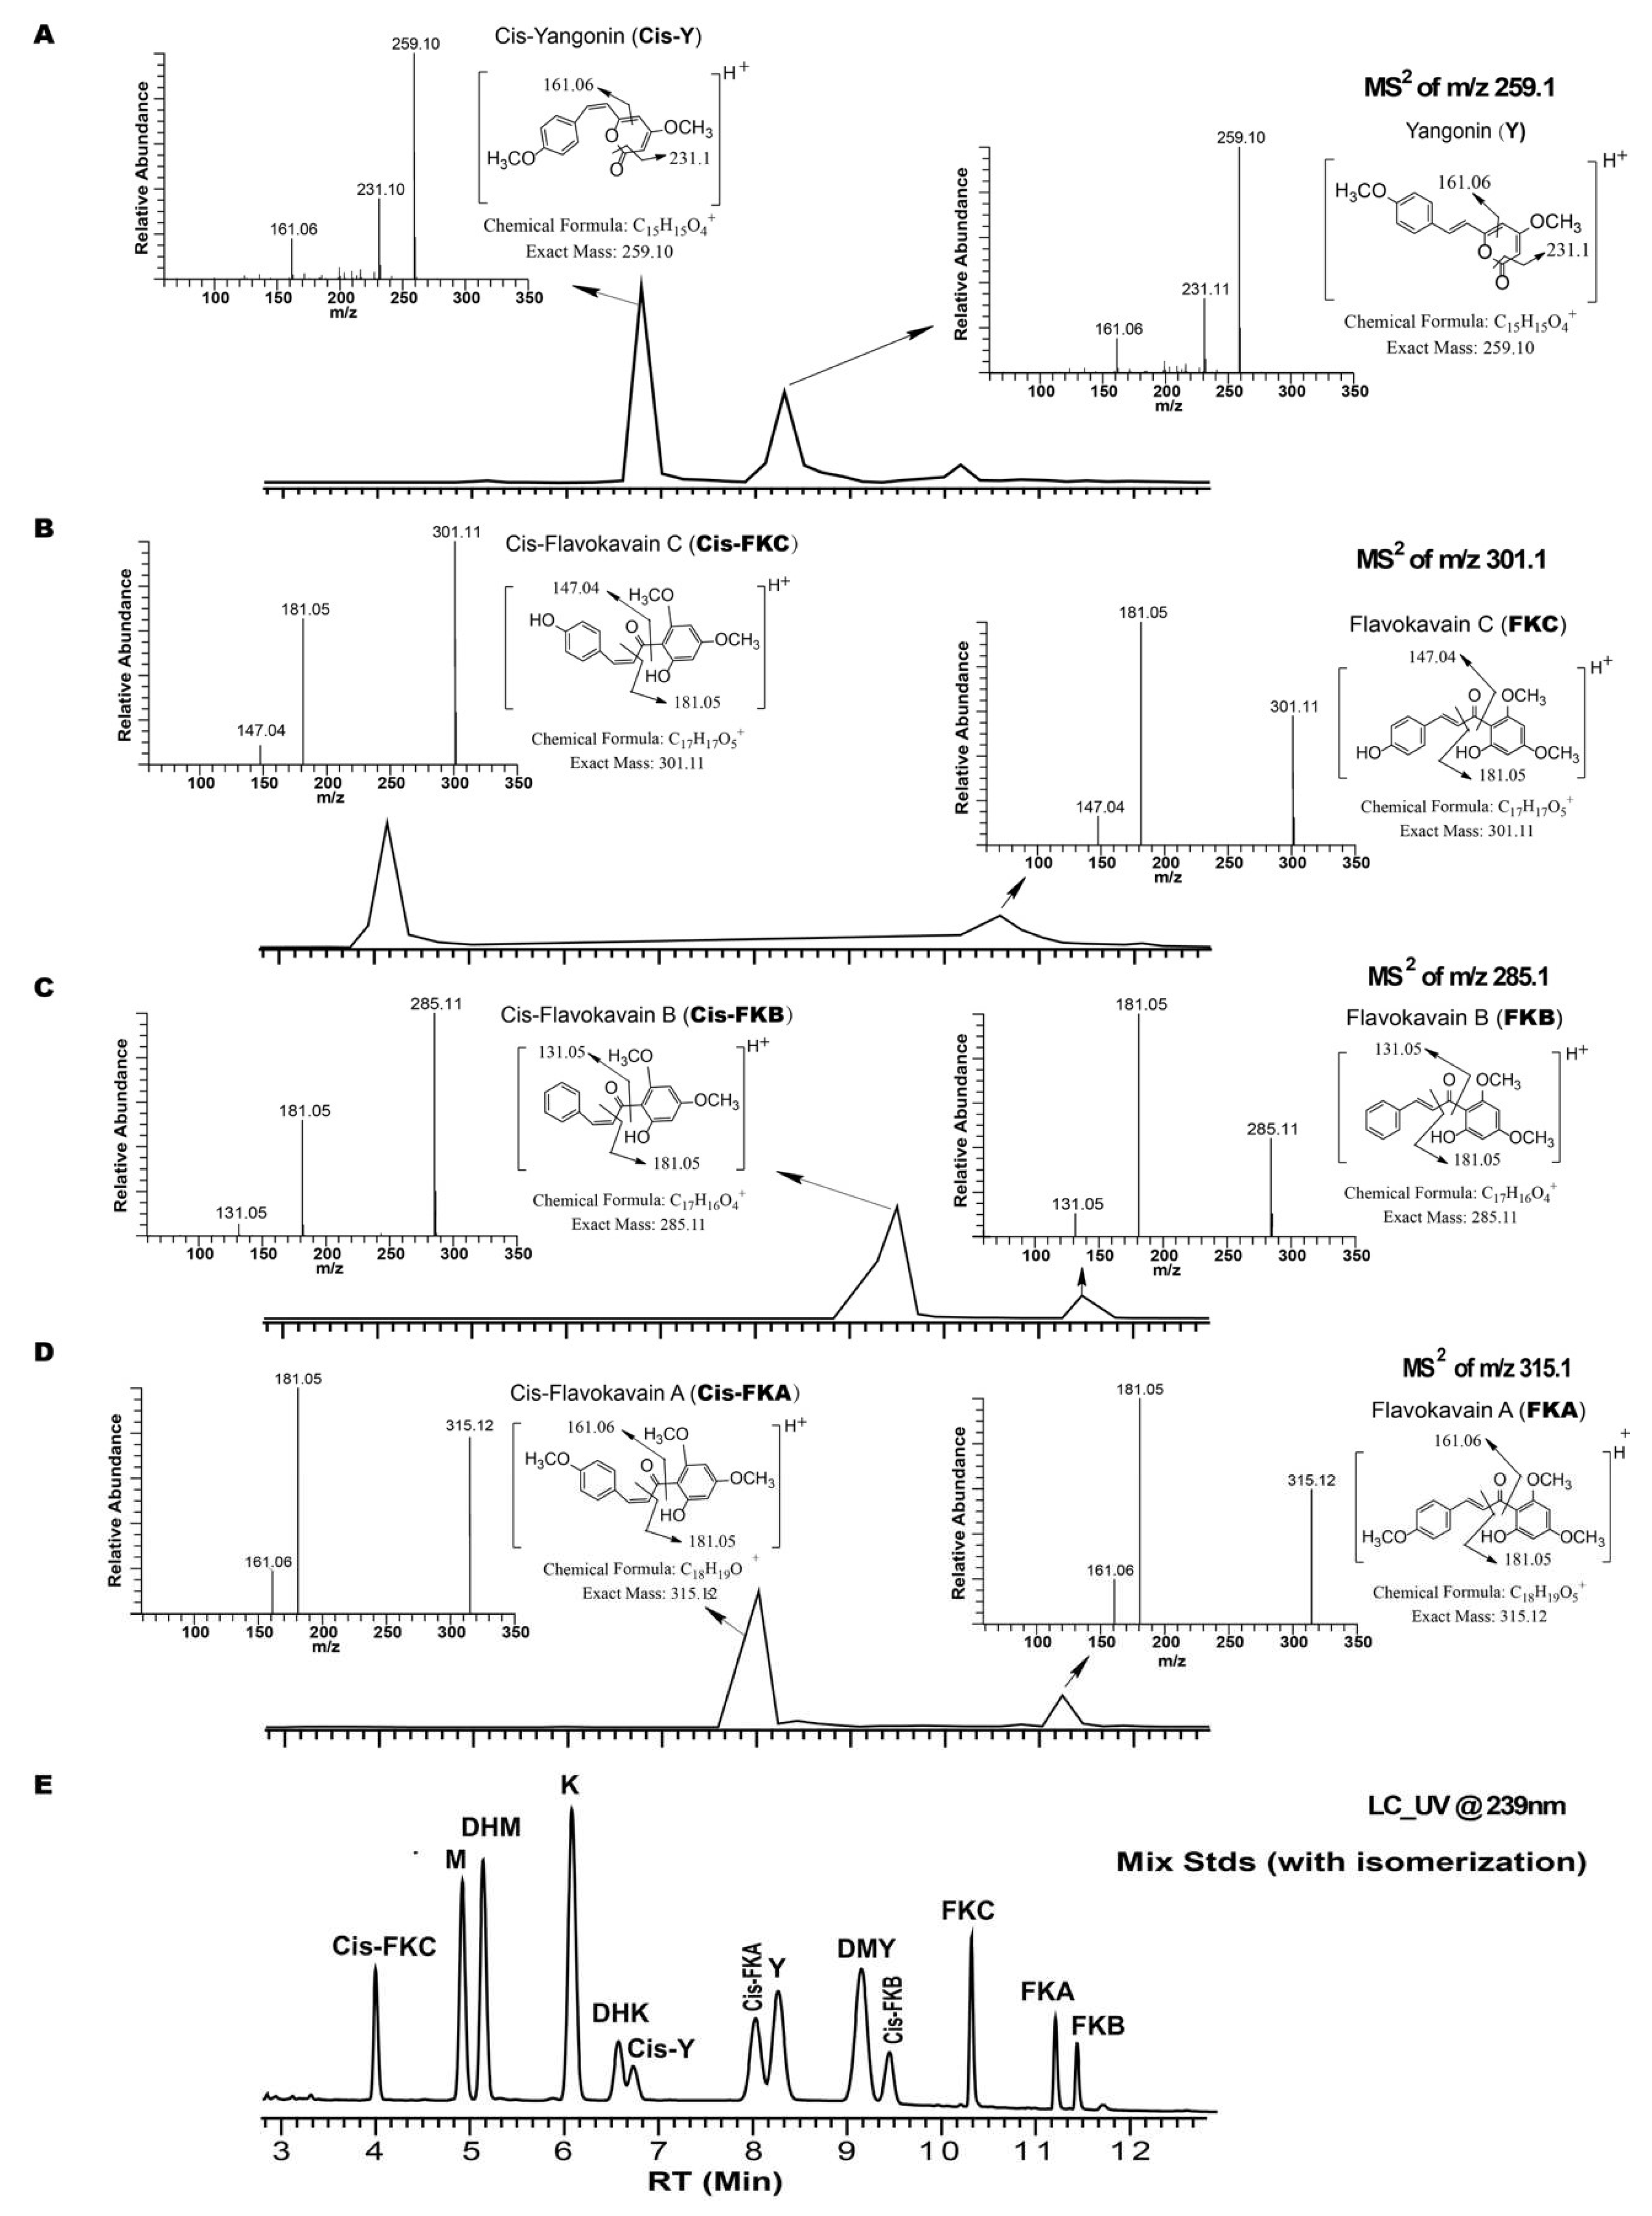
2.1. Identification of Isomerization of Yangonin and Flavokavains (A, B, and C), along with Sample Preparation
2.2. Method Validation
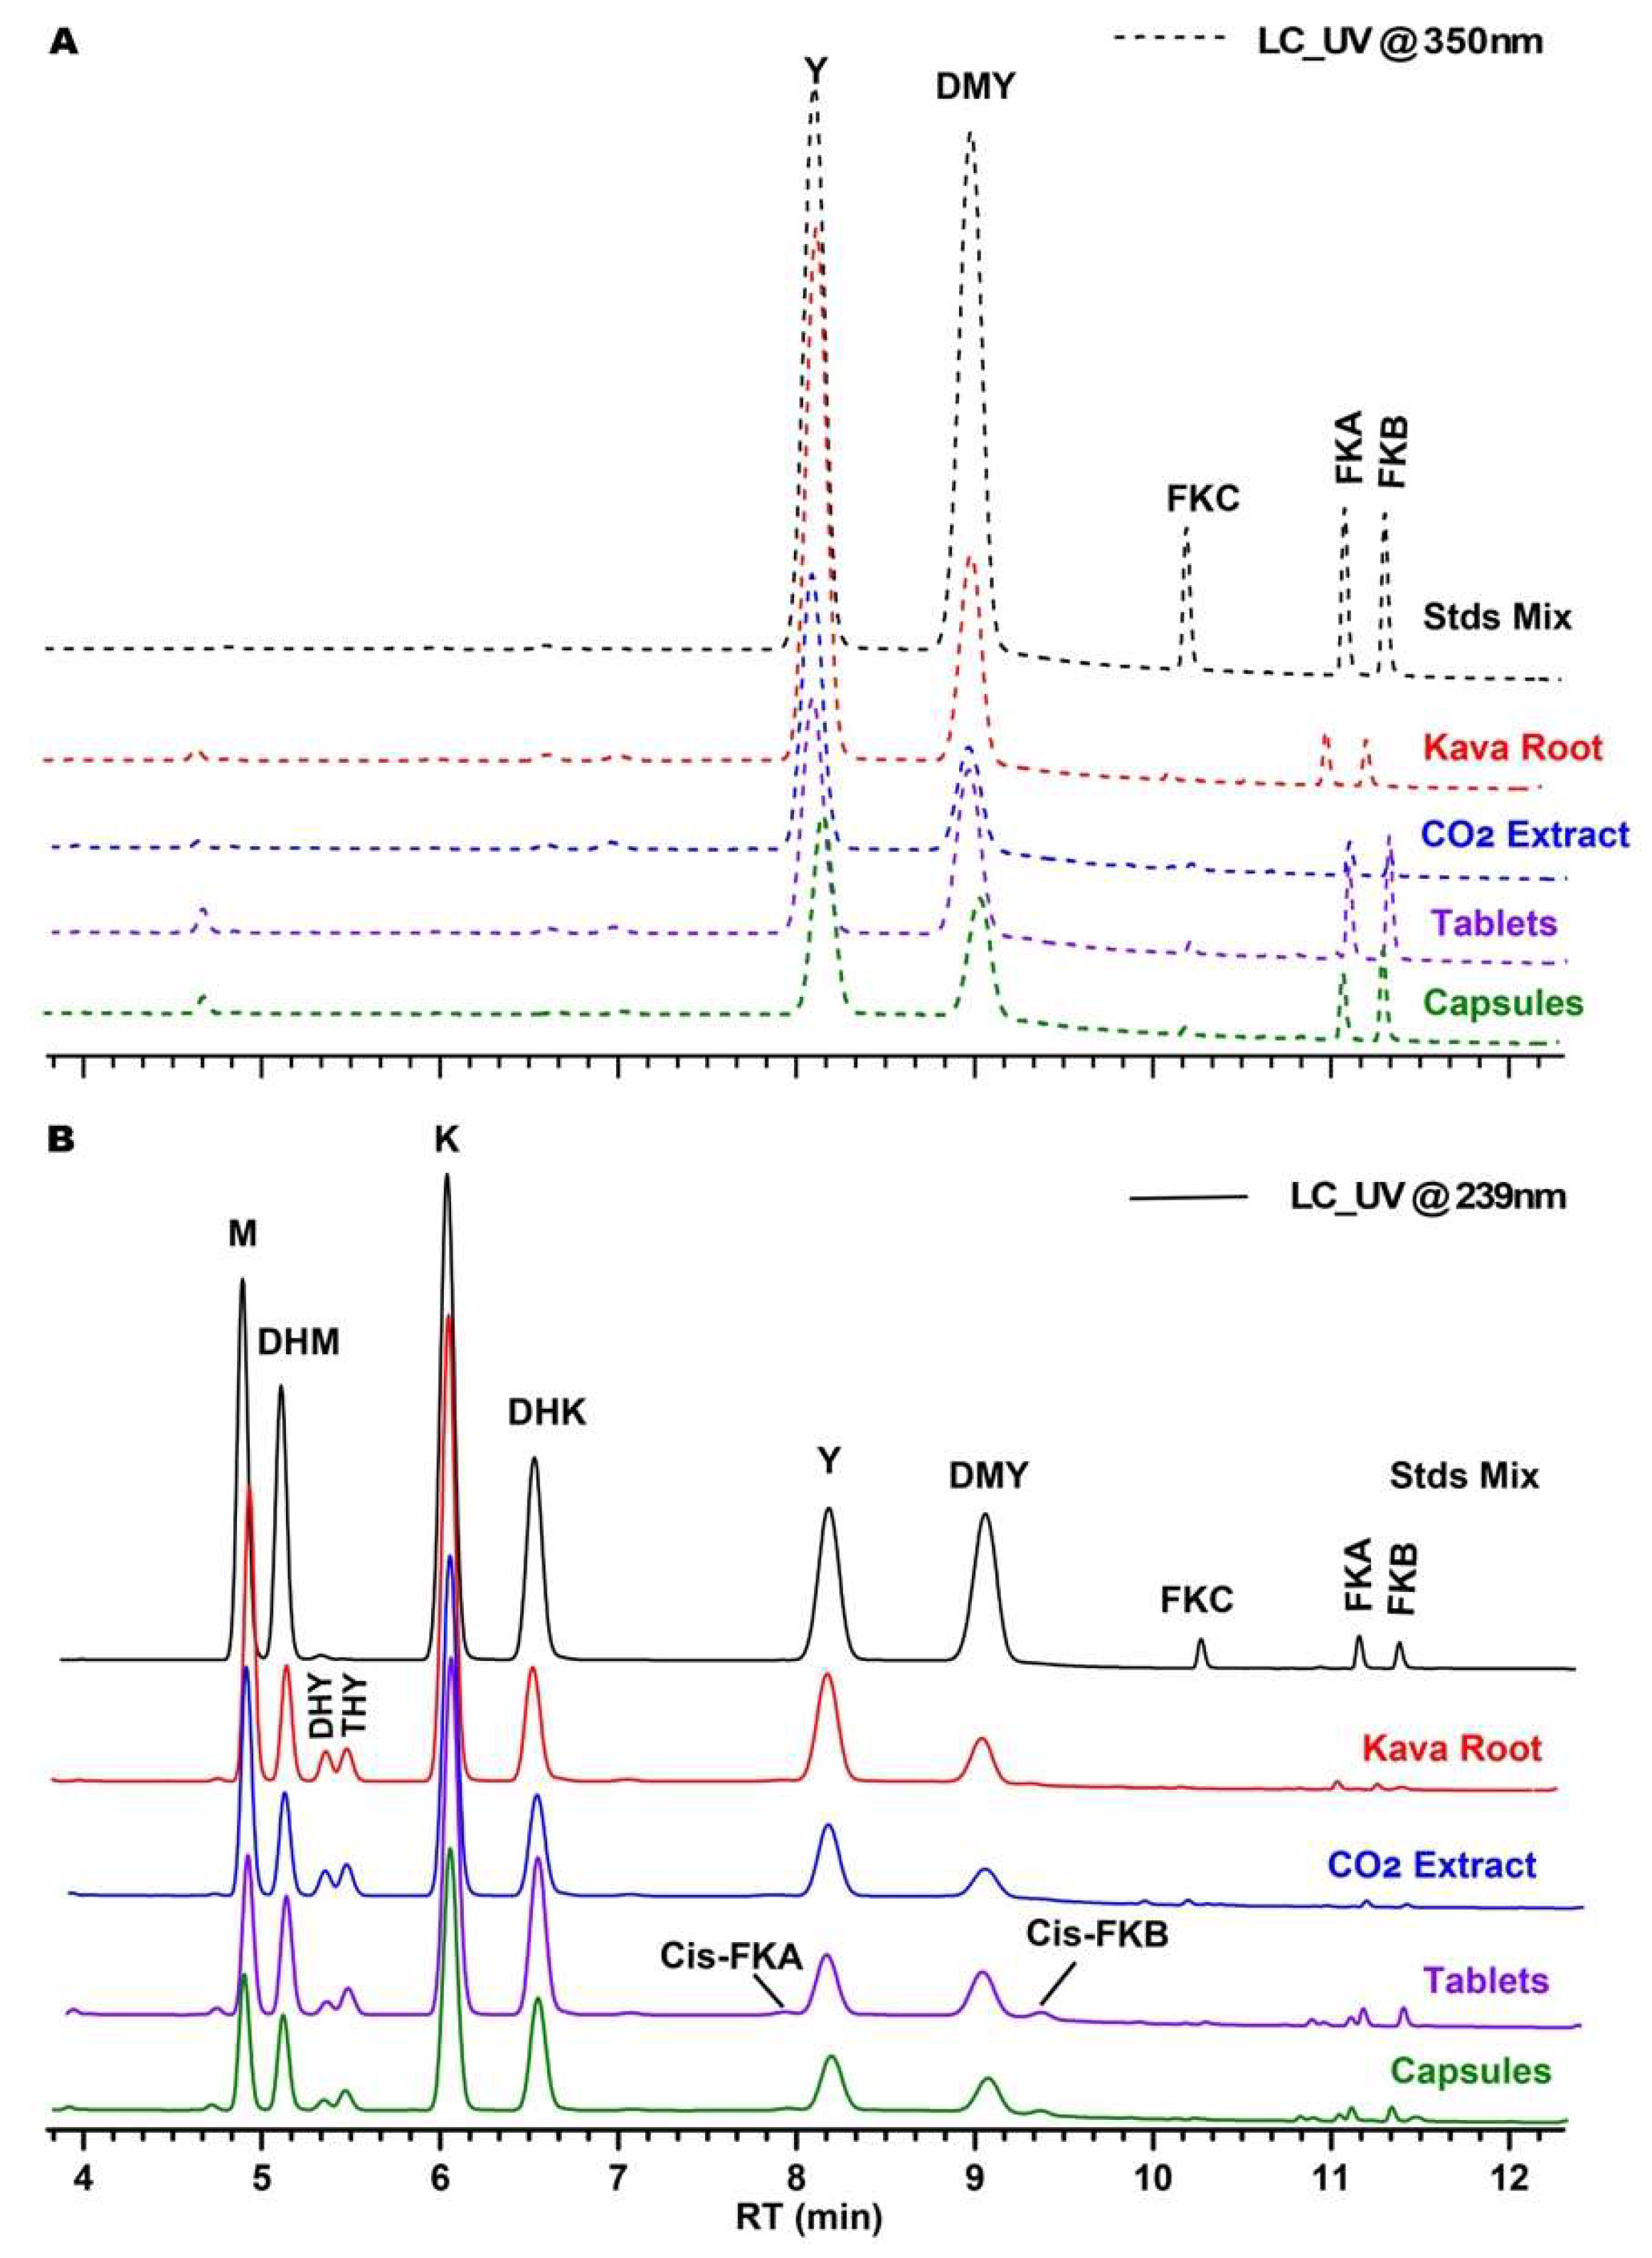
2.2.1. Specificity/Resolution
2.2.2. Standard Linearity
2.2.3. Limit of Detection and Limit of Quantification
2.2.4. Recovery
2.2.5. Precision
3. Discussion
4. Materials and Methods
4.1. Chemicals and Materials
4.2. Instrumentation
4.3. Chromatographic Condition
4.4. Standard Preparation
4.5. Test Materials and Sample Preparation
4.5.1. Kava CO2 Extract and Root Powders
4.5.2. Capsules and Phytocaps
4.6. Method Validation Parameters
4.6.1. Specificity/Resolution
4.6.2. Linearity
4.6.3. LOD and LOQ
4.6.4. Recovery
4.6.5. Precision
5. Conclusions
Supplementary Materials
Author Contributions
Funding
Conflicts of Interest
References
- Singh, Y.N. Kava-an Overview. J. Ethnopharmacol. 1992, 37, 13–45. [Google Scholar] [CrossRef]
- Pluskal, T.; Torrens-Spence, M.P.; Fallon, T.R.; de Abreu, A.; Shi, C.H.; Weng, J. The biosynthetic origin of psychoactive kavalactones in kava. Febs. Open Bio. 2018, 8, 87. [Google Scholar]
- Zhang, N.; Wu, L.; Liu, X.; Shen, X. Plant-Derived Kavalactones and Their Bioactivities. Med. Res. 2018, 2. [Google Scholar] [CrossRef]
- Naumov, P.; Dragull, K.; Yoshioka, M.; Tang, C.S.; Ng, S.W. Structural characterization of genuine (−)-pipermethystine, (−)-epoxypipermethystine, (+)-dihydromethysticin and yangonin from the kava plant (Piper methysticum). Nat. Product Commun. 2008, 3, 1333–1336. [Google Scholar] [CrossRef]
- Dragull, K.; Yoshida, W.Y.; Tang, C.S. Piperidine alkaloids from Piper methysticum. Phytochemistry 2003, 63, 193–198. [Google Scholar] [CrossRef]
- Wu, D.; Nair, M.G.; DeWitt, D.L. Novel compounds from Piper methysticum Forst (Kava Kava) roots and their effect on cyclooxygenase enzyme. J. Agric. Food Chem. 2002, 50, 701–705. [Google Scholar] [CrossRef] [PubMed]
- Dharmaratne, H.R.W.; Nanayakkara, N.P.D.; Khan, I.A. Kavalactones from Piper methysticum, and their C-13 NMR spectroscopic analyses. Phytochemistry 2002, 59, 429–433. [Google Scholar] [CrossRef]
- World Health Organization. Assessment of the Risk of Hepatotoxicity with Kava Products; World Health Organization: Geneva, Switzerland, 2007. [Google Scholar]
- Furbee, R.B.; Barlotta, K.S.; Allen, M.K.; Holstege, C.P. Hepatotoxicity associated with herbal products. Clin. Lab. Med. 2006, 26, 227. [Google Scholar] [CrossRef]
- Ulbricht, C.; Basch, E.; Boon, H.; Ernst, E.; Hammerness, P.; Sollars, D.; Tsourounis, C.; Woods, J.; Bent, S. Safety review of kava (Piper methysticum) by the Natural Standard Research Collaboration. Expert. Opin. Drug Saf. 2005, 4, 779–794. [Google Scholar] [CrossRef]
- Schmidt, M. Are kavalactones the hepatotoxic principle of kava extracts? The pitfalls of the glutathione theory. J. Altern. Complement. Med. 2003, 9, 183–187. [Google Scholar] [CrossRef]
- Wu, D.; Yu, L.; Nair, M.G.; DeWitt, D.L.; Ramsewak, R.S. Cyclooxygenase enzyme inhibitory compounds with antioxidant activities from Piper methysticum (kava kava) roots. Phytomedicine 2002, 9, 41–47. [Google Scholar] [CrossRef] [PubMed]
- Mathews, J.M.; Etheridge, A.S.; Black, S.R. Inhibition of human cytochrome P450 activities by kava extract and kavalactones. Drug Metab. Dispos. 2002, 30, 1153–1157. [Google Scholar] [CrossRef] [PubMed]
- Zhou, P.; Gross, S.; Liu, J.H.; Yu, B.Y.; Feng, L.L.; Nolta, J.; Sharma, V.; Piwnica-Worms, D.; Qiu, S.X. Flavokawain B, the hepatotoxic constituent from kava root, induces GSH-sensitive oxidative stress through modulation of IKK/NF-kappaB and MAPK signaling pathways. FASEB J. 2010, 24, 4722–4732. [Google Scholar] [CrossRef] [PubMed]
- Jhoo, J.W.; Freeman, J.P.; Heinze, T.M.; Moody, J.D.; Schnackenberg, L.K.; Beger, R.D.; Dragull, K.; Tang, C.S.; Ang, C.Y.W. In vitro cytotoxicity of nonpolar constituents from different parts of kava plant (Piper methysticum). J. Agr. Food Chem. 2006, 54, 3157–3162. [Google Scholar] [CrossRef]
- Fratini Vergano Law Firm. Scientific and Legal assistance for the Development of a Quality and Safety Standard for Kava Production and Trade in the Pacific Region. Available online: http://www.acp-eu-tbt.org/pagenewsarc.cfm?id=279CC3E89126DCC6C78B90A8D1ED66FFD4E480FBF584FA6D1FCEE8E906FEFEC8DD (accessed on 30 November 2015).
- Lebot, V.; Do, T.K.T.; Legendre, L. Detection of flavokavins (A, B, C) in cultivars of kava (Piper methysticum) using high performance thin layer chromatography (HPTLC). Food Chem. 2014, 151, 554–560. [Google Scholar] [CrossRef]
- Meissner, O.; Haberlein, H. HPLC analysis of flavokavins and kavapyrones from Piper methysticum Forst. J. Chromatogr. B Analyt. Technol. Biomed. Life Sci. 2005, 826, 46–49. [Google Scholar] [CrossRef] [PubMed]
- Murauer, A.; Ganzera, M. Quantitative Determination of Lactones in Piper methysticum (Kava-Kava) by Supercritical Fluid Chromatography. Planta Med. 2017, 83, 1053–1057. [Google Scholar] [CrossRef]
- Wang, J.; Qu, W.Y.; Jun, S.J.; Bittenbender, H.C.; Li, Q.X. Rapid determination of six kavalactones in kava root and rhizome samples using Fourier transform infrared spectroscopy and multivariate analysis in comparison with gas chromatography. Anal. Methods UK 2010, 2, 492–498. [Google Scholar] [CrossRef]
- Bilia, A.R.; Scalise, L.; Bergonzi, M.C.; Vincieri, F.F. Analysis of kavalactones from Piper methysticum (kava-kava). J. Chromatogr. B Analyt. Technol. Biomed. Life Sci. 2004, 812, 203–214. [Google Scholar] [CrossRef]
- Liu, Y.; Lund, J.A.; Murch, S.J.; Brown, P.N. Single-Lab Validation for Determination of Kavalactones and Flavokavains in Piper methysticum (Kava). Planta Med. 2018, 84, 1213–1218. [Google Scholar] [CrossRef]
- Wang, Y.; Eans, S.O.; Stacy, H.M.; Narayanapillai, S.C.; Sharma, A.; Fujioka, N.; Haddad, L.; McLaughlin, J.; Avery, B.A.; Xing, C. A stable isotope dilution tandem mass spectrometry method of major kavalactones and its applications. PLoS ONE 2018, 13, e0197940. [Google Scholar] [CrossRef]
- Horwitz, W. AOAC Guidelines for Single Laboratory Validation of Chemical Methods for Dietary Supplements and Botanicals; AOAC International: Gaithersburg, MD, USA, 2002; p. 38. [Google Scholar]
- Guideline, I.H.T. Validation of Analytical Procedures: Text and Methodology. In Proceedings of the International Conference on Harmonization, Geneva, Switzerland, November 2005. [Google Scholar]
- Schmidt, A.H.; Molnar, I. Computer-assisted optimization in the development of a high-performance liquid chromatographic method for the analysis of kava pyrones in Piper methysticum preparations (vol 948, pg 51, 2002). J. Chromatogr. A 2006, 1110, 272. [Google Scholar] [CrossRef]
- Smith, R.M.; Thakrar, H.; Arowolo, T.A.; Shafi, A.A. High-Performance Liquid-Chromatography of Kava Lactones from Piper-Methysticum. J. Chromatogr. 1984, 283, 303–308. [Google Scholar] [CrossRef]
- Bobeldijk, I.; Boonzaaijer, G.; Spies-Faber, E.J.; Vaes, W.H.J. Determination of kava lactones in food supplements by liquid chromatography-atmospheric pressure chemical ionisation tandem mass spectrometry. J. Chromatogr. A 2005, 1067, 107–114. [Google Scholar] [CrossRef] [PubMed]
- Lebot, V.; Merlin, M.; Lindstrom, L. Kava: The Pacific Drug; Yale University Press: New Haven, CT, USA, 1992; p. 255. [Google Scholar]
- Lebot, V.; Le´vesque, J. The origin and distribution of kava (Piper methysticum Forst. f. Piperaceae): A phytochemical approach. Allertonia 1989, 5, 223–380. [Google Scholar]
- Lebot, V.; Le´vesque, J. Genetic control of kavalactone chemo-types in Piper methysticum cultivars. Phytochemistry 1996, 43, 397–403. [Google Scholar] [CrossRef]
Sample Availability: Not Available. |


| Time/min | A (H2O, %) | B (IPA, %) | Flow Rate (mL/min) |
|---|---|---|---|
| 0.00 | 95 | 5 | 0.50 |
| 0.35 | 90 | 10 | 0.50 |
| 0.39 | 78 | 22 | |
| 2.00 | 78 | 22 | 0.43 |
| 7.00 | 78 | 22 | 0.41 |
| 7.50 | 71 | 29 | 0.41 |
| 10.50 | 25 | 75 | 0.41 |
| 11.50 | 0 | 100 | 0.41 |
| 12.80 | 0 | 100 | 0.41 |
| 13.00 | 95 | 5 | 0.41 |
| 15.00 | 95 | 5 | 0.44 |
| 15.50 | End | 0.50 | |
| Compound | Retention Factor (k′) | Relative RT (α) | Chromatographic Resolution (Rs) |
|---|---|---|---|
| Methysticin (1) | 8.01 | – | – |
| Dihydromethysticin (2) | 8.41 | α1/2 = 1.045 | R1/2 = 1.78 |
| Kavain (3) | 10.15 | α2/3 = 1.184 | R2/3 = 6.61 |
| Dihdyrokavain (4) | 11.07 | α3/4 = 1.082 | R3/4 = 3.02 |
| Yangonin (5) | 14.12 | α4/5 = 1.253 | R4/5 = 8.20 |
| Desmethoxyyangonin (6) | 15.76 | α5/6 = 1.109 | R5/6 = 3.62 |
| Flavokavain C (7) | 18.18 | α6/7 = 1.144 | R6/7 = 7.67 |
| Flavokavain A (8) | 19.86 | α7/8 = 1.088 | R7/8 = 11.92 |
| Flavokavain B (9) | 20.29 | α8/9 = 1.020 | R8/9 = 3.04 |
| Calibration Range (μg/mL) | Slope (±SD) a | Y-Intercept (±SD) a | r2 (±SD) a | LOD (μg/mL) | LOQ (μg/mL) | |
|---|---|---|---|---|---|---|
| Methysitcin | 0.50~75.0 | 106708.0 ± 700.0 | −3443.1 ± 4846.8 | 0.99996 ± 0.00005 | 0.150 | 0.454 |
| DHM | 80132.1 ± 502.3 | 6666.6 ± 3847.5 | 0.99997 ± 0.00002 | 0.158 | 0.480 | |
| Kavain | 176782.0 ± 1450.0 | −5987.0 ± 4889.8 | 0.99996 ± 0.00004 | 0.091 | 0.277 | |
| DHK | 80884.5 ± 381.5 | 11433.5 ± 5551.5 | 0.99995 ± 0.00002 | 0.226 | 0.686 | |
| Yangonin | 167271.0 ± 1964.9 | 3729.7 ± 3167.9 | 0.99994 ± 0.00003 | 0.062 | 0.189 | |
| DMY | 164787.0 ± 2352.4 | −12618.3 ± 6952.1 | 0.99995 ± 0.00003 | 0.139 | 0.422 | |
| FKC | 0.05~7.50 | 135720.0 ± 3576.4 | −3194.0 ± 3663.5 | 0.99970 ± 0.00017 | 0.089 | 0.270 |
| FKA | 143817.0 ± 2873.9 | 768.8 ± 889 | 0.99980 ± 0.00018 | 0.020 | 0.062 | |
| FKB | 150461.0 ± 3339.0 | −1374.6 ± 4555.5 | 0.99988 ± 0.00017 | 0.100 | 0.303 |
| Methysticin | DHM | Kavain | DHK | DMY | Yangonin | FKC | FKA | FKB | |
|---|---|---|---|---|---|---|---|---|---|
| Spiked Level | 3.0% | ~0.3% | |||||||
| Native (μg/mL) a | 40.16 ± 0.62 | 22.14 ± 0.34 | 47.80 ± 0.74 | 29.75 ± 0.46 | 36.94 ± 0.57 | 14.52 ± 0.22 | 0.296 ± 0.005 | 1.27 ± 0.02 | 1.03 ± 0.02 |
| Spiked (μg/mL) b | 60.02 ± 0.80 | 58.73 ± 0.78 | 59.28 ± 0.79 | 59.23 ± 0.79 | 59.36 ± 0.79 | 57.73 ± 0.77 | 5.67 ± 0.08 | 7.99 ± 0.11 | 5.76 ± 0.08 |
| After Spiked (μg/mL) b | 100.2 ± 0.2 | 80.87 ± 0.44 | 107.1 ± 0.1 | 88.99 ± 0.33 | 96.30 ± 0.22 | 72.24 ± 0.54 | 5.97 ± 0.07 | 9.25 ± 0.09 | 6.79 ± 0.06 |
| Detected (μg/mL) a | 101.5 ± 0.3 | 81.43 ± 0.51 | 109.6 ± 0.6 | 89.63 ± 0.44 | 98.21 ± 0.41 | 73.42 ± 0.36 | 5.86 ± 0.16 | 9.48 ± 0.14 | 6.92 ± 0.11 |
| Marginal recovery (%) a | 102.1 ± 0.1 | 101.0 ± 0.1 | 104.2 ± 1.0 | 101.1 ± 0.4 | 103.2 ± 0.6 | 102.0 ± 0.4 | 98.1 ± 1.6c | 102.9 ± 0.6 | 102.2 ± 0.8 |
| Total Recovery (%) a | 101.3 ± 0.1 | 100.7 ± 0.1 | 102.3 ± 0.5 | 100.7 ± 0.3 | 102.0 ± 0.4 | 101.6 ± 0.3 | 98.2 ± 1.5 | 102.5 ± 0.5 | 101.3 ± 0.1 |
| Spiked Level | 1.5% | ~0.15% | |||||||
| Native (μg/mL) a | 41.04 ± 0.81 | 22.63 ± 0.45 | 48.86 ± 0.97 | 30.41 ± 0.60 | 37.76 ± 0.75 | 14.84 ± 0.29 | 0.302 ± 0.006 | 1.29 ± 0.03 | 1.05 ± 0.02 |
| Spiked (μg/mL) b | 30.21 ± 0.15 | 29.55 ± 0.15 | 29.83 ± 0.15 | 29.81 ± 0.15 | 29.87 ± 0.15 | 29.05 ± 0.14 | 2.86 ± 0.014 | 4.02 ± 0.02 | 2.90 ± 0.01 |
| After Spiked (μg/mL) b | 71.25 ± 0.66 | 52.18 ± 0.30 | 78.69 ± 0.82 | 60.22 ± 0.46 | 67.63 ± 0.60 | 43.89 ± 0.15 | 3.15 ± 0.01 | 5.31 ± 0.01 | 3.95 ± 0.01 |
| Detected (μg/mL) a | 70.50 ± 0.74 | 51.73 ± 0.42 | 78.02 ± 1.17 | 59.63 ± 0.51 | 67.21 ± 0.83 | 44.12 ± 0.36 | 3.10 ± 0.02 | 5.36 ± 0.02 | 3.97 ± 0.02 |
| Marginal recovery (%) a | 97.4 ± 2.5 | 99.0 ± 1.6 | 93.8 ± 2.5 | 98.6 ± 1.1 | 97.8 ± 2.9 | 100.8 ± 0.9 | 98.4 ± 0.5 | 101.0 ± 0.5 | 100.3 ± 0.9 |
| Total Recovery (%) a | 99.0 ± 1.1 | 99.1 ± 0.9 | 99.2 ± 1.0 | 99.0 ± 0.5 | 99.4 ± 1.3 | 100.5 ± 0.6 | 98.1 ± 0.5 | 100.8 ± 0.4 | 100.3 ± 0.7 |
| Spiked Level | 0.25% | ~0.025% | |||||||
| Native (μg/mL) a | 40.83 ± 0.91 | 22.51 ± 0.50 | 48.60 ± 1.09 | 30.25 ± 0.68 | 37.56 ± 0.84 | 14.76 ± 0.33 | 0.300 ± 0.007 | 1.29 ± 0.03 | 1.05 ± 0.02 |
| Spiked (μg/mL) b | 5.01 ± 0.07 | 4.90 ± 0.07 | 4.95 ± 0.07 | 4.94 ± 0.07 | 4.95 ± 0.07 | 4.82 ± 0.07 | 0.473 ± 0.007 | 0.67 ± 0.01 | 0.48 ± 0.01 |
| After Spiked (μg/mL) b | 45.84 ± 0.85 | 27.41 ± 0.44 | 53.55 ± 1.02 | 35.20 ± 0.62 | 42.51 ± 0.78 | 19.58 ± 0.27 | 0.774 ± 0.004 | 1.95 ± 0.02 | 1.53 ± 0.02 |
| Detected (μg/mL) a | 45.51 ± 1.06 | 27.45 ± 0.51 | 53.47 ± 1.30 | 35.25 ± 0.78 | 42.21 ± 1.06 | 19.66 ± 0.32 | 0.779 ± 0.002 | 1.96 ± 0.03 | 1.53 ± 0.03 |
| Marginal recovery (%) a | 93.6 ± 4.8 | 100.7 ± 1.4 | 98.5 ± 5.7 | 101.1 ± 3.6 | 93.9 ± 5.6 | 101.7 ± 1.1 | 101.0 ± 0.7 | 101.7 ± 1.5 | 99.9 ± 3.2 |
| Total Recovery (%) a | 99.3 ± 0.5 | 100.1 ± 0.2 | 99.9 ± 0.5 | 100.1 ± 0.5 | 99.3 ± 0.7 | 100.4 ± 0.3 | 100.6 ± 0.4 | 100.6 ± 0.5 | 100.0 ± 1.0 |
| Methysticin | DHM | Kavain | DHK | Yangonin | DMY | FKC | FKA | FKB | ||
|---|---|---|---|---|---|---|---|---|---|---|
| Tablets | ||||||||||
| LOQ (mg/g) | 0.076 | 0.080 | 0.046 | 0.114 | 0.032 | 0.070 | 0.045 | 0.010 | 0.051 | |
| D1 | Mean ± SD (mg/g) | 3.79 ± 0.03 | 3.94 ± 0.03 | 6.71 ± 0.07 | 7.17 ± 0.06 | 3.55 ± 0.03 | 2.76 ± 0.03 | 0.082 ± 0.001 | 0.477 ± 0.007 | 0.627 ± 0.008 |
| RSDr (%) Intraday | 0.86 | 0.80 | 1.06 | 0.82 | 0.98 | 1.08 | 1.28 | 1.39 | 1.32 | |
| D2 | Mean ± SD (mg/g) | 3.83 ± 0.01 | 3.96 ± 0.01 | 6.67 ± 0.03 | 7.05 ± 0.04 | 3.58 ± 0.04 | 2.78 ± 0.04 | 0.076 ± 0.001 | 0.452 ± 0.002 | 0.587 ± 0.002 |
| RSDr (%) Intraday | 0.34 | 0.34 | 0.45 | 0.50 | 1.22 | 1.30 | 1.64 | 0.49 | 0.28 | |
| D3 | Mean ± SD (mg/g) | 3.83 ± 0.02 | 3.96 ± 0.01 | 6.68 ± 0.02 | 7.06 ± 0.04 | 3.64 ± 0.03 | 2.75 ± 0.02 | 0.078 ± 0.001 | 0.459 ± 0.001 | 0.592 ± 0.002 |
| RSDr (%) Intraday | 0.39 | 0.28 | 0.32 | 0.60 | 0.81 | 0.70 | 0.77 | 0.23 | 0.49 | |
| Mean ± SD (mg/g) | 3.81 ± 0.03 | 3.95 ± 0.02 | 6.69 ± 0.05 | 7.09 ± 0.07 | 3.59 ± 0.05 | 2.77 ± 0.03 | 0.079 ± 0.003 | 0.463 ± 0.011 | 0.602 ± 0.019 | |
| RSD (%) Interday | 0.73 | 0.54 | 0.68 | 1.04 | 1.40 | 1.05 | 3.75 | 2.44 | 3.20 | |
| HorRat | 0.32 | 0.24 | 0.32 | 0.50 | 0.60 | 0.43 | 0.91 | 0.77 | 1.05 | |
| Capsules | ||||||||||
| LOQ (mg/g) | 0.151 | 0.160 | 0.092 | 0.229 | 0.063 | 0.141 | 0.090 | 0.021 | 0.101 | |
| D1 | Mean± SD (mg/g) | 5.87 ± 0.07 | 5.80 ± 0.05 | 9.09 ± 0.09 | 9.48 ± 0.11 | 5.85 ± 0.09 | 3.74 ± 0.05 | 0.103 ± 0.002 | 0.702 ± 0.008 | 0.920 ± 0.010 |
| RSDr (%) Intraday | 1.14 | 0.82 | 0.97 | 1.20 | 1.50 | 1.33 | 2.18 | 1.16 | 1.08 | |
| D2 | Mean± SD (mg/g) | 5.98 ± 0.07 | 5.93 ± 0.08 | 9.33 ± 0.12 | 9.73 ± 0.14 | 6.06 ± 0.10 | 3.83 ± 0.07 | 0.094 ± 0.004 | 0.773 ± 0.011 | 0.999 ± 0.019 |
| RSDr (%) Intraday | 1.10 | 1.31 | 1.29 | 1.45 | 1.66 | 1.74 | 4.24 | 1.39 | 1.93 | |
| D3 | Mean± SD (mg/g) | 5.99 ± 0.12 | 5.98 ± 0.11 | 9.37 ± 0.12 | 9.85 ± 0.13 | 6.07 ± 0.10 | 3.87 ± 0.06 | 0.101 ± 0.002 | 0.796 ± 0.011 | 1.012 ± 0.012 |
| RSDr (%) Intraday | 1.96 | 1.82 | 1.32 | 1.32 | 1.59 | 1.58 | 2.04 | 1.43 | 1.21 | |
| Mean± SD (mg/g) | 5.95 ± 0.10 | 5.90 ± 0.11 | 9.26 ± 0.17 | 9.69 ± 0.20 | 6.00 ± 0.14 | 3.81 ± 0.08 | 0.099 ± 0.004 | 0.757 ± 0.042 | 0.977 ± 0.044 | |
| RSDr (%) Interday | 1.67 | 1.84 | 1.80 | 2.06 | 2.26 | 2.06 | 4.51 | 5.56 | 4.49 | |
| HorRat | 0.77 | 0.85 | 0.89 | 1.03 | 1.05 | 0.89 | 1.13 | 1.89 | 1.59 | |
| CO2 Extract | ||||||||||
| LOQ (mg/g) | 0.454 | 0.480 | 0.277 | 0.686 | 0.189 | 0.422 | 0.270 | 0.062 | 0.303 | |
| D1 | Mean± SD (mg/g) | 42.39 ± 0.41 | 26.75 ± 0.29 | 50.5 ± 0.7 | 36.2 ± 0.5 | 32.5 ± 0.3 | 14.0 ± 0.1 | 0.29 ± 0.01 | 1.34 ± 0.02 | 0.84 ± 0.02 |
| RSDr (%) Intraday | 0.97 | 1.08 | 1.28 | 1.39 | 1.06 | 0.99 | 2.13 | 1.84 | 2.11 | |
| D2 | Mean± SD (mg/g) | 42.81 ± 0.21 | 27.0 ± 0.2 | 50.6 ± 0.3 | 36.2 ± 0.4 | 33.1 ± 0.2 | 14.2 ± 0.1 | 0.29 ± 0.01 | 1.43 ± 0.02 | 0.85 ± 0.01 |
| RSDr (%) Intraday | 0.50 | 0.54 | 0.55 | 0.97 | 0.56 | 0.38 | 2.09 | 1.34 | 1.22 | |
| D3 | Mean± SD (mg/g) | 42.75 ± 0.53 | 27.1 ± 0.3 | 50.8 ± 0.5 | 36.9 ± 0.4 | 33.3 ± 0.2 | 14.1 ± 0.1 | 0.270 ± 0.004 | 1.47 ± 0.02 | 0.89 ± 0.03 |
| RSDr (%) Intraday | 1.25 | 1.08 | 0.88 | 1.18 | 0.74 | 0.68 | 1.59 | 1.15 | 3.83 | |
| Mean± SD (mg/g) | 42.65 ± 0.42 | 27.0 ± 0.3 | 50.6 ± 0.5 | 36.4 ± 0.5 | 33.0 ± 0.4 | 14.1 ± 0.1 | 0.28 ± 0.01 | 1.41 ± 0.06 | 0.86 ± 0.03 | |
| RSDr (%) Interday | 0.99 | 1.04 | 0.92 | 1.49 | 1.29 | 0.85 | 3.92 | 4.27 | 3.37 | |
| HorRat | 0.62 | 0.60 | 0.59 | 0.91 | 0.78 | 0.45 | 1.15 | 1.60 | 1.17 | |
| Root | ||||||||||
| LOQ (mg/g) | 0.151 | 0.160 | 0.092 | 0.229 | 0.063 | 0.141 | 0.090 | 0.021 | 0.101 | |
| D1 | Mean± SD (mg/g) | 20.2 ± 0.1 | 11.05 ± 0.05 | 25.9 ± 0.4 | 14.7 ± 0.1 | 18.8 ± 0.1 | 7.31 ± 0.05 | 0.128 ± 0.001 | 0.64 ± 0.01 | 0.52 ± 0.01 |
| RSDr (%) Intraday | 0.58 | 0.49 | 1.61 | 0.95 | 0.63 | 0.75 | 1.11 | 0.98 | 1.10 | |
| D2 | Mean± SD (mg/g) | 20.3 ± 0.1 | 11.11 ± 0.04 | 25.3 ± 0.2 | 14.8 ± 0.2 | 18.6 ± 0.2 | 7.33 ± 0.07 | 0.139 ± 0.003 | 0.70 ± 0.01 | 0.57 ± 0.01 |
| RSDr (%) Intraday | 0.31 | 0.38 | 0.87 | 1.14 | 1.01 | 0.97 | 2.14 | 1.51 | 1.39 | |
| D3 | Mean± SD (mg/g) | 20.00 ± 0.12 | 10.89 ± 0.06 | 24.68 ± 0.18 | 14.65 ± 0.08 | 18.55 ± 0.12 | 7.23 ± 0.06 | 0.137 ± 0.001 | 0.63 ± 0.01 | 0.514 ± 0.003 |
| RSDr (%) Intraday | 0.60 | 0.54 | 0.73 | 0.57 | 0.63 | 0.88 | 0.95 | 0.81 | 0.66 | |
| Mean± SD (mg/g) | 20.19 ± 0.17 | 11.02 ± 0.11 | 25.30 ± 0.59 | 14.74 ± 0.15 | 18.62 ± 0.16 | 7.29 ± 0.07 | 0.135 ± 0.006 | 0.66 ± 0.03 | 0.53 ± 0.03 | |
| RSDr (%) Interday | 0.86 | 0.96 | 2.32 | 1.00 | 0.88 | 1.02 | 4.13 | 4.64 | 5.20 | |
| HorRat | 0.48 | 0.49 | 1.33 | 0.53 | 0.48 | 0.49 | 1.09 | 1.55 | 1.69 | |
© 2019 by the authors. Licensee MDPI, Basel, Switzerland. This article is an open access article distributed under the terms and conditions of the Creative Commons Attribution (CC BY) license (http://creativecommons.org/licenses/by/4.0/).
Share and Cite
Tang, Y.; Fields, C. A UHPLC-UV Method Development and Validation for Determining Kavalactones and Flavokavains in Piper methysticum (Kava). Molecules 2019, 24, 1245. https://doi.org/10.3390/molecules24071245
Tang Y, Fields C. A UHPLC-UV Method Development and Validation for Determining Kavalactones and Flavokavains in Piper methysticum (Kava). Molecules. 2019; 24(7):1245. https://doi.org/10.3390/molecules24071245
Chicago/Turabian StyleTang, Yijin, and Christine Fields. 2019. "A UHPLC-UV Method Development and Validation for Determining Kavalactones and Flavokavains in Piper methysticum (Kava)" Molecules 24, no. 7: 1245. https://doi.org/10.3390/molecules24071245