
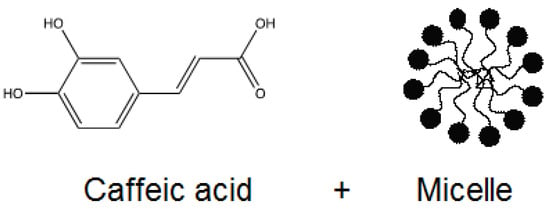
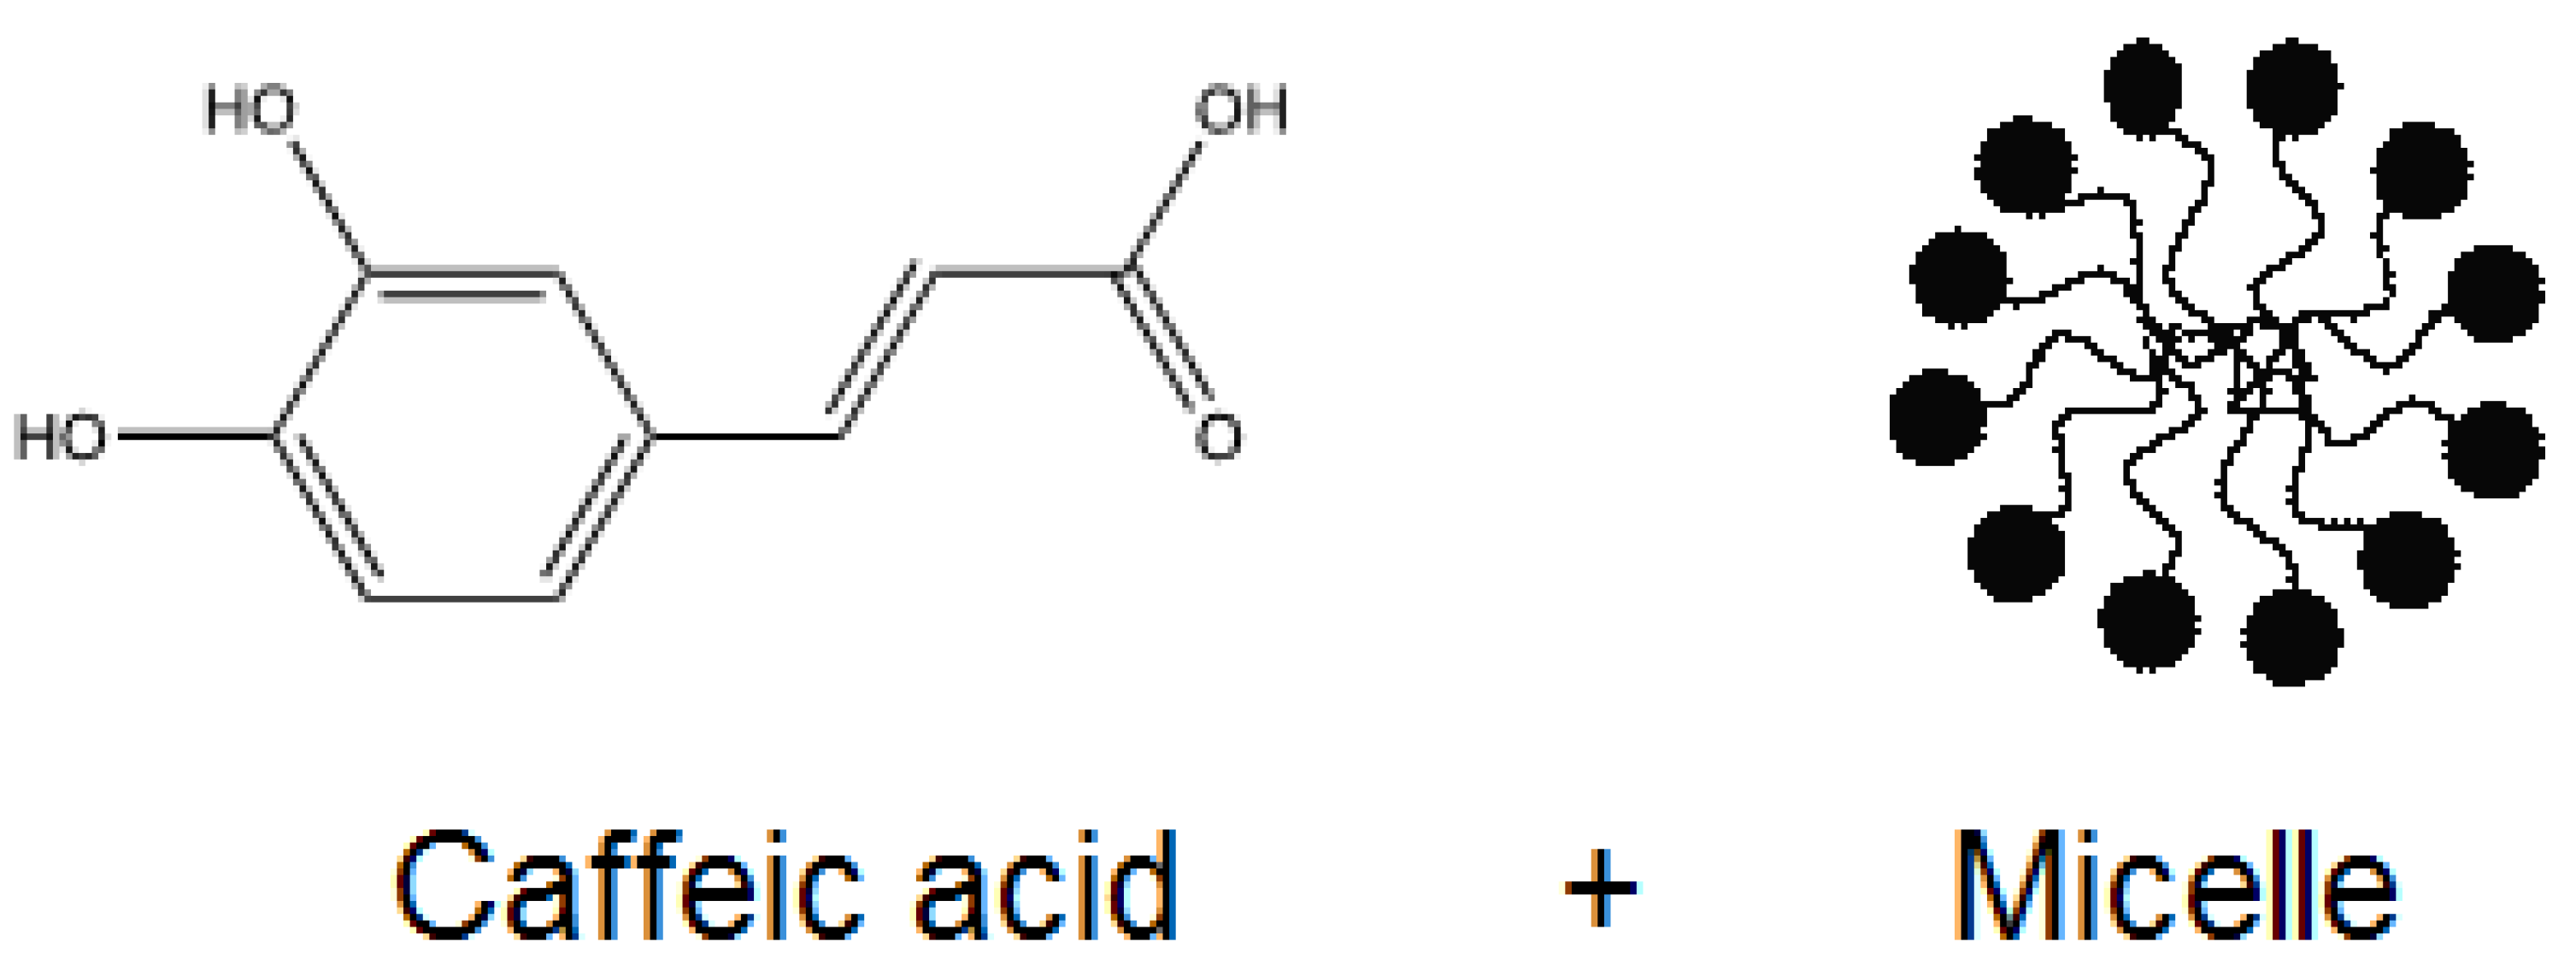
Interaction of Caffeic Acid with SDS Micellar Aggregates


Abstract
:
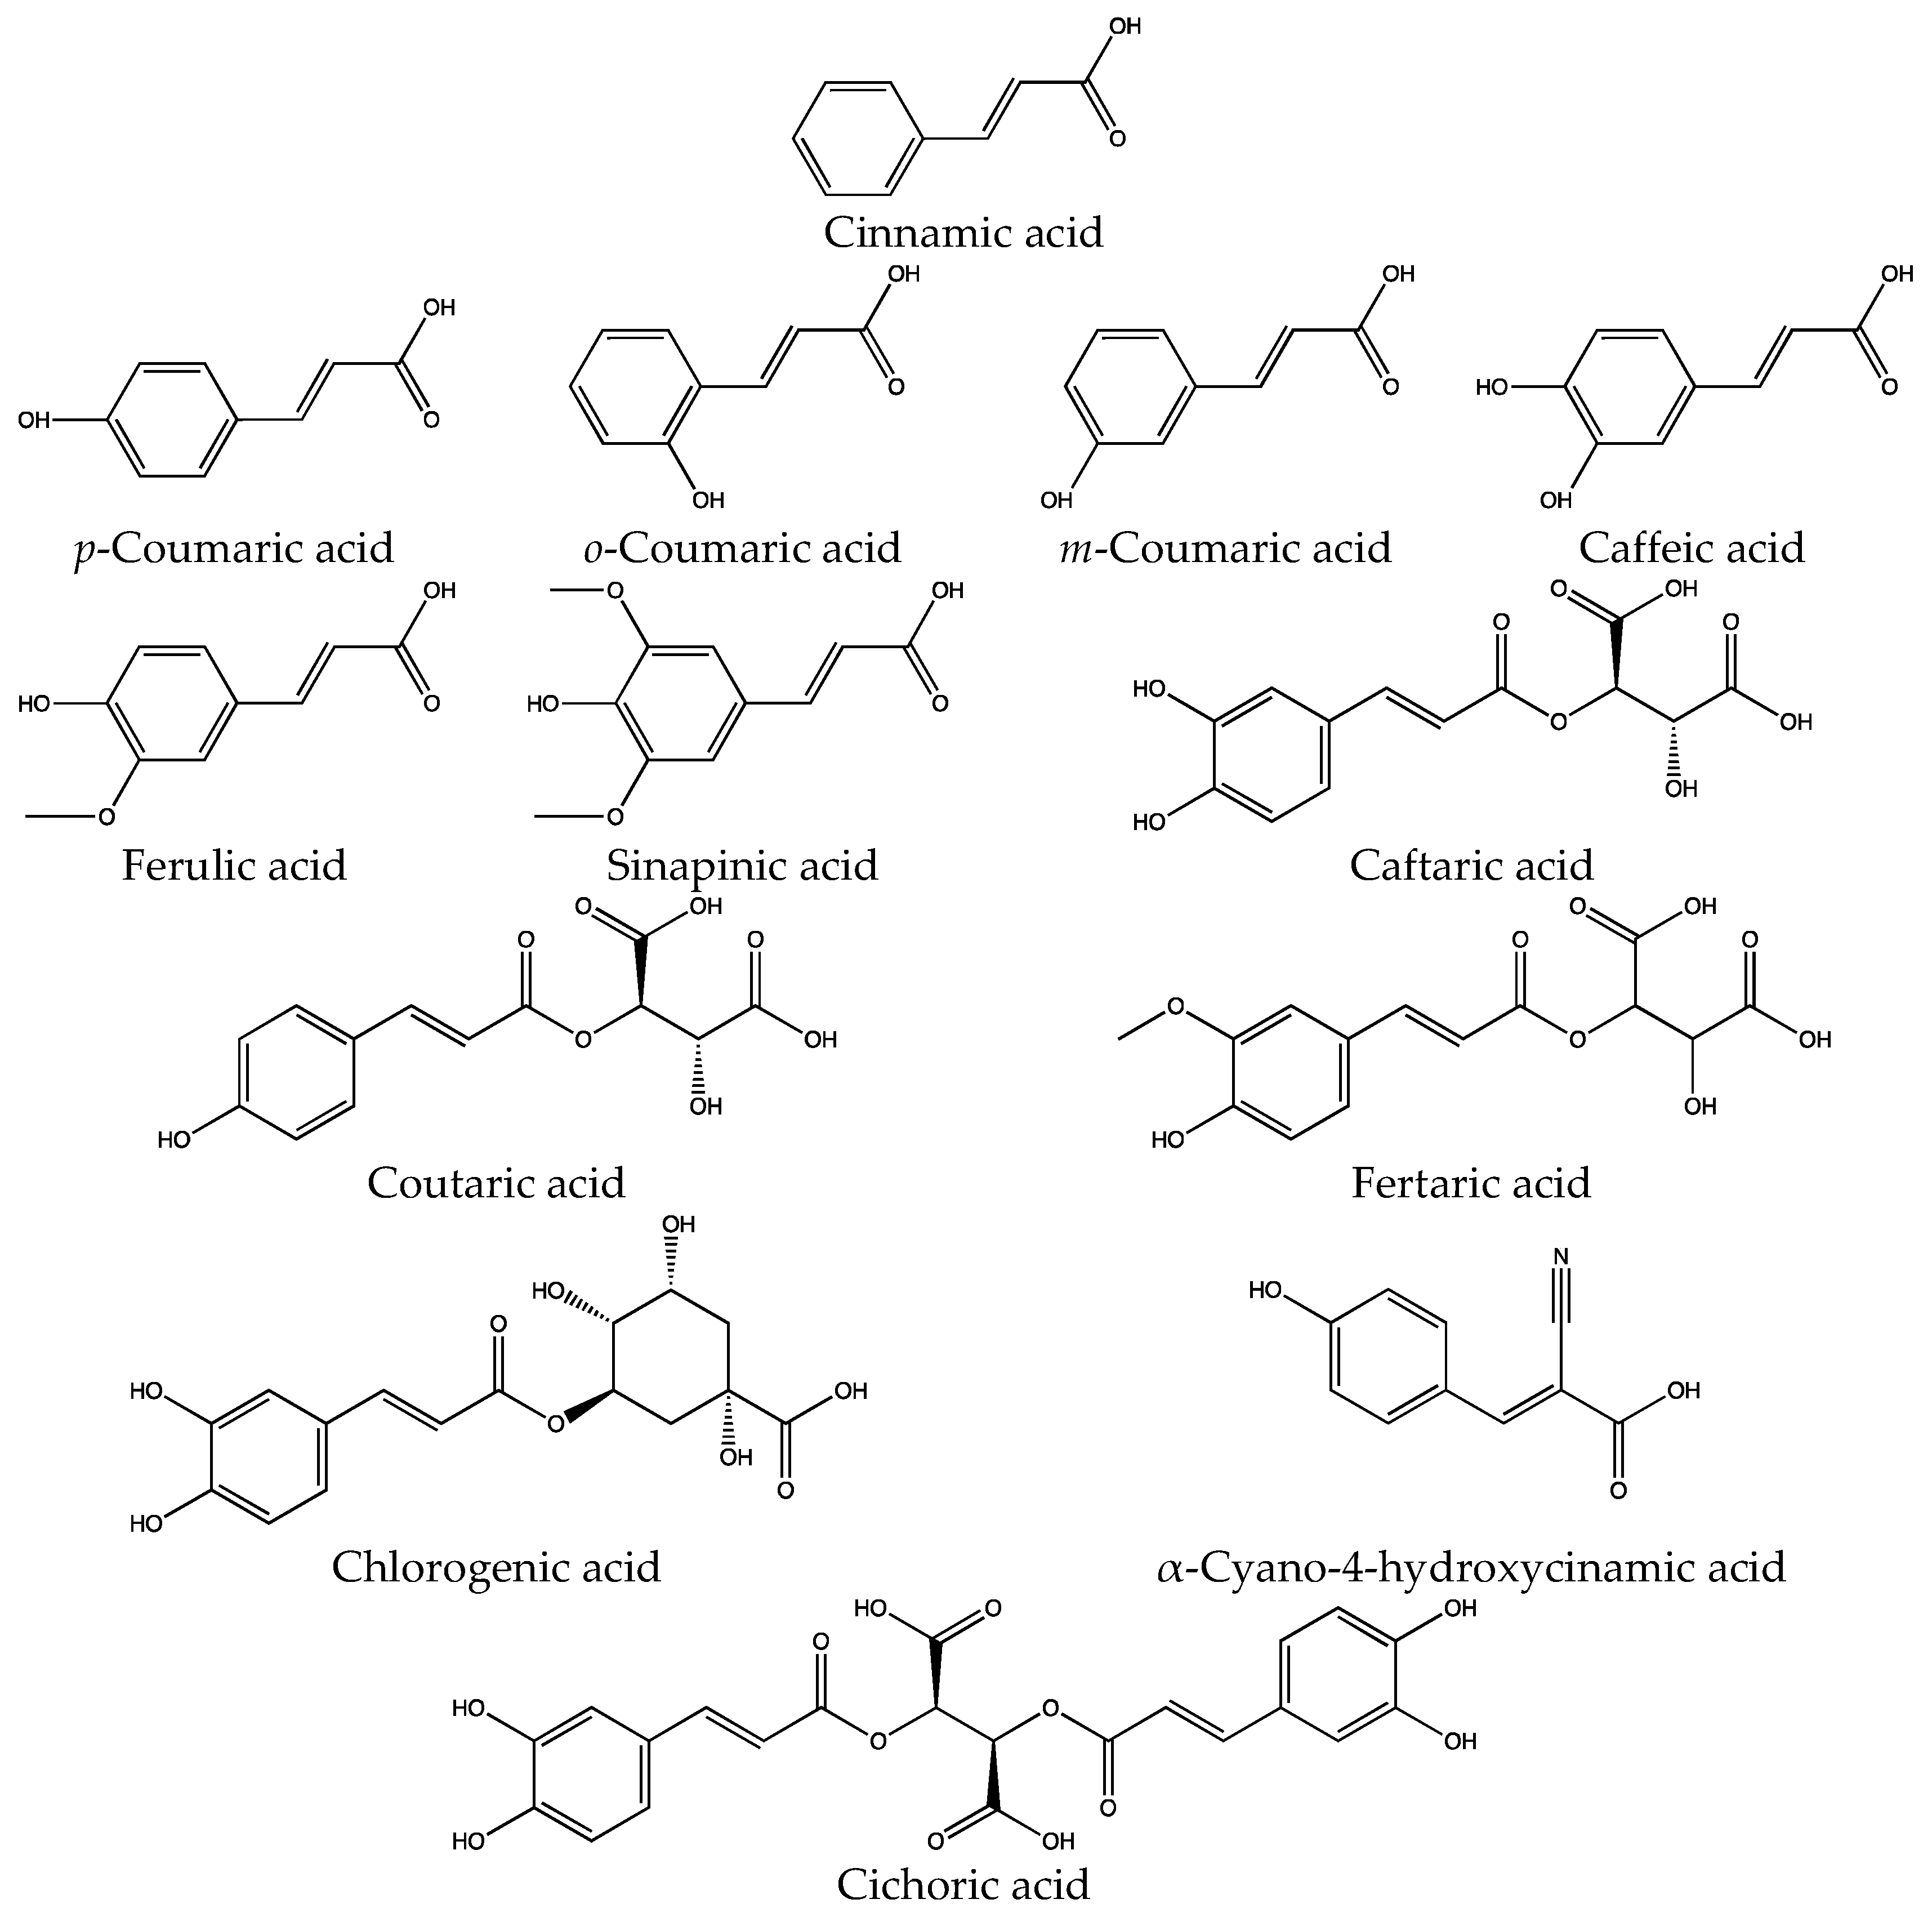
1. Introduction
2. Results and Discussion
3. Materials and Methods
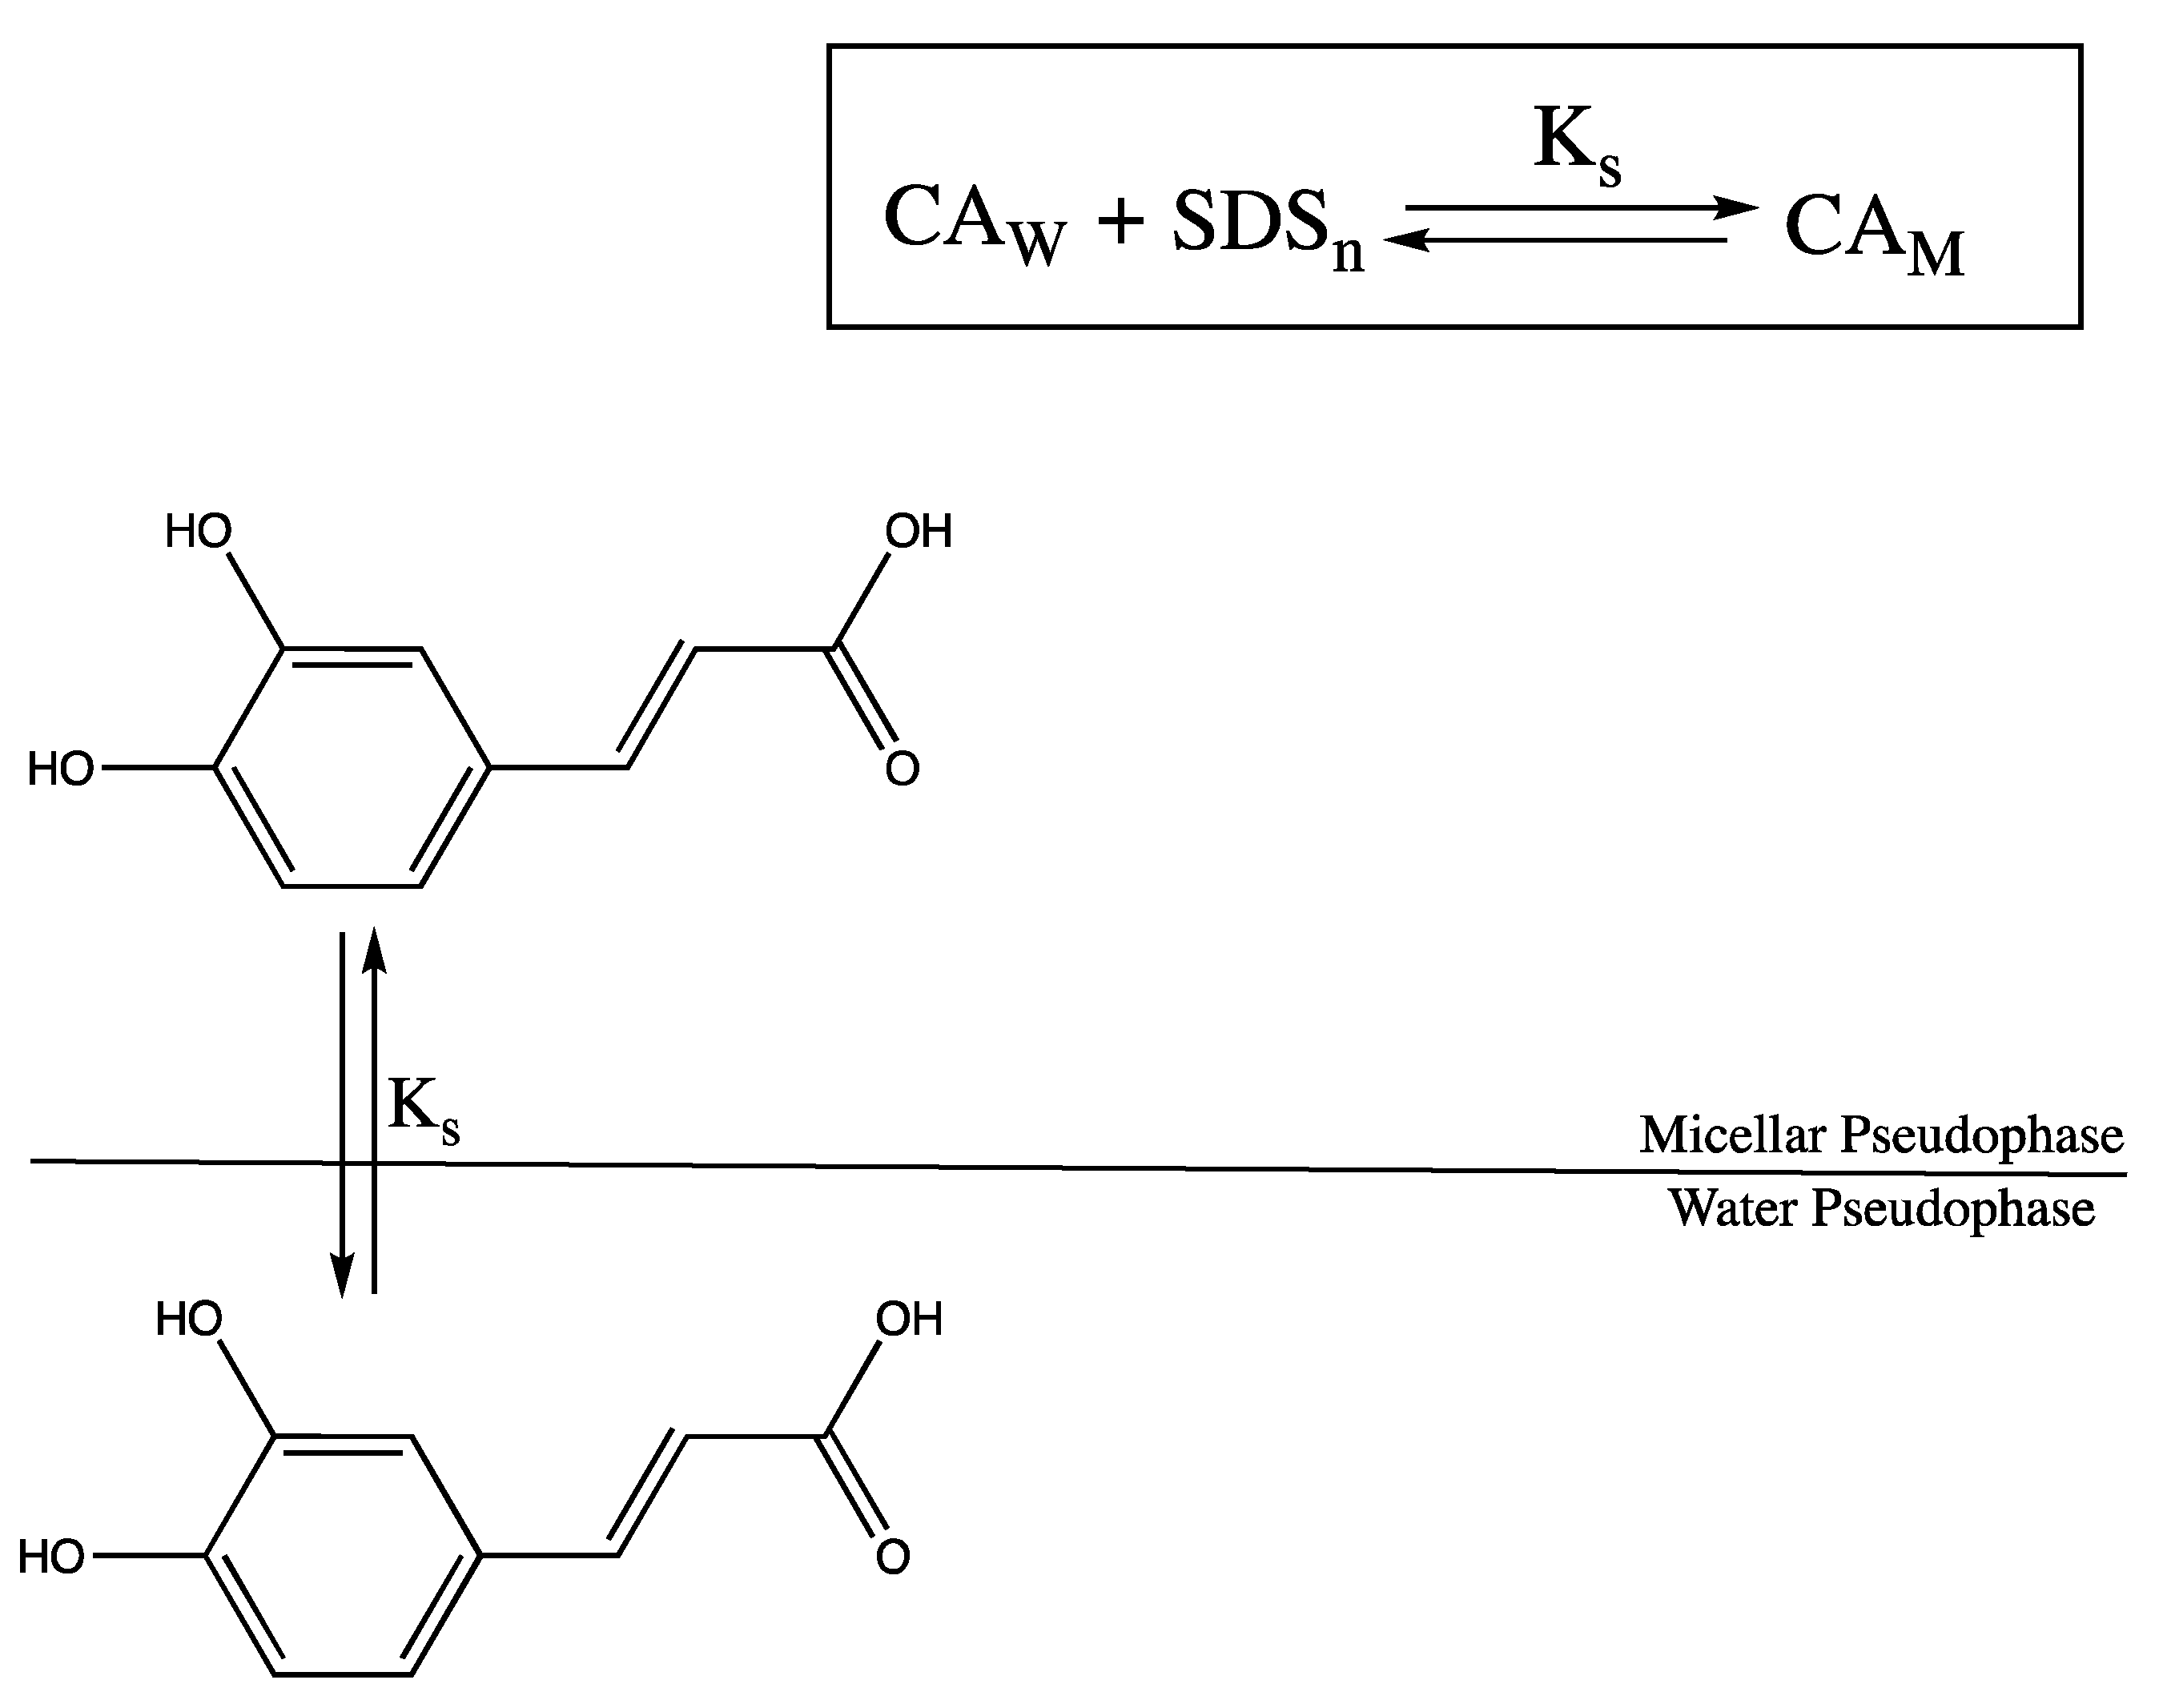
3.1. Binding Mechanism
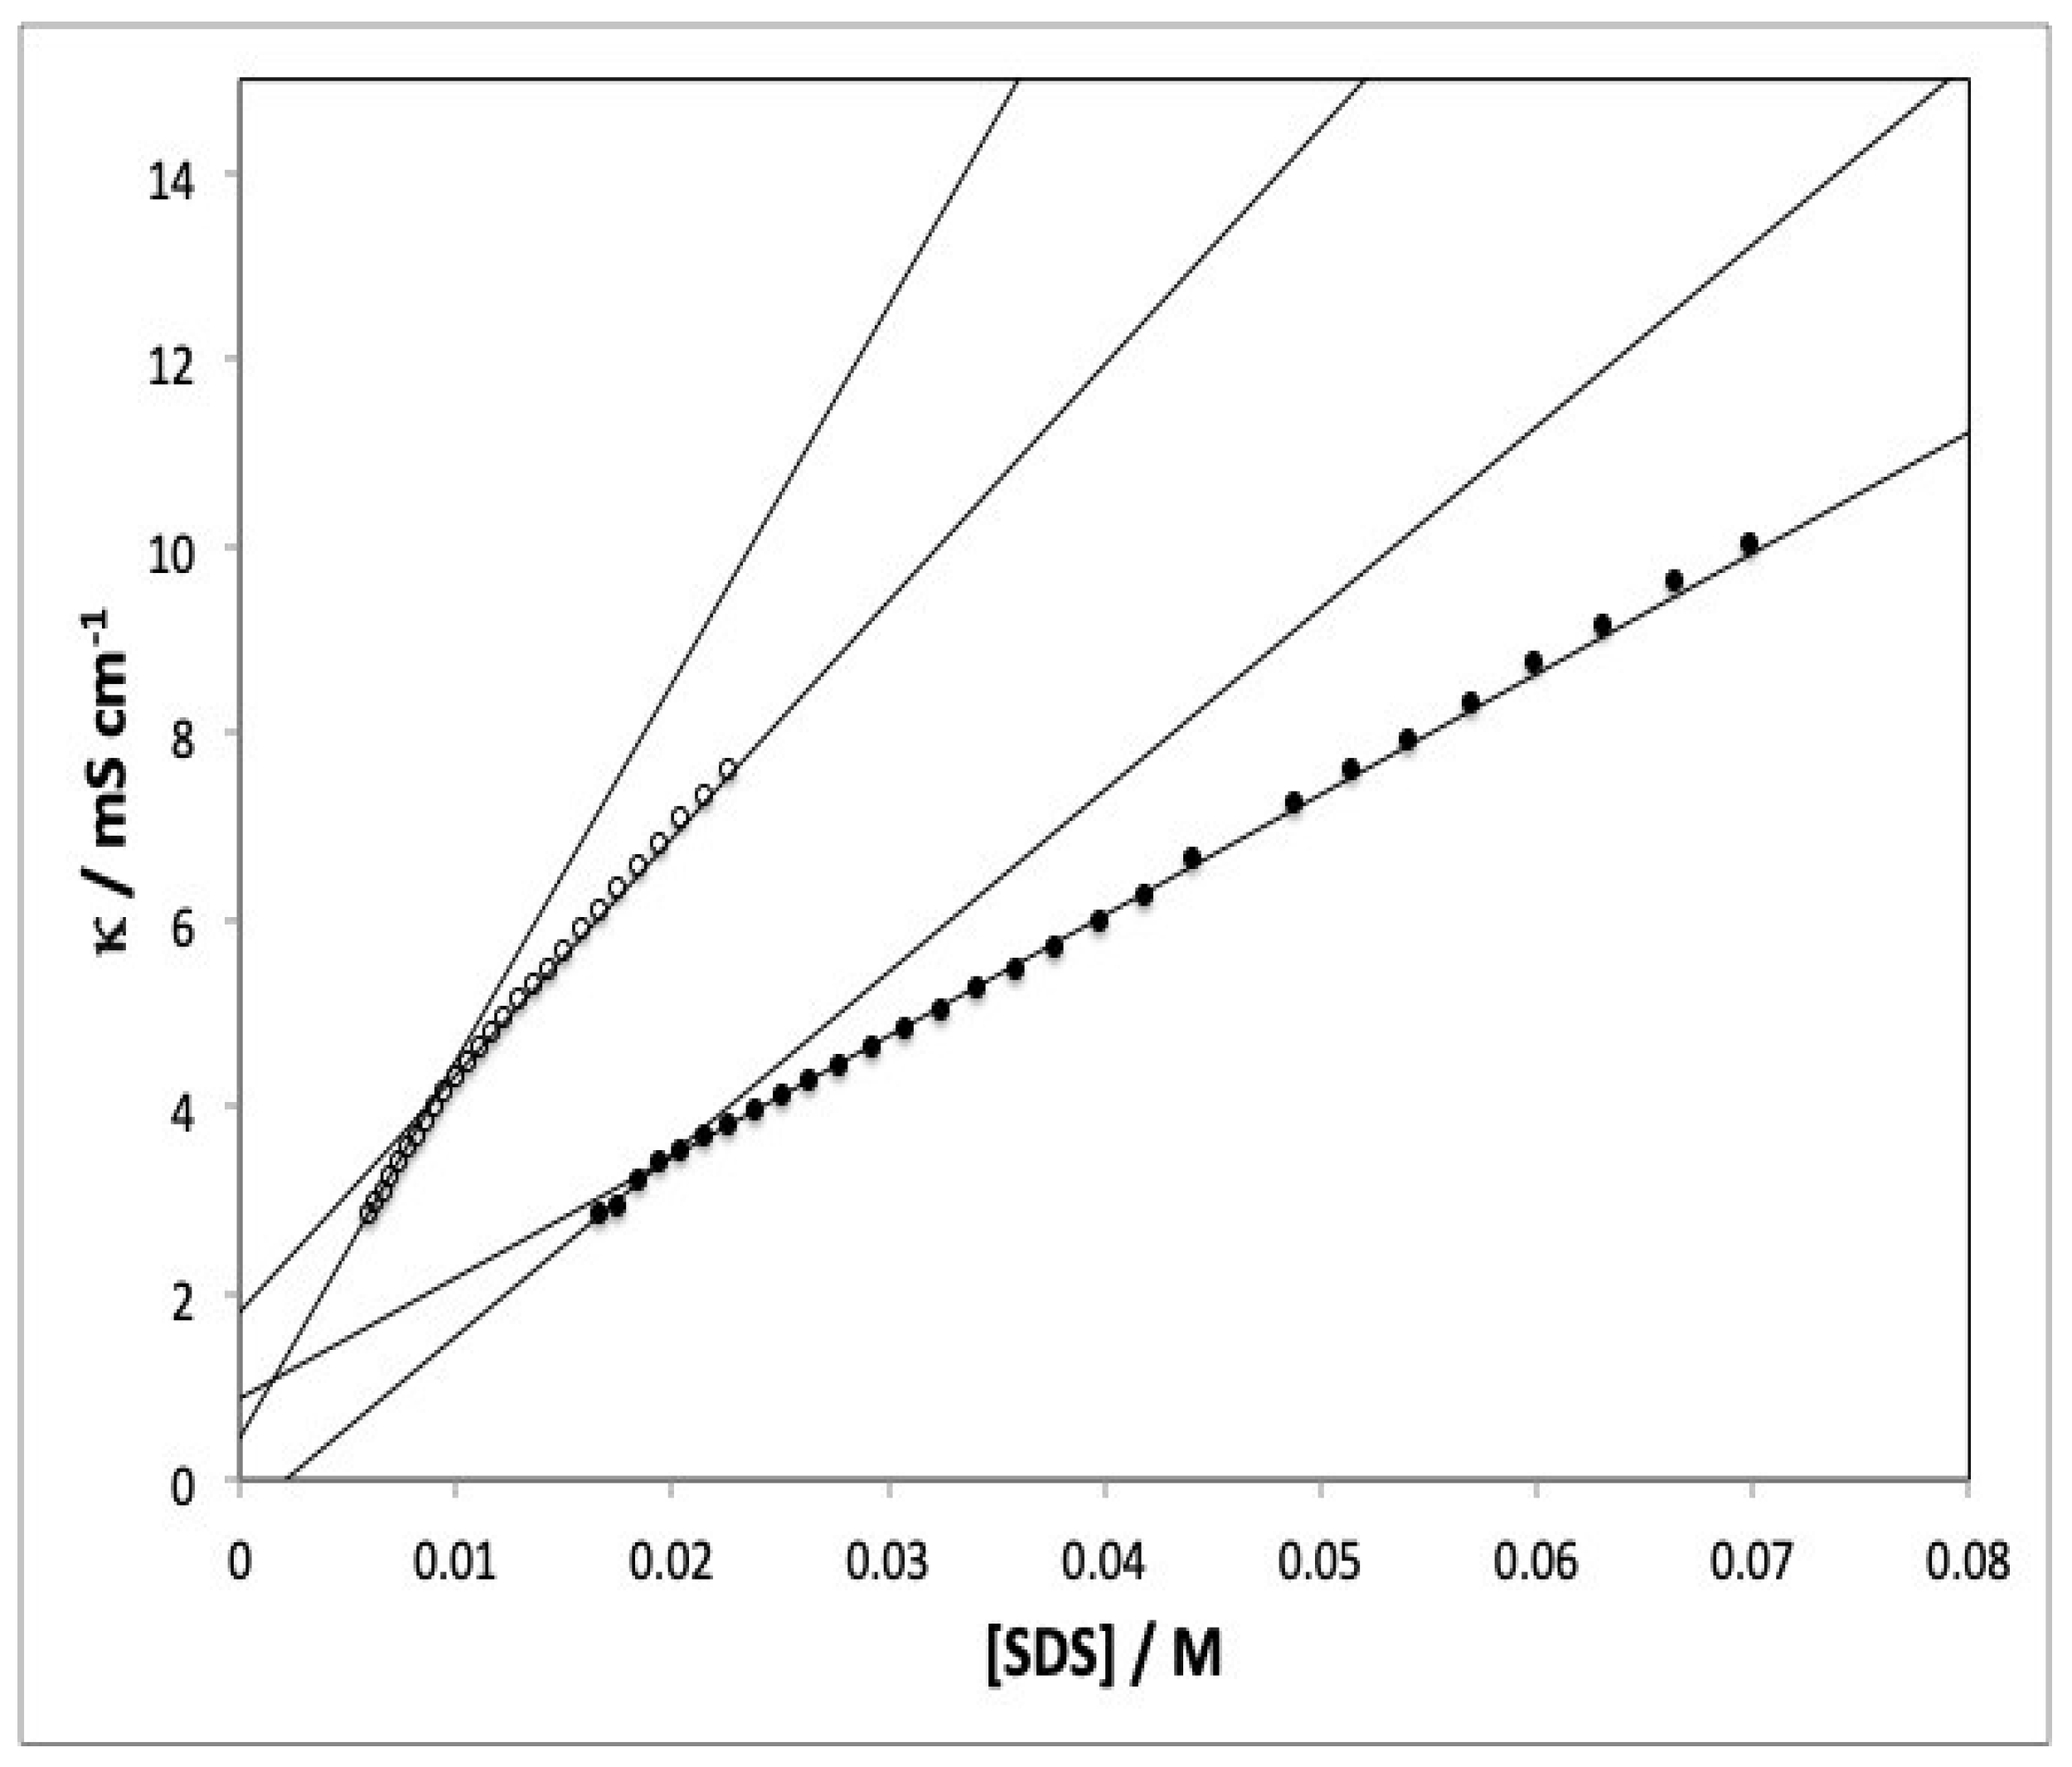
3.2. Conductivity Measurements
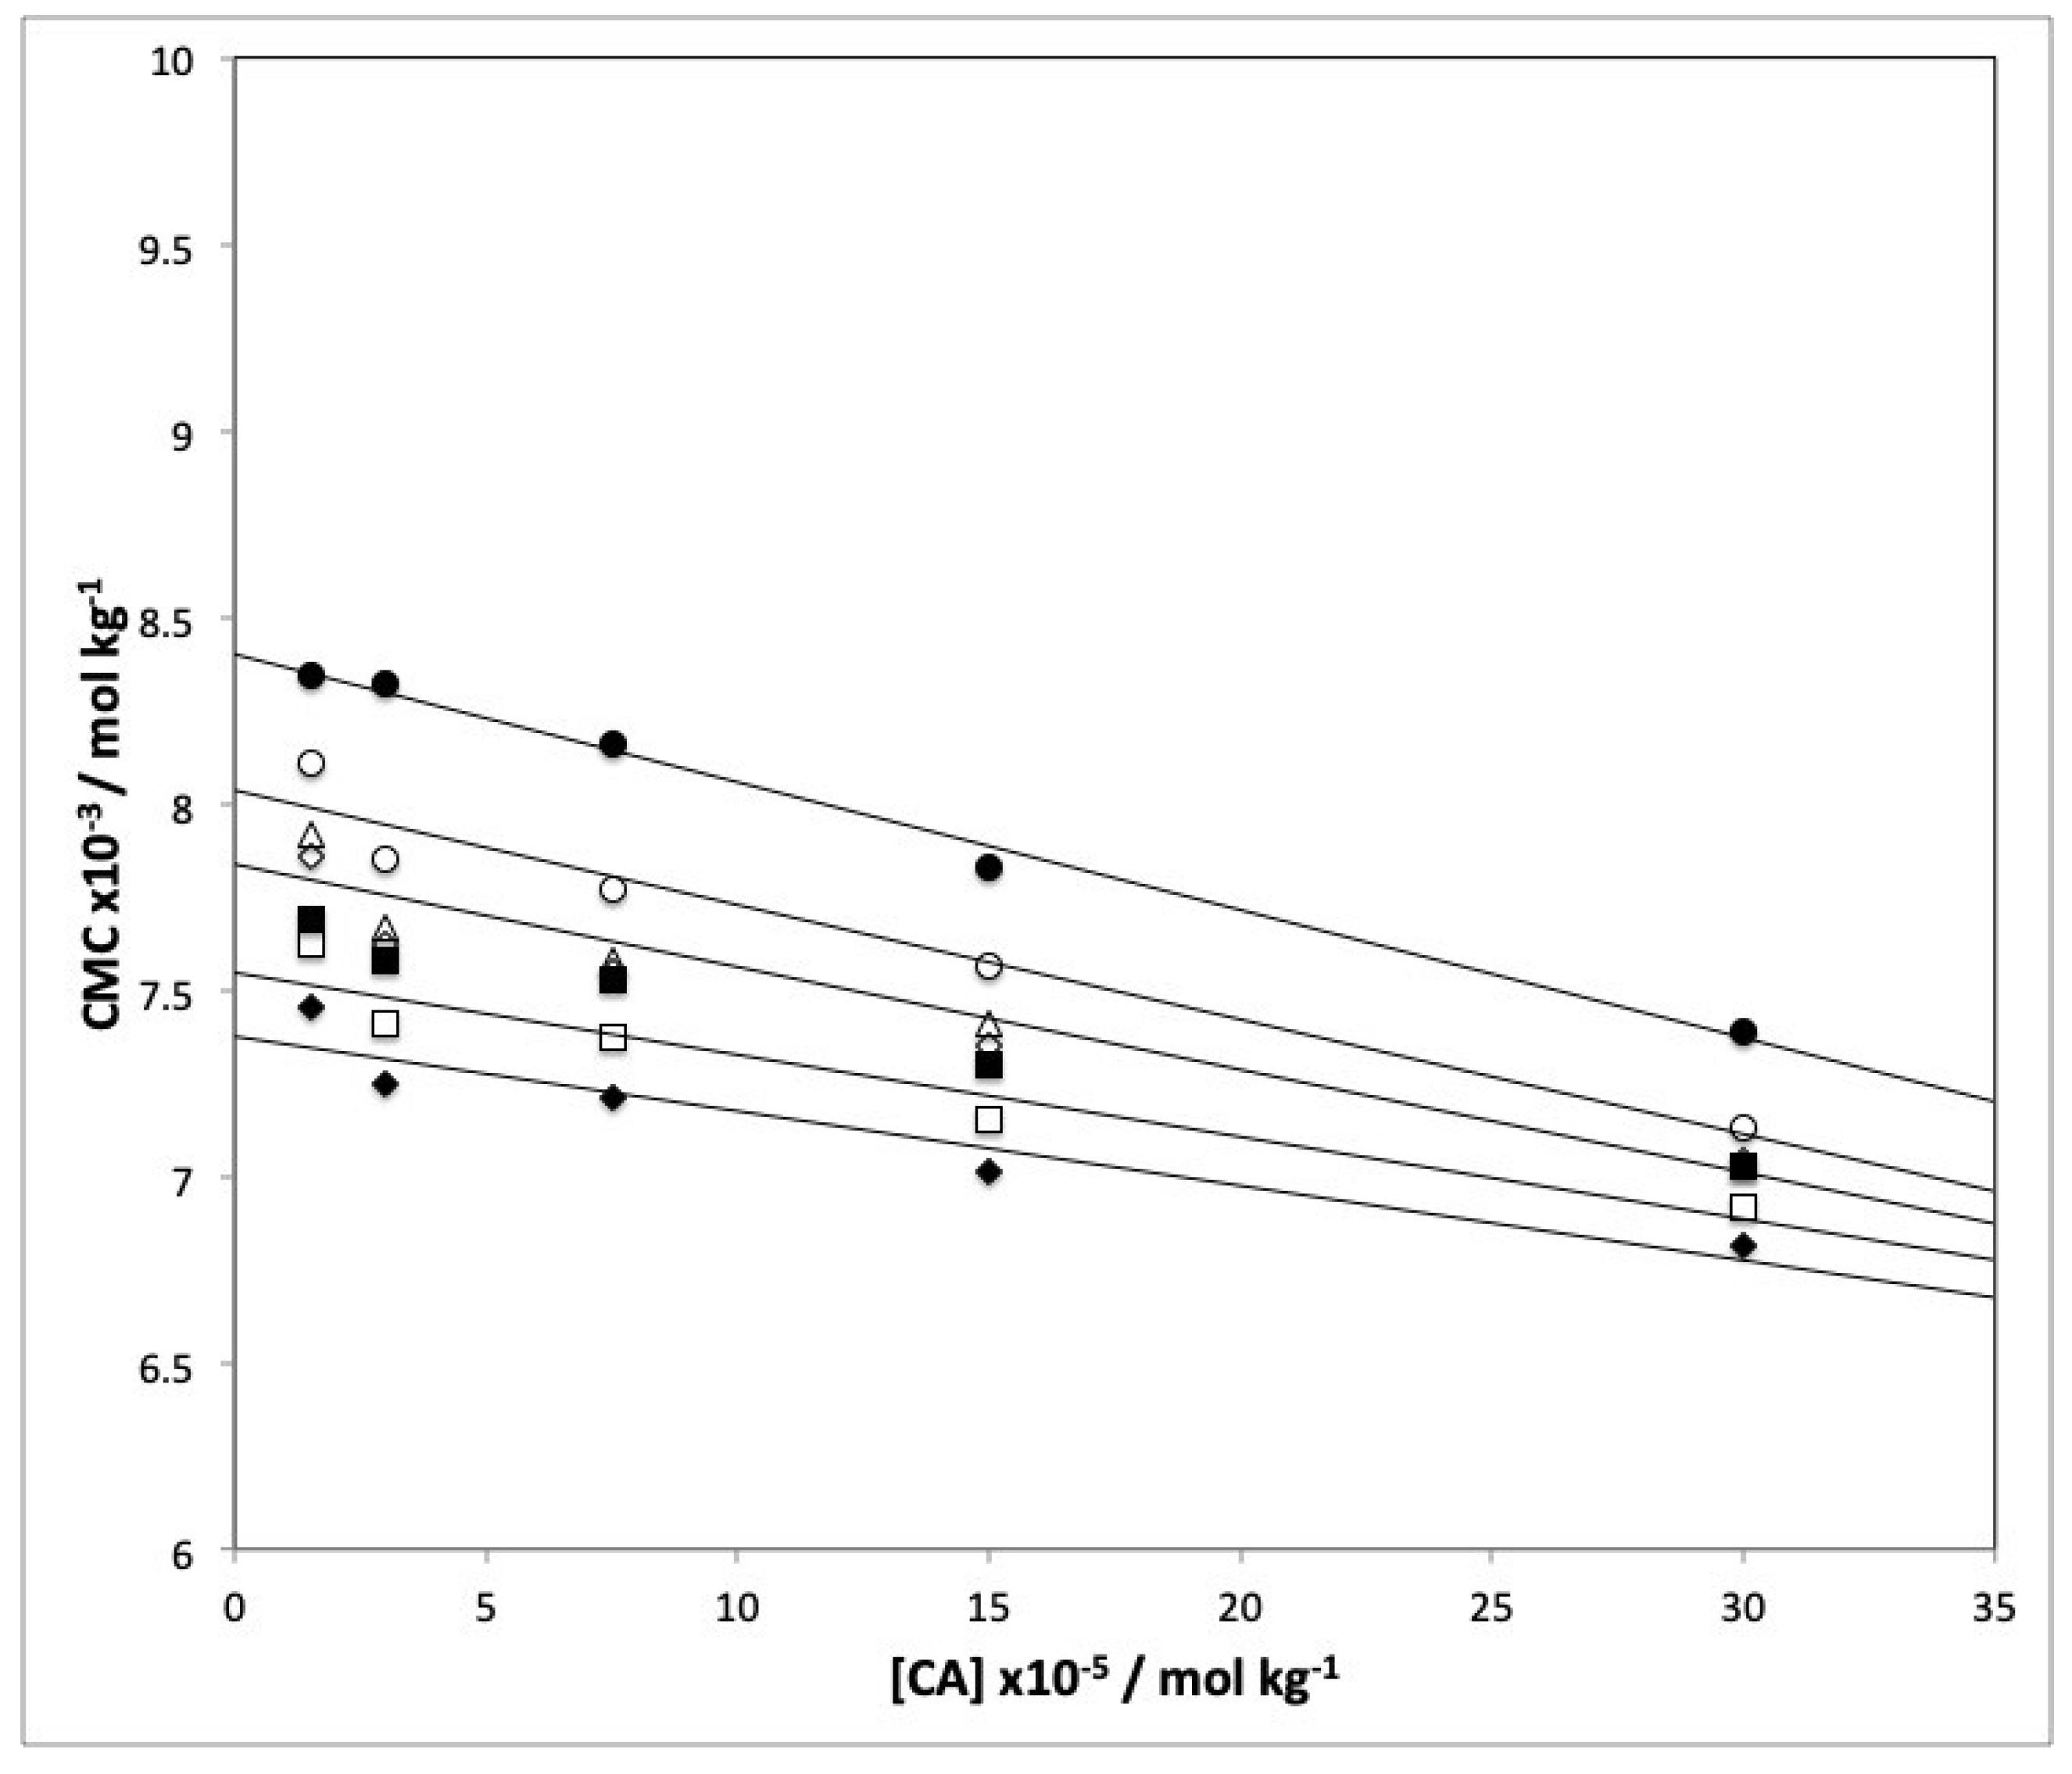
3.3. CMC Determination
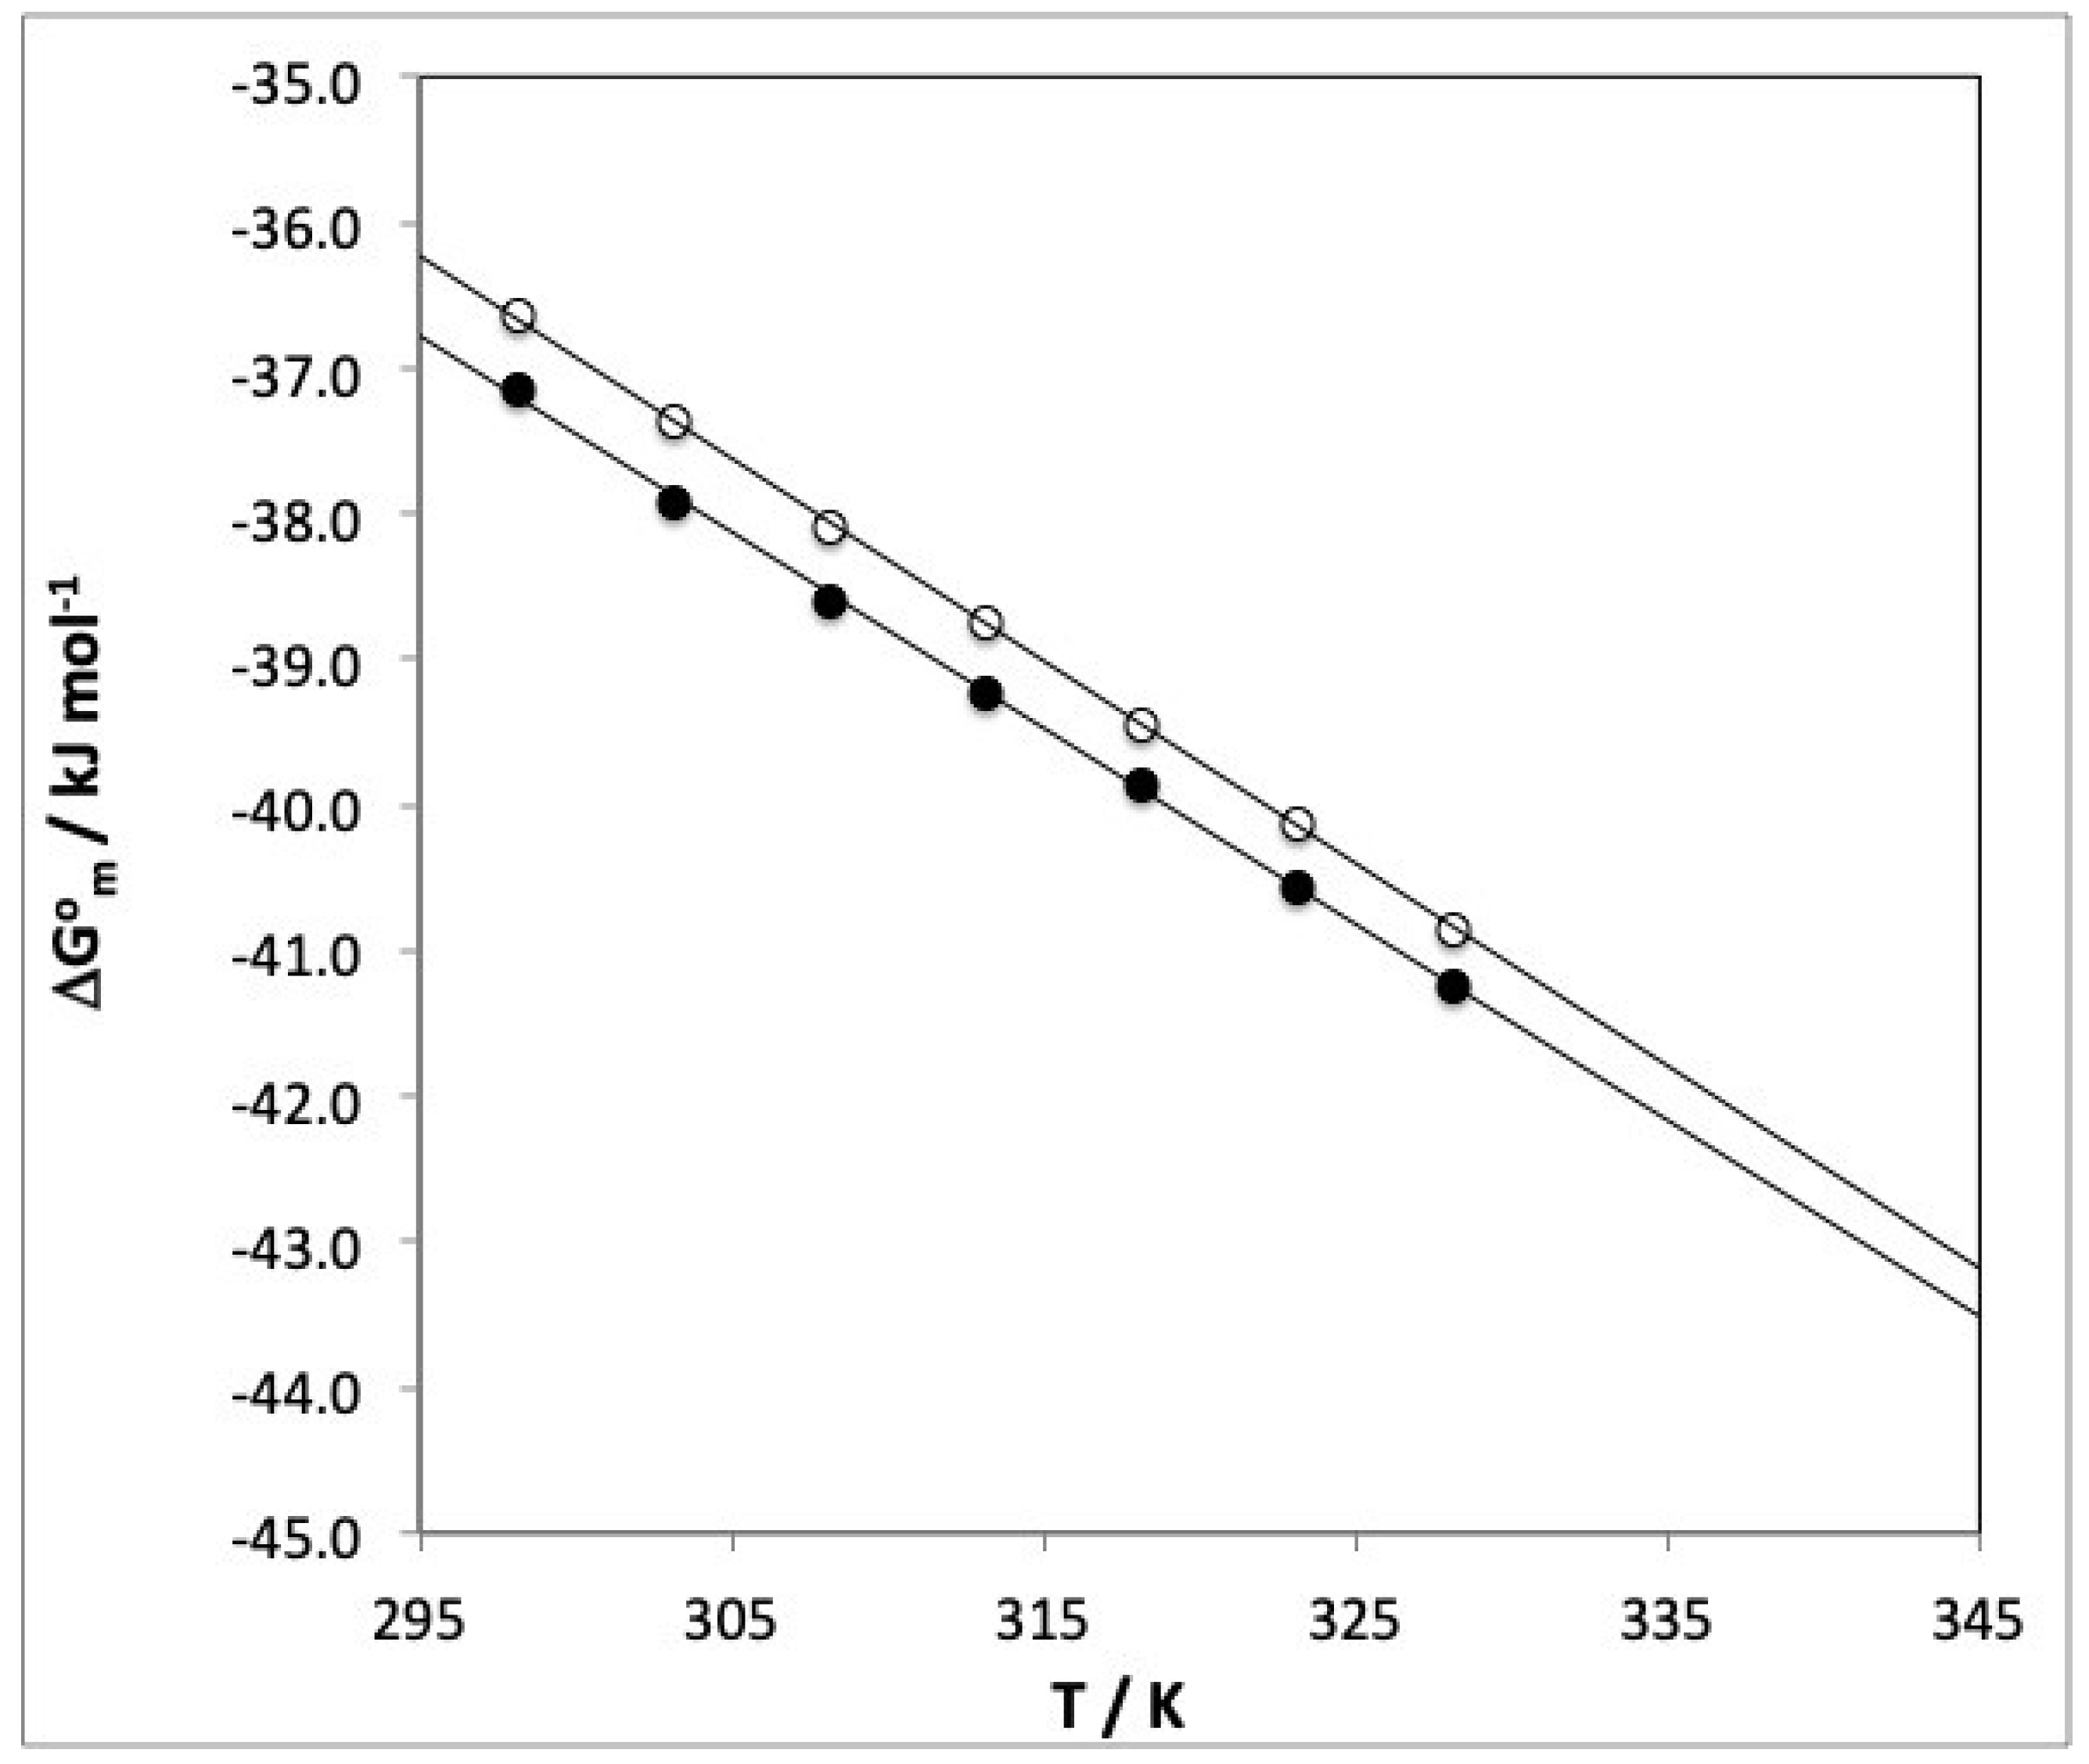
3.4. Micellization Thermodynamics
4. Conclusions
Author Contributions
Funding
Acknowledgments
Conflicts of Interest
References
- Shahidi, F.; Chandrasekara, A. Hydroxycinnamates and their in vitro and in vivo antioxidant activities. Phytochem. Rev. 2010, 9, 147–170. [Google Scholar] [CrossRef]
- Brewer, M.S. Natural Antioxidants: Sources, Compounds, Mechanisms of Action, and Potential Applications. Compr. Rev. Food Sci. Food Safety 2011, 10, 221–247. [Google Scholar] [CrossRef] [Green Version]
- Nowacka, N.; Nowak, R.; Drozd, M.; Olech, M.; Los, R.; Malm, A. Analysis of phenolic constituents, antiradical and antimicrobial activity of edible mushrooms growing wild in Poland. LWT-Food Sci. Technol. 2014, 59, 689–694. [Google Scholar] [CrossRef]
- Martí, R.; Leiva-Brondo, M.; Lahoz, I.; Campillo, C.; Cebolla-Cornejo, J.; Roselló, S. Polyphenol and L-ascorbic acid content in tomato as influenced by high lycopene genotypes and organic farming at different environments. Food Chem. 2018, 239, 148–156. [Google Scholar] [CrossRef] [PubMed]
- Robards, K.; Antolovich, M. Analytical Chemistry of Fruit Bioflavonoids—A Review. Analyst 1997, 122, 11R–34R. [Google Scholar] [CrossRef]
- Liu, B.; Anderson, D.; Ferry, D.R.; Seymour, L.W.; de Takats, P.G.; Kerr, D.J. Determination of quercetin in human plasma using reversed phase high-performance liquid chromatography. J. Chromatogr. B 1995, 666, 149–155. [Google Scholar] [CrossRef]
- Figueiredo-González, M.; Regueiro, J.; Cancho-Grande, B.; Simal-Gándara, J. Garnacha Tintorera-based sweet wines: Detailed phenolic composition by HPLC/DAD-ESI/MS analysis. Food Chem. 2014, 143, 282–292. [Google Scholar] [CrossRef] [PubMed]
- Regueiro, J.; Sánchez-González, C.; Vallverdú-Queralt, A.; Simal-Gándara, J.; Lamuela-Raventós, R.; Izquierdo-Pulido, M. Comprehensive identification of walnut polyphenols by liquid chromatography coupled to linear ion trap-Orbitrap mass spectrometry. Food Chem. 2014, 152, 340–348. [Google Scholar] [CrossRef] [PubMed]
- Quijada-Morin, N.; Regueiro, J.; Simal-Gandara, J.; Tomas, E.; Rivas-Gonzalo, J.C.; Escribano-Bailon, M.T. Relationship between the sensory-determined astringency and the flavanolic composition of red wines. J. Agri. Food Chem. 2012, 60, 12355–12361. [Google Scholar] [CrossRef]
- Pérez-Gregorio, R.M.; Regueiro, J.; González-Barreiro, C.; Rial-Otero, R.; Simal-Gándara, J. Changes in antioxidant flavonoids during freeze-drying of red onions and subsequent storage. Food Contr. 2011, 22, 1108–1113. [Google Scholar] [CrossRef]
- Pérez-Gregorio, R.M.; Regueiro, J.; Alonso-González, E.; Pastrana-Castro, L.M.; Simal-Gándara, J. Influence of alcoholic fermentation process on antioxidant activity and phenolic levels from mulberries (Morus nigra L.). LWT-Food Sci. Technol. 2011, 44, 1793–1801. [Google Scholar] [CrossRef]
- Nardini, M.; Natella, F.; Gentili, V.; Di Felice, M.; Scaccini, C. Effect of caffeic acid dietary supplementation on the antioxidant defense system in rat: An in vivo study. Arch. Biochem. Biophys. 1997, 342, 157–160; [Google Scholar] [CrossRef] [PubMed]
- Galato, D.; Ckless, K.; Susin, M.F.; Giacomelli, C.; Ribeiro-do-Valle, R.M.; Spinelli, A. Antioxidant capacity of phenolic and related compounds: correlation among electrochemical, visible spectroscopy methods and structure-antioxidant activity. Redox Rep. 2001, 6, 243–250. [Google Scholar] [CrossRef]
- Giacomelli, C.; Ckless, K.; Galato, D.; Miranda, F.S.; Spinelli, A. Electrochemistry of Caffeic Acid Aqueous Solutions with pH 2.0 to 8.5. J. Braz. Chem. Soc. 2002, 13, 332–338. [Google Scholar] [CrossRef] [Green Version]
- Nohl, H.; Gille, L.; Staniek, K. Intracellular generation of reactive oxygen species by mitochondria. Biochem. Pharmacol. 2005, 69, 719–723. [Google Scholar] [CrossRef] [PubMed]
- Gulcin, I. Antioxidant activity of caffeic acid (3,4-di-hydroxycinnamic acid). Toxicology 2006, 217, 213–220. [Google Scholar] [CrossRef] [PubMed]
- Kang, N.J.; Lee, K.W.; Shin, B.J.; Jung, S.K.; Hwang, M.K.; Bode, A.M.; Heo, Y.-S.; Lee, H.J.; Dong, Z. Caffeic acid, a phenolic phytochemical in coffee, directly inhibits Fyn kinase activity and UVB-induced COX-2 expression. Carcinogenesis 2009, 30, 321–330. [Google Scholar] [CrossRef] [PubMed]
- Gupta, S.C.; Kim, J.H.; Prasad, S.; Aggarwal, B.B. Regulation of survival, proliferation, invasion, angiogenesis, and metastasis of tumor cells through modulation of inflammatory pathways by nutraceuticals. Cancer Metast. Rev. 2010, 29, 405–434. [Google Scholar] [CrossRef] [PubMed] [Green Version]
- Weng, C.-J.; Yen, G.-C. Chemopreventive effects of dietary phytochemicals against cancer invasion and metastasis: Phenolic acids, monophenol, polyphenol, and their derivatives. Cancer Treat. Rev. 2012, 38, 76–87. [Google Scholar] [CrossRef]
- Tapiero, H.; Tew, K.D.; Nguyen, B.G.; Mathe, G. Polyphenols: Do they play a role in the prevention of human pathologies? Biomed. Pharmaco. Ther. 2002, 56, 200–207. [Google Scholar] [CrossRef]
- IARC Monographic about Caffeic Acid. Available online: https://monographs.iarc.fr/ENG/Monographs/vol56/mono56-8.pdf (accessed on 27 March 2019).
- Mahoney, N.; Molyneux, R.J.; Kim, J.H.; Campbell, B.C.; Waiss, A.C.; Hagerman, A.E. Aflatoxigenesis induced in Aspergillus flavus by oxidative stress and reduction by phenolic antioxidants from tree nuts. World Mycotoxin J. 2010, 3, 49–57. [Google Scholar] [CrossRef]
- FDA. Code of Federal Regulations, Title 21–Food and Drugs. Part 172-Food Additives Permitted for Direct Addition to Food for Human Consumption. Available online: https://www.accessdata.fda.gov/scripts/cdrh/cfdocs/cfcfr/CFRSearch.cfm?CFRPart=172 (accessed on 1 March 2013).
- Cid, A.; Mejuto, J.C.; Orellana, P.G.; Lopez-Fernandez, O.; Rial-Otero, R.; Simal-Gandara, J. Effects of ascorbic acid on the microstructure and properties of SDS micellar aggregates for potential food applications. Food Res. Int. 2013, 50, 143–148. [Google Scholar] [CrossRef]
- Cid, A.; Morales, J.; Mejuto, J.C.; Briz-Cid, N.; Rial-Otero, R.; Simal-Gandara, J. Thermodynamics of sodium dodecyl sulphate–salicylic acid based micellar systems and their potential use in fruits postharvest. Food Chem. 2014, 151, 358–363. [Google Scholar] [CrossRef]
- Akbas, H.; Taliha, M. Effect of polyoxyethylene chain length and electrolyte on the viscosity of mixed micelle. Turk. J. Chem. 2003, 27, 357–363. [Google Scholar]
- Attwood, D.; Florence, A.T. Surfactant System: Their Chemistry, Pharmacy and Biology; Chapman and Hall: London, UK, 1983. [Google Scholar]
- Sulthana, S.B.; Rao, P.V.C.; Bhat, S.G.T.; Rakshit, A.K. Interfacial and thermodynamic properties of SDBS–C12E10 mixed micelles in aqueous media: Effect of additives. J. Phys. Chem. B 1998, 102, 9653–9660. [Google Scholar] [CrossRef]
- Nesmerak, K.; Nemcova, I. Determination of Critical Micelle Concentration by electrochemical means. Anal. Lett. 2006, 39, 1023–1040. [Google Scholar] [CrossRef]
- Mosquera, V.; Ruso, J.M.; Attwood, D.; Jones, M.N.; Prieto, G.; Sarmiento, F. Thermodynamics of micellization of surfactants of low aggregation number: The aggregation of propranolol hydrochloride. J. Colloid Interf. Sci. 1999, 210, 97–102. [Google Scholar] [CrossRef]
- Nusselder, J.J.H.; Engberts, J.B.F.N. Toward a better understanding of the driving force for micelle formation and micellar growth. J. Colloid Interf. Sci. 1992, 148, 353–361. [Google Scholar] [CrossRef]
- Laguerre, M.; Moltke-Sorensen, A.D.; Bayrasy, C.; Lecomte, J.; Jacobsen, C.; Decker, A.; Villeneuve, P. CHAPTER 8—Role of hydrophobicity on antioxidant activity in lipid dispersions: From the polar paradox to the cut-off theory. In Lipid Oxidation. Challenges in Food systems; Elsevier: Amsterdam, The Netherlands, 2013; pp. 261–296. [Google Scholar]
Sample Availability: Samples of the compounds are not available from the authors. |


| [CA] × 10−5 mol kg−1 | Temperature (°C) | |||||||||||||
|---|---|---|---|---|---|---|---|---|---|---|---|---|---|---|
| 25 | 30 | 35 | 40 | 45 | 50 | 55 | ||||||||
| CMC | β | CMC | β | CMC | β | CMC | β | CMC | β | CMC | β | CMC | β | |
| 30 | 7.39 | 0.70 | 7.13 | 0.74 | 7.03 | 0.77 | 7.04 | 0.74 | 7.03 | 0.71 | 6.92 | 0.75 | 6.81 | 0.64 |
| 15 | 7.83 | 0.77 | 7.56 | 0.76 | 7.41 | 0.77 | 7.35 | 0.60 | 7.30 | 0.67 | 7.15 | 0.68 | 7.01 | 0.57 |
| 7.5 | 8.16 | 0.66 | 7.77 | 0.69 | 7.58 | 0.67 | 7.55 | 0.73 | 7.53 | 0.64 | 7.37 | 0.76 | 7.21 | 0.57 |
| 3.0 | 8.32 | 0.74 | 7.85 | 0.67 | 7.67 | 0.60 | 7.62 | 0.68 | 7.58 | 0.60 | 7.41 | 0.63 | 7.25 | 0.66 |
| 1.5 | 8.34 | 0.79 | 8.11 | 0.74 | 7.92 | 0.67 | 7.86 | 0.64 | 7.69 | 0.60 | 7.62 | 0.65 | 7.45 | 0.61 |
| [CA] × 10−5 mol kg−1 | T (°C) | ||||||
|---|---|---|---|---|---|---|---|
| 25 | 30 | 35 | 40 | 45 | 50 | 55 | |
| 30 | −37.1 | −37.9 | −38.6 | −39.2 | −39.9 | −40.6 | −41.3 |
| 15 | −36.9 | −37.7 | −38.4 | −39.0 | −39.7 | −40.4 | −41.1 |
| 7.5 | −36.7 | −37.6 | −38.3 | −38.9 | −39.6 | −40.3 | −41.0 |
| 3.0 | −36.7 | −37.5 | −38.2 | −38.9 | −39.5 | −40.2 | −41.0 |
| 1.5 | −36.6 | −37.4 | −38.1 | −38.7 | −39.5 | −40.1 | −40.8 |
| [CA] × 10−5 mol kg−1 | ΔH0m kJ mol−1 | ΔS0m kJ mol−1 K−1 | R2 |
|---|---|---|---|
| 30 | 3.9 | 0.14 | 0.9992 |
| 15 | 4.2 | 0.14 | 0.9992 |
| 7.5 | 4.9 | 0.14 | 0.9979 |
| 3.0 | 5.0 | 0.14 | 0.9988 |
| 1.5 | 4.7 | 0.14 | 0.9988 |
© 2019 by the authors. Licensee MDPI, Basel, Switzerland. This article is an open access article distributed under the terms and conditions of the Creative Commons Attribution (CC BY) license (http://creativecommons.org/licenses/by/4.0/).
Share and Cite
Cid, A.; Moldes, O.A.; Mejuto, J.C.; Simal-Gandara, J. Interaction of Caffeic Acid with SDS Micellar Aggregates. Molecules 2019, 24, 1204. https://doi.org/10.3390/molecules24071204
Cid A, Moldes OA, Mejuto JC, Simal-Gandara J. Interaction of Caffeic Acid with SDS Micellar Aggregates. Molecules. 2019; 24(7):1204. https://doi.org/10.3390/molecules24071204
Chicago/Turabian StyleCid, Antonio, Oscar A. Moldes, Juan C. Mejuto, and Jesus Simal-Gandara. 2019. "Interaction of Caffeic Acid with SDS Micellar Aggregates" Molecules 24, no. 7: 1204. https://doi.org/10.3390/molecules24071204