Article

Discovery and Characterisation of Dual Inhibitors of Tryptophan 2,3-Dioxygenase (TDO2) and Indoleamine 2,3-Dioxygenase 1 (IDO1) Using Virtual Screening

1
Hacettepe University, Faculty of Pharmacy, Department of Pharmaceutical Chemistry, Ankara 06100, Turkey
2
Auckland Cancer Society Research Centre, University of Auckland, Grafton, 1023 Auckland, New Zealand
3
School of Pharmacy and Bioengineering, Keele University, Hornbeam building, Staffordshire ST5 5BG, UK
*
Authors to whom correspondence should be addressed.
Molecules 2019, 24(23), 4346; https://doi.org/10.3390/molecules24234346
Submission received: 30 October 2019 / Revised: 18 November 2019 / Accepted: 25 November 2019 / Published: 28 November 2019
(This article belongs to the Special Issue Advances in Anticancer Drug Discovery)

Abstract

:
Cancers express tryptophan catabolising enzymes indoleamine 2,3-dioxygenase 1 (IDO1) and tryptophan 2,3-dioxygenase (TDO2) to produce immunosuppressive tryptophan metabolites that undermine patients’ immune systems, leading to poor disease outcomes. Both enzymes are validated targets for cancer immunotherapy but there is a paucity of potent TDO2 and dual IDO1/TDO2 inhibitors. To identify novel dual IDO1/TDO2 scaffolds, 3D shape similarity and pharmacophore in silico screening was conducted using TDO2 as a model for both systems. The obtained hits were tested in cancer cell lines expressing mainly IDO1 (SKOV3—ovarian), predominantly TDO2 (A172—brain), and both IDO1 and TDO2 (BT549—breast). Three virtual screening hits were confirmed as inhibitors (TD12, TD18 and TD34). Dose response experiments showed that TD34 is the most potent inhibitor capable of blocking both IDO1 and TDO2 activity, with the IC50 value for BT549 at 3.42 µM. This work identified new scaffolds able to inhibit both IDO1 and TDO2, thus enriching the collection of dual IDO1/TDO2 inhibitors and providing chemical matter for potential development into future anticancer drugs.

Graphical Abstract

1. Introduction

The kynurenine pathway transforms ~95% of the essential amino acid tryptophan into many bioactive metabolites including nicotinamide adenine dinucleotide (NAD+), crucial for cellular redox metabolism [1]. Haem-containing enzymes indoleamine 2,3-dioxygenase (IDO1) and tryptophan 2,3-dioxygenase (TDO2) catalyse oxidation of tryptophan into N-formyl-kynurenine, the first and rate-limiting step in the kynurenine pathway [2]. N-formyl-kynurenine is readily converted into kynurenine inside mammalian cells by kynurenine formamidase [3]. Whilst both IDO1 and TDO2 catalyse the identical biochemical reaction, their physiological roles and protein structures differ substantially. TDO2 is a tetramer (167 kDa) expressed predominantly in the liver to maintain tryptophan homeostasis. In contrast, IDO1 is a monomeric enzyme (37 kDa) essentially absent in most normal tissues but induced during inflammation and mammalian gestation to suppress the immune system [1].
Tryptophan deprivation and the accumulation of tryptophan metabolites such as kynurenine paralyse cancer-killing immune cells and expand the populations of suppressive immune cells in tumour microenvironments, contributing to immune escape and malignancy [4,5]. Many cancers express high levels of TDO2 and IDO1, and high tumoural IDO1 expression is associated with poor patient outcomes [4,6]. The important role of accelerated tryptophan catabolism in escaping immune surveillance makes IDO1 and TDO2 prime targets for development of small molecule drugs to augment cancer immunotherapy. Advanced biochemical assay methodologies [7,8,9] and virtual screening approaches [10,11] have played a key part in discovery of a diverse range of IDO1-specific inhibitors [1,12,13]. Two IDO1 inhibitors, Epacadostat (Incyte Corporation) and Linrodostat (Bristol-Myers-Squibb), have reached Phase 3 clinical trials [14,15,16].
Despite promising results in early clinical trials [17], in phase 3 trial ECHO-301, the combination of Epacadostat and PD-1 inhibitor Pembrolizumab did not provide a large cohort of advanced melanoma patients with any additional survival benefit compared to Pembrolizumab alone [18]. A potential explanation for this unfavourable outcome is the expression of both IDO1 and TDO2 in the patients’ tumours [19]. In this situation, an IDO1-specific inhibitor such as Epacadostat cannot completely block the production of the immunosuppressive tryptophan catabolites because it inhibits TDO2 weakly. Hence, the combination of IDO1- and TDO2-specific inhibitors or administration of dual IDO1/TDO2 inhibitors are promising strategies being explored to more completely silence the immunosuppressive kynurenine pathway. However, a relative dearth of potent TDO2-specific [1,15,20] and dual IDO1/TDO2 inhibitors limits advances in this area [21,22,23].
Structure-based virtual screening is a well-established method to identify hit matter for development of lead- and drug-candidates when a protein structure is available [24,25,26]. Virtual hits need to be tested in a biological assay verifying their affinity for the target of interest. Kynurenine production can be conveniently monitored in a cell-based assay [27,28] and the crystal structures of TDO2 and IDO1 are available [29,30,31]. Herein, we applied the virtual screening technique in conjunction with the cell based kynurenine assay to identify TDO2-specific and dual IDO1/TDO2 inhibitors with potential for further development into drug candidates for cancer immunotherapy.

2. Results and Discussion

2.1. Validation of Virtual Screening Methods

In order to gauge the prediction power of the virtual screening methodologies available a test set of active and inactive compounds was compiled. Eighty (80) known TDO2 inhibitors were obtained from ChEMBL collection [32], and from the literature [33], thirty-four (34) were defined as active (IC50 ≤ 10 µM) and 46 as inactive ligands (IC50 > 100 µM). The ligands active in the region between these classifications (10–100 µM) were unfortunately not available in the literature. TDO2 was used as a model for both systems, the rational being that the same substrates are metabolised into the same products by both enzymes. An accumulation curve, which shows the number of screened compounds over the number of actives found in the collection, was plotted for each virtual screening method and compared to an ideal curve. An RAUC value ( A U C e x p e r i m e n t a l A U C i d e a l ) was computed to illustrate the comparison numerically. An RAUC value of 1.0 reflects ideal performance but a value of 0.5 infers no enrichment. Thus, the accumulation curve of a good-performing method looks similar to the ideal curve whilst a diagonal line is expected for a method with no prediction power.

2.2. Molecular Docking

Inhibitor 1-(6-chloro-1H-indazol-4-yl)cyclohexan-1-ol (9R9, Figure 1) was re-docked to the TDO2 crystal structure; the predicted pose obtained was very similar to the co-crystallized conformation (root-mean-square deviation (RMSD) 0.59 Å) demonstrating the prediction power of the method. However, when docking scores of the test library were plotted against their experimental IC50 (concentration leading to 50% inhibition of activity), the result showed a poor accumulation curve approximating a diagonal line with an RAUC value of only 0.64 (Figure 2).

2.3. Pharmacophore Modelling

Two pharmacophore based methods were tested, an e-pharmacophore hypothesis derived from the 9R9-TDO2 complex (pharmacophore model 1) and a manual pharmacophore hypothesis (pharmacophore model 2) derived from ten active compounds [33,34,35,36] of which five effectively inhibit TDO2 (1a1e) and five are inactive (2a2e) (Figure 2). The virtual library was screened against these two models. The e-pharmacophore hypothesis yielded poor enrichment (RAUC = 0.59), however the manual model gave nearly ideal enrichment with RAUC = 0.98 as shown in Figure 2B.

2.4. 3D Shape Similarity

Another ligand-based virtual screening method, 3D shape similarity approach, was tested for its ability to predict TDO2 inhibitors. The three most active ligands 1a, 1b and 1c (Figure 1) were selected as query compounds. The virtual library was screened against each using the three methods embedded in Maestro’s Shape Screening panel. Each structure was treated as (a) a collection of pharmacophore sites (typed pharmacophore), (b) van der Waals (vdW) volume rewarding overlaps of the same atom types (typed atoms), and (c) pure vdW volume to treat all atoms the same for defining overlaps (untyped atoms). The accumulation curves were close to the ideal for the three compounds for the typed and un-typed atoms mode (Figure 3) but the RAUC values for the typed pharmacophore mode were considerably lower as shown in Table 1.
The test library results indicate that the 3D shape screening methods, with typed and untyped atoms using inhibitors 1a and 1c as query compounds gave excellent results. It was therefore decided to use these methods to screen the InterBioScreen (IBS) natural product library [37] followed by the pharmacophore model 2. First, the fast 3D shape screening methods were used to quickly reduce the size of the IBS library followed by the more CPU-intensive pharmacophore model 2, as shown in Figure 4.

2.5. Virtual Screening of the IBS Library

The IBS natural compounds library (66,804 molecules) was downloaded, optimised and prepared for screening resulting in 224,767 molecular entities including different enantiomers, tautomers and ionization states. The molecular descriptors were generated, the molecular entities < 100 Da and > 700 Da, Log P > 5 and Log S < −6 were removed. Furthermore, molecules with more than two Lipinski’s Rule of Five violations were eliminated [38].
The remaining 166,293 entities were screened for their 3D shape similarity to 1a and 1c using the untyped atoms mode. Entities with shape similarity score ≥ 0.85 to 1a (783 entities/583 compounds) and those with shape similarity score ≥ 0.80 to 1c (189 entities/164 compounds) were selected for further screening. The resulting compounds were merged and screened against pharmacophore model 2. Entries with Phase screen score ≥ 1.0 (35 entries/30 compounds) were selected for biological evaluation. All the structures are given in Figure S2 in the Supplementary Material section.

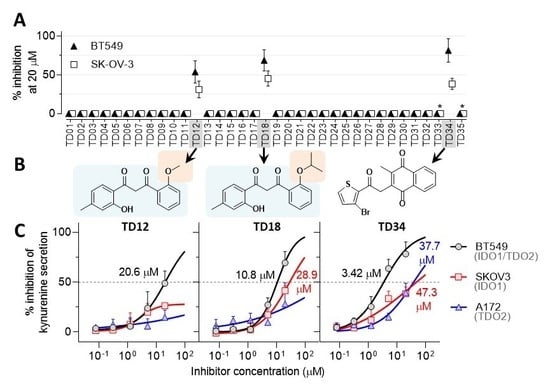
2.6. Cell-Based Assays for Testing the Inhibitory Activity of Test Compounds

In order to determine the ability of compounds to inhibit kynurenine production in cancer cells and their selectivity for IDO1 and TDO2, we first set out to identify cell lines endogenously expressing only IDO1, only TDO2, and both enzymes simultaneously. It has been reported that the ovarian cancer line SKOV3 expresses exclusively IDO1 [39] and the glioma line A172 expresses predominantly TDO2 [40], but a cell line endogenously expressing both enzymes in the absence of interferon stimulation is yet to be described. To this end, we carried out a meta-analysis of IDO1 and TDO2 transcript abundance available in 60 common cancer lines in the National Cancer Institute database (Figure 5A). Forty-five lines (75%) were essentially devoid of dioxygenase transcripts (Figure 5A, grey cluster 1) consistent with inducible IDO1 expression and the absence of TDO2 in the majority of non-hepatic tissues. The remaining 15 lines (25%) clustered into ten predominantly TDO2-expressors (clusters 2 and 4), three IDO1 expressors (clusters 5 and 6) and two dual IDO1/TDO2 expressors (cluster 3).
Consistent with a previous report, SKOV3 expressed the highest levels of IDO1 transcript in this meta-analysis [39]. One of the putative dual expressors (cluster 3), breast cancer line BT549, was available in our laboratory, hence we proceeded to validate its IDO1 abundance and kynurenine production as well as for the positive controls A172 and SKOV3. Furthermore, several negative control cell lines predicted to have minimal or no kynurenine expression in Figure 5A were tested (Figure 5B,C). Due to the paucity of specific anti-TDO2 commercial antibodies, we decided to assess the presence of TDO2 in the cells using a combination of published IDO1-specific and TDO2-specific inhibitors Incyte 5L [42] and 680C91 [43], respectively (see Figure 5D for their chemical structures).
The levels of kynurenine and IDO1 protein produced by the seven lines tested (Figure 5B,C) are markedly consistent with the transcript abundance (Figure 5A). The high TDO2 expressor A172 and the dual IDO1/TDO2 expressor BT549 produced the highest levels of both IDO1 protein and kynurenine whereas IDO1-expressor SKOV3 produced a lower but still substantial amount of kynurenine. The other four lines derived from breast and lung cancers secreted less than 4 µM kynurenine and produced barely detectable amount of IDO1 (Figure 5B,C). Subsequently, the presence of IDO1 and TDO2 in A172, BT549 and SKOV3 was assessed using small-molecule inhibitors (Figure 5D).
The IDO1-specific inhibitor 5L completely inhibited kynurenine production in SKOV3 at 1 µM and provided an IC50 value of 10 nM consistent with published results [28,42]. The TDO2-specific inhibitor 680C91 barely affected SKOV3’s kynurenine production, strongly suggesting TDO2 deficiency in the SKOV3 line concordant with the meta-analysis in Figure 5A. A172 showed inversed sensitivity to the two inhibitors tested suggesting IDO1 deficiency. On the other hand, 5L and 680C91 both inhibited kynurenine production in BT549 albeit between 5- and 10-fold less potently indicative of dual expression of IDO1 and TDO2.
In conclusion, these experiments support the presence of only IDO1 in SKOV3 and that of TDO2 in A172, and indicate dual expression of IDO1 and TDO2 in BT549. The A172 and SKOV3 lines served to identify specificity of the inhibitors to IDO1 or TDO2, respectively, and the BT549 line challenged the ability of the compounds to inhibit both dioxygenases simultaneously.

2.7. Testing the in Silico Hits for Inhibition of IDO1 and TDO2

The thirty virtual hits (designated as TD01 to TD30) identified were subsequently tested for their ability to inhibit kynurenine production in SKOV3 and BT549 lines. Two hits (TD12 and TD18) were initially confirmed as kynurenine production inhibitors, indicating a 6% hit rate of the virtual screening. Both compounds inhibited kynurenine secretion to a similar extent (50% ± 20%) (Figure 6A). A higher hit ratio would be expected if a recombinant enzyme assay was used because virtual screening does not take into account cell penetration. In addition, preliminary results indicated that hit TD05 was active but further investigation did not confirm this finding.
The chemical space surrounding TD05 and the confirmed inhibitors TD12 and TD18 was investigated by conducting similarity and substructure search of commercially available compounds in the eMolecules portal [44]. Derivatives of TD12 and TD18 were not commercially available but five analogues of TD05 were purchased and tested (TD3135). Their molecular structures are shown in Figure S3 of the Supplementary Material. Only TD34 inhibited kynurenine production at 20 µM (Figure 6A) in the absence of cell toxicity. Interestingly, TD34 shares similarity with previously reported ethylnaphthoquinone derivatives, inhibitors of IDO1 [45]. The molecular structures of the hit compounds TD12, TD18 and TD34 are shown in Figure 6B. Whilst the inhibitor TD34 is based on a naphthoquinone core, a class of known IDO1 inhibitors, aromatic diketones TD12 and TD18 are novel. TD18 is a derivative of TD12 differing only by a larger isopropyl substituent in place of a methyl group. Similar inhibitory activity of both TD12 and TD18 suggests that the anisole ring of TD12 can tolerate larger substituents without significant impact on inhibitory activity. In contrast, substitution of a meta-cresol ring of TD18 by a para-cresol ring (TD28) results in a complete loss of inhibitory activity (see Figure S2 in the Supplementary Material). This means that the substitution pattern on the phenyl rings is important for the activity of this series and can be further chemically modified to explore the structure activity relationship.
The three confirmed IDO1/TDO2 inhibitors (Figure 6B) were titrated for inhibition of kynurenine secretion in order to determine their potency and selectivity against IDO1 and TDO2 (Figure 6C). TD34 emerged as the most potent of the three inhibitors. Whilst TD34 inhibits TDO2 in A172 and IDO1 in SKOV3 relatively weakly (IC50 ~ 40 µM), it shows more than 10-fold higher potency in the dual IDO1/TDO2 expressing line BT549 (IC50 = 3.45 µM). This appears to be a general trend amongst the three inhibitors; their potency markedly improves in the BT549 line compared to either the A172 or SKOV3 lines. This result indicates that all three inhibitors can bind both IDO1 and TDO2 simultaneously. Even though the two enzymes are structurally different, they metabolise the identical substrate tryptophan, hence the identification of dual IDO1/TDO2 inhibitors is not surprising.
To confirm that the compounds are nontoxic, we measured changes in metabolic activity and growth of the cells treated with a 20 µM inhibitor dose using WST-1 and SRB assays, respectively (Figure 7). WST-1 tests the bio-reductive potential of the cells as a surrogate of cell fitness whereas SRB stains total protein content of the cells indicative of cell number. None of the three compounds affected total protein content or metabolic activity of the cells when compared to a vehicle treated cell population (Figure 7B) suggesting that the compounds are nontoxic at concentrations inhibitory to at least the BT549 line. None of the three inhibitors interfered with IDO1 protein expression as determined by immunoblotting (Figure 7A). Overall, these observations suggest that the three inhibitors reduce cellular kynurenine secretion by binding to IDO1/TDO2 rather than interfering with the enzyme expression or decreasing cellular fitness. However, due to potential redox activity of the inhibitors, especially TD34, the interference with the reductive activation of IDO1/TDO2 cannot be excluded. In order to check the redox stability of the ligands, their ionisation potentials (IP) and electron affinities (EA) were derived using the Density Functional Theory (DFT) method. The IP reflects one-electron oxidation whereas EA one-electron reduction. The established parameters for known drugs is 6.0 to 9.0 eV for IP and −1.5 to 2.0 eV for EA [46]. TD12 and TD18 have the same IP value 7.5 eV and again the same EA values of −0.6 eV, comfortably within the 95% confidence limits of known drugs. It can be stated that these two ligands are redox stable. However, TD34 has an EA value of −2.0 eV, i.e., half an eV lower than the confidence limits for known drugs and is therefore susceptible for reduction. Furthermore, TD34 does contain a quinone moiety, which is recognised as one of the Pan-assay Interference Compounds (PAINS) [47]. Interestingly, TD05, TD31, TD32, TD33 and TD35 also contain quinone but show no or marginal activity. TD35’s IP value is 8.4 eV and within the specified range.
Ideally, the hit compounds should be tested in biochemical assays based on the purified enzymes, verifying their potential and specificity. Nevertheless, the nontoxic nature of the hits indicates that no vital cellular pathways are perturbed but off-target effects cannot be excluded.

2.8. Suitability of the Identified Hits for Drug Development—Chemical Space

The mainstream molecular descriptors of molecular weight (MW), number of hydrogen bond donors (HB donor), number of hydrogen bond acceptors (HA acceptor), lipophilicity (Log P), polar surface area (PSA) and number of rotatable bonds (RB) were derived for the hit ligands and are given in Table 2. The ligands are relatively average in size with molecular weight between 284.3 and 375.2 g mol−1. TD12 is in lead-like space since its MW is < 300 g mol−1 whilst TD18 and TD34 are in drug-like space (for the definition of lead-like, drug-like and Known Drug Space (KDS) regions, readers are referred to ref. [48] and Table S1 in the Supplementary Material). A similar situation is seen for Log P, one ligand, TD18, is in the drug-like space with the other two in lead-like space. In general, the three hits are on the border between lead- and drug-like spaces with no value reaching the larger KDS. This is most likely due to the pre-filtering based on the molecular descriptors of the library prior to screening.
For further analysis, the Know Drug Indexes 2a and 2b (KDI2a/2b) [49] were also derived. The KDIs reflect the overall balance of the six molecular properties calculated based on the statistical distribution of KDS and derivation of an index for each descriptor. KDI2a is an additive value with a maximum of 6.0 and KDI2b, where the indexes are multiplied, gives 1.0 as its maximum. The average for KDI2a for known drugs is 4.08 (±1.27) and the hit compounds have considerably higher values. The KDI2b version has an average of 0.18 (±0.20) for known drugs and all the ligands have considerable better scores, indicating excellent bioavailability of the ligands.

2.9. Molecular Modelling for Mechanistic Insights

The pharmacophore hypothesis used was made up of four features, two aromatic rings and two H-bond acceptors, as well as excluded volumes. TD12 and TD18 aligned well with these features avoiding the excluded volumes (Figure 8), demonstrating that the benzene rings, the hydroxyl and carbonyl oxygen atoms on the allyl linker are key pharmacophores. Interestingly, the enol tautomers of TD12 and TD18 were identified as active in the virtual screening cascade whereas their diketone forms scored poorly. The molecular modelling is therefore conducted on the enol tautomers. Furthermore, according to DFT calculations the enol form, of both TD12 and TD18, is only 1.7 kcal mol−1 less stable than the diketone resulting in a considerable population of the enol.
In order to test this hypothesis and further understand the compounds’ interactions with the target enzymes, we performed QPLD (QM-Polarized Docking), which provides improved accuracy but at the expense of long calculation times when compared to the classical molecular mechanics. This is especially valid in the presence of transition metals by treating partial charges of ligand-receptor complex with quantum mechanics. This was evident with the RMSD values between the original conformation of the co-crystallized inhibitors and their docked conformation by extra precision Glide versus the QPLD approach. These values were 0.59 Å vs. 0.19 Å for 6A4I (TDO2), 0.68 Å vs. 0.42 Å for 5EK3 (IDO1), and vs. 0.53 Å vs. 0.37 Å for 6E43 (IDO1).
TDO2 is composed of four identical subunits each containing four α-helices and a heme cofactor catalysing oxidation of tryptophan to N-formylkynurenine. The iron at the centre of the heme is coordinated with six ligands: four with the pyrrole nitrogen atoms from the protoporphyrin; the fifth with the nitrogen atom of histidine (His328) side chain; and the sixth with an O2 molecule, substrate tryptophan or an inhibitor [50]. Dissociation of heme groups in heme-containing proteins is considered as the initial step of inhibition when ligands bind to apo forms of these proteins [51]. So far the 3D structure of only the holo human TDO2 has been identified. On the other hand, available crystal structures of apo IDO1 let us evaluate the affinity of the compounds to heme-free, as well as heme-containing IDO1.
TD12 and TD18 fit to the substrate-specific catalytic site of human TDO2 with high affinity (Table 3). We observed that the oxygen of 2-hydroxyphenyl of TD12 and the oxygens of 2-isopropyloxyphenyl and hydroxyallyl of TD18 were within 4 Å of the heme iron (Figure 9). The OH on the allyl linker of TD12 also donated an H-bond to Ala150 side chain oxygen, which proves the key role of the tautomeric forms of these compounds in TDO2 inhibition. The compounds were stabilised in the catalytic site by key interactions with Arg144, Phe72 and His76 via their phenyl rings. The importance of these residues in the catalytic activity was proved in a mutagenesis study [52]. Some of these interactions were also detected for the co-crystallized inhibitor. These results support the pharmacophore hypothesis except the carbonyl oxygen as H-bond acceptor. In this QM-optimized docking the HOMO-LUMO gaps of the receptor complexes with TD12 and TD18 were found to be −0.098 and −0.085 hartree, respectively, showing that the inhibitors were stable in the catalytic site.
In the case of TD34, the 3-bromothiophene ring positioned perpendicular to the heme with the sulphur atom close to the iron. The ring is predicted to form π–π stacking with Phe72 and one of the oxygen atoms of the 2-methylnaphthalene-1,4-dione ring accepted H-bond from the Arg144 side chain (Figure 9C). However, the affinity of the TD34-6A41 complex was low. This could be due to weak interaction with the heme iron, as the low gap of HOMO-LUMO energies (−0.026 hartree) indicated lack of stability for this complex. Thus, TD34 is expected to preferentially bind to the apo enzyme.
Unlike TDO2, the catalytic site of IDO1 has an additional hydrophobic pocket thus can accommodate larger ligands [30]. The compounds, being relatively small, fit well in the catalytic site, without occupying the additional hydrophobic cavity (HOMO-LUMO gap: −0.103 and −0.099 hartree for TD12 and TD18, respectively) and showing similar orientations as in the TDO2 active site. The oxygen atoms of 2-hydroxy-4-methylphenyl of TD12 and TD18 were close to the heme iron, as well as the oxygen of carbonyl of TD12 and hydroxyl of TD18 at the allyl linker, all together forming a triangle with the iron (Figure 10). In addition, TD12 formed an H-bond via its aromatic hydroxyl with Ser167 and π–π staking with Tyr126, which were reported to take part in the electrostatic interactions network of co-crystallized inhibitors [51]. Although TD34 showed affinity to the heme-containing IDO1, an effective interaction with the heme iron or nearby key residues was absent (Figure 10) and the HOMO-LUMO gap (-0.066 hartree) was quite small.
Furthermore, TD12 and TD18 bound to the heme-free IDO1 active site with high affinity. Through the phenolic oxygen, they formed an H-bond with the His346 sidechain (Figure 11), which normally coordinates with the heme iron in the holo enzyme, indicating that both compounds may also have affinity to the apo IDO1. TD34 bound strongly to the apo IDO1 by interacting with His346 side chain via the 2-methylnaphthalene-2,4-dion ring and the bromine moiety from both sides. The bromine also made electrostatic contacts with the Arg343 side chain, forming an array of interactions among TD34 and the two residues, which was also the case with the co-crystallized inhibitors of heme-free IDO1 [32,51]. TD34, as a dual TDO2-IDO1 inhibitor, appears to have stronger affinity to the apo forms of these enzymes.

3. Materials and Methods

3.1. Virtual Screening

Compounds from the test set [32,33] and InterBioScreen Ltd. (IBS, Moscow, Russian Federation) [37] data bases were structurally optimised using MacroModel (2018-4: Schrödinger, LLC, New York City, NY, USA, 2018) with the OPLS_2005 force field [53]. The ligands were prepared using LigPrep module of Maestro (2018-4: Schrödinger, LLC, New York City, NY, 2018) by desalting, creating possible enantiomers, tautomeric and ionization states at pH 7±2. Their physicochemical descriptors were calculated using QikProp (version 3.2, New York City, NY, USA, 2018) [54]. The reliability of it is established for the calculated descriptors [55]. The crystal structures for human TDO2 (PDB ID: 6A4I, resolution 2.65 Å) and IDO1 (5EK3, resolution 2.21 Å [30] and 6E43, resolution 1.71 Å [31]) were downloaded from the Protein Data Bank [56,57] and prepared using Protein Preparation Wizard (2018-4: Schrödinger, LLC, New York City, NY, USA, 2018) [58]. Solvent and non-protein residues were removed, hydrogens were added, missing sidechains were filled with Prime (2018-4: Schrödinger, LLC, New York City, NY, USA, 2018), ionization and tautomeric states were generated by Epik (2018-4: Schrödinger, LLC, New York City, NY, USA, 2018), hydrogen orientations were set by Propka. Receptor grid maps were prepared using Receptor Grid Generation tool of Glide (2018-4: Schrödinger, LLC, New York City, NY, USA, 2018) by setting the central coordinates of the inhibitor for each pdb structure as the centre of search space. Each ligand of the test set was docked, keeping the ligands flexible to the grid, using Glide at extra precision 50 times [59,60,61]. Pharmacophore modelling was performed with Phase (2018-4: Schrödinger, LLC, New York City, NY, USA, 2018) using default settings [62,63]. For 3D shape similarity screening, Maestro’s Shape Screening panel was used. The active compounds from IBS library (TD12, TD18 and TD34) were docked according to the QM-Polarized Docking (QPLD) protocol [64] of Maestro (2018-4: Schrödinger, LLC, New York City, NY, USA, 2018). The ligands were initially docked to the active site using extra precision Glide (five runs), QSite and Jaguar [65] (2018-4: Schrödinger, LLC, New York City, NY, 2018) were used to calculate single-point energies of each docking complex using the Density Functional Theory [66]. Partial atomic charges were derived using electrostatic potential fitting; the ligands were re-docked using Glide again at extra precision (ten runs) and the best poses were predicted according to Coulomb-van der Waals energies.
For the e-pharmacophore method, the crystal structure of the TDO2-inhibitor 1-(6-chloro-1H-indazol-4-yl)cyclohexan-1-ol (ligand ID: 9R9) molecular scaffold was used for the pharmacophore query. 3D shape similarity screening was performed using Maestro’s Shape Screening panel with default settings.
In order to prepare the accumulation curves and determine the RAUC values, the test set compounds were ranked according to their respective score from each method (shape similarity score for 3D shape similarity screen, Phase screen score for pharmacophore screen, and docking score for molecular docking). Then, the number of active compounds (as defined according to their biological activity data) among the top 34 scoring compounds was determined. Phase screen score is a scoring function that evaluates the quantity and quality of ligand feature matching, where quality is defined by site, vector, and volume scoring components.

3.2. Cell Based Kynurenine Assay and Measurement of Cellular Metabolic Activity

Breast cancer cell lines MCF7, MDA-MB-231, BT549, Hs578T; ovarian cell line SKOV3; glioblastoma cell line A172 and lung cancer cell line H460 were grown in α-MEMGibco, Grand Island, NY, USA; ThermoFisher catalogue number 12000022) containing 5% foetal calf serum (Moregate Biotech, Hamilton, New Zealand), insulin/transferrin/selenium supplement (Roche, Ref-11074547001), added according to the manufacturer’s instructions, as well as penicillin/streptomycin (100 U/mL and 100 μg/mL, respectively). The amount of kynurenine produced by the cells was measured as described previously [67]. Briefly, a well of a 96-well plate received 3.7 × 10⁴ cells which were subsequently cultured with the addition of 50 μM (BT474 and SKOV3 cells) or 100 μM (A172 cells) of L-tryptophan (Sigma-Aldrich, St Louis, MO, USA) with or without test compounds at 37 °C, 5% CO2 for 18 h. The cell number seeded was optimised to produce levels of kynurenine <40% of initial tryptophan to avoid tryptophan starvation and to ensure steady-state IDO1/TDO2 kinetics. Next, the culture supernatants were transferred into a fresh 96-well plate, incubated with trichloroacetic acid (10% final concentration) for 20 min at 60 °C to release kynurenine from the cells and precipitate proteins. After spinning the plates for 20 min at 2500 g, the supernatants were mixed at a 1:1 ratio with 4-(dimethylamino)benzaldehyde (20 mg/mL in acetic acid; Sigma) and the absorbance was read at 480 nm on an EnSpire 2300 Multimode Plate Reader (Perkin-Elmer, Singapore, Singapore). The remaining cells in the 96-well plate received a well-established indicator of cellular metabolic activity WST-1 (Roche Diagnostics Cat No 05015944, Basel, Switzerland; 10% diluted in culture media). After 1 h of incubation at 37 °C, the absorbance was measured at 440 nm [68]. WST-1 is reduced on the outer membrane of viable cells to a soluble formazan by reducing equivalents such as NAD(P)H. The absorbance measured at 440 nm indicates the number of metabolically active cells in the culture and represents a surrogate marker of cell viability.
As described previously [69], the sulforhodamine B colorimetric assay (SRB), which is based on the measurement of cellular protein content, was used to measure cell density [70]. After drug treatment for 3 d, cells were fixed with 10% (w/v) trichloroacetic acid and stained for 30 min, and the excess dye was removed by washing repeatedly with 1% (v/v) acetic acid. The protein-bound dye was dissolved in Tris base solution (10 mM) for optical density determination at 510 nm using a microplate reader. Optimal cell densities were previously determined to select initial cell densities that ensured that cells were in logarithmic phase for the experiments.
All experiments were repeated independently at least twice in technical quadruplicates. Calculations and graph plotting were performed in Prism (v8, 2018; GraphPad software, San Diego, CA, USA) and R computing environment (v3.5.3, 2019, 64-bit, Vienna, Austria). IC50 of the compounds in cellular enzymatic activity compared to untreated control cells was determined by fitting data to an equation f(x) = A + B/(1 + (IC50/X)^HILL) in Prism; where A is the minimum and B is the maximum of the curve, HILL is the slope of the curve and X is the compound concentration.

3.3. Western Blotting

This procedure was carried out as described previously [69,71,72]. Breast cancer cell lines were grown to log-phase, washed twice with ice-cold PBS, and lysed in a SDS lysis buffer (60 mM Tris-HCl (pH 6.8 at 25 °C), 2% (w/v) SDS, 10% glycerol). Protein concentration was quantified using the bicinchoninic acid reagent (Sigma). Proteins (25 μg) were separated by SDS-polyacrylamide gel electrophoresis (PAGE), and transferred to PVDF membranes (Millipore Merck, Auckland, New Zealand). Membranes were immunoblotted with antibodies against human IDO1 and tubulin (Sigma). Bound antibody was visualized using Pierce™ ECL Western Blotting Substrate (ThermoFisher Scientific) and the chemiluminescence measured using image analyser LAS-3000 (Fujifilm, Tokyo, Japan).

3.4. Density Functional Theory

The geometry optimisation and energy calculations were performed with Gaussian 16 [73] software using restricted DFT. The non-local B3LYP [74,75] functional hybrid method was employed and the standard 6-31+G(d, p) [76,77] diffused basis set was used for the geometry optimisation and frequency analysis vacuum. The zero-point vibrational energies (ZPE) were scaled according to Wong (0.9804) [78]. In all cases, the normal modes revealed no imaginary frequencies indicating that they represent minima on the potential energy surface. The subsequent energy calculations were performed with the larger 6-311+G(2df, p) basis set in vacuum. The ionisation potentials and electron affinities were calculated as described by Forseman and Frisch [79].

4. Conclusions

Ligand- and pharmacophore-based virtual screening was conducted against the heme containing enzymes IDO1 and TDO2. They catalyse the same rate-limiting step in the kynurenine pathway, an important biochemical mechanism for immunological response. ~6.7×10⁴ natural products were screened resulting in thirty virtual hits, which were tested in three cancer cell lines. These were glioma A172 only with TDO2 expression, ovarian SKOV3, which only expresses IDO1 and finally the breast cancer cell line BT549, which expresses both enzyme. Three active dual inhibitors were identified: TD12, TD18 and TD34, with good kynurenine suppression with an IC50 of 3.42 µM for BT549 (TD34). Given the expression of both IDO1 and TDO2 in tumours, inhibiting only IDO1 is unlikely to generate desirable clinical outcomes. Hence, it can be argued that TDO2 needs to be inhibited as well as making dual inhibitors desirable for further development of drug candidates for inhibition of the immunosuppressive tryptophan catabolism mediated by IDO1/TDO2. TD12 and TD18 are close structural derivatives whereas TD34 is a 1,4-quinone derivative. All have favourable physicochemical properties and are chemically tractable for further development.

Supplementary Materials

The following are available online, Figure S1. Structure of the active and inactive compounds of the test set, Figure S2. The thirty structures of the virtual hits (TD01 to TD30), which were tested for activity, Table S1. Definition of lead-like, drug-like and Known drug space (KDS) in terms of molecular descriptors, Table S2. The catalogue numbers of the commercial compounds tested and their source, Table S3. The single point and corrected zero point vibrational energies (ZPE) of the optimized ligands in hartrees (a.u.).

Author Contributions

S.S. carried out in silico screening, molecular modelling and led manuscript preparation. P.T. contributed to figure preparation, experimental design, data analysis and interpretation. E.L. carried out biological experiments, experimental design, undertook data curation and interpretation. J.R. oversaw the study, reviewed and edited the manuscript. All authors contributed to manuscript preparation and agreed to the final version. Authors have no conflicts of interest to disclose.

Funding

E.L. acknowledges support from the New Zealand Breast Cancer Foundation Belinda Scott Science Fellowship. P.T. acknowledges support from Cancer Research Trust New Zealand Post-doctoral Fellowship (GOT 1717 JGPDF). This work was also supported by core funding from Auckland Cancer Society Research Centre. APC was sponsored by MDPI.

Conflicts of Interest

The authors declare no conflict of interest. The funders had no role in the design of the study; in the collection, analyses, or interpretation of data; in the writing of the manuscript, or in the decision to publish the results.

References

  1. Platten, M.; Nollen, E.A.A.; Röhrig, U.F.; Fallarino, F.; Opitz, C.A. Tryptophan Metabolism as a Common Therapeutic Target in Cancer, Neurodegeneration and Beyond. Nature Rev. Drug Dis. 2019, 18, 379–401. [Google Scholar] [CrossRef]
  2. Adams, S.; Braidy, N.; Bessede, A.; Brew, B.J.; Grant, R.; Teo, C.; Guillemin, G.J. The Kynurenine Pathway in Brain Tumor Pathogenesis. Cancer Res. 2012, 72, 5649–5657. [Google Scholar] [CrossRef]
  3. Dobrovolsky, V.N.; Bowyer, J.F.; Pabarcus, M.K.; Heflich, R.H.; Williams, L.D.; Doerge, D.R.; Arvidsson, B.; Bergquist, J.; Casida, J.E. Effect of Arylformamidase (Kynurenine Formamidase) Gene Inactivation in Mice on Enzymatic Activity, Kynurenine Pathway Metabolites and Phenotype. Biochim. et Biophys. Acta 2005, 1724, 163. [Google Scholar] [CrossRef]
  4. Pilotte, L.; Larrieu, P.; Stroobant, V.; Colau, D.; Dolušić, E.; Frédérick, R.; De Plaen, E.; Uyttenhove, C.; Wouters, J.; Masereel, B.; et al. Reversal of Tumoral Immune Resistance by Inhibition of Tryptophan 2,3-Dioxygenase. Proc. Natl. Acad. Sci. USA 2012, 109, 2497–2502. [Google Scholar] [CrossRef]
  5. Katz, J.B.; Muller, A.J.; Prendergast, G.C. Indoleamine 2,3-Dioxygenase in T-Cell Tolerance and Tumoral Immune Escape. Immunol. Rev. 2008, 222, 206–221. [Google Scholar] [CrossRef]
  6. Yu, C.; Fu, S.; Chen, X.; Ye, J.; Ye, Y.; Kong, L.; Zhu, Z. The Clinicopathological and Prognostic Significance of IDO1 Expression in Human Solid Tumors: Evidence from a Systematic Review and Meta-Analysis. Cell. Phys. Biochem. 2018, 49, 134–143. [Google Scholar] [CrossRef]
  7. Seegers, N.; van Doornmalen, A.M.; Uitdehaag, J.C.M.; de Man, J.; Buijsman, R.C.; Zaman, G.J.R. High-Throughput Fluorescence-Based Screening Assays for Tryptophan-Catabolizing Enzymes. J. Biomol. Screen. 2014, 19, 1266–1274. [Google Scholar] [CrossRef]
  8. Tomek, P.; Palmer, B.D.; Kendall, J.D.; Flanagan, J.U.; Ching, L. Formation of Fluorophores from the Kynurenine Pathway Metabolite N-Formylkynurenine and Cyclic Amines Involves Transamidation and Carbon-Carbon Bond Formation at the 2-Position of the Amine. Biochim. Biophys. Acta 2015, 1850, 1772. [Google Scholar] [CrossRef]
  9. Tomek, P.; Palmer, B.; Flanagan, J.; Fung, S.; Bridewell, D.; Jamie, J.; Ching, L. Formation of an N-Formylkynurenine-Derived Fluorophore and its use for Measuring Indoleamine 2,3-Dioxygenase 1 Activity. Anal. Bioanal. Chem. 2013, 405, 2515–2524. [Google Scholar] [CrossRef]
  10. Dolušić, E.; Larrieu, P.; Blanc, S.; Sapunaric, F.; Pouyez, J.; Moineaux, L.; Colette, D.; Stroobant, V.; Pilotte, L.; Colau, D.; et al. Discovery and Preliminary SARs of Keto-Indoles as Novel Indoleamine 2,3-Dioxygenase (IDO) Inhibitors. Eur. J. Med. Chem. 2011, 46, 3058–3065. [Google Scholar]
  11. Smith, J.R.; Evans, K.J.; Wright, A.; Willows, R.D.; Jamie, J.F.; Griffith, R. Novel Indoleamine 2,3-Dioxygenase-1 Inhibitors from a Multistep in Silico Screen. Bioorg. Med. Chem. 2012, 20, 1354–1363. [Google Scholar] [CrossRef]
  12. Cheong, J.E.; Ekkati, A.; Sun, L. A Patent Review of IDO1 Inhibitors for Cancer. Exp. Opin. Ther. Pat. 2018, 28, 317–330. [Google Scholar] [CrossRef]
  13. Austin, C.J.D.; Rendina, L.M. Targeting Key Dioxygenases in Tryptophan–kynurenine Metabolism for Immunomodulation and Cancer Chemotherapy. Drug Dis. Today 2015, 20, 609–617. [Google Scholar] [CrossRef]
  14. Jiang, T.; Sun, Y.; Yin, Z.; Feng, S.; Sun, L.; Li, Z. Research Progress of Indoleamine 2,3-Dioxygenase Inhibitors. Fut. Med. Chem. 2015, 7, 185–201. [Google Scholar] [CrossRef]
  15. Jacobs, K.R.; Castellano-Gonzalez, G.; Guillemin, G.J.; Lovejoy, D.B. Major Developments in the Design of Inhibitors along the Kynurenine Pathway. Cur. Med. Chem. 2017, 24, 2471–2495. [Google Scholar] [CrossRef]
  16. Brochez, L.; Chevolet, I.; Kruse, V. The Rationale of Indoleamine 2,3-Dioxygenase Inhibition for Cancer Therapy. Eur. J. Cancer 2017, 76, 167–182. [Google Scholar] [CrossRef]
  17. Mitchell, T.C.; Hamid, O.; Smith, D.C.; Bauer, T.M.; Wasser, J.S.; Olszanski, A.J.; Luke, J.J.; Balmanoukian, A.S.; Schmidt, E.V.; Zhao, Y.; et al. Epacadostat Plus Pembrolizumab in Patients with Advanced Solid Tumors: Phase I Results from a Multicenter, Open-Label Phase I/II Trial (ECHO-202/KEYNOTE-037). J. Clin. Oncol. 2018, 36, JCO2018789602. [Google Scholar] [CrossRef]
  18. Long, G.V.; Dummer, R.; Hamid, O.; Gajewski, T.F.; Caglevic, C.; Dalle, S.; Arance, A.; Carlino, M.S.; Grob, J.; Kim, T.M.; et al. Epacadostat Plus Pembrolizumab Versus Placebo Plus Pembrolizumab in Patients with Unresectable Or Metastatic Melanoma (ECHO-301/KEYNOTE-252): A Phase 3, Randomised, Double-Blind Study. Lancet Oncol. 2019, 20, 1083–1097. [Google Scholar] [CrossRef]
  19. Li, H.; Ning, S.; Ghandi, M.; Kryukov, G.V.; Gopal, S.; Deik, A.; Souza, A.; Pierce, K.; Keskula, P.; Hernandez, D.; et al. The landscape of cancer cell line metabolism. Nat. Med. 2019, 25, 850–860. [Google Scholar] [CrossRef]
  20. Cheong, J.E.; Sun, L. Targeting the IDO1/TDO2–KYN–AhR Pathway for Cancer Immunotherapy—Challenges and Opportunities. Trends Pharm. Sci. 2018, 39, 307–325. [Google Scholar] [CrossRef]
  21. Winters, M.; DuHadaway, J.B.; Pham, K.N.; Lewis-Ballester, A.; Badir, S.; Wai, J.; Sheikh, E.; Yeh, S.; Prendergast, G.C.; Muller, A.J.; et al. Diaryl Hydroxylamines as Pan Or Dual Inhibitors of Indoleamine 2,3-Dioxygenase-1, Indoleamine 2,3-Dioxygenase-2 and Tryptophan Dioxygenase. Eur. J. Med. Chem. 2019, 162, 455–464. [Google Scholar] [CrossRef]
  22. Yang, L.; Chen, J.; Chen, Y.; He, J.; Njoya, E.M.; Liu, S.; Xie, C.; Huang, W.; Wang, Z.; Wang, F.; et al. 4,6-Substituted-1H-Indazoles as Potent IDO1/TDO Dual Inhibitors. Bioorg. Med. Chem. 2019, 27, 1087–1098. [Google Scholar] [CrossRef]
  23. Yang, D.; Zhang, S.; Fang, X.; Guo, L.; Hu, N.; Guo, Z.; Li, X.; Yang, S.; He, J.C.; Kuang, C.; et al. N-Benzyl/Aryl Substituted Tryptanthrin as Dual Inhibitors of Indoleamine 2,3-Dioxygenase and Tryptophan 2,3-Dioxygenase. J. Med. Chem. 2019, 62, 9161–9174. [Google Scholar] [CrossRef]
  24. Kitchen, D.B.; Decornez, H.; Furr, J.R.; Bajorath, J. Docking and Scoring in Virtual Screening for Drug Discovery: Methods and Applications. Nat. Rev. Drug Dis. 2004, 3, 935–949. [Google Scholar] [CrossRef]
  25. Lavecchia, A.; Di Giovanni, C. Virtual Screening Strategies in Drug Discovery: A Critical Review. Curr. Med. Chem. 2013, 20, 2839–2860. [Google Scholar] [CrossRef]
  26. Lionta, E.; Spyrou, G.; Vassilatis, D.K.; Cournia, Z. Structure-Based Virtual Screening for Drug Discovery: Principles, Applications and Recent Advances. Curr. Top. Med. Chem. 2014, 14, 1923–1938. [Google Scholar] [CrossRef]
  27. Richards, T.; Brin, E. Cell Based Functional Assays for IDO1 Inhibitor Screening and Characterization. Oncotarget 2018, 9, 30814–30820. [Google Scholar] [CrossRef]
  28. Tomek, P.; Palmer, B.D.; Flanagan, J.U.; Sun, C.; Raven, E.L.; Ching, L. Discovery and Evaluation of Inhibitors to the Immunosuppressive Enzyme Indoleamine 2,3-Dioxygenase 1 (IDO1): Probing the Active Site-Inhibitor Interactions. Eur. J. Med. Chem. 2017, 126, 983–996. [Google Scholar] [CrossRef]
  29. Zhang, Y.; Kang, S.A.; Mukherjee, T.; Bale, S.; Crane, B.R.; Begley, T.P.; Ealick, S.E. Crystal Structure and Mechanism of Tryptophan 2,3-Dioxygenase, a Heme Enzyme Involved in Tryptophan Catabolism and in Quinolinate Biosynthesis. Biochemistry 2007, 46, 145–155. [Google Scholar] [CrossRef]
  30. Peng, Y.; Ueng, S.; Tseng, C.; Hung, M.; Song, J.; Wu, J.; Liao, F.; Fan, Y.; Wu, M.; Hsiao, W.; et al. Important Hydrogen Bond Networks in Indoleamine 2,3-Dioxygenase 1 (IDO1) Inhibitor Design Revealed by Crystal Structures of Imidazoleisoindole Derivatives with IDO1. J. Med. Chem. 2016, 59, 282–293. [Google Scholar] [CrossRef]
  31. Luo, S.; Xu, K.; Xiang, S.; Chen, J.; Chen, C.; Guo, C.; Tong, Y.; Tong, L. High-resolution Structures of Inhibitor Complexes of Human Indoleamine 2,3-dioxygenase 1 in a New Crystal Form. Acta Crystal. Sect. F 2018, 74, 717–724. [Google Scholar] [CrossRef]
  32. Davies, M.; Nowotka, M.; Papadatos, G.; Dedman, N.; Gaulton, A.; Atkinson, F.; Bellis, L.; Overington, J.P. The ChEMBL Database in 2017. Nucl. Acids Res. 2015, 43, W61–W620. [Google Scholar]
  33. Pantouris, G.; Loudon-Griffiths, J.; Mowat, C.G. Insights into the Mechanism of Inhibition of Tryptophan 2,3-Dioxygenase by Isatin Derivatives. J. Enz. Inhib. Med. Chem. 2016, 31, 70–78. [Google Scholar] [CrossRef] [Green Version]
  34. Abdel-Magid, A.F. Targeting the Inhibition of Tryptophan 2,3-Dioxygenase (TDO-2) for Cancer Treatment. ACS Med. Chem. Let. 2017, 8, 11–13. [Google Scholar] [CrossRef] [Green Version]
  35. Wu, J.; Lin, S.; Liao, F.; Hsiao, W.; Lee, L.; Peng, Y.; Hsieh, C.; Wu, M.; Song, J.; Yueh, A.; et al. Identification of Substituted Naphthotriazolediones as Novel Tryptophan 2,3-Dioxygenase (TDO) Inhibitors through Structure-Based Virtual Screening. J. Med. Chem. 2015, 58, 7807–7819. [Google Scholar] [CrossRef]
  36. Röhrig, U.F.; Majjigapu, S.M.; Grosdidier, A.; Bron, S.; Stroobant, V.; Pilotte, L.; Colau, D.; Vogel, P.; van den Eynde, B.J.; Zoete, V.; et al. Rational Design of 4-Aryl-1,2,3-Triazoles for Indoleamine 2,3-Dioxygenase 1 Inhibition. J. Med. Chem. 2012, 55, 5270–5290. [Google Scholar]
  37. InterBioScree. Available online: https://www.ibscreen.com/ (accessed on 20 October 2018).
  38. Lipinski, C.A. Lead- and Drug-Like Compounds: The Rule-of-Five Revolution. Drug Discov. Today Technol. 2004, 1, 337–341. [Google Scholar] [CrossRef]
  39. Takao, M.; Okamoto, A.; Nikaido, T.; Urashima, M.; Takakura, S.; Saito, M.; Saito, M.; Okamoto, S.; Takikawa, O.; Sasaki, H.; et al. Increased Synthesis of Indoleamine-2,3-Dioxygenase Protein is Positively Associated with Impaired Survival in Patients with Serous-Type, but Not with Other Types of, Ovarian Cancer. Oncol. Rep. 2007, 17, 1333. [Google Scholar] [CrossRef]
  40. Opitz, C.A.; Litzenburger, U.M.; Sahm, F.; Ott, M.; Tritschler, I.; Trump, S.; Schumacher, T.; Jestaedt, L.; Schrenk, D.; Weller, M.; et al. An Endogenous Tumour-Promoting Ligand of the Human Aryl Hydrocarbon Receptor. Nature 2011, 478, 197–203. [Google Scholar] [CrossRef]
  41. Reinhold, W.C.; Sunshine, M.; Liu, H.; Varma, S.; Kohn, K.W.; Morris, J.; Doroshow, J.; Pommier, Y. CellMiner: A Web-Based Suite of Genomic and Pharmacologic Tools to Explore Transcript and Drug Patterns in the NCI-60 Cell Line Set. Cancer Res. 2012, 72, 3499–3511. [Google Scholar] [CrossRef]
  42. Yue, E.W.; Douty, B.; Wayland, B.; Bower, M.; Liu, X.; Leffet, L.; Wang, Q.; Bowman, K.J.; Hansbury, M.J.; Liu, C.; et al. Discovery of Potent Competitive Inhibitors of Indoleamine 2,3-Dioxygenase with in Vivo Pharmacodynamic Activity and Efficacy in a Mouse Melanoma Model. J. Med. Chem. 2009, 52, 7364–7367. [Google Scholar] [CrossRef]
  43. Salter, M.; Hazelwood, R.; Pogson, C.I.; Iyer, R.; Madge, D.J. The Effects of a Novel and Selective Inhibitor of Tryptophan 2,3-Dioxygenase on Tryptophan and Serotonin Metabolism in the Rat. Biochem. Pharm. 1995, 49, 1435–1442. [Google Scholar] [CrossRef]
  44. eMolecules. Available online: https://www.emolecules.com/ (accessed on 14 June 2019).
  45. Cui, H.; Zhang, H.; Liu, Y.; Gu, Q.; Xu, J.; Huang, X.; She, Z. Ethylnaphthoquinone Derivatives as Inhibitors of Indoleamine-2, 3-Dioxygenase from the Mangrove Endophytic Fungus Neofusicoccum Austral SYSU-SKS024. Fitoterapia 2018, 125, 281–285. [Google Scholar] [CrossRef]
  46. Matuszek, A.M.; Reynisson, J. Defining Known Drug Space using DFT. Mol. Inf. 2016, 35, 46–53. [Google Scholar] [CrossRef]
  47. Beall, J.B.; Holloway, G.A. New Substructure Filters for Removal of Pan Assay Interference Compounds (PAINS) from Screening Libraries and for their Exclusion in Bioassays. J. Med. Chem. 2010, 2010, 2719–2740. [Google Scholar] [CrossRef] [Green Version]
  48. Zhu, F.; Logan, G.; Reynisson, J. Wine Compounds as a Source for HTS Screening Collections. A Feasibility Study. Mol. Inf. 2012, 31, 847–855. [Google Scholar] [CrossRef]
  49. Eurtivong, C.; Reynisson, J. The Development of a Weighted Index to Optimise Compound Libraries for High Throughput Screening. Mol. Inf. 2019, 38, e1800068. [Google Scholar] [CrossRef]
  50. Lewis-Ballester, A.; Forouhar, F.; Kim, S.; Lew, S.; Wang, Y.; Karkashon, S.; Seetharaman, J.; Batabyal, D.; Chiang, B.; Hussain, M.; et al. Molecular Basis for Catalysis and Substrate-Mediated Cellular Stabilization of Human Tryptophan 2,3-Dioxygenase. Sci. Rep. 2016, 6, 35169. [Google Scholar] [CrossRef] [Green Version]
  51. MicahNelp, M.T.; Kates, P.A.; Hunt, J.T.; Newitt, J.A.; Balog, A.; Maley, D.; Zhu, X.; Abell, L.; Allentoff, A.; Borzilleri, R.; et al. Immune-Modulating Enzyme Indoleamine 2,3-Dioxygenase is Effectively Inhibited by Targeting its Apo-Form. Proc. Natl. Acad. Sci. USA 2018, 115, 3249–3254. [Google Scholar]
  52. Meng, B.; Wu, D.; Gu, J.; Ouyang, S.; Ding, W.; Liu, Z. Structural and Functional Analyses of Human Tryptophan 2,3-dioxygenase. Proteins: Struct. Funct. Bioinf. 2014, 82, 3210–3216. [Google Scholar] [CrossRef]
  53. Banks, J.L.; Beard, H.S.; Cao, Y.; Cho, A.E.; Damm, W.; Farid, R.; Felts, A.K.; Halgren, T.A.; Mainz, D.T.; Maple, J.R.; et al. Integrated Modeling Program, Applied Chemical Theory (IMPACT). J. Comp. Chem. 2005, 26, 1752–1780. [Google Scholar] [CrossRef] [Green Version]
  54. QikProp Version 3.2; Schrödinger: New York, NY, USA, 2009.
  55. Ioakimidis, L.; Thoukydidis, L.; Naeem, S.; Mirza, A.; Reynisson, J. Benchmarking the Reliability of QikProp. Correlation between Experimental and Predicted Values. QSAR Comb. Sci. 2008, 27, 445–456. [Google Scholar] [CrossRef]
  56. Berman, H.M.; Westbrook, J.; Feng, Z.; Gilliland, G.; Bhat, T.N.; Weissig, H.; Shindyalov, I.N.; Bourne, P.E. The Protein Data Bank. Nucl. Acids Res. 2000, 28, 235–242. [Google Scholar] [CrossRef] [Green Version]
  57. Berman, H.; Henrick, K.; Nakamura, H. Announcing the Worldwide Protein Data Bank. Nat. Struct. Biol. 2003, 10, 980. [Google Scholar] [CrossRef]
  58. Madhavi Sastry, G.; Adzhigirey, M.; Day, T.; Annabhimoju, R.; Sherman, W. Protein and Ligand Preparation: Parameters, Protocols, and Influence on Virtual Screening Enrichments. J. Comp. Aided Mol. Des. 2013, 27, 221–234. [Google Scholar] [CrossRef]
  59. Friesner, R.A.; Banks, J.L.; Murphy, R.B.; Halgren, T.A.; Klicic, J.J.; Mainz, D.T.; Repasky, M.P.; Knoll, E.H.; Shelley, M.; Perry, J.K.; et al. Glide: A New Approach for Rapid, Accurate Docking and Scoring. 1. Method and Assessment of Docking Accuracy. J. Med. Chem. 2004, 47, 1739–1749. [Google Scholar] [CrossRef]
  60. Friesner, R.A.; Murphy, R.B.; Repasky, M.P.; Frye, L.L.; Greenwood, J.R.; Halgren, T.A.; Sanschagrin, P.C.; Mainz, D.T. Extra Precision Glide: Docking and Scoring Incorporating a Model of Hydrophobic Enclosure for Protein−Ligand Complexes. J. Med. Chem. 2006, 49, 6177–6196. [Google Scholar] [CrossRef] [Green Version]
  61. Halgren, T.A.; Murphy, R.B.; Friesner, R.A.; Beard, H.S.; Frye, L.L.; Pollard, W.T.; Banks, J.L. Glide: A New Approach for Rapid, Accurate Docking and Scoring. 2. Enrichment Factors in Database Screening. J. Med. Chem. 2004, 47, 1750–1759. [Google Scholar] [CrossRef]
  62. Dixon, S.; Smondyrev, A.; Knoll, E.; Rao, S.; Shaw, D.; Friesner, R. PHASE: A New Engine for Pharmacophore Perception, 3D QSAR Model Development, and 3D Database Screening: 1. Methodology and Preliminary Results. J. Comput. Aided Mol. Des. 2006, 20, 647–671. [Google Scholar] [CrossRef]
  63. Dixon, S.L.; Smondyrev, A.M.; Rao, S.N. PHASE: A Novel Approach to Pharmacophore Modeling and 3D Database Searching. Chem. Biol. Drug Des. 2006, 67, 370–372. [Google Scholar] [CrossRef]
  64. Cho, A.E.; Guallar, V.; Berne, B.J.; Friesner, R. Importance of Accurate Charges in Molecular Docking: Quantum Mechanical/Molecular Mechanical (QM/MM) Approach. J. Comput. Chem. 2005, 26, 915–931. [Google Scholar] [CrossRef] [Green Version]
  65. Bochevarov, A.D.; Harder, E.; Hughes, T.F.; Greenwood, J.R.; Braden, D.A.; Philipp, D.M.; Rinaldo, D.; Halls, M.D.; Zhang, J.; Friesner, R.A. Jaguar: A High-performance Quantum Chemistry Software Program with Strengths in Life and Materials Sciences. Int. J. Quant. Chem. 2013, 113, 2110–2142. [Google Scholar] [CrossRef]
  66. Murphy, R.B.; Philipp, D.M.; Friesner, R.A. A Mixed Quantum Mechanics/Molecular Mechanics (QM/MM) Method for Large-scale Modeling of Chemistry in Protein Environments. J. Comput. Chem. 2000, 21, 1442–1457. [Google Scholar] [CrossRef]
  67. Fung, S.S.; Wang, H.; Tomek, P.; Squire, C.J.; Flanagan, J.U.; Palmer, B.D.; Bridewell, D.J.A.; Tijono, S.M.; Jamie, J.F.; Ching, L. Discovery and Characterisation of Hydrazines as Inhibitors of the Immune Suppressive Enzyme, Indoleamine 2,3-Dioxygenase 1 (IDO1). Bioorg. Med. Chem. 2013, 21, 7595–7603. [Google Scholar] [CrossRef]
  68. Peskin, A.V.; Winterbourn, C.C. A Microtiter Plate Assay for Superoxide Dismutase using a Water-Soluble Tetrazolium Salt (WST-1). Clin. Chim. Acta 2000, 293, 157–166. [Google Scholar] [CrossRef]
  69. Leung, E.Y.; Kim, J.E.; Askarian-Amiri, M.; Joseph, W.R.; McKeage, M.J.; Baguley, B.C. Hormone Resistance in Two MCF-7 Breast Cancer Cell Lines is Associated with Reduced mTOR Signaling, Decreased Glycolysis, and Increased Sensitivity to Cytotoxic Drugs. Front. Oncol. 2014, 4, 221. [Google Scholar] [CrossRef] [Green Version]
  70. Kirtikara, K.; Vichai, V. Sulforhodamine B Colorimetric Assay for Cytotoxicity Screening. Nature Prot. 2006, 1, 1112–1116. [Google Scholar]
  71. Leung, E.Y.; Askarian-Amiri, M.; Finlay, G.J.; Rewcastle, G.W.; Baguley, B.C. Potentiation of Growth Inhibitory Responses of the mTOR Inhibitor Everolimus by Dual mTORC1/2 Inhibitors in Cultured Breast Cancer Cell Lines. PLoS ONE 2015, 10. [Google Scholar] [CrossRef]
  72. Leung, E.Y.; Kim, J.E.; Askarian-Amiri, M.; Rewcastle, G.W.; Finlay, G.J.; Baguley, B.C. Relationships between Signaling Pathway Usage and Sensitivity to a Pathway Inhibitor: Examination of Trametinib Responses in Cultured Breast Cancer Lines. PLoS ONE 2014, 9, e105792. [Google Scholar] [CrossRef] [Green Version]
  73. Frisch, M.J.; Trucks, G.W.; Schlegel, H.B.; Scuseria, G.E.; Robb, M.A.; Cheeseman, J.R.; Scalmani, G.; Barone, V.; Petersson, G.A.; Nakatsuji, H.; et al. Gaussian 16, Revision C.01, Gaussian, Inc.: Wallingford, CT, USA, 2019.
  74. Becke, A.D. Density-Functional Exchange-Energy Approximation with Corect Asymptotic Behavior. Phys. Rev. A 1988, 38, 3098. [Google Scholar] [CrossRef]
  75. Becke, A.D. Density-Functional thermochemistryIII. The Role of Exact Exchange. J. Chem. Phys. 1993, 98, 5648–5652. [Google Scholar] [CrossRef] [Green Version]
  76. Frisch, M.J.; Pople, J.A.; Binkley, J.S. Self-Consistent Molecular Orbital Methods 25. Supplementary Functions for Gaussian Basis Sets. J. Chem. Phys. 1984, 80, 3265–3269. [Google Scholar] [CrossRef]
  77. Hariharan, P.C.; Pople, J.A. Influence of Polarization Functions on Molecular-Orbital Hydrogenation Energies. Theoret. Chim. Acta 1973, 28, 213–222. [Google Scholar] [CrossRef]
  78. Wong, M.W. Vibrational Frequency Prediction using Density Functional Theory. Chem. Phys. Lett. 1996, 256, 391–399. [Google Scholar]
  79. Foresman, J.B.; Frisch, A. Exploring Chemistry with Electronic Structure Methods. Gaussian Inc. 1996, 142–143. [Google Scholar]
Sample Availability: Samples of the compounds TD12, TD18 and TD34 are available from the authors.
Figure 1. The molecular structures of 9R9 and some of the tryptophan 2,3-dioxygenase (TDO2) active (1a1e) and inactive (2a2e) compounds in the test library. The complete library is given in the Supplementary Material, Figure S1.
Molecules 24 04346 g001
Figure 2. Accumulation curves for (A) the molecular docking method and (B) pharmacophore models 1 and 2, compared to the ideal curve (black solid line). Whilst (A) indicates poor enrichment, pharmacophore model 2 (orange dots) in (B) affords excellent enrichment with RAUC value of 0.98.
Molecules 24 04346 g002
Figure 3. Accumulation curves for the three ligand-based shape screening methods of the query compounds 1a (A), 1b (B) and 1c (C).
Molecules 24 04346 g003
Figure 4. Outline of the ligand- and pharmacophore-based in silico screening cascade and experimental evaluation.
Molecules 24 04346 g004
Figure 5. Identification and characterisation of indoleamine 2,3-dioxygenase 1 (IDO1) and tryptophan 2,3- dioxygenase (TDO2) expressing cell lines (A) Scatter star plot of normalised TDO2 (y-axis) and IDO1 (x-axis) mRNA expression levels (Z-score) of 60 cancer cell lines from the NCI CellMiner CDB database [41]. Grey horizontal and vertical line demarcates the lowest Z-score values in the dataset. Cell lines are grouped into six clusters based on the unsupervised hierarchical clustering analysis, using Ward.D2 clustering of Manhattan distances. Enlarged points indicate centres of each cluster. Marginal plots represent histograms. (B) Secreted kynurenine levels and (C) abundance of human IDO1 and α-tubulin (loading control) in cancer cell lines studied. Bar height denotes arithmetic mean of independent experimental measurements represented as white circles. (D) Inhibitory activity of reference IDO1 inhibitor 5L and TDO2 inhibitor 680C91 in A172 glioblastoma, SKOV3 ovarian and BT549 breast cancer cell lines. The values inside the plots indicate IC50.
Molecules 24 04346 g005
Figure 6. Assessing the inhibitory activity of the virtual hits in cell-based assays. (A) Inhibition of kynurenine secretion in SKOV3 and BT549 cell lines by the virtual hits TD1 to TD30 and the structural derivative of TD05, TD31 to TD36 at 20 µM. Asterisks mark compounds toxic to the BT549 and SKOV3 cell lines. (B) Chemical structures of the confirmed dioxygenase inhibitors TD12, TD18 and TD34. (C) Potency of the three confirmed inhibitors in all three cell line models. The values inside the plots are IC50 values. Data points are arithmetic means ± standard deviations.
Molecules 24 04346 g006
Figure 7. Evaluating specificity and toxicity of the confirmed inhibitors. (A) Immunoblot for IDO1 expression in BT549 and SKOV3 lines treated with the inhibitors at 20 µM for 24 h. Tubulin represents a loading control. (B) The effect of 20 µM concentration of the inhibitors on cell viability measured by WST-1 assay and cell growth measured by SRB assay.
Molecules 24 04346 g007
Figure 8. Alignment of TD12 (cyan, left-hand side) and TD18 (magenta, right-hand side) to pharmacophore model 2. The pharmacophore features are shown as orange rings (aromatic ring), pink spheres (H-bond acceptor), and blue spheres (excluded volumes); feature tolerances are showed as grey spheres around the pharmacophores.
Molecules 24 04346 g008
Figure 9. Binding interactions of TD12 (A), TD18 (B) and TD34 (C) with holo human TDO2 active site residues according to molecular docking. Ligands and heme are shown as colour sticks, protein as ribbons, and binding interactions as coloured dashed lines, yellow for H-bond, blue for π–π, and green for π–cation.
Molecules 24 04346 g009
Figure 10. Binding interactions of TD12 (A), TD18 (B) and TD34 (C) with holo human IDO1 active site residues according to molecular docking. Ligands and heme are shown as colour sticks, protein as ribbons, and π–π interactions as blue dashed lines.
Molecules 24 04346 g010
Figure 11. Binding interactions of TD12 (A), TD18 (B) and TD34 (C) with apo human TDO2 active site residues according to molecular docking. Ligands and heme are showed as colour sticks, protein as ribbons, and binding interactions as colour dashed lines, yellow for H-bond, violet for halogen bond, blue for π–π, and green for π–cation.
Molecules 24 04346 g011
Table 1. RAUC values of the accumulation curves for the query compounds obtained using the three modes of shape similarity screening.
QueryTyped PharmacophoreTyped AtomsUntyped Atoms
1a0.760.950.95
1b0.650.900.87
1c0.780.960.97
Table 2. The molecular descriptors calculated for TD012, TD018 and TD34 as well as their Known Drug Indexes (KDIs).
MWPSA#RotorDonorHBAccptHBLog PKDI2a/b
TD12284.373.3614.52.75.70/0.75
TD18312.472.2714.53.55.67/0.71
TD34375.276.0306.02.65.69/0.70
MW: Molecular weight. PSA: Van der Waals surface area of polar nitrogen and oxygen atoms and carbonyl carbon atoms. #rotor: number of rotatable bonds. donorHB: H bond donor count. accptHB: H bond acceptor count. Log P: Predicted octanol/water partition coefficient. KDI: Known Drug Index.
Table 3. Docking scores (kcal/mol) * for the hit matter.
Ligand6A4I5EK36E43
TD12−7.9−6.4−7.2
TD18−7.4−6.8−7.4
TD34−3.9−6.3−8.2
* XPGscore from the QM-optimized re-docking.

