
Conformation and Dynamics of the Cyclic Lipopeptide Viscosinamide at the Water-Lipid Interface

 , , , ,
Abstract
:
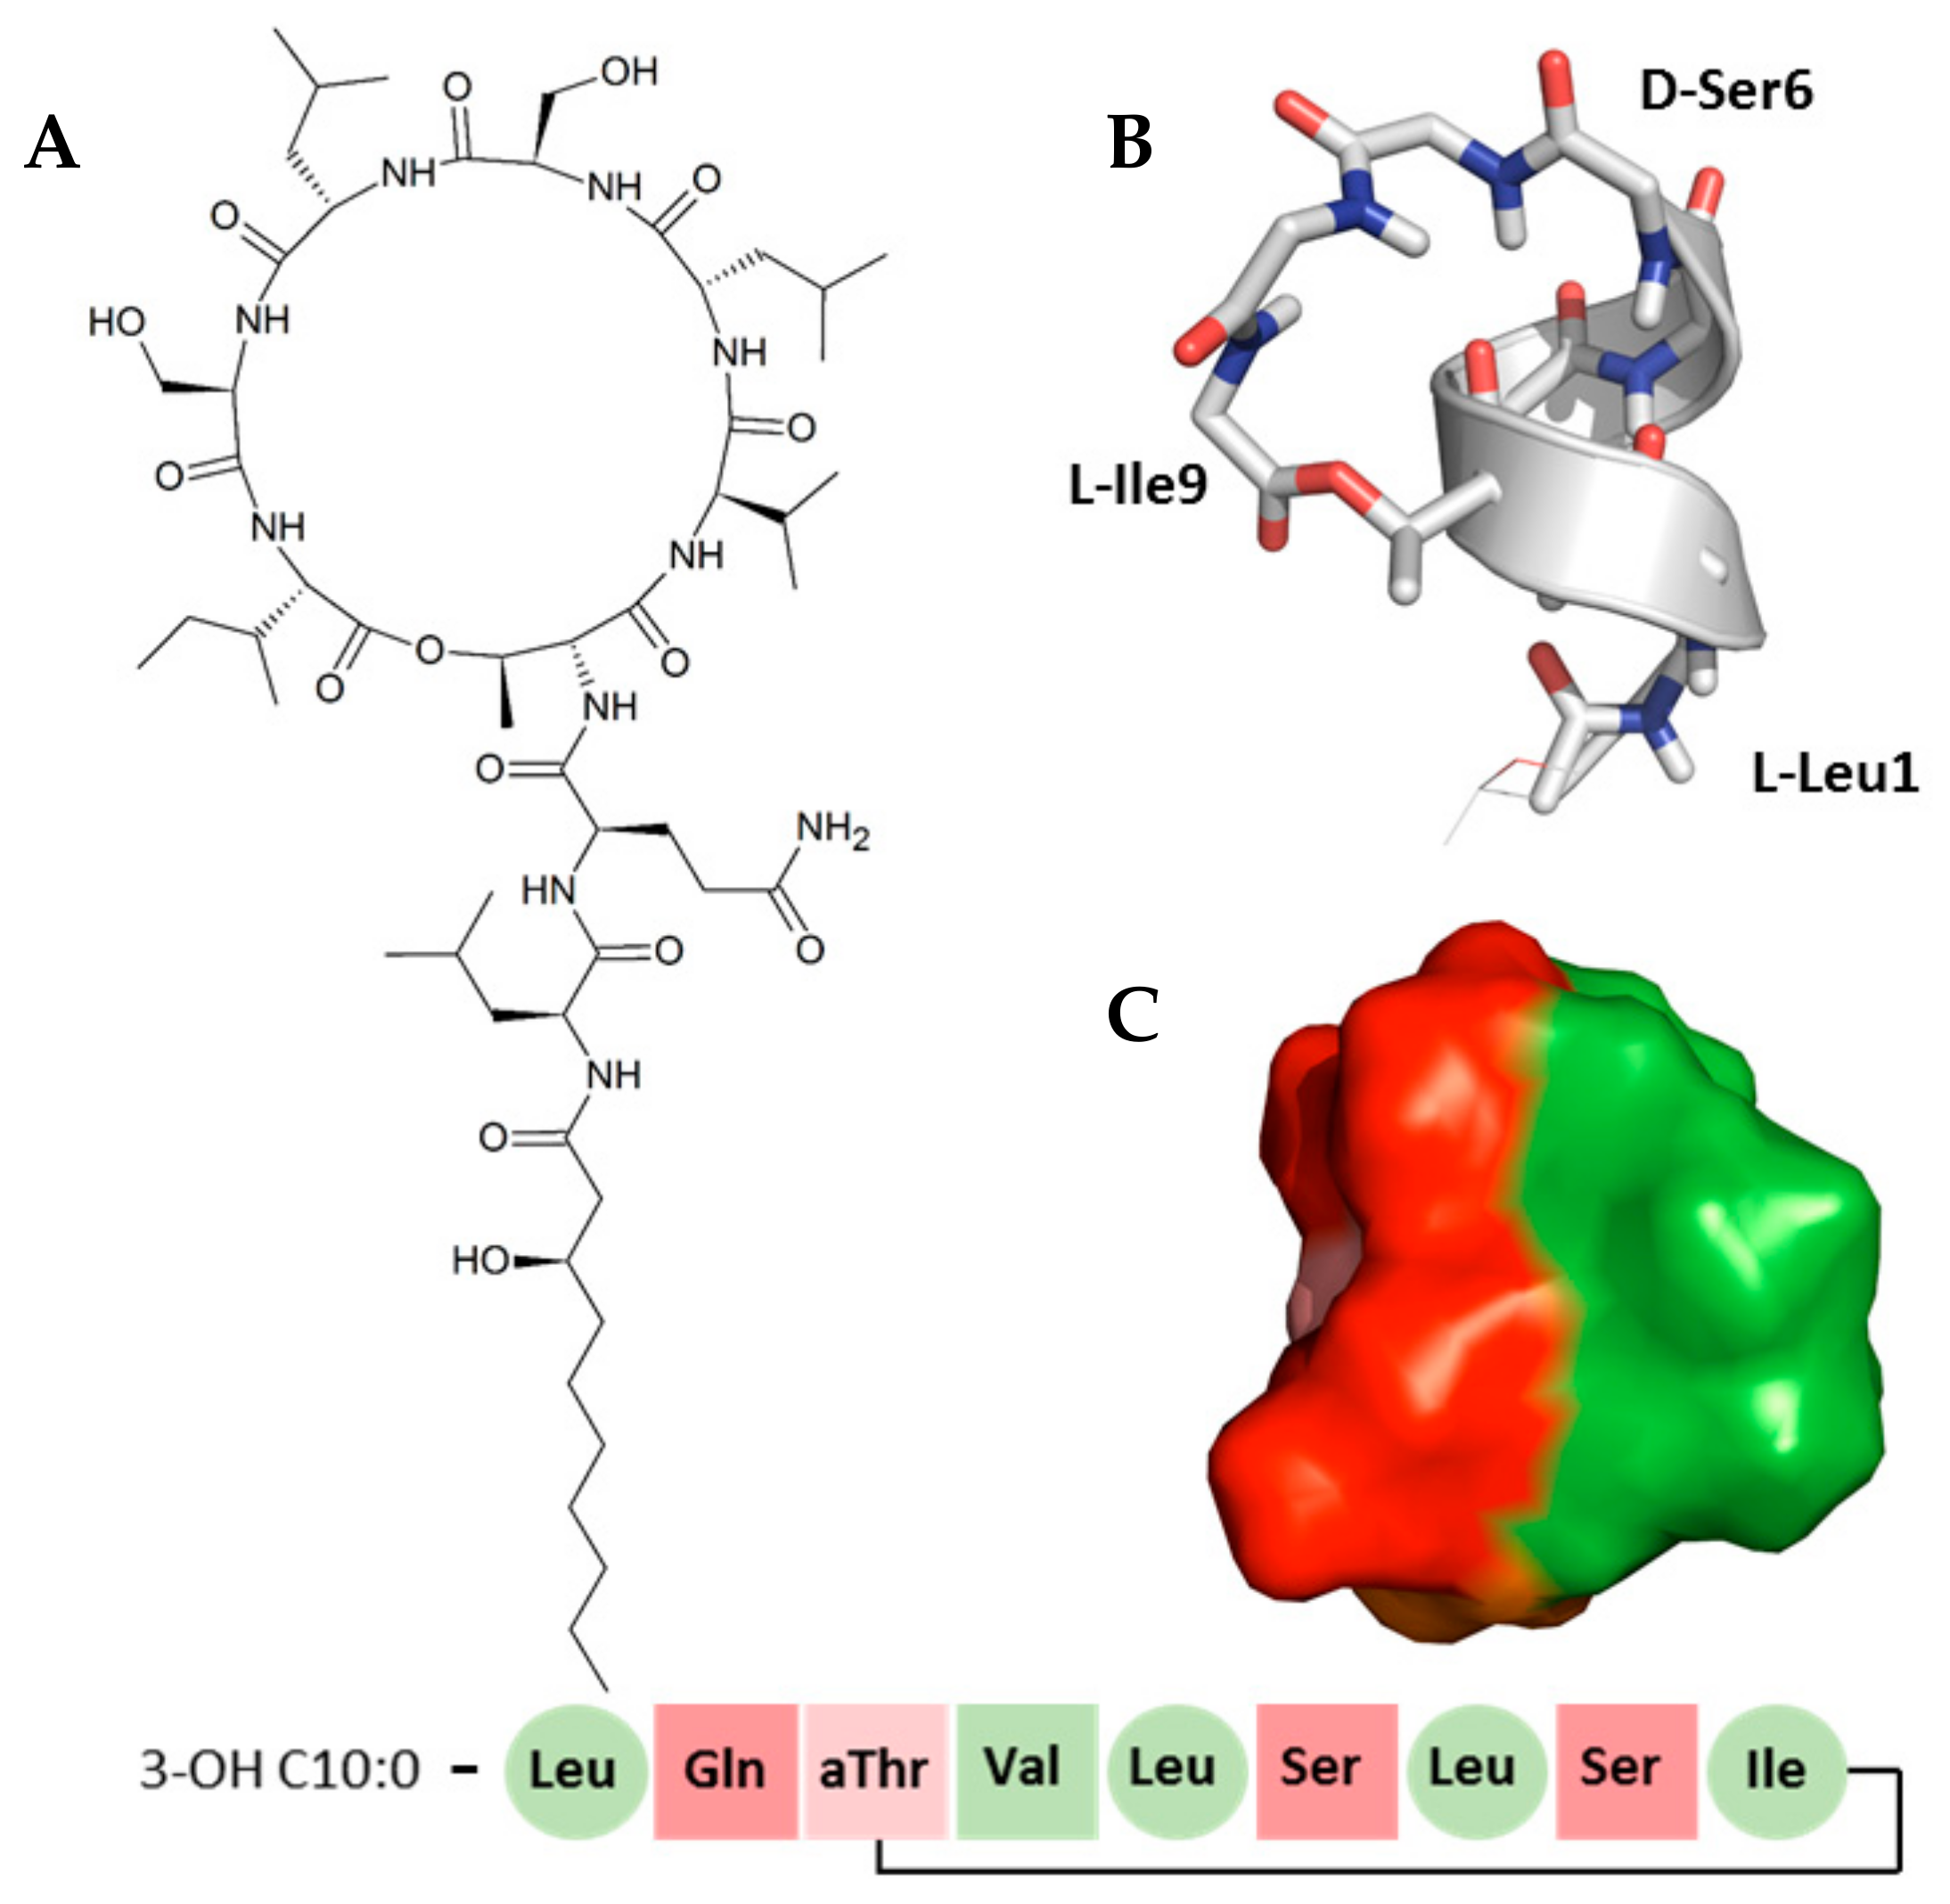
1. Introduction
2. Results
2.1. Initial Observations and Partitioning of VA in DPC Solution Using Diffusion NMR Spectroscopy
2.2. The Conformation of VA Observed in Acetonitrile is Preserved in DPC Solution
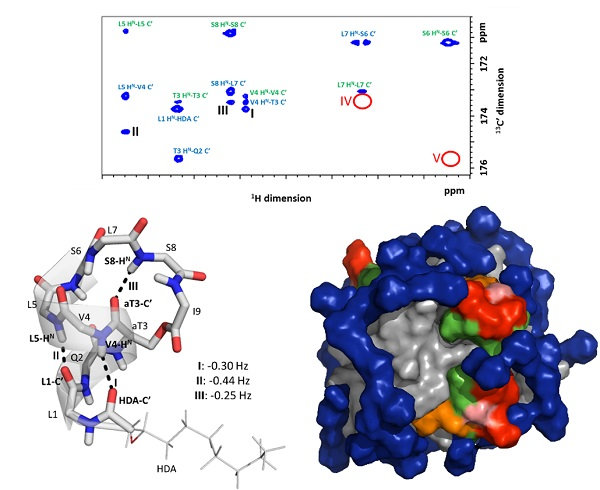
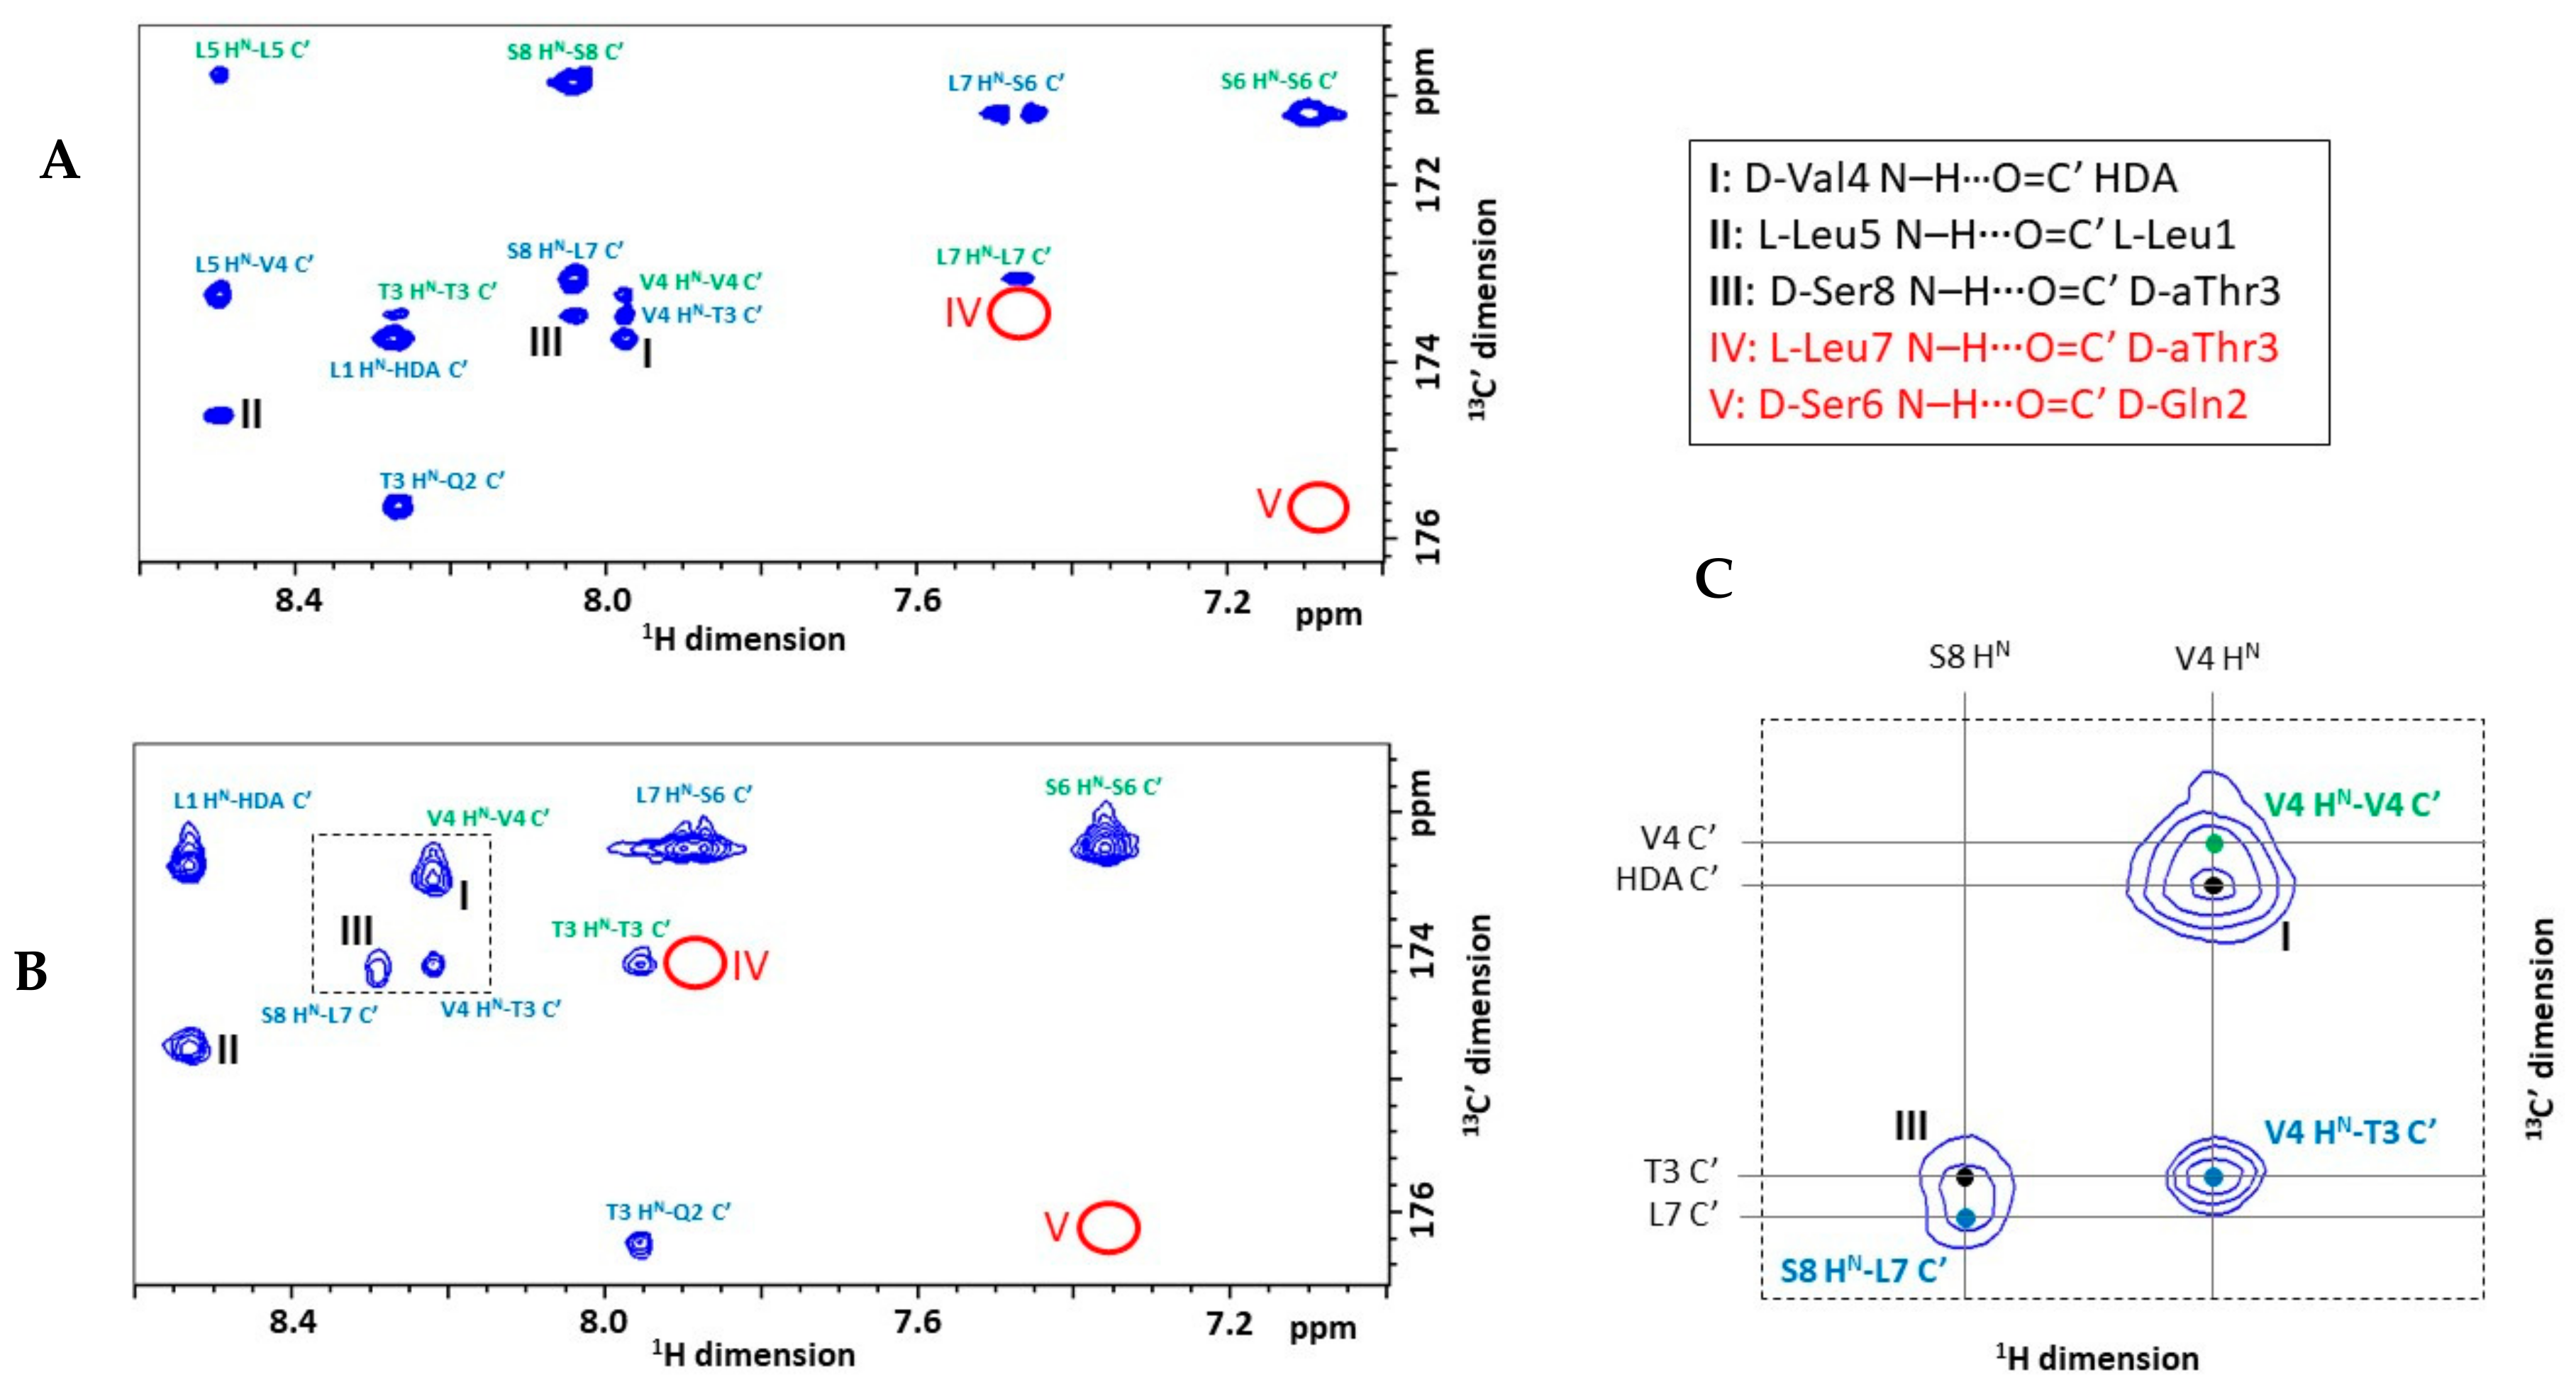
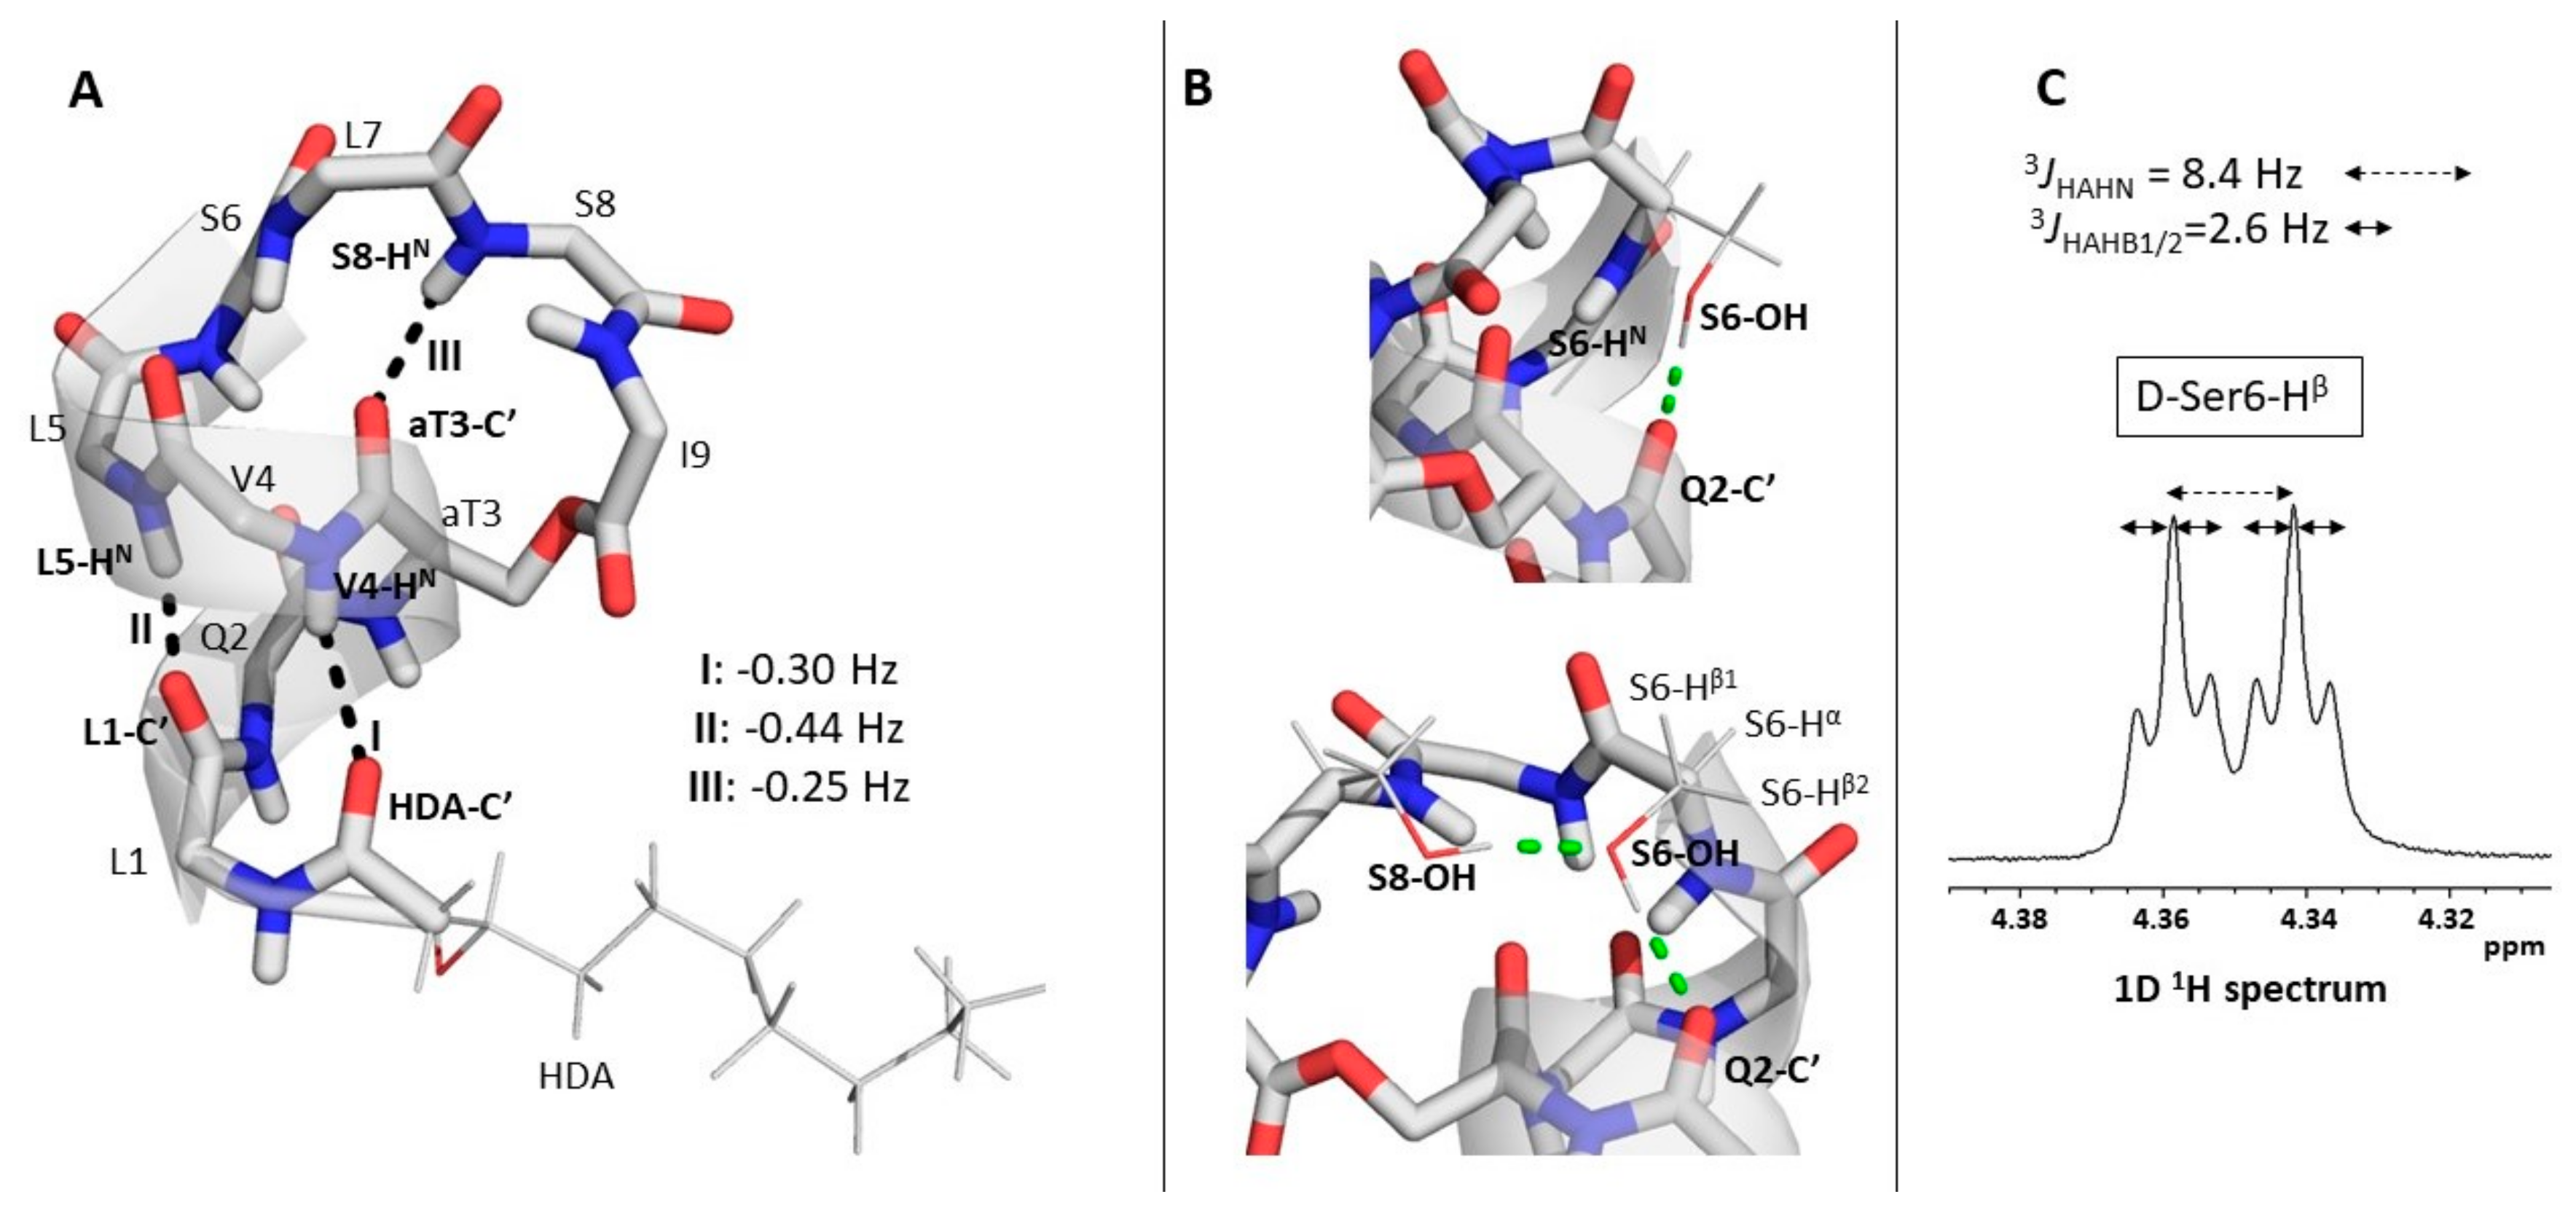
2.3. Explicit Detection of Hydrogen Bonds Demonstrates the Rigidity of the Viscosinamide Fold
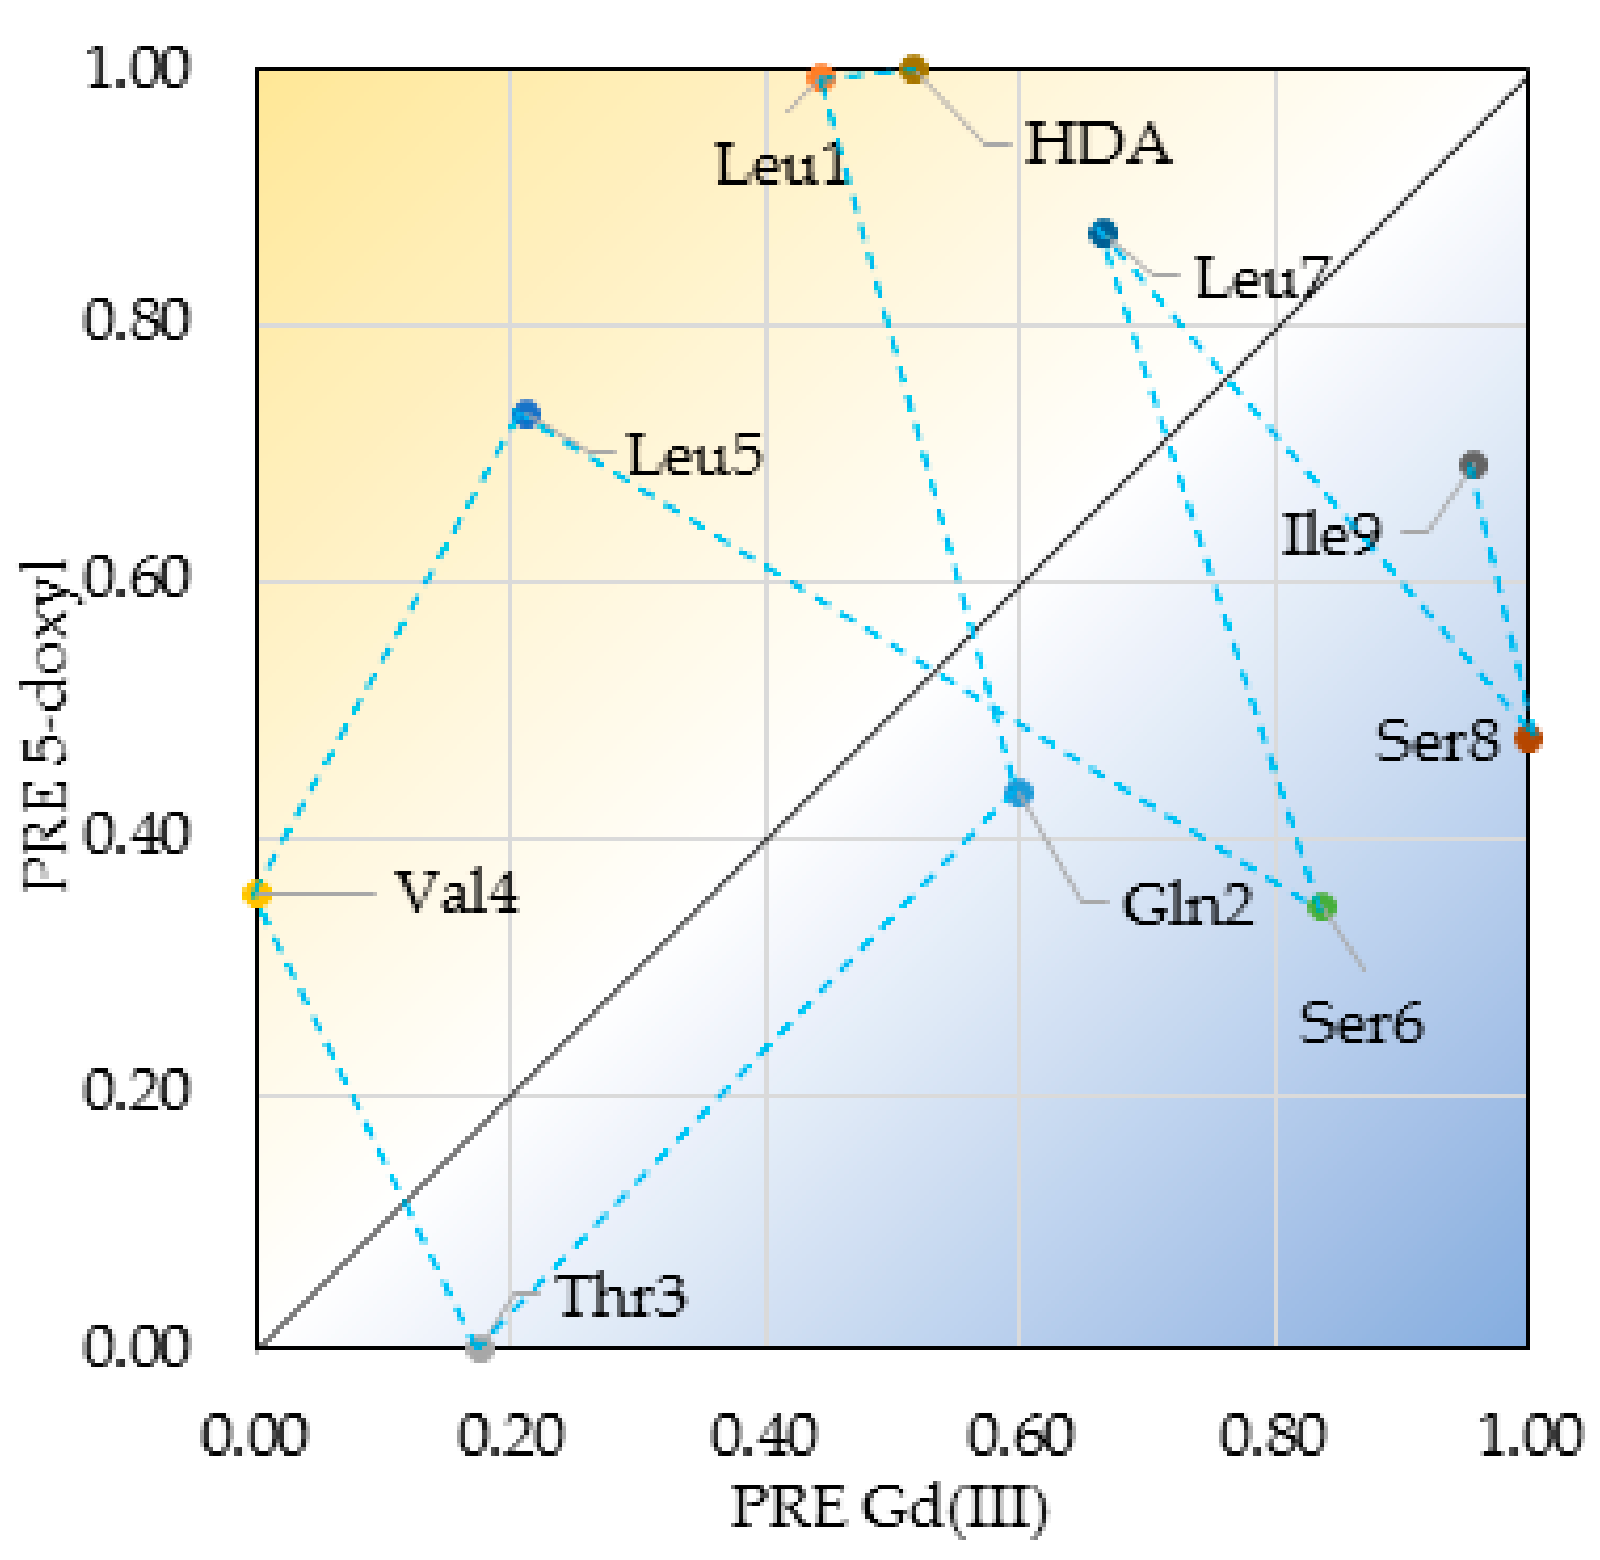
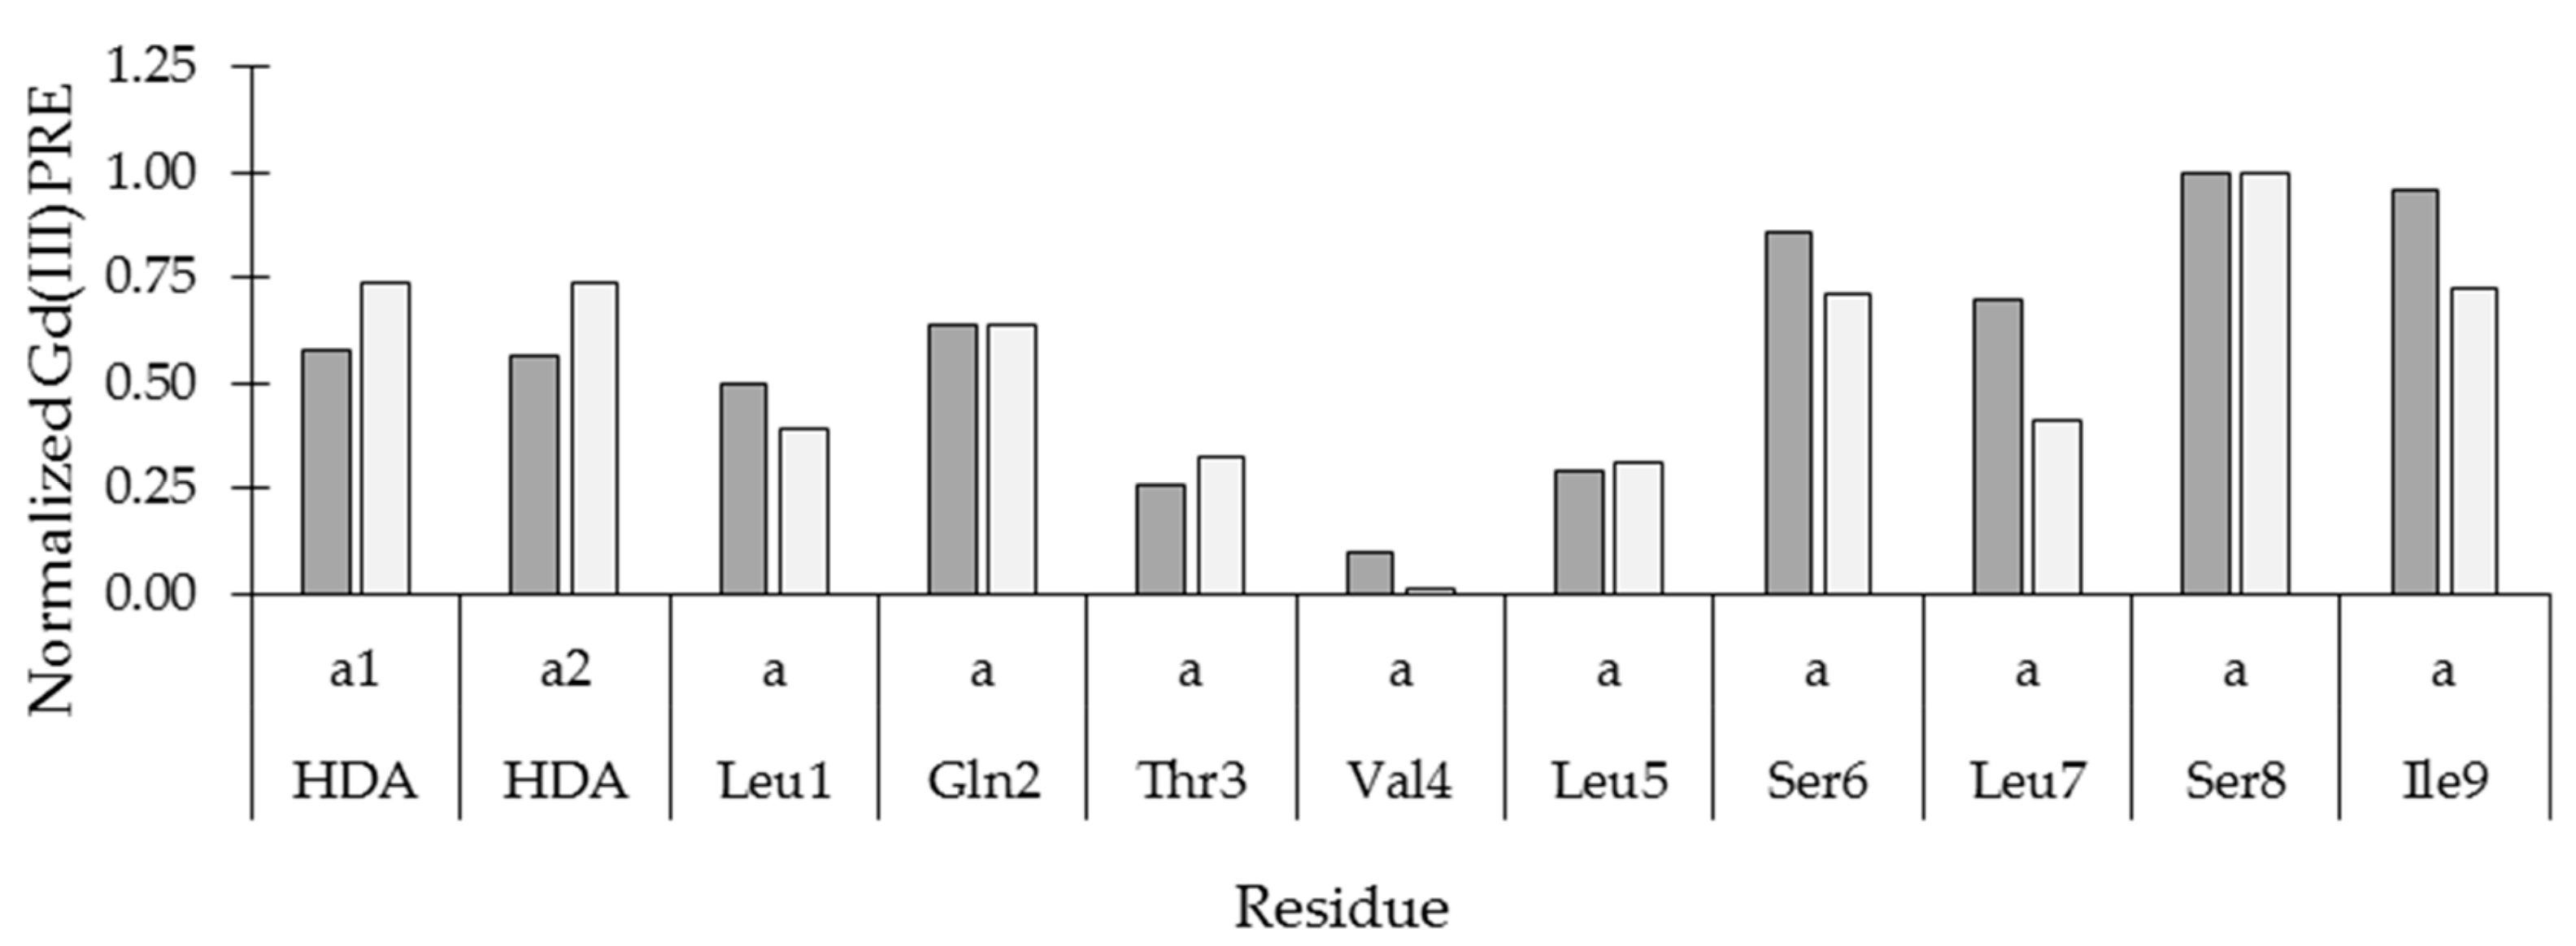
2.4. Insertion Depth and Orientation of VA in DPC Micelles Using Paramagnetic Probes
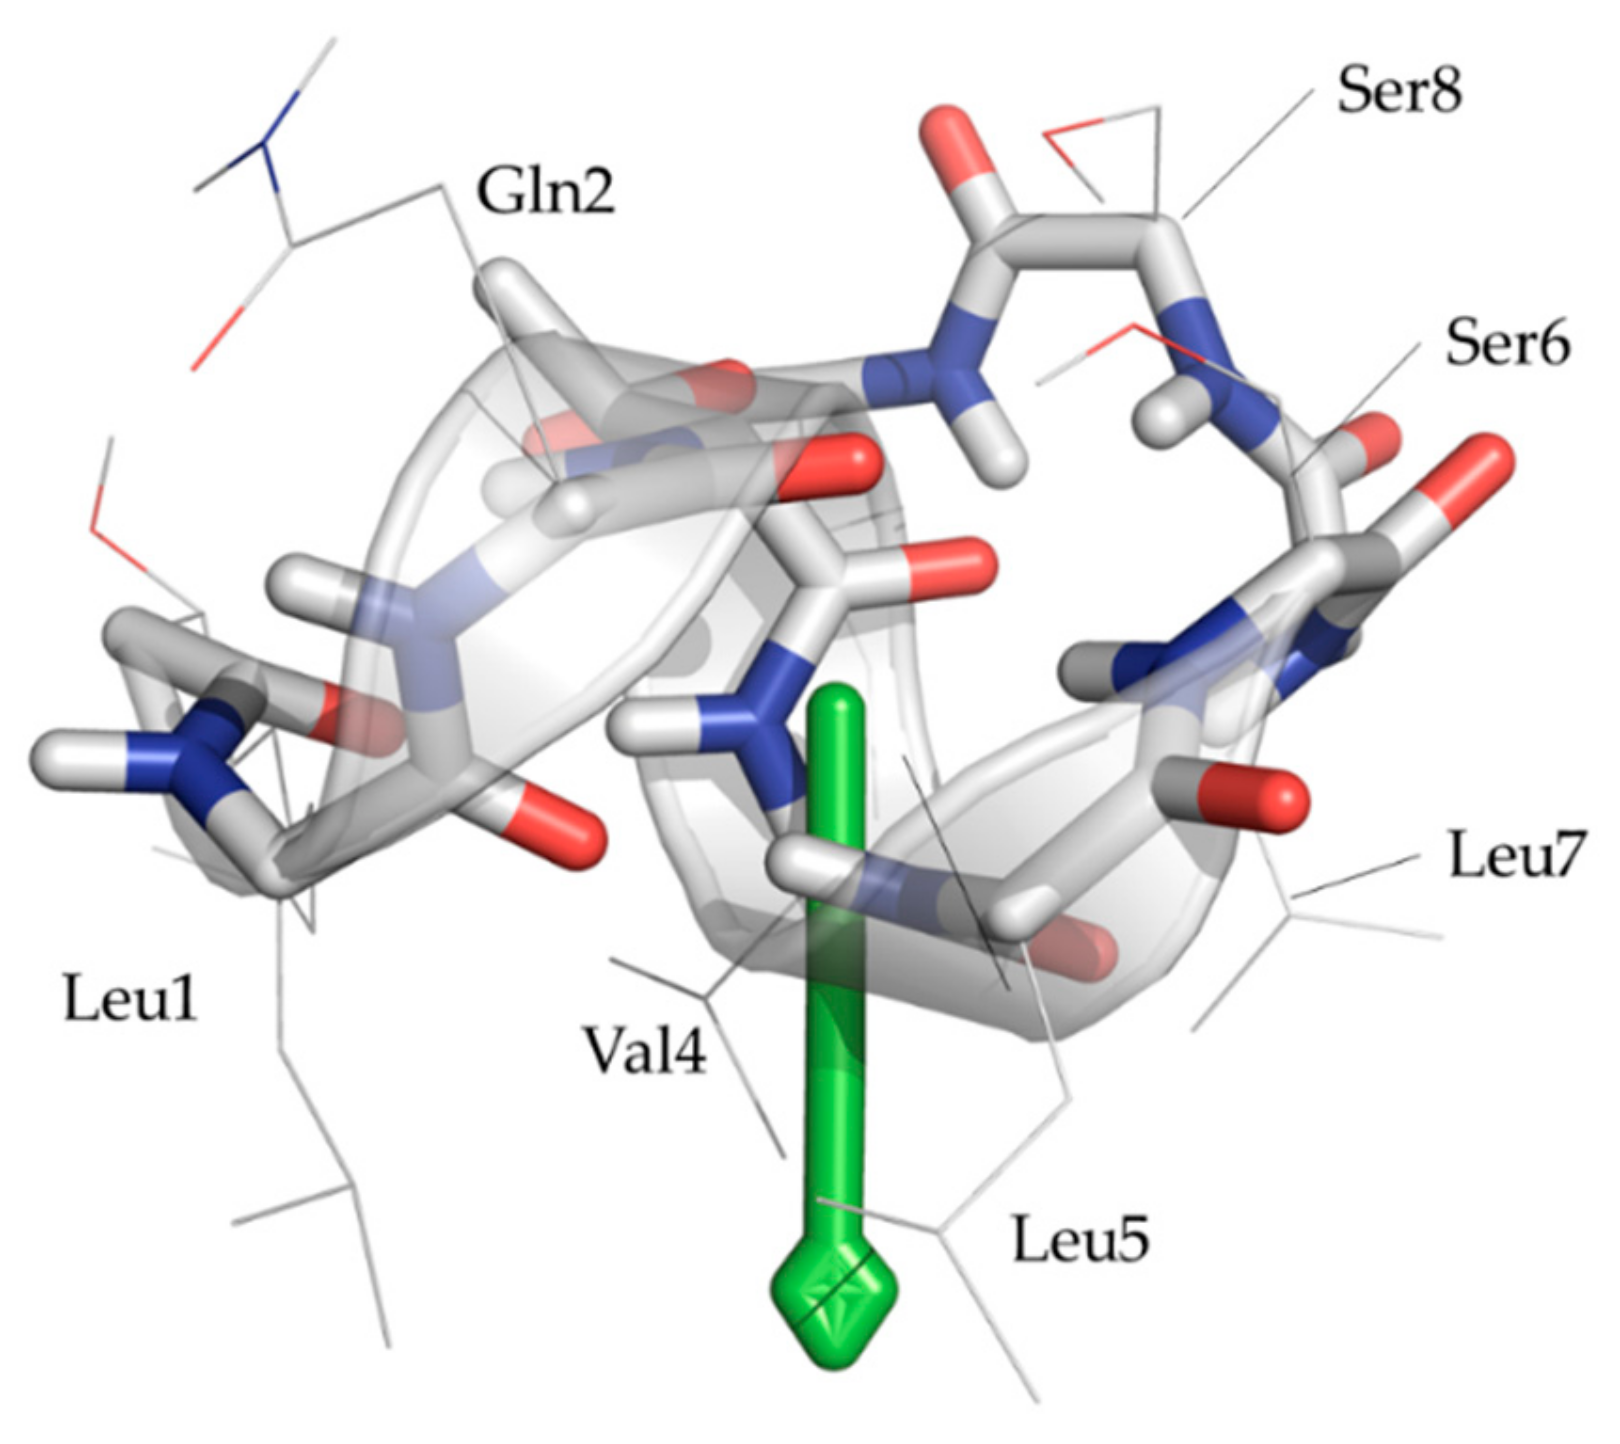
2.5. Completing the Picture Using Molecular Modelling in DPC/Water Mixtures
3. Discussion
4. Materials and Methods
Supplementary Materials
Author Contributions
Funding
Acknowledgments
Conflicts of Interest
References
- Roongsawang, N.; Washio, K.; Morikawa, M. Diversity of nonribosomal peptide synthetases involved in the biosynthesis of lipopeptide biosurfactants. Int. J. Mol. Sci. 2010, 12, 141–172. [Google Scholar] [CrossRef] [PubMed]
- Alsohim, A.S.; Taylor, T.B.; Barrett, G.A.; Gallie, J.; Zhang, X.X.; Altamirano-Junqueira, A.E.; Johnson, L.J.; Rainey, P.B.; Jackson, R.W. The biosurfactant viscosin produced by Pseudomonas fluorescens SBW25 aids spreading motility and plant growth promotion. Environ. Microbiol. 2014, 16, 2267–2281. [Google Scholar] [CrossRef] [PubMed]
- Song, C.; Aundy, K.; van de Mortel, J.; Raaijmakers, J.M. Discovery of new regulatory genes of lipopeptide biosynthesis in Pseudomonas fluorescens. FEMS Microbiol. Lett. 2014, 356, 166–175. [Google Scholar] [CrossRef] [PubMed]
- D’Aes, J.; Kieu, N.P.; Leclere, V.; Tokarski, C.; Olorunleke, F.E.; De Maeyer, K.; Jacques, P.; Hofte, M.; Ongena, M. To settle or to move? The interplay between two classes of cyclic lipopeptides in the biocontrol strain Pseudomonas CMR12A. Environ. Microbiol. 2014, 16, 2282–2300. [Google Scholar] [CrossRef] [PubMed]
- Hofte, M.; Altier, N. Fluorescent pseudomonads as biocontrol agents for sustainable agricultural systems. Res. Microbiol. 2010, 161, 464–471. [Google Scholar] [CrossRef] [PubMed]
- D’Aes, J.; De Maeyer, K.; Pauwelyn, E.; Hofte, M. Biosurfactants in plant-Pseudomonas interactions and their importance to biocontrol. Environ. Microbiol. Rep. 2010, 2, 359–372. [Google Scholar] [CrossRef] [PubMed]
- Nielsen, T.H.; Christophersen, C.; Anthoni, U.; Sorensen, J. Viscosinamide, a new cyclic depsipeptide with surfactant and antifungal properties produced by Pseudomonas fluorescens DR54. J. Appl. Microbiol. 1999, 86, 80–90. [Google Scholar] [CrossRef]
- Gerard, J.; Barsby, T.; Haden, P.; Kelly, M.T.; Anderson, R.J. Massetolides A-H, antimycobacterial cyclic depsipeptides produced by two pseumonads isolated from marine habitats. J. Nat. Prod. 1997, 60, 223–229. [Google Scholar] [CrossRef]
- Sinnaeve, D.; Michaux, C.; Van hemel, J.; Vandenkerckhove, J.; Peys, E.; Borremans, F.A.M.; Sas, B.; Wouters, J.; Martins, J.C. Structure and x-ray conformation of pseudodesmins A and B, two new cyclic lipodepsipeptides from Pseudomonas bacteria. Tetrahedron 2009, 65, 4173–4181. [Google Scholar] [CrossRef]
- Jang, J.Y.; Yang, S.Y.; Kim, Y.C.; Lee, C.W.; Park, M.S.; Kim, J.C.; Kim, I.S. Identification of orfamide A as an insecticidal metabolite produced by Pseudomonas protegens f6. J. Agric. Food Chem. 2013, 61, 6786–6791. [Google Scholar] [CrossRef]
- Groupé, V.; Pugh, L.H.; Weiss, D.; Kochi, M. Observations on antiviral activity of viscosin. Exp. Biol. Med. 1951, 78, 354–358. [Google Scholar] [CrossRef]
- Van De Mortel, J.E.; Tran, H.; Govers, F.; Raaijmakers, J.M. Cellular responses of the late blight pathogen Phytophthora infestans to cyclic lipopeptide surfactants and their dependence on g proteins. Appl. Environ. Microbiol. 2009, 75, 4950–4957. [Google Scholar] [CrossRef]
- Saini, H.S.; Barragan-Huerta, B.E.; Lebron-Paler, A.; Pemberton, J.E.; Vazquez, R.R.; Burns, A.M.; Marron, M.T.; Seliga, C.J.; Gunatilaka, L.; Maier, R.M. Efficient purification of the biosurfactant viscosin from Pseudomonas libanesis strain M9-3 and its physicochemical and biological properties. J. Nat. Prod. 2008, 71, 1011–1015. [Google Scholar] [CrossRef] [PubMed]
- Cautain, B.; de Pedro, N.; Schulz, C.; Pascual, J.; Sousa, T.d.S.; Martin, J.; Perez-Victoria, I.; Asensio, F.; Gonzalez, I.; Bills, G.F.; et al. Identification of the lipodepsipeptide MDN-0066, a novel inhibitor of VHl/HIF pathway produced by a new Pseudomonas species. PLoS ONE 2015, 10, e0125221. [Google Scholar] [CrossRef] [PubMed]
- Pascual, J.; Garcia-Lopez, M.; Carmona, C.; Sousa Tda, S.; de Pedro, N.; Cautain, B.; Martin, J.; Vicente, F.; Reyes, F.; Bills, G.F.; et al. Pseudomonas soli sp. Nov., a novel producer of xantholysin congeners. Syst. Appl. Microbiol. 2014, 37, 412–416. [Google Scholar] [CrossRef] [PubMed]
- Geudens, N.; Martins, J.C. Cyclic lipodepsipeptides from Pseudomonas spp.–biological Swiss-army knives. Front. Microbiol. 2018, 9. [Google Scholar] [CrossRef] [PubMed]
- Raaijmakers, J.M.; De Bruijn, I.; Nybroe, O.; Ongena, M. Natural functions of lipopeptides from Bacillus and Pseudomonas. FEMS Microbiol. Rev. 2010, 34, 1037–1062. [Google Scholar] [CrossRef]
- Gross, H.; Loper, J.E. Genomics of secondary metabolite production by Pseudomonas spp. Nat. Prod. Rep. 2009, 26, 1408–1446. [Google Scholar] [CrossRef]
- Geudens, N.; Nasir, M.N.; Crowet, J.M.; Raaijmakers, J.M.; Feher, K.; Coenye, T.; Martins, J.C.; Lins, L.; Sinnaeve, D.; Deleu, M. Membrane interactions of natural cyclic lipodepsipeptides of the viscosin group. Biochim. Biophys. Acta Biomembr. 2017, 1859, 331–339. [Google Scholar] [CrossRef]
- De Vleeschouwer, M.; Sinnaeve, D.; Van den Begin, J.; Coenye, T.; Martins, J.C.; Madder, A. Rapid total synthesis of cyclic lipodepsipeptides as a premise to investigate their self-assembly and biological activity. Chem. Eur. J. 2014, 20, 7766–7775. [Google Scholar] [CrossRef]
- Andolfi, A.; Cimmino, A.; Lo Cantore, P.; Lacobellis, N.S.; Evidente, A. Bioactive and structural metabolites of Pseudomonas and Burkholderia species causal agents of cultivated mushrooms diseases. Perspect. Med. Chem. 2008, 2, 81–112. [Google Scholar] [CrossRef] [PubMed]
- Lo Cantore, P.; Lazzaroni, S.; Coraiola, M.; Dalla Serra, M.; Cafarchia, C.; Evidente, A.; Iacobellis, N.S. Biological characterization of white line-inducing principle (WLIP) produced by Pseudomonas reactans NCPPB1311. Mol. Plant Microbe Interact. 2006, 19, 1113–1120. [Google Scholar] [CrossRef] [PubMed]
- Geudens, N.; De Vleeschouwer, M.; Feher, K.; Rokni-Zadeh, H.; Ghequire, M.G.; Madder, A.; De Mot, R.; Martins, J.C.; Sinnaeve, D. Impact of a stereocentre inversion in cyclic lipodepsipeptides from the viscosin group: A comparative study of the viscosinamide and pseudodesmin conformation and self-assembly. ChemBioChem 2014, 15, 2736–2746. [Google Scholar] [CrossRef] [PubMed]
- Sinnaeve, D.; Hendrickx, P.M.; Van Hemel, J.; Peys, E.; Kieffer, B.; Martins, J. The solution structure and self-association properties of the cyclic lipodepsipeptide pseudodesmin a support its pore-forming potential. Chem. Eur. J. 2009, 15, 12653–12662. [Google Scholar] [CrossRef] [PubMed]
- Han, F. Structure of the white-line-inducing principle isolated from Pseudomonas reactans. Acta Crystallogr. 1992, C48, 1965–1968. [Google Scholar] [CrossRef]
- Quail, J.W.; Ismail, N.; Soledade, M.; Pedras, C.; Boyetchko, S.M. Pseudophomins A and B, a class of cyclic lipodepsipeptides isolated from a Pseudomonas species. Acta Crystallogr. C 2002, 58, 268–271. [Google Scholar] [CrossRef] [PubMed]
- Beswick, V.; Guerois, R.; Cordier-Ochsenbein, F.; Coïc, Y.-M.; Huynh-Dinh, T.; Tostain, J.; Noël, J.-P.; Sanson, A.; Neumann, J.-M. Dodecylphosphocholine micelles as a membrane-like environment: New results from NMR relaxation and paramagnetic relaxation enhancement analysis. Eur. Biophys. J. 1998, 28, 48–58. [Google Scholar] [CrossRef]
- Kallick, D.A.; Tessmer, M.R.; Watts, C.R.; Li, C.Y. The use of dodecylphosphocholine micelles in solution NMR. J. Magn. Reson. Ser. B 1995, 109, 60–65. [Google Scholar] [CrossRef]
- Vogel, H.J.; Arias, M.; Aramini, J.M.; Paul, S.; Liu, Z.; Ishida, H. Characterization of antimicrobial and host-defense peptides by NMR spectroscopy. In Modern magnetic resonance; Webb, G.A., Ed.; Springer International Publishing: Cham, Switzerland, 2017; pp. 1–25. [Google Scholar]
- Grzesiek, S.; Cordier, F.; Jaravine, V.; Barfield, M. Insights into biomolecular hydrogen bonds from hydrogen bond scalar couplings. Progr. Nucl. Magn. Reson. Spectros. 2004, 45, 275–300. [Google Scholar] [CrossRef]
- Lauterwein, J.; Bösch, C.; Brown, L.R.; Wüthrich, K. Physicochemical studies of the protein-lipid interactions in melittin-containing micelles. Biochim. Biophys. Acta 1979, 556, 244–264. [Google Scholar] [CrossRef]
- Johnson, C.S., Jr. Diffusion ordered nuclear magnetic resonance spectroscopy: Principles and applications. Progr. Nucl. Magn. Reson. Spectros. 1999, 34, 203–256. [Google Scholar] [CrossRef]
- Sabatino, P.; Choudhury, R.P.; Schönhoff, M.; Van der Meeren, P.; Martins, J.C. Nmr investigation of exchange dynamics and binding of phenol and phenolate in dodac vesicular dispersions. J. Phys. Chem. B 2012, 116, 9269–9276. [Google Scholar] [CrossRef]
- Andersson, A.; Almqvist, J.; Hagn, F.; Maler, L. Diffusion and dynamics of penetratin in different membrane mimicking media. Biochim. Biophys. Acta Biomembr. 2004, 1661, 18–25. [Google Scholar] [CrossRef] [PubMed] [Green Version]
- Maler, L. Solution NMR studies of peptide-lipid interactions in model membranes. Mol. Membr. Biol. 2012, 29, 155–176. [Google Scholar] [CrossRef] [PubMed]
- Karplus, M. Vicinal proton coupling in nuclear magnetic resonance. J. Am. Chem. Soc. 1963, 85, 2870–2871. [Google Scholar] [CrossRef]
- Karplus, M. Contact electron-spin coupling of nuclear magnetic moments. J. Chem. Phys. 1959, 30, 11–15. [Google Scholar] [CrossRef]
- Bystrov, V.F. Spin-spin coupling and the conformational states of peptide systems. Prog. Nucl. Magn. Reson. Spectrosc. 1976, 10, 41–82. [Google Scholar] [CrossRef]
- Cavanagh, J.; Fairbrother, W.J.; Palmer, A.G.; Rance, M.; Skelton, N.J. Larger proteins and molecular interactions. In Protein NMR Spectroscopy, 2nd ed.; Cavanagh, J., Fairbrother, W.J., Palmer, A.G., Rance, M., Skelton, N.J., Eds.; Academic Press: Burlington, MA, USA, 2007. [Google Scholar]
- Marion, D. An introduction to biological NMR spectroscopy. Mol. Cell. Proteom. 2013, 12, 3006–3025. [Google Scholar] [CrossRef]
- Vuister, G.W.; Bax, A. Quantitative j correlations: A new approach for measuring homonuclear three-bond J(HnH coupling constants in 15N-enriched proteins. J. Am. Chem. Soc. 1993, 115, 7772–7777. [Google Scholar] [CrossRef]
- Wang, A.C.; Bax, A. Determination of the backbone dihedral angles φ in human ubiquitin from reparametrized empirical Karplus equations. J. Am. Chem. Soc. 1996, 118, 2483–2494. [Google Scholar] [CrossRef]
- Cordier, F.; Nisius, L.; Dingley, A.J.; Grzesiek, S. Direct detection of N-H O=C hydrogen bonds in biomolecules by NMR spectroscopy. Nat. Protoc. 2008, 3, 235–241. [Google Scholar] [CrossRef] [PubMed]
- Cordier, F.; Grzesiek, S. Direct observation of hydrogen bonds in proteins by interresidue 3hJnc’ scalar couplings. J. Am. Chem. Soc. 1999, 121, 1601–1602. [Google Scholar] [CrossRef]
- Schrank, E.; Wagner, G.E.; Zangger, K. Solution NMR studies on the orientation of membrane-bound peptides and proteins by paramagnetic probes. Molecules 2013, 18, 7407–7435. [Google Scholar] [CrossRef]
- Bertini, I.; Luchinat, C.; Parigi, G. Solution NMR of Paramagnetic Molecules; Elsevier Science: Amsterdam, The Netherlands, 2001; Volume 1. [Google Scholar]
- Hollmann, A.; Martinez, M.; Maturana, P.; Semorile, L.C.; Maffia, P.C. Antimicrobial peptides: Interaction with model and biological membranes and synergism with chemical antibiotics. Front. Chem. 2018, 6. [Google Scholar] [CrossRef] [PubMed]
- Hollmann, A.; Martínez, M.; Noguera, M.E.; Augusto, M.T.; Disalvo, A.; Santos, N.C.; Semorile, L.; Maffía, P.C. Role of amphipathicity and hydrophobicity in the balance between hemolysis and peptide–membrane interactions of three related antimicrobial peptides. Colloids Surf. B Biointerfaces 2016, 141, 528–536. [Google Scholar] [CrossRef] [PubMed]
- Jerschow, A.; Müller, N. Suppression of convection artifacts in stimulated-echo diffusion experiments: Double-stimulated-echo experiments. J. Magn. Reson. 1997, 125, 372–375. [Google Scholar] [CrossRef]
- Connell, M.A.; Bowyer, P.J.; Adam Bone, P.; Davis, A.L.; Swanson, A.G.; Nilsson, M.; Morris, G.A. Improving the accuracy of pulsed field gradient nmr diffusion experiments: Correction for gradient non-uniformity. J. Magn. Reson. 2009, 198, 121–131. [Google Scholar] [CrossRef]
- Sinnaeve, D. The Stejskal–Tanner equation generalized for any gradient shape—An overview of most pulse sequences measuring free diffusion. Concepts Magn. Reson. Part A 2012, 40A, 39–65. [Google Scholar] [CrossRef]
- Abel, S.; Dupradeau, F.-Y.; Marchi, M. Molecular dynamics simulations of a characteristic DPC micelle in water. J. Chem. Theory Comput. 2012, 8, 4610–4623. [Google Scholar] [CrossRef]
- Dickson, C.J.; Madej, B.D.; Skjevik, Å.A.; Betz, R.M.; Teigen, K.; Gould, I.R.; Walker, R.C. Lipid14: The Amber lipid force field. J. Chem. Theory Comput. 2014, 10, 865–879. [Google Scholar] [CrossRef]
- Ryckaert, J.-P.; Ciccotti, G.; Berendsen, H.J.C. Numerical integration of the cartesian equations of motion of a system with constraints: Molecular dynamics of n-alkanes. J. Comput. Phys. 1977, 23, 327–341. [Google Scholar] [CrossRef]
- Götze, S.; Herbst-Irmer, R.; Klapper, M.; Görls, H.; Schneider, K.R.A.; Barnett, R.; Burks, T.; Neu, U.; Stallforth, P. Structure, biosynthesis, and biological activity of the cyclic lipopeptide anikasin. ACS Chem. Biol. 2017, 12, 2498–2502. [Google Scholar] [CrossRef] [PubMed]
- Humphrey, W.; Dalke, A.; Schulten, K. VMD: Visual molecular dynamics. J. Mol. Graph. 1994, 14, 33–38. [Google Scholar] [CrossRef]
- Roe, D.R.; Cheatham, T.E. Ptraj and cpptraj: Software for processing and analysis of molecular dynamics trajectory data. J. Chem. Theory Comput. 2013, 9, 3084–3095. [Google Scholar] [CrossRef] [PubMed]
- Ester, M.; Kriegel, H.-P.; Sander, J.; Xu, X. A density-based algorithm for discovering clusters a density-based algorithm for discovering clusters in large spatial databases with noise. In Proceedings of the Second International Conference on Knowledge Discovery and Data Mining; AAAI Press: Portland, OR, USA, 1996; pp. 226–231. [Google Scholar]
- Reißer, S.; Strandberg, E.; Steinbrecher, T.; Ulrich, A.S. 3D hydrophobic moment vectors as a tool to characterize the surface polarity of amphiphilic peptides. Biophys. J. 2014, 106, 2385–2394. [Google Scholar] [CrossRef] [PubMed]
Sample Availability: Samples of viscosinamide as well as a pdb file representing the structure of viscosinamide in acetonitrile and inserted in a DPC micelle, allowing their rendering and manipulation in 3D space using most of the commercial and freely available software are available upon simple request from the authors. |


| Amino Acid | 3JHNHA * in Acetonitrile | 3JHNHA * in DPC Solution | HNHA Δ3JHNHA [Hz] | Calculated φ a | |||
|---|---|---|---|---|---|---|---|
| 1D 1H [Hz] | HNHA [Hz] | HNHA [Hz] | φACN [°] | φDPC [°] | Δ [°] | ||
| l-Leu1 | 5.8 | 6.1 | 6.6 | 0.5 | 33.3 | 39.8 | 6.5 |
| d-Gln2 | 4.2 | 4.4 | 3.9 | −0.5 | 61.8 | 57.6 | −4.2 |
| d-aThr3 | 7.6 | 7.5 | 7.6 | 0.1 | 84.9 | 85.3 | 0.38 |
| d-Val4 | 5.9 | 5.9 | 5.7 | −0.2 | 73.0 | 71.7 | −1.4 |
| l-Leu5 | 6.7 | 6.7 | 6.5 | −0.2 | 78.2 | 80.8 | 2.6 |
| d-Ser6 | 8.4 | 8.3 | 8.5 | 0.2 | 91.1 | 93.1 | 2.0 |
| l-Leu7 | 5.9 | 5.9 | 5.8 | −0.1 | −72.7 | −72.4 | 0.35 |
| d-Ser8 | 9.0 | 8.8 | 9.0 | 0.1 | 96.3 | 97.5 | 1.2 |
| l-Ile9 | 10.2 | 10.2 | 10.1 | −0.1 | x | x | x |
© 2019 by the authors. Licensee MDPI, Basel, Switzerland. This article is an open access article distributed under the terms and conditions of the Creative Commons Attribution (CC BY) license (http://creativecommons.org/licenses/by/4.0/).
Share and Cite
Geudens, N.; Kovács, B.; Sinnaeve, D.; Oni, F.E.; Höfte, M.; Martins, J.C. Conformation and Dynamics of the Cyclic Lipopeptide Viscosinamide at the Water-Lipid Interface. Molecules 2019, 24, 2257. https://doi.org/10.3390/molecules24122257
Geudens N, Kovács B, Sinnaeve D, Oni FE, Höfte M, Martins JC. Conformation and Dynamics of the Cyclic Lipopeptide Viscosinamide at the Water-Lipid Interface. Molecules. 2019; 24(12):2257. https://doi.org/10.3390/molecules24122257
Chicago/Turabian StyleGeudens, Niels, Benjámin Kovács, Davy Sinnaeve, Feyisara Eyiwumi Oni, Monica Höfte, and José C. Martins. 2019. "Conformation and Dynamics of the Cyclic Lipopeptide Viscosinamide at the Water-Lipid Interface" Molecules 24, no. 12: 2257. https://doi.org/10.3390/molecules24122257