Comparison of Multiple Bioactive Constituents in the Flower and the Caulis of Lonicera japonica Based on UFLC-QTRAP-MS/MS Combined with Multivariate Statistical Analysis

 ,
,
Abstract
:1. Introduction
2. Results
2.1. Optimization of Extraction Conditions
2.2. Optimization of UFLC Conditions
2.3. Optimization of MS Conditions
2.4. Analytical Method Validation
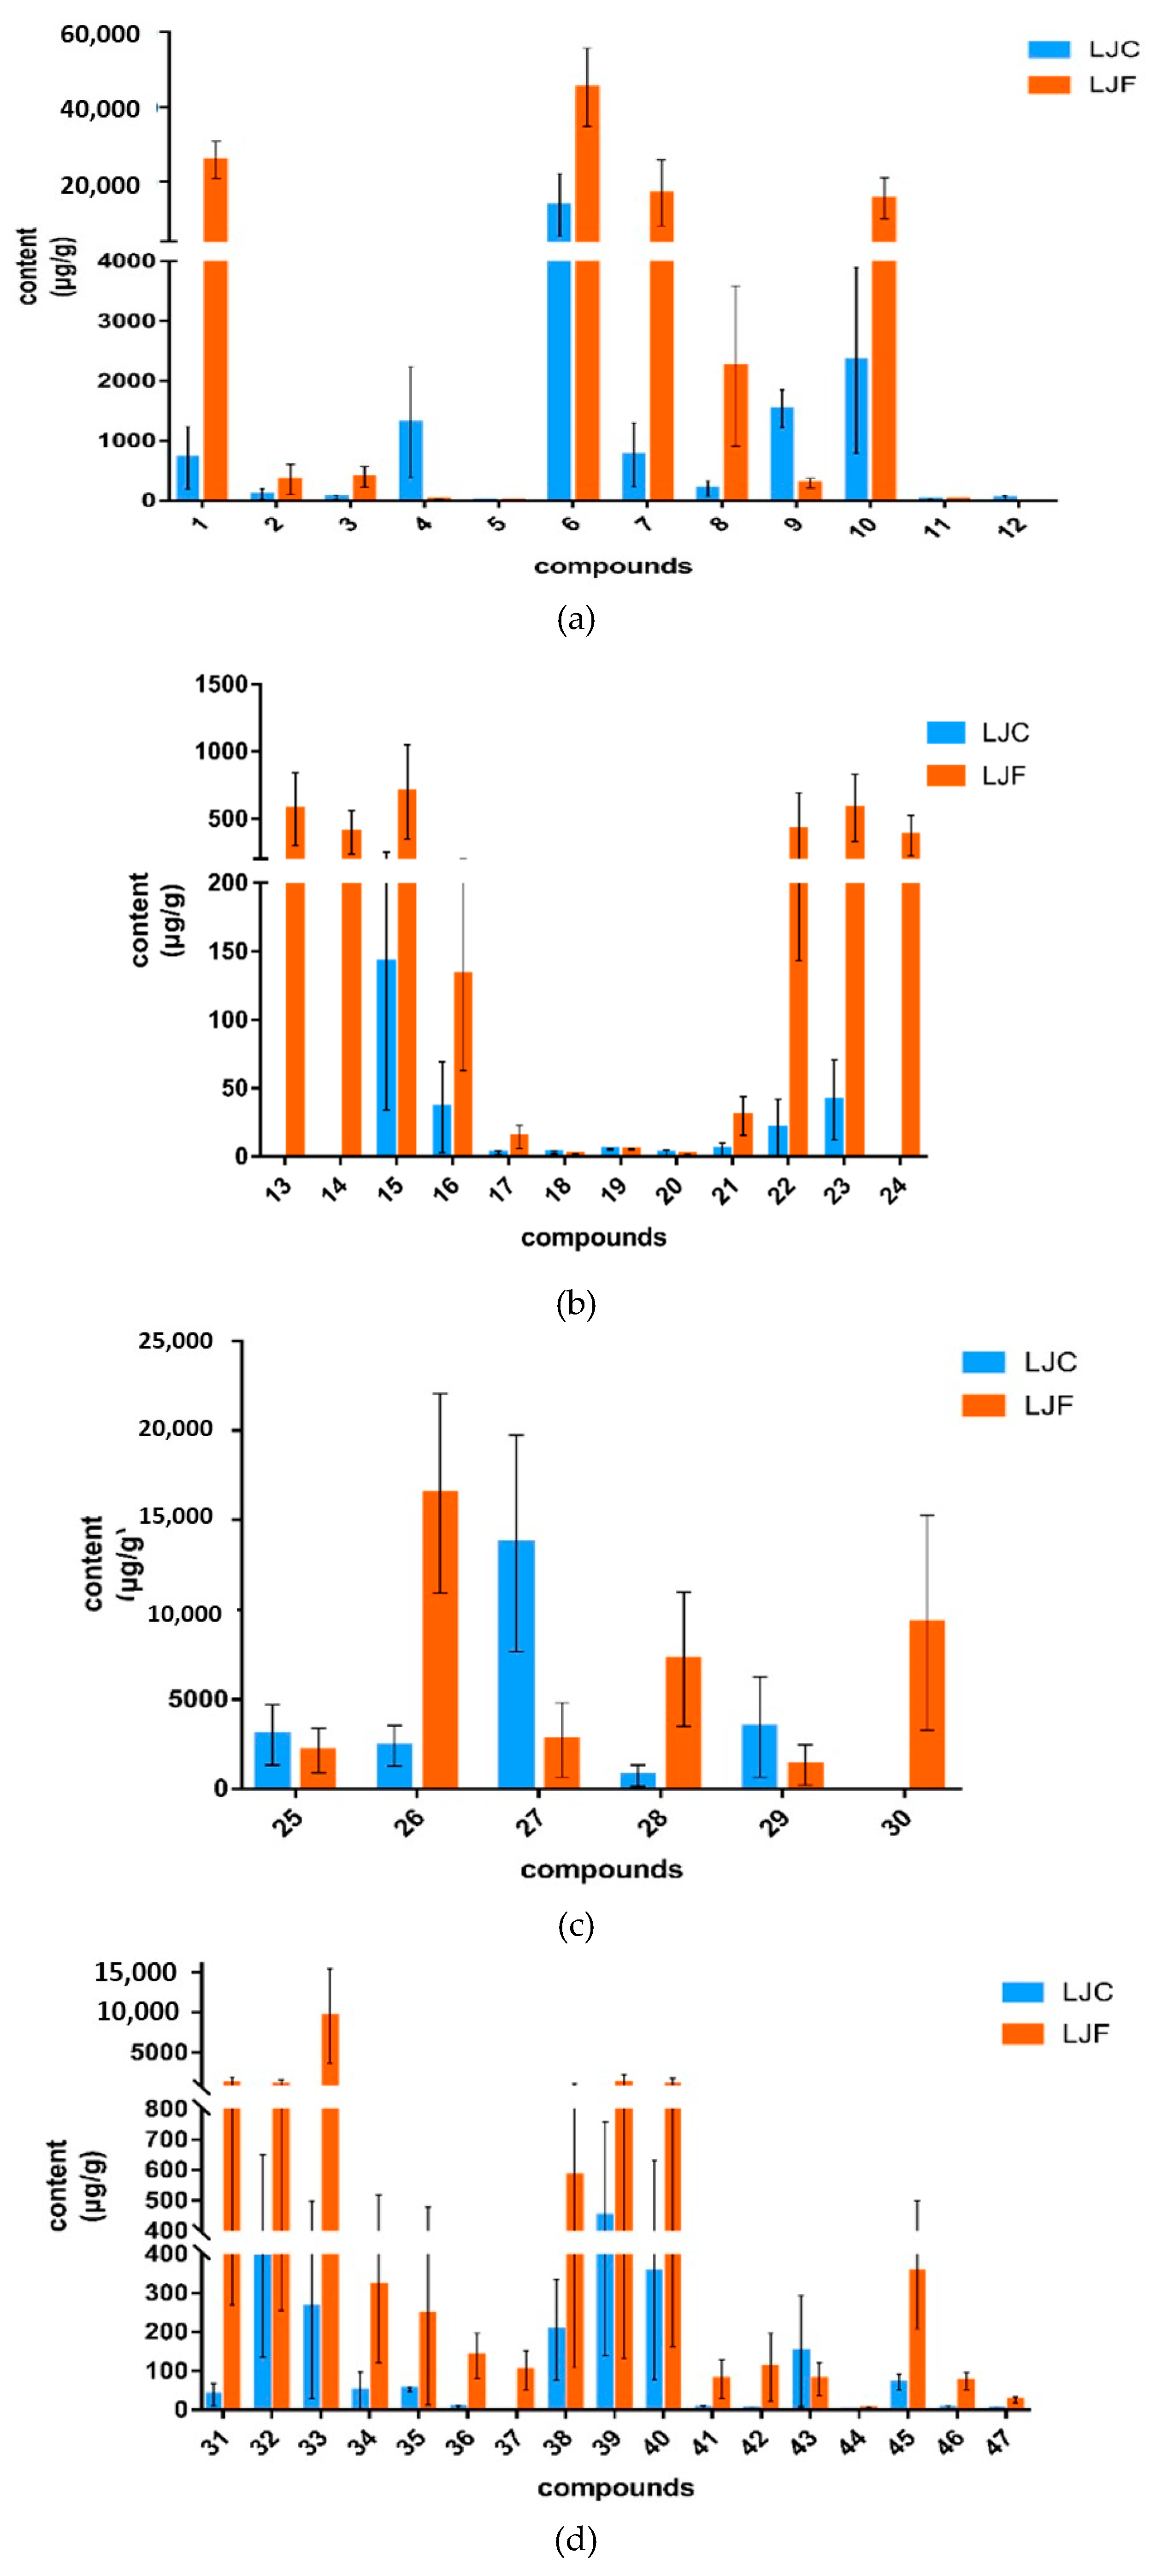
2.5. Quantitative Analysis of Samples
2.6. PCA of Samples
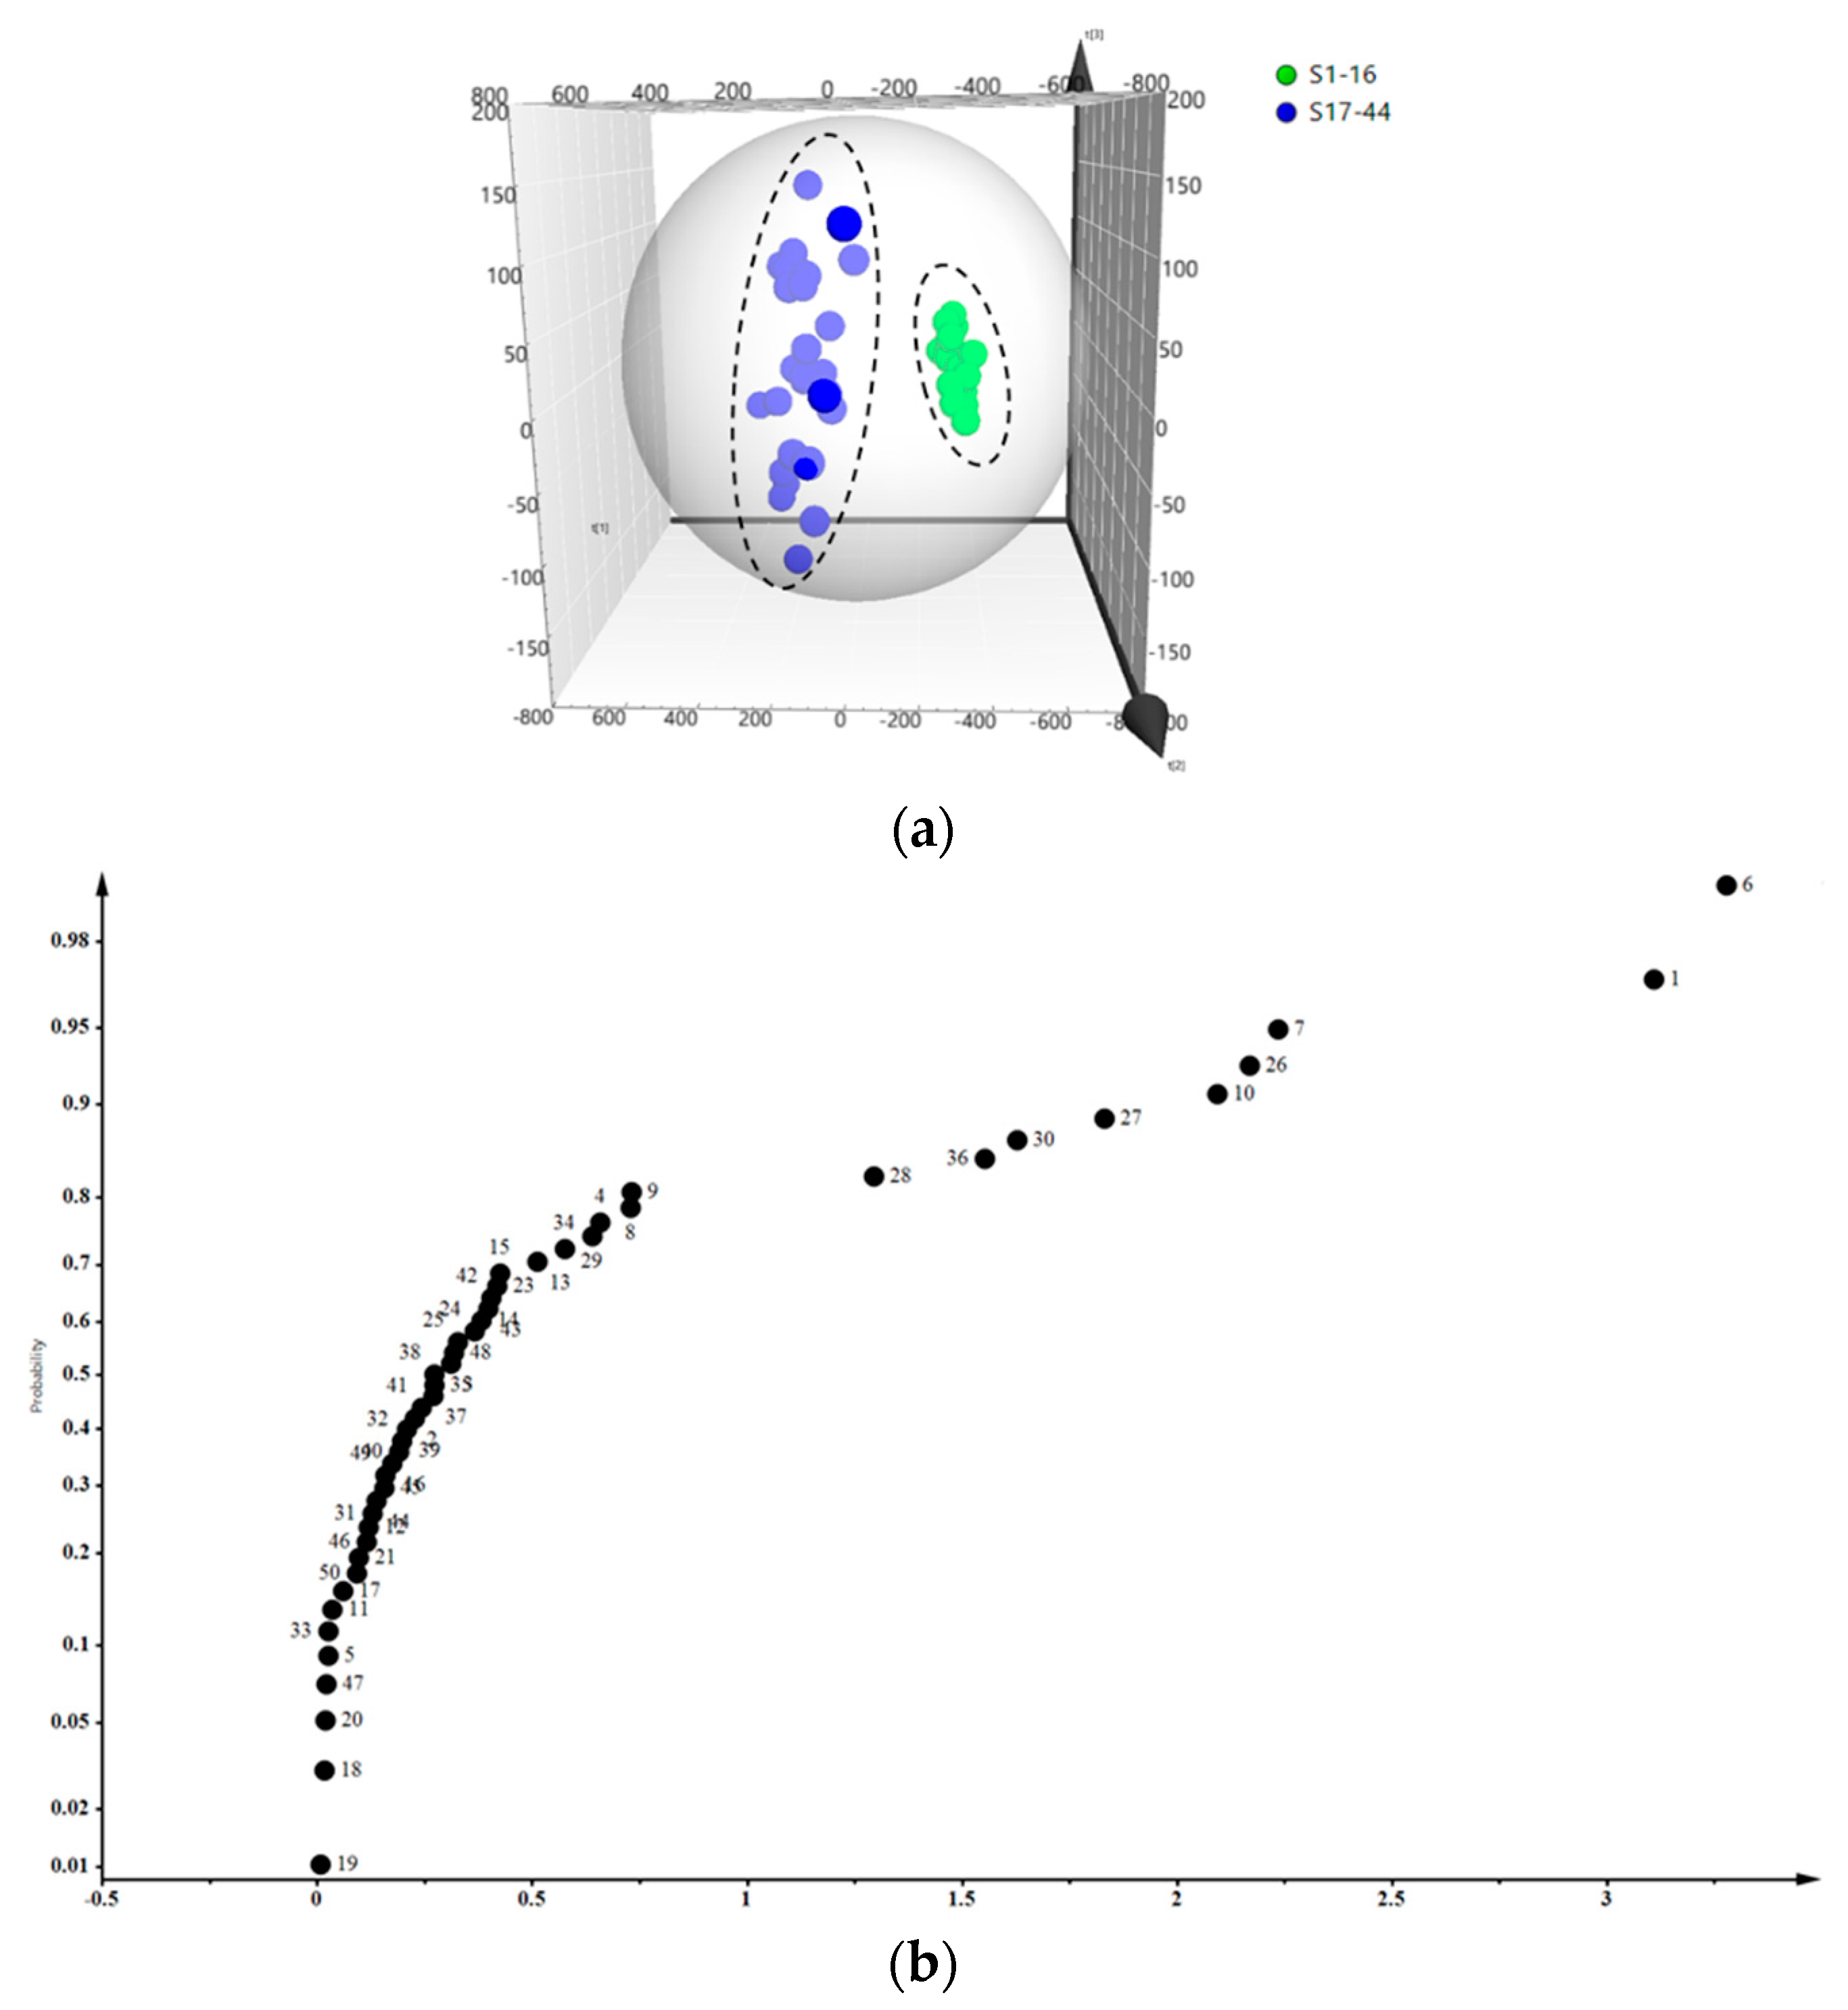
2.7. PLS-DA of the Samples
2.8. t-test of Samples
3. Discussion
4. Materials and Methods
4.1. Plant Materials
4.2. Chemicals and Reagents
4.3. Preparation of Sample Solutions
4.4. Preparation of Standard Solutions
4.5. UFLC-QTRAP-MS/MS Instrumentation and Conditions
4.6. Validation of UFLC-QTRAP-MS/MS Method
4.7. Multivarite Statistical Analysis
5. Conclusions
Supplementary Materials
Author Contributions
Funding
Conflicts of Interest
References
- Lee, S.J.; Shin, E.J.; Son, K.H.; Chang, H.W.; Kang, S.S.; Kim, H.P. Anti-inflammatory activity of the major constituents of Lonicera japonica. Arch. Pharm. Res. 1995, 18, 133–135. [Google Scholar] [CrossRef]
- Sato, Y.K.; Itagaki, S.; Kurokawa, T.; Jiro, O.; Masaki, K.; Takeshi, H.; Mitsuru, S.; Ken, I. In vitro and in vivo antioxidant properties of chlorogenic acid and caffeic acid. Int. J. Pharmaceut. 2011, 403, 136–138. [Google Scholar] [CrossRef] [PubMed]
- Chagas-Paula, D.A.; Oliveira, R.B.; da Silva, V.C.; Gobbo-Neto, L.; Gasparoto, T.H.; Campanelli, A.P.; Faccioli, L.H.; Da Costa, F.B. Chlorogenic acids from Tithonia diversifolia demonstrate better anti-inflammatory effect than indomethacin and its sesquiterpene lactones. J. Ethnopharmacol. 2011, 136, 355–362. [Google Scholar] [CrossRef] [PubMed] [Green Version]
- Tang, Y.; Yin, L.; Zhang, Y.; Huang, X.; Cui, X.B.; Xu, L. Study on anti-inflammatory efficacy and correlative ingredients with pharmacodynamics detected in acute inflammation rat model serum from Caulis Lonicerae japonicae. Phytomedicine. 2016, 23, 597–610. [Google Scholar] [CrossRef]
- Holiman, P.C.H.; Hertog, M.G.L.; Katan, M.B. Analysis and health effects of flavonoids. Food Chem. 1996, 57, 43–46. [Google Scholar]
- Sun, C.H.; Teng, Y.; Li, G.Z. Metabonomics study of the protective effects of Lonicera japonica extraction acute liver injury in dimethyl nitrosamine treated rats. J. Pharm. Biomed. Anal. 2010, 53, 98–102. [Google Scholar] [CrossRef] [PubMed]
- Müştak, H.K.; Torun, E.; Özen, D.; Yücel, G.; Akan, M.; Diker, K.S. Effect of Lonicera japonica extract on Mycoplasma gallisepticum in naturally infected broiler flocks. Brit. Poultry Sci. 2015, 56, 299–303. [Google Scholar] [CrossRef] [PubMed]
- Ding, Y.; Cao, Z.; Cao, L.; Ding, G.; Wang, Z.; Xiao, W. Antiviral activity of chlorogenic acid against influenza A (H1N1/H3N2) virus and its inhibition of neuraminidase. Sci. Rep. 2017, 7, 45723. [Google Scholar] [CrossRef] [Green Version]
- Park, K.I.; Park, H.; Nagappan, A.; Hong, G.E.; Yumnam, S.; Lee, H.J.; Kim, E.H.; Lee, W.S.; Shin, S.C.; Kim, J.A.; et al. Polyphenolic compounds from Korean Lonicera japonica Thunb. induces apoptosis via Akt and caspase cascade activation in A549 cells. Oncol. Lett. 2017, 13, 2521–2530. [Google Scholar] [CrossRef]
- Zhou, X.; Dong, Q.; Kan, X.; Peng, L.; Xu, X.; Fang, Y.; Yang, J. Immunomodulatory activity of a novel polysaccharide from Lonicera japonica in immunosuppressed mice induced by cyclophosphamide. PLoS ONE 2018, 13, e0204152. [Google Scholar] [CrossRef]
- Liang, X.M.; Yu, J.N.; Wang, Y.P.; Jin, G.W.; Fu, Q.; Xiao, Y.S. Qualitative and quantitative analysis in quality control of traditional Chinese medicines. J. Chromatography A. 2009, 1216, 2033–2044. [Google Scholar] [CrossRef]
- Zhang, Y.D.; Huang, X.; Zhao, F.L.; Tang, Y.L.; Yin, L. Study on the chemical markers of Caulis Lonicerae japonicae for quality control by HPLC-QTOF/MS/MS and chromatographic fingerprints combined with chemometrics methods. Anal. Methods. 2015, 7, 2064. [Google Scholar] [CrossRef]
- Gao, W.; Wang, R.; Li, D.; Liu, K.; Chen, J.; Li, H.J.; Xu, X.J.; Li, P.; Yang, H. Comparison of five Lonicera flowers by simultaneous determination of multi-components with single reference standard method and principal component analysis. J. Pharm. Biomed. Anal. 2016, 117, 345–351. [Google Scholar] [CrossRef] [PubMed]
- Seo, O.N.; Kim, G.S.; Park, S.; Lee, J.H.; Kim, Y.H.; Lee, W.S.; Lee, S.J.; Kim, C.Y.; Jin, J.S.; Choi, S.K.; et al. Determination of polyphenol components of Lonicera japonica Thunb. using liquid chromatography–tandem mass spectrometry: Contribution to the overall antioxidant activity. Food Chem. 2012, 134, 572–577. [Google Scholar] [CrossRef]
- Cai, H.; Cao, G.; Li, L.; Liu, X.; Ma, X.Q.; Tu, S.C.; Lou, Y.J.; Qin, K.M.; Li, S.L.; Cai, B.C. Profiling and Characterization of Volatile Components from Non-Fumigated and Sulfur-Fumigated Flos Lonicerae Japonicae Using Comprehensive Two-Dimensional Gas Chromatography Time-of-Flight Mass Spectrometry Coupled with Chemical Group Separation. Molecules 2013, 18, 1368–1382. [Google Scholar] [CrossRef] [PubMed] [Green Version]
- Shang, X.F.; Hu, P.N.; Li, M.X. Lonicera japonica Thunb.: thnopharmacology, phytochemistry and pharmacology of an important traditional Chinese medicine. J. Ethnopharmacol. 2011, 138, 1–21. [Google Scholar] [CrossRef]
- Wang, L.N.; Jiang, Q.; Hu, J.H.; Zhang, Y.Q.; Li, J. Research Progress on Chemical Constituents of Lonicerae japonicae flos. BioMed Res. Int. 2016, 2016. [Google Scholar] [CrossRef]
- Li, Y.; Cai, W.; Weng, X.; Li, Q.; Wang, Y.; Chen, Y.; Wang, H. Lonicerae Japonicae Flos and Lonicerae Flos: A systematic pharmacology review. Evid. Based Compl. Alt. 2015, 2015, 16. [Google Scholar] [CrossRef]
- Wang, C.; Wang, G.; Liu, H.; Hou, Y.L. Protective effect of bioactive compounds from Lonicera japonica Thunb. against H2O2-induced cytotoxicity using neonatal rat cardiomyocytes. Iran J. Basic Med. Sci. 2016, 19, 97–105. [Google Scholar]
- Yip, E.C.H.; Chan, A.S.L.; Pang, H.; Tam, Y.K.; Wong, Y.H.L.; Pang, H.; Tam, Y.K.; Wong, Y.H. Protocatechuic acid induces cell death in HepG2 hepatocellular carcinoma cells through a c-Jun N-terminal kinase-dependent mechanism. Cell Biol. Toxicol. 2006, 22, 293. [Google Scholar] [CrossRef]
- Chang, W.C.; Hsu, F.L. Inhibition of platelet activation and endothelial cell injury by polyphenolic compounds isolated from Lonicera japonica Thunb. PLEFA 1992, 45, 307–312. [Google Scholar] [CrossRef]
- Rawji, K.S.; Mishra, M.K.; Michaels, N.J.; Rivest, S.; Stys, P.K.; Yong, W. Immunosenescence of microglia and macrophages: impact on the ageing central nervous system. Brain 2016, 139, 653–661. [Google Scholar] [CrossRef] [Green Version]
- Kwon, S.H.; Kim, J.A.; Hong, S.I.; Jung, Y.H.; Kim, H.C.; Lee, S.Y.; Jang, C.G. Loganin protects against hydrogen peroxide-induced apoptosis by inhibiting phosphorylation of JNK, p38, and ERK 1 /2 MAPKs in SH-SY5Y cells. Neurochem. Int. 2011, 58, 533–541. [Google Scholar] [CrossRef]
- Yuan, Y.; Song, L.P.; Li, M.H.; Liu, G.M.; Chu, Y.N.; Ma, L.Y.; Zhou, Y.Y.; Wang, X.; Gao, W.; Qin, S.S.; et al. Genetic variation and metabolic pathway intricacy govern the active compound content and quality of the Chinese medicinal plant Lonicera japonica thumb. BMC Genom. 2012, 13, 195–212. [Google Scholar] [CrossRef] [PubMed]
- Chen, C.H.; Liu, Z.X.; Zou, L.S.; Liu, X.H.; Chai, C.; Zhao, H.; Yan, Y.; Wang, C.C. Quality Evaluation of Apocyni Veneti Folium from Different Habitats and Commercial Herbs Based on Simultaneous Determination of Multiple Bioactive Constituents Combined with Multivariate Statistical Analysis. Molecules 2018, 23, 573. [Google Scholar] [CrossRef]
- Yan, Y.; Zhao, H.; Chen, C.H.; Zou, L.S.; Liu, X.H.; Chai, C.; Wang, C.C.; Shi, J.J.; Chen, S.Y. Comparison of Multiple Bioactive Constituents in Different Parts of Eucommia ulmoides Based on UFLC-QTRAP-MS/MS Combined with PCA. Molecules 2018, 23, 643. [Google Scholar]
- Wang, C.C.; Cai, H.; Zhao, H.; Yan, Y.; Shi, J.J.; Chen, S.Y.; Tan, M.X.; Chen, J.L.; Zou, L.S.; Chen, C.H.; et al. Distribution patterns for metabolites in medicinal parts of wild and cultivated licorice. J. Pharm. Biomed. Anal. 2018, 161, 464–473. [Google Scholar] [CrossRef]
- Naveed, M.; Hejazi, V.; Abbas, M.; Kamboh, A.A.; Khan, G.J.; Shumzaid, M.; Wen Hua, L. Chlorogenic acid (CGA): A pharmacological review and call for further research. Biomed. Pharmacothe. 2018, 97, 67–74. [Google Scholar] [CrossRef]
- Niggeweg, R.; Michael, A.J.; Martin, C. Engineering plants with increased levels of the antioxidant chlorogenic acid. Nature Biotechnol. 2004, 22, 746–754. [Google Scholar] [CrossRef]
Sample Availability: Samples of all compounds are available from the authors. |


| No. | Name | Formula | (tR) (min) | [M + H]+ m/z | [M − H]− m/z | MRM (Precursor→Product) | DP/V | CE/V |
|---|---|---|---|---|---|---|---|---|
| 1 | Isochlorogenic acid A | C25H24O12 | 20.15 | - | 515.45 | 515.1/191 | −85 | −22 |
| 2 | Isochlorogenic acid B | C25H24O12 | 20.13 | - | 515.45 | 514.989/353 | −80 | −26 |
| 3 | Isochlorogenic acid C | C25H24O12 | 20.27 | - | 515.45 | 515.1/191 | −75 | −24 |
| 4 | 1,3-O-dicaffeoylquinic acid | C25H24O12 | 20.30 | - | 515.45 | 514.980/190.979 | −95 | −24 |
| 5 | 4,5-O-dicaffeoylquinic acid methyl ester | C26H26O12 | 29.50 | - | 529.47 | 529.194/135.001 | −85 | −42 |
| 6 | Chlorogenic acid | C16H18O9 | 18.75 | - | 353.31 | 305.01/125 | −35 | −20 |
| 7 | Neochlorogenic acid | C16H18O9 | 17.64 | - | 353.31 | 305.01/125 | −80 | −26 |
| 8 | Cryptochlorogenic acid | C16H18O9 | 19.86 | - | 353.31 | 305.01/125 | −95 | −20 |
| 9 | Caffeic acid | C9H8O4 | 19.45 | - | 179.16 | 179.03/134.6 | −125 | −20 |
| 10 | Quinic acid | C7H12O6 | 18.75 | - | 191.17 | 191.099/84.981 | −195 | −28 |
| 11 | Protocatechuic acid | C7H6O4 | 12.99 | - | 153.12 | 152.9/109 | −85 | −16 |
| 12 | Ferulic acid | C10H10O4 | 23.89 | - | 193.18 | 193.017/134 | −50 | −10 |
| 13 | Rutin | C27H30O16 | 22.06 | - | 609.52 | 609.06/300 | −245 | −46 |
| 14 | Hyperoside | C21H20O12 | 22.74 | - | 463.38 | 463.003/299.9 | −160 | −36 |
| 15 | Luteoloside | C21H20O11 | 23.03 | - | 447.38 | 447.117/284.963 | −300 | −36 |
| 16 | Luteolin | C15H10O6 | 29.53 | - | 285.24 | 285.086/132.980 | −170 | −40 |
| 17 | Rhoifolin | C27H30O14 | 24.82 | - | 577.52 | 577.185/268.958 | −65 | −46 |
| 18 | Diosmetin | C16H12O6 | 30.88 | - | 299.26 | 298.938/283.929 | −215 | −30 |
| 19 | Apigenin | C15H10O5 | 30.74 | - | 269.24 | 268.8/116.9 | −129 | −40 |
| 20 | Kaempferol | C15H10O6 | 30.88 | - | 285.24 | 285.0/116.9 | −120 | −36 |
| 21 | Astragalin | C21H20O11 | 24.40 | - | 447.38 | 447.1/283.9 | −100 | −36 |
| 22 | Lonicerin | C27H30O15 | 23 | - | 593.52 | 593.146/283.984 | −200 | −54 |
| 23 | Kaempferol-3-O-rutinoside | C27H30O15 | 23.59 | 595.5 | - | 595/287.2 | 36 | 25 |
| 24 | Isoquercitrin | C21H20O12 | 22.50 | - | 464.38 | 463.015/300 | −180 | −36 |
| 25 | Sweroside | C16H22O9 | 20.14 | - | 358.34 | 357.213/124.985 | −65 | −20 |
| 26 | Secologanic acid | C16H22O10 | 19.17 | - | 376.36 | 357.107/212.956 | −170 | −22 |
| 27 | Loganin | C17H26O10 | 19.72 | - | 390.38 | 389.262/226.980 | −40 | −12 |
| 28 | Secoxyloganin | C17H24O11 | 21.10 | - | 404.37 | 403.219/120.973 | −135 | −32 |
| 29 | Loganin acid | C16H24O10 | 18.07 | - | 376.36 | 375.107/212.956 | −170 | −22 |
| 30 | Morroniside | C17H26O11 | 18.53 | - | 406.38 | 405.235/243 | −100 | −14 |
| 31 | l-Alanine | C3H7NO2 | 1.38 | 90.09 | - | 90.06/44.02 | 100 | 10 |
| 32 | l-Serine | C3H7NO3 | 1.38 | 106.09 | - | 106.05/59.99 | 100 | 8 |
| 33 | l-Proline | C5H9NO2 | 1.65 | 116.13 | - | 116.07/70.02 | 68 | 10 |
| 34 | l-valine | C5H11NO2 | 2.32 | 118.15 | - | 118.09/72.06 | 100 | 10 |
| 35 | l-Threonine | C4H9NO3 | 1.38 | 120.12 | - | 120.07/74 | 100 | 20 |
| 36 | l-Isoleucine | C6H13NO2 | 4.96 | 132.17 | - | 132.1/86.05 | 64 | 10 |
| 37 | l-Leucine | C6H13NO2 | 5.40 | 132.17 | - | 132.1/86.05 | 100 | 16 |
| 38 | l-aspartic acid | C4H7NO4 | 1.38 | 134.10 | - | 134.05/87.96 | 59 | 10 |
| 39 | l-Glutamate | C5H7NO4 | 1.24 | 146.11 | - | 147.08/83.92 | 100 | 16 |
| 40 | l-lysine | C6H14N2O2 | 1.25 | 147.19 | - | 147.11/83.91 | 100 | 14 |
| 41 | l-Histidine | C6H9N3O2 | 1.24 | 156.15 | - | 156.08/110.03 | 100 | 16 |
| 42 | l-Phenylalanine | C9H11NO2 | 13 | 166.19 | - | 166.1/120.05 | 100 | 14 |
| 43 | l-Arginine | C6H14N4O2 | 1.36 | 175.20 | - | 175.12/70.02 | 100 | 18 |
| 44 | Cytidine | C9H13N3O5 | 1.65 | 244.22 | - | 244.09/112 | 61 | 10 |
| 45 | Uridine | C9H12N2O6 | 4.25 | 245.20 | - | 244.896/113 | 10 | 13 |
| 46 | Adenosine | C10H13N5O4 | 6.73 | 268.24 | - | 268.1/136.07 | 86 | 23 |
| 47 | Inosine | C10H12N4O5 | 9.62 | 269.22 | - | 269/137.07 | 46 | 15 |
| Name | Regression Equation | r | Linear Range (ng/mL) | LOD (ng/mL) | LOQ (ng/mL) | Precision | Repeatability | Stability | Recovery | ||
|---|---|---|---|---|---|---|---|---|---|---|---|
| Intra-Day (RSD%; n = 6) | Inter-Day (RSD%; n = 3) | (RSD %; n = 6) | (RSD%; n = 6) | Mean | RSD% | ||||||
| Isochlorogenic acid A | y = 1.02 × 10³x + 1.41 × 10⁵ | 0.9996 | 77.6–388,000 | 14.48 | 43.45 | 2.63 | 2.79 | 3.04 | 4.92 | 96.11 | 3.11 |
| Isochlorogenic acid B | y = 602x + 1.45 × 10⁵ | 0.9995 | 7.63–38,200 | 2.10 | 6.28 | 3.95 | 4.39 | 0.59 | 1.12 | 96.07 | 4.11 |
| Isochlorogenic acid C | y = 483x + 2.1 × 10⁴ | 0.9998 | 45–28,100 | 7.92 | 23.76 | 3.27 | 3.64 | 2.79 | 1.79 | 99.05 | 2.02 |
| 1,3-O-dicaffeoylquinic acid | y = 5.78 × 10³x + 5.62 × 10⁴ | 0.9996 | 42–2630 | 6.97 | 20.91 | 3.44 | 3.28 | 2.49 | 2.07 | 98.95 | 4.75 |
| 4,5-O-dicaffeoylquinic acid methyl ester | y = 9.67 × 10³x − 4.3 × 10⁴ | 0.9996 | 5.6–700 | 1.32 | 3.96 | 3.79 | 4.10 | 1.01 | 1.36 | 94.57 | 3.98 |
| Chlorogenic acid | y = 845x + 4.77 × 10⁵ | 0.9999 | 0.604–755,000 | 0.20 | 0.59 | 1.78 | 1.79 | 0.70 | 0.51 | 99.48 | 0.62 |
| Neochlorogenic acid | y = 115x + 1.13 × 10⁵ | 0.9992 | 3.01–376,000 | 0.39 | 1.16 | 1.83 | 1.71 | 1.77 | 4.55 | 98.25 | 1.70 |
| Cryptochlorogenic acid | y = 878x + 6.7 × 10³ | 0.9993 | 0.316–79,000 | 0.09 | 0.27 | 4.04 | 4.31 | 2.41 | 4.75 | 96.61 | 3.62 |
| Caffeic acid | y = 2.49 × 10³x + 1.69 × 10⁵ | 0.9998 | 5.76–7200 | 1.17 | 3.51 | 2.86 | 3.17 | 3.19 | 4.91 | 95.76 | 3.05 |
| Quinic acid | y = 1.19 × 10³x + 3.05 × 10⁵ | 0.9996 | 19.6–245,000 | 5.13 | 15.39 | 2.73 | 2.38 | 2.26 | 1.74 | 96.52 | 3.68 |
| Protocatechuic acid | y = 6.13 × 10³x + 1.95 × 10⁵ | 0.9994 | 7.68–960 | 0.78 | 2.34 | 2.50 | 2.30 | 1.46 | 3.31 | 96.71 | 4.02 |
| Ferulic acid | y = 121x + 3.68 × 10³ | 0.9990 | 11.2–1400 | 2.81 | 8.44 | 4.21 | 3.96 | 0.87 | 2.57 | 102.08 | 4.88 |
| Rutin | y = 2.5 × 10³x + 3.14 × 10⁵ | 0.9998 | 0.979–12,200 | 0.04 | 0.11 | 2.91 | 3.21 | 1.70 | 1.00 | 97.17 | 2.94 |
| Hyperoside | y = 4.32 × 10³x + 1.77 × 10⁵ | 0.9995 | 0.265–3313 | 0.06 | 0.17 | 1.69 | 1.55 | 4.12 | 2.50 | 96.67 | 4.07 |
| Luteoloside | y = 1.07 × 10³x + 1.34 × 10⁵ | 1.000 | 0.664–41,500 | 0.06 | 0.17 | 1.03 | 0.92 | 4.91 | 4.01 | 104.13 | 4.73 |
| Luteolin | y = 100x + 2.47 × 10³ | 0.9995 | 124–15,600 | 10.15 | 30.45 | 2.28 | 2.22 | 3.13 | 1.89 | 101.81 | 3.68 |
| Rhoifolin | y = 1.08 × 10⁴x + 572 | 0.9999 | 1.3–162 | 0.28 | 0.84 | 2.53 | 2.75 | 3.08 | 4.44 | 99.63 | 4.74 |
| Diosmetin | y = 1.15 × 10⁴x − 9.93 × 10³ | 0.9993 | 1.72–214 | 0.15 | 0.44 | 1.09 | 0.78 | 0.84 | 0.47 | 95.63 | 1.14 |
| Apigenin | y = 2.17 × 10⁴x − 9.13 × 10⁴ | 0.9995 | 25.4–318 | 4.19 | 12.56 | 3.54 | 3.83 | 4.22 | 4.39 | 99.03 | 3.61 |
| Kaempferol | y = 191x + 250 | 0.9997 | 2.02–101 | 0.57 | 1.70 | 4.28 | 4.68 | 3.78 | 3.06 | 101.42 | 4.49 |
| Astragalin | y = 2.17 × 10⁴x + 8.73 × 10⁴ | 0.9999 | 0.0353–883 | 0.01 | 0.02 | 3.51 | 3.92 | 3.77 | 3.38 | 97.79 | 1.74 |
| Lonicerin | y = 1.11 × 10³x + 4.25 × 10³ | 0.9994 | 22.4–14,000 | 0.02 | 0.07 | 3.45 | 3.85 | 4.12 | 4.41 | 97.77 | 3.43 |
| Kaempferol-3-O-rutinoside | y = 3.13 × 10³x + 9.11 × 10⁴ | 0.9999 | 0.632–7900 | 0.04 | 0.12 | 2.31 | 2.44 | 3.43 | 3.62 | 97.66 | 1.64 |
| Isoquercitrin | y = 4.33 × 10³x + 1.4 × 10⁵ | 0.9996 | 2.65–3310 | 0.20 | 0.58 | 1.68 | 1.54 | 3.81 | 2.59 | 96.34 | 3.33 |
| Sweroside | y = 34.9x + 1.56 × 10³ | 0.9996 | 0.841–52,600 | 0.23 | 0.69 | 3.54 | 3.68 | 3.09 | 4.67 | 96.80 | 3.12 |
| Secologanic acid | y = 609x + 3.48 × 10⁴ | 0.9999 | 1.45–182,000 | 0.07 | 0.22 | 3.02 | 3.37 | 3.84 | 1.08 | 96.41 | 2.98 |
| Loganin | y = 3.95x + 1.72 × 10³ | 0.9990 | 14.1–35,200 | 4.18 | 12.54 | 2.26 | 2.43 | 0.37 | 0.30 | 98.00 | 1.84 |
| Secoxyloganin | y = 638x + 1.32 × 10⁵ | 0.9990 | 0.189–47,400 | 0.05 | 0.16 | 4.19 | 4.67 | 3.16 | 1.61 | 98.00 | 1.70 |
| Loganin acid | y = 1.11 × 10³x − 1.98 × 10⁵ | 0.9993 | 441.2–22,100 | 139.27 | 417.80 | 2.95 | 2.54 | 2.49 | 1.77 | 97.33 | 0.66 |
| Morroniside | y = 10.4x + 8.21 × 10³ | 0.9990 | 41.1–514,000 | 7.87 | 23.60 | 2.11 | 1.83 | 4.69 | 4.08 | 97.12 | 3.21 |
| l-Alanine | y = 1.43 × 10³x + 1.78 × 10⁴ | 0.9997 | 8.47–10,600 | 2.23 | 6.68 | 3.07 | 2.60 | 2.98 | 4.81 | 101.09 | 4.66 |
| l-Serine | y = 351x + 5.93 × 10⁴ | 0.9997 | 9.16–11,500 | 1.34 | 4.03 | 2.71 | 2.54 | 2.48 | 4.23 | 97.96 | 4.32 |
| l-Proline | y = 1.77 × 10³x + 3.04 × 10⁴ | 0.9996 | 0.381–23,800 | 0.09 | 0.28 | 2.75 | 2.86 | 1.65 | 3.58 | 97.09 | 2.70 |
| l-Valine | y = 6.36 × 10³x + 2.17 × 10⁵ | 0.9995 | 2.51–1570 | 0.22 | 0.64 | 2.96 | 3.19 | 1.40 | 1.40 | 97.25 | 2.09 |
| l-Threonine | y = 1.75 × 10³x − 9.1 × 10⁴ | 0.9996 | 111–13,900 | 22.33 | 66.98 | 2.83 | 1.46 | 0.60 | 1.35 | 96.26 | 2.69 |
| l-Isoleucine | y = 5.15 × 10³x + 1.92 × 10⁵ | 0.9998 | 2.88–3600 | 0.42 | 1.27 | 0.67 | 0.63 | 2.10 | 1.17 | 95.31 | 1.88 |
| l-Leucine | y = 9.64 × 10³x + 4.72 × 10⁵ | 0.9997 | 3.38–4230 | 0.71 | 2.13 | 1.21 | 1.28 | 1.93 | 0.89 | 93.89 | 3.10 |
| l-Aspartic acid | y = 660x + 2.38 × 10⁴ | 0.9991 | 4.6–57,500 | 0.84 | 2.51 | 1.49 | 1.66 | 1.15 | 4.09 | 97.55 | 2.99 |
| l-Glutamate | y = 1.64 × 10³x − 2.82 × 10⁵ | 0.9998 | 474–29,600 | 136.18 | 408.53 | 0.69 | 0.74 | 2.09 | 0.93 | 97.89 | 1.72 |
| l-Lysine | y = 2.32 × 10³x − 2.01 × 10⁵ | 0.9993 | 147–12,600 | 36.78 | 110.34 | 0.58 | 0.65 | 2.48 | 0.73 | 98.52 | 1.66 |
| l-Histidine | y = 7.11 × 10³x + 1.65 × 10⁵ | 0.9999 | 59.1–7390 | 7.66 | 22.97 | 1.67 | 1.45 | 3.66 | 1.42 | 96.14 | 3.31 |
| l-Phenylalanine | y = 1.7 × 10⁴x + 2.55 × 10⁵ | 0.9997 | 25.6–3200 | 0.55 | 1.65 | 1.78 | 1.28 | 1.21 | 0.43 | 103.21 | 4.27 |
| l-Arginine | y = 6.54 × 10³x + 1.21 × 10⁵ | 0.9996 | 0.241–1510 | 0.04 | 0.13 | 1.25 | 1.19 | 2.98 | 1.17 | 97.99 | 2.55 |
| Cytidine | y = 4.72 × 10⁴x − 1.94 × 10⁴ | 0.9995 | 1.84–230 | 0.50 | 1.49 | 3.39 | 3.20 | 1.26 | 3.93 | 96.29 | 3.54 |
| Uridine | y = 861x + 7.0 × 10³ | 0.9997 | 40.4–5050 | 7.12 | 21.37 | 3.2 | 3.53 | 1.31 | 3.38 | 98.06 | 1.71 |
| Adenosine | y = 5.28 × 10⁴x + 3.05 × 10⁵ | 0.9994 | 6.31–789 | 0.95 | 2.83 | 1.45 | 1.41 | 0.69 | 0.25 | 98.61 | 3.49 |
| Inosine | y = 7.98 × 10³x + 2.12 × 10⁴ | 0.9991 | 8.78–220 | 1.85 | 5.54 | 1.73 | 1.87 | 1.26 | 2.43 | 95.89 | 2.89 |
| Species | No. | Batch No. | Habits | Origin |
|---|---|---|---|---|
| Lonicerae japonicae caulis | S1 | 180810 | Shandong | Ningbo Mingbei traditional Chinese Medicine Co., Ltd. |
| S2 | 20170927 | Shandong | Nantong Sanyue Herbal Medicine Co., Ltd. | |
| S3 | 20170801 | Shandong | Local collection | |
| S4 | 171020 | Jiangsu | Shanghai medicine holdings Yixing Co., Ltd. | |
| S5 | 170501 | Shandong | Local collection | |
| S6 | 170601 | Shandong | Anhui YaoZhiyuan traditional Chinese Medicine decoction Co., Ltd. | |
| S7 | 180501 | Shandong | Bozhou Beshixin traditional Chinese Medicine slice Co., Ltd. | |
| S8 | 1805011 | Shandong | Bozhou Beshixin traditional Chinese Medicine slice Co., Ltd. | |
| S9 | 18030825 | Shandong | Anhui Dichang Pharmaceutical Co., Ltd. | |
| S10 | C16052001 | Jiangsu | Zhejiang Yedong Pharmaceutical Co., Ltd. | |
| S11 | 180426 | Jiangsu | Nantong Sanyue Herbal Medicine Co., Ltd. | |
| S12 | 20181104 | Shandong | Local collection | |
| S13 | 20181105 | Shandong | Local collection | |
| S14 | 20181103 | Shandong | Local collection | |
| S15 | 20181102 | Shandong | Local collection | |
| S16 | 20181101 | Shandong | Local collection | |
| Lonicerae japonicae flos | S17 | 20181108 | Shandong | Local collection |
| S18 | 180315 | Shandong | Suzhou Boyuan pharmaceutical industry | |
| S19 | 2018110506 | Henan | Fengqiu | |
| S20 | 2018110502 | Shandong | Linyi | |
| S21 | 180401 | Henan | Anhui YaoZhiyuan traditional Chinese Medicine decoction Co., Ltd. | |
| S22 | 2018110603 | Henan | Fengqiu | |
| S23 | 2018110604 | Henan | Fengqiu | |
| S24 | 2018110303 | Hebei | Juluxian Goujijinyinhua market | |
| S25 | C16011901 | Henan | Zhejiang Yedong Pharmaceutical Co., Ltd. | |
| S26 | 20181109 | Henan | Fengqiu | |
| S27 | 180701 | Shandong | Chongqing Wanli Pharmaceutical Co., Ltd. | |
| S28 | 180315 | Shandong | Suzhou Boyuan pharmaceutical industry | |
| S29 | 2018110601 | Henan | Fengqiu | |
| S30 | Henan | Fengqiu | ||
| S31 | Henan | Fengqiu | ||
| S32 | 2018110505 | Shandong | Linyi | |
| S33 | 2018110302 | Hebei | Juluxian Gouqijinyinhua market | |
| S34 | 20181103021 | Hebei | Juluxian Gouqijinyinhua market | |
| S35 | 20181103022 | Hebei | Juluxian Gouqijinyinhua market | |
| S36 | 2018110301 | Hebei | Juluxian Gouqijinyinhua market | |
| S37 | 20181103012 | Hebei | Juluxian Gouqijinyinhua market | |
| S38 | 20181103013 | Hebei | Juluxian Gouqijinyinhua market | |
| S39 | 2018110504 | Shandong | Linyi | |
| S40 | 2018110503 | Shandong | Linyi | |
| S41 | 2018110303 | Hebei | Juluxian Gouqijinyinhua market | |
| S42 | 20181107 | Shandong | Local herbal medicine market | |
| S43 | 180607 | Shandong | Nantong Sanyue Herbal Medicine Co., Ltd. | |
| S44 | 170802 | Shandong | Bozhou Beshixin traditional Chinese Medicine slice Co., Ltd. |
© 2019 by the authors. Licensee MDPI, Basel, Switzerland. This article is an open access article distributed under the terms and conditions of the Creative Commons Attribution (CC BY) license (http://creativecommons.org/licenses/by/4.0/).
Share and Cite
Cai, Z.; Wang, C.; Zou, L.; Liu, X.; Chen, J.; Tan, M.; Mei, Y.; Wei, L. Comparison of Multiple Bioactive Constituents in the Flower and the Caulis of Lonicera japonica Based on UFLC-QTRAP-MS/MS Combined with Multivariate Statistical Analysis. Molecules 2019, 24, 1936. https://doi.org/10.3390/molecules24101936
Cai Z, Wang C, Zou L, Liu X, Chen J, Tan M, Mei Y, Wei L. Comparison of Multiple Bioactive Constituents in the Flower and the Caulis of Lonicera japonica Based on UFLC-QTRAP-MS/MS Combined with Multivariate Statistical Analysis. Molecules. 2019; 24(10):1936. https://doi.org/10.3390/molecules24101936
Chicago/Turabian StyleCai, Zhichen, Chengcheng Wang, Lisi Zou, Xunhong Liu, Jiali Chen, Mengxia Tan, Yuqi Mei, and Lifang Wei. 2019. "Comparison of Multiple Bioactive Constituents in the Flower and the Caulis of Lonicera japonica Based on UFLC-QTRAP-MS/MS Combined with Multivariate Statistical Analysis" Molecules 24, no. 10: 1936. https://doi.org/10.3390/molecules24101936