
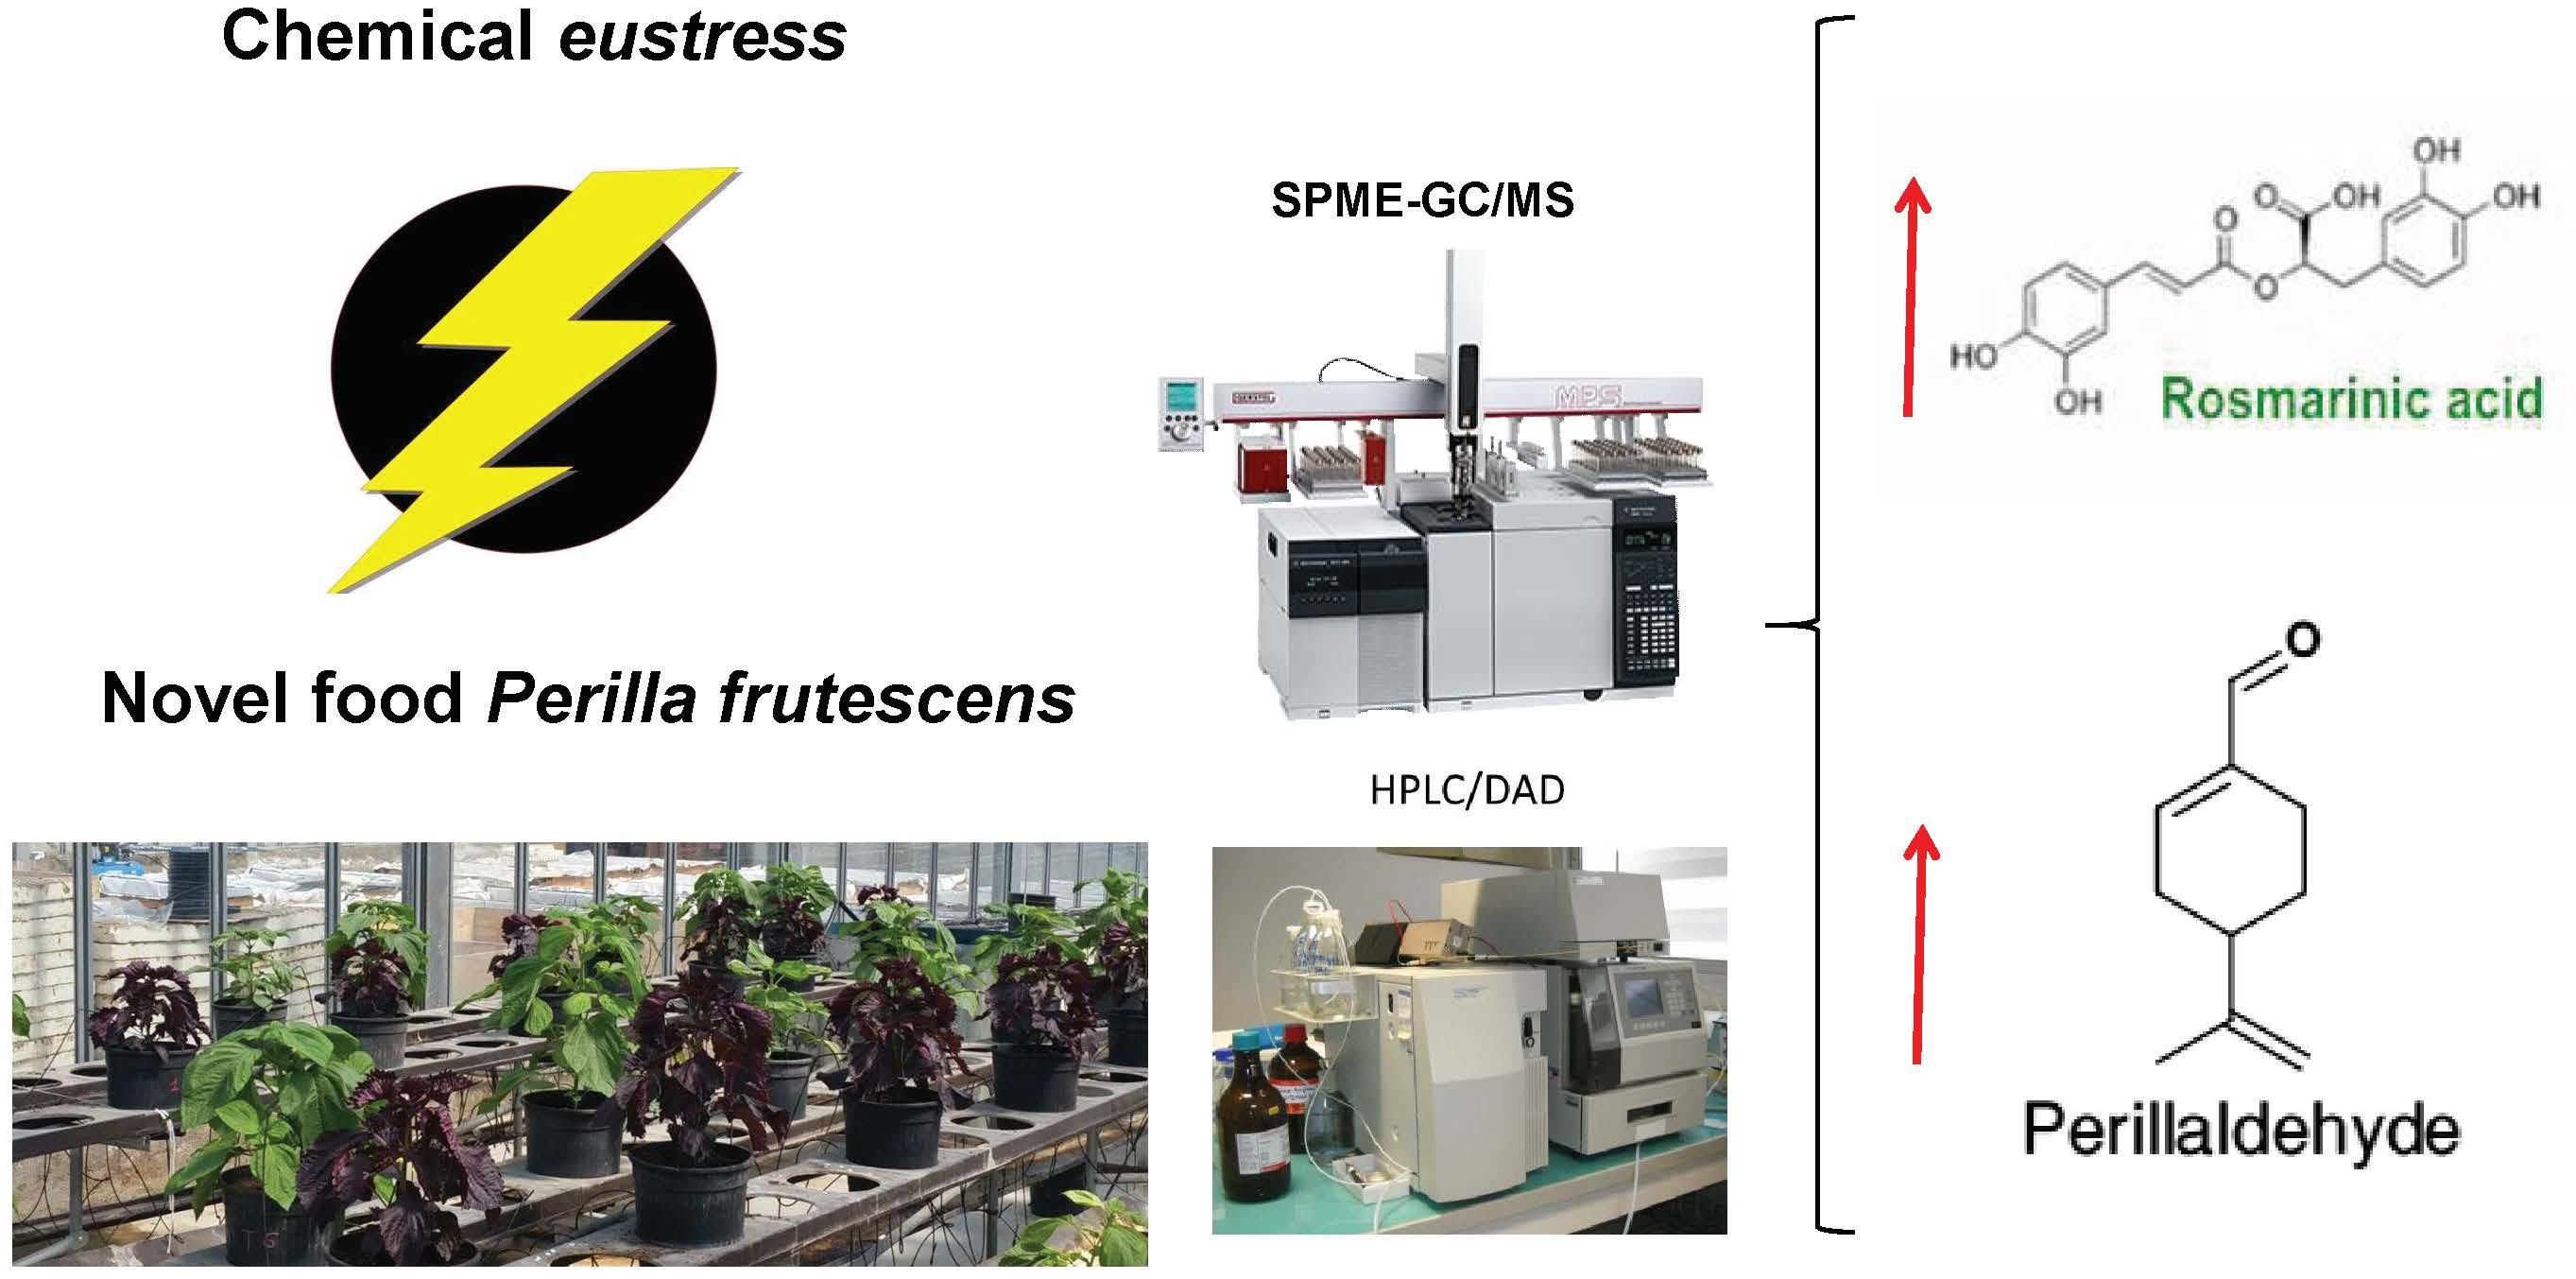
Chemical Eustress Elicits Tailored Responses and Enhances the Functional Quality of Novel Food Perilla frutescens

 ,
,  ,
,  ,
,  ,
,
Abstract
:
1. Introduction
2. Results and Discussion
2.1. Fresh Yield, Growth Response and Colorimetric Attributes
2.2. Dry Matter, Protein Content and Mineral Profile
2.3. Nitrate and Chlorophyll a Contents, Phenolic Composition and Total Phenolic Content
2.4. Leaf Aroma Volatile Profile
2.5. Principal Component Analysis
3. Materials and Methods
3.1. Greenhouse Conditions and Plant Material
3.2. Experimental Design, Sodium Chloride Application and Nutrient Solution Management
3.3. Yield and Growth Measurements, Collection of Samples
3.4. Leaf Color Measurements
3.5. Protein and Mineral Profile Analysis
3.6. Sample Extraction and Assay Preparation
3.7. Identification and Quantification of Phenolic Compounds and Chlorophyll a by HPLC-DAD
3.8. Determination of Total Phenolics
3.9. SPME-GC/MS of Volatile Compounds
3.10. Statistical Analysis of Data
4. Conclusions
Supplementary Materials
Author Contributions
Funding
Acknowledgments
Conflicts of Interest
References
- Kyriacou, M.C.; Rouphael, Y. Towards a new definition of quality for fresh fruits and vegetables. Sci. Hortic. 2018, 234, 463–469. [Google Scholar] [CrossRef]
- Butera, D.; Tesoriere, L.; Di Gaudio, F.; Bongiorno, A.; Allegra, M.; Pintaudi, A.M. Antioxidant activities of sicilian prickly pear (Opuntia ficusindica) fruit extracts and reducing properties of its betalains: betanin and indicaxanthin. J. Agric. Food Chem. 2002, 50, 6895–6901. [Google Scholar] [CrossRef] [PubMed]
- Skowyra, M.; Falguera, V.; Azman, N.A.M.; Segovia, F.; Almajano, M.P. The Effect of Perilla frutescens extract on the oxidative stability of model food emulsions. Antioxidants 2014, 3, 38–54. [Google Scholar] [CrossRef] [PubMed]
- Carillo, P.; Cacace, D.; De Pascale, S.; Rapacciuolo, M.; Fuggi, A. Organic vs. traditional potato powder. Food Chem. 2012, 133, 1264–1273. [Google Scholar] [CrossRef]
- Kang, N.S.; Lee, J.H. Characterisation of phenolic phytochemicals and quality changes related to the harvest times from the leaves of Korean purple perilla (Perilla frutescens). Food Chem. 2011, 124, 556–562. [Google Scholar] [CrossRef]
- Ghimire, B.K.; Yoo, J.H.; Yu, C.Y.; Chung, I.M. GC–MS analysis of volatile compounds of Perilla frutescens Britton var. Japonica accessions: Morphological and seasonal variability. Asian Pac. J. Trop. Med. 2017, 10, 643–651. [Google Scholar] [CrossRef]
- Yu, H.; Kosuna, K.; Haga, M. Perilla: The Genus Perilla; Taylor and Francis: London, UK; New York, NY, USA, 2004; p. 193. [Google Scholar]
- Asif, M. Biological importance and health effect of Perilla frutescens. Plant. Indones. J. Pharm. 2012, 23, 84–92. [Google Scholar] [CrossRef]
- Banno, N.; Akihisa, T.; Tokuda, H.; Yasukawa, K.; Higashihara, H.; Ukiya, M. Triterpene acids from the leaves of Perilla frutescens and their anti-inflammatory and antitumor-promoting effects. Biosci. Biotechnol. Biochem. 2004, 68, 85–90. [Google Scholar] [CrossRef]
- Diao, Y.; Miao, Y.; Lin, X.; Liao, C.; Guo, F.; Hu, Z. Comparative analysis of five varieties in Perilla frutescens (L.) Britton by 45S rDNA FISH and 5S rDNA Sequences. Russ. J. Gen. 2009, 45, 440–444. [Google Scholar] [CrossRef]
- Saito, K.; Yamazaki, M. Biochemistry and molecular biology of the late-stage of biosynthesis of anthocyanin: Lessons from Perilla frutescens as a model plant. New Phytol. 2002, 155, 9–23. [Google Scholar] [CrossRef]
- Yoshida, K.; Kondo, T.; Kameda, K.; Goto, T. Structure of anthocyanins isolated from purple leaves of Perilla ocimoides L. var. crispa Benth and their isomerization by irradiation of light. Agric. Biol. Chem. 1990, 54, 1745–1751. [Google Scholar] [CrossRef]
- Kosuna, K.; Haga, M.; Yu, H.C. Perilla: The Genus Perilla; Harwood Academic Publishers: Dallas, TX, USA, 1997. [Google Scholar]
- Lin, L.Y.; Peng, C.C.; Wang, H.E.; Liu, Y.W.; Shen, K.H.; Chen, K.C. Active volatile constituents in Perilla frutescens essential oils and Improvement of antimicrobial and anti-Inflammatory bioactivity by fractionation. J. Essent. Oil Bear. Plants 2016, 19, 1957–1983. [Google Scholar] [CrossRef]
- Lee, Y.J.; Yang, C.M. Seasonal changes of growth and leaf perillaldehyde in Perilla frutescens (L.). Britton. J. Taiwan Agric. Res. 2009, 58, 114–124. [Google Scholar]
- Lu, N.; Bernardo, E.L.; Tippayadarapanich, C.; Takagaki, M.; Kagawa, N.; Yamori, W. Growth and accumulation of secondary metabolites in perilla as affected by photosynthetic photon flux density and electrical conductivity of the nutrient solution. Front. Plant Sci. 2017, 8, 708. [Google Scholar] [CrossRef] [PubMed]
- Nishimura, T.; Ohyama, K.; Goto, E.; Inagaki, N. Concentrations of perillaldehyde, limonene, and anthocyanin of Perilla plants as affected by light quality under controlled environments. Sci. Hortic. 2009, 122, 134–137. [Google Scholar] [CrossRef]
- Akula, R.; Ravishankar, G.A. Influence of abiotic stress signals on secondary metabolites in plants. Plant Signal. Behav. 2011, 6, 1720–1731. [Google Scholar] [CrossRef] [PubMed] [Green Version]
- Lucini, L.; Borgognone, D.; Rouphael, Y.; Cardarelli, M.; Bernardi, J.; Colla, G. Mild potassium chloride stress alters the mineral composition, hormone network, and phenolic profile in artichoke leaves. Front. Plant Sci. 2016, 7, 948. [Google Scholar] [CrossRef]
- Woodrow, P.; Ciarmiello, L.F.; Annunziata, M.G.; Pacifico, S.; Iannuzzi, F.; Mirto, A. Durum wheat seedling responses to simultaneous high light and salinity involve a fine reconfiguration of amino acids and carbohydrate metabolism. Physiol. Plant. 2017, 159, 290–312. [Google Scholar] [CrossRef]
- Rouphael, Y.; Kyriacou, M.C.; Petropoulos, S.A.; De Pascale, S.; Colla, G. Improving vegetable quality in controlled environments. Sci. Hortic. 2018, 234, 275–289. [Google Scholar] [CrossRef]
- Rouphael, Y.; Petropoulos, S.A.; Cardarelli, M.; Colla, G. Salinity as eustressor for enhancing quality of vegetables. Sci. Hortic. 2018, 234, 361–369. [Google Scholar] [CrossRef]
- Petropoulos, S.A.; Levizou, E.; Ntatsi, G.; Fernandes, Â.; Petrotos, K.; Akoumianakis, K. Salinity effect on nutritional value, chemical composition and bioactive compounds content of Cichorium spinosum L. Food Chem. 2017, 214, 129–136. [Google Scholar] [CrossRef] [PubMed]
- Colla, G.; Rouphael, Y.; Cardarelli, M.; Svecova, E.; Rea, E.; Lucini, L. Effects of saline stress on mineral composition, phenolic acids and flavonoids in leaves of artichoke and cardoon genotypes grown in floating system. J. Sci. Food Agric. 2013, 93, 1119–1127. [Google Scholar] [CrossRef] [PubMed]
- Martinetti, L.; Ferrante, A.; Bassoli, A.; Borgonovo, G.; Tosca, A.; Spoleto, P. Characterization of some qualitative traits in different perilla cultivars. Acta Hortic. 2012, 939, 301–308. [Google Scholar] [CrossRef]
- Colonna, E.; Rouphael, Y.; Barbieri, G.; De Pascale, S. Nutritional quality of ten leafy vegetables harvested at two light intensities. Food Chem. 2016, 199, 702–710. [Google Scholar] [CrossRef] [PubMed]
- Kyriacou, M.C.; Rouphael, Y.; Colla, G.; Zrenner, R.M.; Schwarz, D. Vegetable grafting: The implications of a growing agronomic imperative for vegetable fruit quality and nutritive value. Front. Plant Sci. 2017, 8, 741. [Google Scholar] [CrossRef] [PubMed]
- Ali, M.B.; Khandaker, L.; Oba, S. Comparative study on functional components, antioxidant activity and color parameters of selected colored leafy vegetables as affected by photoperiods. J. Agric. Food Environ. 2009, 7, 392–398. [Google Scholar]
- McGuire, R.G. Reporting of objective color measurements. HortScience 1992, 27, 1254–1255. [Google Scholar]
- Peiretti, P.G. Fatty acid content and chemical composition of vegetative parts of perilla (Perilla frutescens L.) after different growth lengths. Res. J. Med. Plant 2011, 5, 72–78. [Google Scholar] [CrossRef]
- Gharibzahedi, S.M.T.; Jafari, S.M. The importance of minerals in human nutrition bioavailability, food fortification, processing effects and nanoencapsulation. Trends Food Sci. Technol. 2017, 62, 119–132. [Google Scholar] [CrossRef]
- Levander, O.A. Fruit and vegetable contributions to dietary mineral intake in human health and disease. HortScience 1990, 25, 1486–1488. [Google Scholar]
- Grattan, S.R.; Grieve, C.M. Salinity-mineral nutrient relations in horticultural crops. Sci. Hortic. 1999, 78, 127–157. [Google Scholar] [CrossRef]
- Colla, G.; Kim, H.; Kyriacou, M.C.; Rouphael, Y. Nitrates in fruits and vegetables. Sci. Hortic. 2018, 237, 221–238. [Google Scholar] [CrossRef]
- Borgognone, D.; Rouphael, Y.; Cardarelli, M.; Lucini, L.; Colla, G. Changes in biomass, mineral composition, and quality of cardoon in response to NO3−: Cl− ratio and nitrate deprivation from the nutrient solution. Front. Plant Sci. 2016, 7, 978. [Google Scholar] [CrossRef] [PubMed]
- Touraine, B.; Clarkson, D.T.; Muller, B. Regulation of nitrate uptake at the whole plant level. In A Whole Plant Perspective on Carbon-Nitrogen Interactions; SPB Academic Publishing: The Hague, The Netherlands, 1994; pp. 11–30. [Google Scholar]
- Colla, G.; Rouphael, Y.; Leonardi, C.; Bie, Z. Role of grafting in vegetable crops grown under saline conditions. Sci. Hortic. 2010, 127, 147–155. [Google Scholar] [CrossRef]
- Rouphael, Y.; Bernardi, J.; Cardarelli, M.; Bernardo, L.; Kane, D.; Colla, G.; Lucini, L. Phenolic compounds and sesquiterpene lactones profile in leaves of nineteen artichoke cultivars. J. Agric. Food Chem. 2016, 64, 8540–8548. [Google Scholar] [CrossRef] [PubMed]
- Gavarić, N.; Kovač, J.; Kretschmer, N.; Kladar, N.; Mozina, S.S.; Bucar, F. Natural products as antibacterial agents—Antibacterial potential and safety of post-distillation and waste material from Thymus vulgaris L., Lamiaceae. In Concepts, Compounds and the Alternatives of Antibacterials; InTech: London, UK, 2015; ISBN 978-953-51-2232-6. [Google Scholar]
- Kim, G.D.; Park, Y.S.; Jin, Y.H.; Park, C.S. Production and applications of rosmarinic acid and structurally related compounds. Appl. Microbiol. Biotechnol. 2015, 99, 2083–2092. [Google Scholar] [CrossRef] [PubMed]
- Lee, C.J.; Chen, L.J.; Chang, T.L.; Ke, W.M.; Lo, Y.F.; Wang, C.C. The correlation between skin-care effects and phytochemical contents in Lamiaceae plants. Food Chem. 2011, 124, 833–841. [Google Scholar] [CrossRef]
- Zhu, F.; Asada, T.; Sato, A.; Koi, Y.; Nishiwaki, H.; Tamura, H. Rosmarinic acid extract for antioxidant, antiallergic, and α-glucosidase inhibitory activities, isolated by supramolecular technique and solvent extraction from Perilla leaves. J. Agric. Food Chem. 2014, 62, 885–892. [Google Scholar] [CrossRef]
- Kim, H.J.; Chen, F.; Wang, X.; Rajapakse, N.C. Effect of methyl jasmonate on secondary metabolites of sweet basil (Ocimumbasilicum L.). J. Agric. Food Chem. 2006, 54, 2327–2332. [Google Scholar] [CrossRef]
- Li, Z.; Wang, X.; Chen, F.; Kim, H.J. Chemical changes and overexpressed genes in sweet basil (Ocimumbasilicum L.) upon methyl jasmonate treatment. J. Agric. Food Chem. 2007, 55, 706–713. [Google Scholar] [CrossRef]
- Vosoughi, N.; Gomarian, M.; GhasemiPirbalouti, A.; Khaghani, S.; Malekpoor, F. Essential oil composition and total phenolic, flavonoid contents, and antioxidant activity of sage (Salvia officinalis L.) extract under chitosan application and irrigation frequencies. Ind. Crops Prod. 2018, 117, 366–374. [Google Scholar] [CrossRef]
- Reddivari, L.; Hale, A.L.; Miller, C. Genotype, location, and year influence antioxidant activity, carotenoid content, phenolic content, and composition in specialty potatoes. J. Agric. Food Chem. 2007, 55, 8073–8079. [Google Scholar] [CrossRef]
- Vallverdú-Queralt, A.; Medina-Remón, A.; Martínez-Huélamo, M.; Jáuregui, O.; Andres-Lacueva, C.; Lamuela-Raventos, R.M. Phenolic profile and hydrophilic antioxidant capacity as chemotaxonomic markers of tomato varieties. J. Agric. Food Chem. 2011, 59, 3994–4001. [Google Scholar] [CrossRef] [PubMed]
- Petropoulos, S.A.; Pereira, C.; Ntatsi, G.; Danalatos, N.; Barros, L.; Ferreira, I.C.F.R. Nutritional value and chemical composition of Greek artichoke genotypes. Food Chem. 2018, 267, 296–302. [Google Scholar] [CrossRef] [PubMed]
- Rouphael, Y.; Colla, G.; Graziani, G.; Ritieni, A.; Cardarelli, M.; De Pascale, S. Phenolic composition, antioxidant activity and mineral profile in two seed-propagated artichoke cultivars as affected by microbial inoculants and planting time. Food Chem. 2017, 234, 10–19. [Google Scholar] [CrossRef] [PubMed]
- Petropoulos, S.; Fernandes, Â.; Barros, L.; Ciric, A.; Sokovic, M.; Ferreira, I.C.F.R. Antimicrobial and antioxidant properties of various Greek garlic genotypes. Food Chem. 2018, 245, 7–12. [Google Scholar] [CrossRef] [PubMed] [Green Version]
- Ha, T.J.; Lee, M.H.; Lee, J.H. Comparison of antioxidant activities and volatile compounds using GC/MS from leaves of Korean purple perilla (Perilla frutescens) grown in a greenhouse. Food Sci. Biotechnol. 2015, 24, 1979–1986. [Google Scholar] [CrossRef]
- Złotek, U.; Szymanowska, U.; Karas´, M.; Swieca, M. Antioxidative and antiinflammatory potential of phenolics from purple basil (Ocimumbasilicum L.) leaves induced by jasmonic, arachidonic and b-aminobutyric acid elicitation. Int. J. Food Sci. Technol. 2016, 51, 163–170. [Google Scholar] [CrossRef]
- Złotek, U.; Michalak-Majewska, M.; Szymanowska, U. Effect of jasmonic acid elicitation on the yield, chemical composition, and antioxidant and anti-inflammatory properties of essential oil of lettuce leaf basil (Ocimumbasilicum L.). Food Chem. 2016, 213, 1–7. [Google Scholar] [CrossRef]
- Bassoli, A.; Borgonovo, G.; Caimi, S.; Scaglioni, L.; Morini, G.; Schiano Moriello, A.; Di Marzo, V.; De Petrocellis, L. Taste-guided identification of high potency TRPA1 agonists from Perilla frutescens. J. Bioorg. Med. Chem. 2009, 17, 1636–1639. [Google Scholar] [CrossRef]
- Laureati, M.; Buratti, S.; Bassoli, A.; Borgonovo, G.; Pagliarini, E. Discrimination and characterisation of three cultivars of Perilla frutescens by means of sensory descriptors and electronic nose and tongue analysis. Food Res. Int. 2010, 43, 959–964. [Google Scholar] [CrossRef]
- Baatour, O.; Kaddour, R.; AidiWannes, W.; Lachaal, L.; Marzouk, B. Salt effects on the growth, mineral nutrition, essential oil yield and composition of marjoram (Origanummajorana). Acta Physiol. Plant. 2010, 32, 45–51. [Google Scholar] [CrossRef]
- Baher, Z.F.; Mirza, M.; Ghorbanli, M.; Rezaii, M.B. The influence of water stress on plant height, herbal and essential oil yield and composition in Saturejahortensis L. Flavour. Fragr. J. 2002, 17, 275–277. [Google Scholar] [CrossRef]
- EzzEl-Din, A.A.; Aziz, E.E.; Hendawy, S.F.; Omer, E.A. Response of Thymus vulgaris L. to salt stress and alar (B9) in newly reclaimed soil. J. Appl. Sci. Res. 2009, 5, 2165–2170. [Google Scholar]
- Hendawy, S.F.; Khalid, K.A. Response of sage (Salvia officinalis L.) plantstozinc application under different salinity levels. J. Appl. Sci. Res. 2005, 1, 47–155. [Google Scholar]
- Valifard, M.; Mohsenzadeh, S.; Kholdebarin, B.; Rowshan, V. Effects of salt stress on volatile compounds, total phenolic content and antioxidant activities of Salvia mirzayanii. S. Afr. J. Bot. 2014, 93, 92–97. [Google Scholar] [CrossRef]
- Barbieri, G.; Vallone, S.; Orsini, F.; Paradiso, R.; De Pascale, S.; Negre-Zakharov, F.; Maggio, A. Stomatal density and metabolic determinants mediate salt stress adaptation and water use efficiency in basil (Ocimumbasilicum L.). J. Plant Physiol. 2012, 169, 1737–1746. [Google Scholar] [CrossRef]
- Shalan, M.N.; Abdel-Latif, T.A.T.; Ghadban, E.A. Effect of water salinity and some nutritional compounds of the growth and production of sweet marjoram plants (Marjoranahortensis L.). Egypt. J. Agric. Res. 2006, 84, 959. [Google Scholar]
- Kyriacou, M.C.; Soteriou, G.A.; Rouphael, Y.; Siomos, A.S.; Gerasopoulos, D. Configuration of watermelon fruit quality in response to rootstock-mediated harvest maturity and postharvest storage. J. Sci. Food Agric. 2016, 96, 2400–2409. [Google Scholar] [CrossRef]
- Rouphael, Y.; Giordano, M.; Cardarelli, M.; Cozzolino, E.; Mori, M.; Kyriacou, M.C.; Bonini, P.; Colla, G. Plant- and seaweed-based extracts increase yield but differentially modulate nutritional quality of greenhouse spinach through biostimulant action. Agronomy 2018, 8, 126. [Google Scholar] [CrossRef]
- Bremner, J.M. Total Nitrogen 1. In Methods of Soil Analysis; Black, C.A., Evans, D.D., White, I.L., Ensminger, L.E., Eds.; American Society of Agronomy: Madison, WI, USA, 1965; pp. 1149–1178. [Google Scholar]
- AOAC. Official Method of Analysis, 18th ed.; Association of Official Analytical Chemists: Washington, DC, USA, 2005. [Google Scholar]
- Rouphael, Y.; Colla, G.; Giordano, M.; El-Nakhel, C.; Kyriacou, M.C.; De Pascale, S. Foliar applications of a legume-derived protein hydrolysate elicit dose-dependent increases of growth, leaf mineral composition, yield and fruit quality in two greenhouse tomato cultivars. Sci. Hortic. 2017, 226, 353–360. [Google Scholar] [CrossRef]
- Gallo, M.; Ferracane, R.; Graziani, G.; Ritieni, A.; Fogliano, V. Microwave assisted extraction of phenolic compounds from four different spices. Molecules 2010, 15, 6365–6374. [Google Scholar] [CrossRef] [PubMed]
- Huang, B.; Lei, Y.; Tang, Y.; Zhang, J.; Qin, L.; Liu, J. Comparison of HS-SPME with hydrodistillation and SFE for the analysis of the volatile compounds of Zisu and Baisu, two varietal species of Perilla frutescens of Chinese origin. Food Chem. 2011, 125, 268–275. [Google Scholar] [CrossRef]
- Murthy, H.N.; Lee, E.J.; Paek, K.Y. Production of secondary metabolites from cell and organ cultures: Strategies and approaches for biomass improvement and metabolite accumulation. Plant Cell Tissue Organ Cult. 2014, 118, 1–16. [Google Scholar] [CrossRef]
- Trivellini, A.; Lucchesini, M.; Maggini, R.; Mosadegh, H.; Sulca Villamarin, T.S.; Vernieri, P.; Mensuali-Sodi, A.; Pardossi, A. Lamiaceae phenols as multifaceted compounds: Bioactivity, industrial prospects and role of “positive-stress”. Ind. Crops Prod. 2016, 83, 241–254. [Google Scholar] [CrossRef]


| Source of Variance | Plant Height | Leaf Number | Leaf Area | Leaf Fresh Yield | Shoot Dry Biomass | Leaf Colour | ||
|---|---|---|---|---|---|---|---|---|
| (cm) | (no. plant−1) | (cm2·plant−1) | (g·plant−1) | (g·plant−1) | L* | a* | b* | |
| Genotype (G) | * | ns | * | ns | ** | *** | *** | *** |
| Salinity (S) | ** | *** | *** | *** | *** | * | ns | ns |
| C × S | ns | ** | ns | * | ** | ns | ns | ns |
| Genotype | ||||||||
| Green | 44.2 ± 2.2 a | 115.0 ± 13.9 a | 1984.7 ± 288.1 b | 50.3 ± 10.1 a | 15.8 ± 1.7 a | 36.0 ± 0.7 a | −6.7 ± 0.5 b | 15.2 ± 0.6 a |
| Red | 39.2 ± 1.3 b | 121.1 ± 6.5 a | 2422.3 ± 182.2 a | 45.2 ± 4.5 a | 11.8 ± 0.7 b | 25.9 ± 0.7 b | 4.5 ± 0.3 a | 0.9 ± 0.5 b |
| Salinity (mM NaCl) | ||||||||
| 1 | 47.4 ± 2.6 a | 164.2 ± 8.7 a | 3216.2 ± 174.3 a | 67.0 ± 9.5 a | 18.9 ± 1.9 a | 28.9 ± 2.7 c | −1.0 ± 2.8 a | 8.3 ± 3.6 a |
| 10 | 43.8 ± 2.4 ab | 132.7 ± 6.7 b | 2564.5 ± 132.2 b | 56.3 ± 6.6 ab | 15.2 ± 1.0 b | 29.9 ± 2.4 bc | −1.9 ± 2.6 a | 8.1 ± 3.1 a |
| 20 | 40.9 ± 1.8 b | 105.9 ± 10.1 c | 1983.0 ± 260.0 c | 45.0 ± 8.2 b | 13.0 ± 1.1 b | 32.9 ± 2.3 a | −1.6 ± 2.6 a | 9.3 ± 3.3 a |
| 30 | 34.7 ± 1.7 c | 69.4 ± 8.9 d | 1050.1 ± 221.0 d | 22.8 ± 5.6 c | 7.0 ± 1.2 c | 32.1 ± 2.0 ab | 0.1 ± 2.3 a | 6.5 ± 3.1 a |
| G × S | ||||||||
| Green-1 mM NaCl | 52.2 ± 3.4 a | 184.2 ± 8.7 a | 3269.1 ± 332.3 a | 78.8 ± 8.4 a | 23.7 ± 1.2 a | 34.9 ± 0.7 a | −7.1 ± 0.5 a | 16.3 ± 1.2 a |
| Green-10 mM NaCl | 47.4 ± 4.0 a | 132.1 ± 14. b | 2421.1 ± 244.0 a | 61.5 ± 10.1 ab | 17.5 ± 0.8 b | 35.2 ± 0.1 a | −7.6 ± 0.6 a | 15.0 ± 0.3 a |
| Green-20 mM NaCl | 41.0 ± 2.4 a | 93.2 ± 13.5 c | 1648.1 ± 396.2 a | 43.8 ± 15.0 bc | 13.2 ± 2.0 bc | 37.4 ± 2.3 a | −7.3 ± 0.5 a | 16.4 ± 1.9 a |
| Green-30 mM NaCl | 36.4 ± 3.5 a | 50.5 ± 1.4 d | 607.0 ± 182.3 a | 17.3 ± 11.7 d | 6.5 ± 2.3 d | 36.3 ± 1.8 a | −5.1 ± 1.4 a | 13.3 ± 1.0 a |
| Red-1 mM NaCl | 42.6 ± 2.3 a | 144.2 ± 2.7 b | 3163.2 ± 169.3 a | 55.1 ± 2.2 b | 14.1 ± 0.5 bc | 22.9 ± 1.1 a | 5.1 ± 0.8 a | 0.2 ± 0.1 a |
| Red-10 mM NaCl | 40.4 ± 1.2 a | 133.3 ± 2.8 b | 2708.0 ± 90.5 a | 50.8 ± 2.5 b | 12.8 ± 0.1 c | 24.4 ± 0.4 a | 3.8 ± 0.6 a | 1.3 ± 0.8 a |
| Red-20 mM NaCl | 40.7 ± 2.9 a | 118.6 ± 13.6 bc | 2317.8 ± 288.0 a | 46.0 ± 9.2 bc | 13.0 ± 1.3 c | 28.4 ± 0.5 a | 4.1 ± 0.1 a | 2.3 ± 0.8 a |
| Red-30 mM NaCl | 33.7 ± 1.8 a | 88.2 ± 7.9 c | 1500.2 ± 208.6 a | 28.3 ± 5.9 cd | 7.4 ± 1.2 d | 27.9 ± 0.4 a | 4.9 ± 0.5 a | −0.4 ± 1.4 a |
| Source of Variance | Leaf Dry Matter (%) | Protein (g·kg−1 dw) | Mineral Elements (g·kg−1 dw) | |||||
|---|---|---|---|---|---|---|---|---|
| PO43− | K+ | Ca2+ | Mg2+ | SO42− | Na+ | |||
| Genotype (G) | *** | *** | ns | ** | *** | *** | ns | *** |
| Salinity (S) | *** | *** | ** | * | * | ** | ns | *** |
| C × S | *** | * | ns | ns | ns | ns | ns | ** |
| Genotype | ||||||||
| Green | 20.8 ± 0.4 a | 256.9 ± 5.1 a | 14.0 ± 0.8 a | 27.7 ± 0.6 b | 12.2 ± 0.3 a | 2.4 ± 0.13 a | 0.3 ± 0.0 a | 6.6 ± 1.4 a |
| Red | 19.1 ± 0.6 b | 234.7 ± 7.9 b | 12.6 ± 0.8 a | 29.0 ± 0.7 a | 7.1 ± 0.3 b | 1.7 ± 0.06 b | 0.3 ± 0.0 a | 3.4 ± 0.8 b |
| Salinity (mM NaCl) | ||||||||
| 1 | 17.2 ± 0.4 d | 277.8 ± 3.3 a | 16.2 ± 1.3 a | 30.3 ± 0.8 a | 8.4 ± 1.3 b | 2.3 ± 0.23 a | 0.3 ± 0.0 a | 0.2 ± 0.1 d |
| 10 | 19.2 ± 0.6 c | 254.6 ± 5.1 b | 13.9 ± 0.6 ab | 29.3 ± 1.0 a | 10.0 ± 1.3 a | 2.3 ± 0.22 a | 0.2 ± 0.0 a | 2.9 ± 0.7 c |
| 20 | 21.1 ± 0.2 b | 229.7 ± 7.0 c | 10.6 ± 0.4 bc | 27.1 ± 0.5 b | 10.0 ± 0.8 a | 1.9 ± 0.14 b | 0.2 ± 0.0 a | 7.4 ± 1.3 b |
| 30 | 22.0 ± 0.3 a | 220.9 ± 7.5 d | 12.2 ± 0.6 c | 26.5 ± 0.7 b | 10.1 ± 1.3 a | 1.7 ± 0.12 b | 0.3 ± 0.0 a | 9.4 ± 1.2 a |
| G × S | ||||||||
| Green-1 mM NaCl | 18.3 ± 0.2 c | 282.0 ± 2.1 a | 16.8 ± 2.1 a | 28.9 ± 0.6 a | 11.4 ± 0.1 a | 2.8 ± 0.29 a | 0.3 ± 0.0 a | 0.1 ± 0.0 d |
| Green-10 mM NaCl | 20.8 ± 0.1 b | 263.9 ± 6.0 b | 14.7 ± 0.8 a | 28.7 ± 1.9 a | 12.9 ± 0.6 a | 2.7 ± 0.22 a | 0.3 ± 0.0 a | 4.3 ± 0.8 c |
| Green-20 mM NaCl | 21.5 ± 0.4 ab | 244.4 ± 1.5 c | 10.9 ± 0.5 a | 26.5 ± 1.0 a | 11.8 ± 0.2 a | 2.2 ± 0.19 a | 0.2 ± 0.1 a | 10.1 ± 0.7 a |
| Green-30 mM NaCl | 22.4 ± 0.7 a | 237.1 ± 1.5 c | 13.4 ± 0.8 a | 26.1 ± 0.3 a | 12.8 ± 0.9 a | 2.0 ± 0.02 a | 0.3 ± 0.0 a | 11.8 ± 1.0 a |
| Red-1 mM NaCl | 16.1 ± 0.1 d | 274.0 ± 2.1 a | 15.5 ± 2.0 a | 31.7 ± 0.9 a | 5.4 ± 0.3 a | 1.9 ± 0.05 a | 0.2 ± 0.0 a | 0.3 ± 0.2 d |
| Red-10 mM NaCl | 17.6 ± 0.3 c | 245.3 ± 5.2 ab | 13.3 ± 0.9 a | 29.8 ± 1.3 a | 7.0 ± 0.2 a | 1.9 ± 0.15 a | 0.2 ± 0.1 a | 1.6 ± 0.3 d |
| Red-20 mM NaCl | 20.7 ± 0.1 b | 214.9 ± 4.0 c | 10.4 ± 0.7 a | 27.6 ± 0.4 a | 8.3 ± 0.3 a | 1.7 ± 0.05 a | 0.3 ± 0.1 a | 4.6 ± 1.0 c |
| Red-30 mM NaCl | 21.7 ± 0.1 ab | 204.7 ± 2.2 d | 11.5 ± 0.5 a | 26.8 ± 1.4 a | 7.5 ± 0.5 a | 1.5 ± 0.07 a | 0.3 ± 0.1 a | 7.1 ± 0.8 b |
| Source of Variance | Nitrate | Chlorophyll a | Rosmarinic Acid | Caffeic Acid | Sinapic Acid | Total Polyphenols |
|---|---|---|---|---|---|---|
| (mg·kg−1 fw) | (mg·g−1 dw) | (mg·g−1 dw) | (mg·g−1 dw) | (mg·g−1 dw) | (mg·g−1 dw) | |
| Genotype (G) | ns | ** | ns | ns | *** | *** |
| Salinity (S) | ** | ** | * | ns | ns | *** |
| C × S | * | ns | ns | ns | ns | ** |
| Genotype | ||||||
| Green | 1937.1 ± 209.1 a | 64.1 ± 5.1 b | 15.7 ± 1.4 a | 0.3 ± 0.0 a | 0.1 ± 0.0 b | 63.6 ± 3.0 b |
| Red | 1727.6 ± 209.0 a | 81.3 ± 8.2 a | 15.6 ± 1.8 a | 0.3 ± 0.0 a | 1.2 ± 0.0 a | 93.7 ± 2.0 a |
| Salinity (mM NaCl) | ||||||
| 1 | 2803.2 ± 205.2 a | 93.3 ± 12.6 a | 9.7 ± 2.0 b | 0.3 ± 0.0 a | 0.7 ± 0.3 a | 71.8 ± 6.6 c |
| 10 | 1859.7 ± 186.3 b | 73.0 ± 7.1 b | 18.4 ± 2.7 a | 0.3 ± 0.0 a | 0.7 ± 0.3 a | 89.7 ± 6.0 a |
| 20 | 1299.6 ± 123.4 c | 65.1 ± 6.6 b | 16.5 ± 0.8 a | 0.3 ± 0.0 a | 0.6 ± 0.2 a | 82.9 ± 6.2 b |
| 30 | 1366.8 ± 106.3 c | 58.8 ± 6.5 b | 18.1 ± 0.5 a | 0.3 ± 0.0 a | 0.6 ± 0.3 a | 70.3 ± 8.3 c |
| G × S | ||||||
| Green-1 mM NaCl | 2780.9 ± 397.3 a | 74.6 ± 0.6 a | 12.1 ± 3.4 a | 0.4 ± 0.0 a | 0.1 ± 0.0 a | 57.4 ± 2.3 f |
| Green-10 mM NaCl | 2259.3 ± 99.3 a | 71.4 ± 9.9 a | 14.7 ± 3.4 a | 0.3 ± 0.1 a | 0.1 ± 0.0 a | 76.3 ± 0.7 d |
| Green-20 mM NaCl | 1473.0 ± 158.0 b | 60.1 ± 12.4 a | 17.5 ± 0.4 a | 0.4 ± 0.0 a | 0.1 ± 0.0 a | 68.9 ± 0.6 e |
| Green-30 mM NaCl | 1235.2 ± 52.0 b | 50.4 ± 7.9 a | 18.5 ± 1.0 a | 0.2 ± 0.0 a | 0.1 ± 0.0 aa | 51.9 ± 2.7 g |
| Red-1 mM NaCl | 2825.6 ± 229.1 a | 112.0 ± 12.8 a | 7.2 ± 1.6 a | 0.3 ± 0.1 a | 1.3 ± 0.0 | 86.2 ± 1.5 c |
| Red-10 mM NaCl | 1460.1 ± 52.2 b | 74.6 ± 12.4 a | 22.1 ± 3.3 a | 0.4 ± 0.0 a | 1.2 ± 0.0 a | 103.1 ± 0.7 a |
| Red-20 mM NaCl | 1126.2 ± 145.3 b | 70.1 ± 6.4 a | 15.5 ± 1.5 a | 0.3 ± 0.1 a | 1.1 ± 0.1 a | 97.0 ± 0.3 b |
| Red-30 mM NaCl | 1498.5 ± 191.2 b | 67.5 ± 4.9 a | 17.4 ± 0.5 | 0.3 ± 0.1 a | 1.1 ± 0.1 a | 88.7 ± 1.0 c |
| Source of Variance | Aldehydes | Alcohols | Terpenes | Ketones | Diazole | Quinone | ||||||
|---|---|---|---|---|---|---|---|---|---|---|---|---|
| 2-hexenal | Benz-aldehyde | Perilla Aldehyde | 1-octen-3-ol | Durenol | β-linalool | Perillene | Caryophyllene | Perilla Ketone | Cis-jasmone | Imidazole 4-trifluoroacetyl | Thymo Quinone | |
| Genotype (G) | ns | *** | - | ns | - | * | - | * | - | - | - | - |
| Salinity (S) | ns | ns | ns | * | ns | ns | ns | ns | ** | ** | * | ns |
| C × S | ns | ns | - | ns | - | ns | - | ns | - | - | - | - |
| Genotype | ||||||||||||
| Green | 5.6 ± 1.3 a | 2.1 ± 0.4 b | n.d. | 4.2 ± 0.6 a | n.d. | 2.8 ± 0.2 b | 3.5 ± 0.5 | 4.7 ± 0.2 a | 51.5 ± 5.2 | 21.2 ± 3.0 | 4.3 ± 0.7 | n.d. |
| Red | 7.7 ± 1.6 a | 26.7 ± 3.7 a | 41.6 ± 2.7 | 5.2 ± 0.8 a | 2.9 ± 0.1 | 4.0 ± 0.5 a | n.d. | 3.6 ± 0.4 b | n.d. | n.d. | n.d. | 8.2 ± 1.0 |
| Salinity (mM NaCl) | ||||||||||||
| 1 | 4.1 ± 1.0 a | 21.3 ± 9.8 a | 18.1 ± 8.4 a | 3.6 ± 0.5 b | 1.4 ± 0.6 a | 2.6 ± 0.3 a | 2.9 ± 1.4 a | 4.0 ± 0.7 a | 21.6 ± 9.7 b | 9.0 ± 2.9 b | 2.8 ± 1.4 ab | 4.4 ± 2.2 |
| 10 | 4.4 ± 0.9 a | 12.7 ± 5.5 a | 25.9 ± 11.7 a | 2.8 ± 0.6 b | 1.5 ± 0.6 a | 2.7 ± 0.2 a | 1.0 ± 0.5 a | 3.8 ± 0.3 a | 38.7 ± 17.8 b | 12.8 ± 5.8 a | 1.5 ± 0.6 b | 2.5 ± 0.0 |
| 20 | 9.8 ± 2.5 a | 11.5 ± 4.3 a | 19.8 ± 9.0 a | 5.9 ± 1.2 a | 1.4 ± 0.6 a | 4.2 ± 0.7 a | 1.5 ± 0.7 a | 4.9 ± 0.6 a | 17.9 ± 8.2 a | 14.9 ± 6.7 a | 3.1 ± 1.4 a | 4.9 ± 2.3 |
| 30 | 8.2 ± 2.5 a | 12.1 ± 4.8 a | 19.3 ± 9.0 a | 6.4 ± 1.2 a | 1.3 ± 0.6 | 4.1 ± 0.5 a | 1.7 ± 0.7 a | 4.0 ± 0.3 a | 24.5 ± 11.0 b | 11.7 ± 5.2 a | 1.8 ± 0.8 b | 4.6 ± 2.1 |
| G × S | ||||||||||||
| Green-1 mM NaCl | 5.9 ± 1.5 a | 2.1 ± 0.5 a | n.d. | 3.8 ± 1.0 a | n.d. | 2.6 ± 0.1 a | 5.7 ± 1.5 | 5.0 ± 0.5 a | 43.3 ± 1.7 | 25.7 ± 1.8 | 5.7 ± 1.6 | n.d. |
| Green-10 mM NaCl | 3.3 ± 1.1 a | 1.4 ± 0.1 a | n.d. | 2.0 ± 0.5 a | n.d. | 2.2 ± 0.1 a | 2.1 ± 0.6 | 3.9 ± 0.4 a | 77.6 ± 9.5 | 18.0 ± 5.9 | 3.6 ± 1.3 | n.d. |
| Green-20 mM NaCl | 8.8 ± 4.9 a | 3.0 ± 1.7 a | n.d. | 4.5 ± 1.3 a | n.d. | 3.0 ± 0.5 a | 2.9 ± 0.7 | 5.6 ± 0.3 a | 35.9 ± 3.9 | 29.7 ± 2.3 | 6.3 ± 0.5 | n.d. |
| Green-30 mM NaCl | 4.4 ± 0.1 a | 1.9 ± 0.1 a | n.d. | 6.4 ± 1.3 a | n.d. | 3.4 ± 0.0 a | 3.3 ± 0.0 | 4.4 ± 0.1 a | 49.2 ± 0.5 | 23.3 ± 0.8 | 3.6 ± 0.1 | n.d. |
| Red-1 mM NaCl | 2.3 ± 0.5 a | 40.5 ± 10.8 a | 36.2 ± 5.3 | 3.4 ± 0.4 a | 2.9 ± 0.1 | 2.7 ± 0.7 a | n.d. | 3.0 ± 1.1 a | n.d. | n.d. | n.d. | 8.7 ± 2.5 |
| Red-10 mM NaCl | 5.4 ± 1.3 a | 24.0 ± 4.8 a | 51.8 ± 3.9 | 3.5 ± 0.9 a | 3.0 ± 0.1 | 3.3 ± 0.2 a | n.d. | 3.6 ± 0.7 a | n.d. | n.d. | n.d. | 5.1 ± 1.9 |
| Red-20 mM NaCl | 10.8 ± 2.4 a | 20.0 ± 4.5 a | 39.6 ± 3.4 | 7.2 ± 2.0 a | 2.9 ± 0.4 | 5.3 ± 1.1 a | n.d. | 4.1 ± 1.1 a | n.d. | n.d. | n.d. | 9.9 ± 1.8 |
| Red-30 mM NaCl | 12.1 ± 4.2 a | 22.4 ± 3.3 a | 38.7 ± 6.1 | 6.4 ± 2.3 a | 2.7 ± 0.2 | 4.8 ± 0.8 a | n.d. | 3.6 ± 0.7 a | n.d. | n.d. | n.d. | 9.2 ± 1.4 |
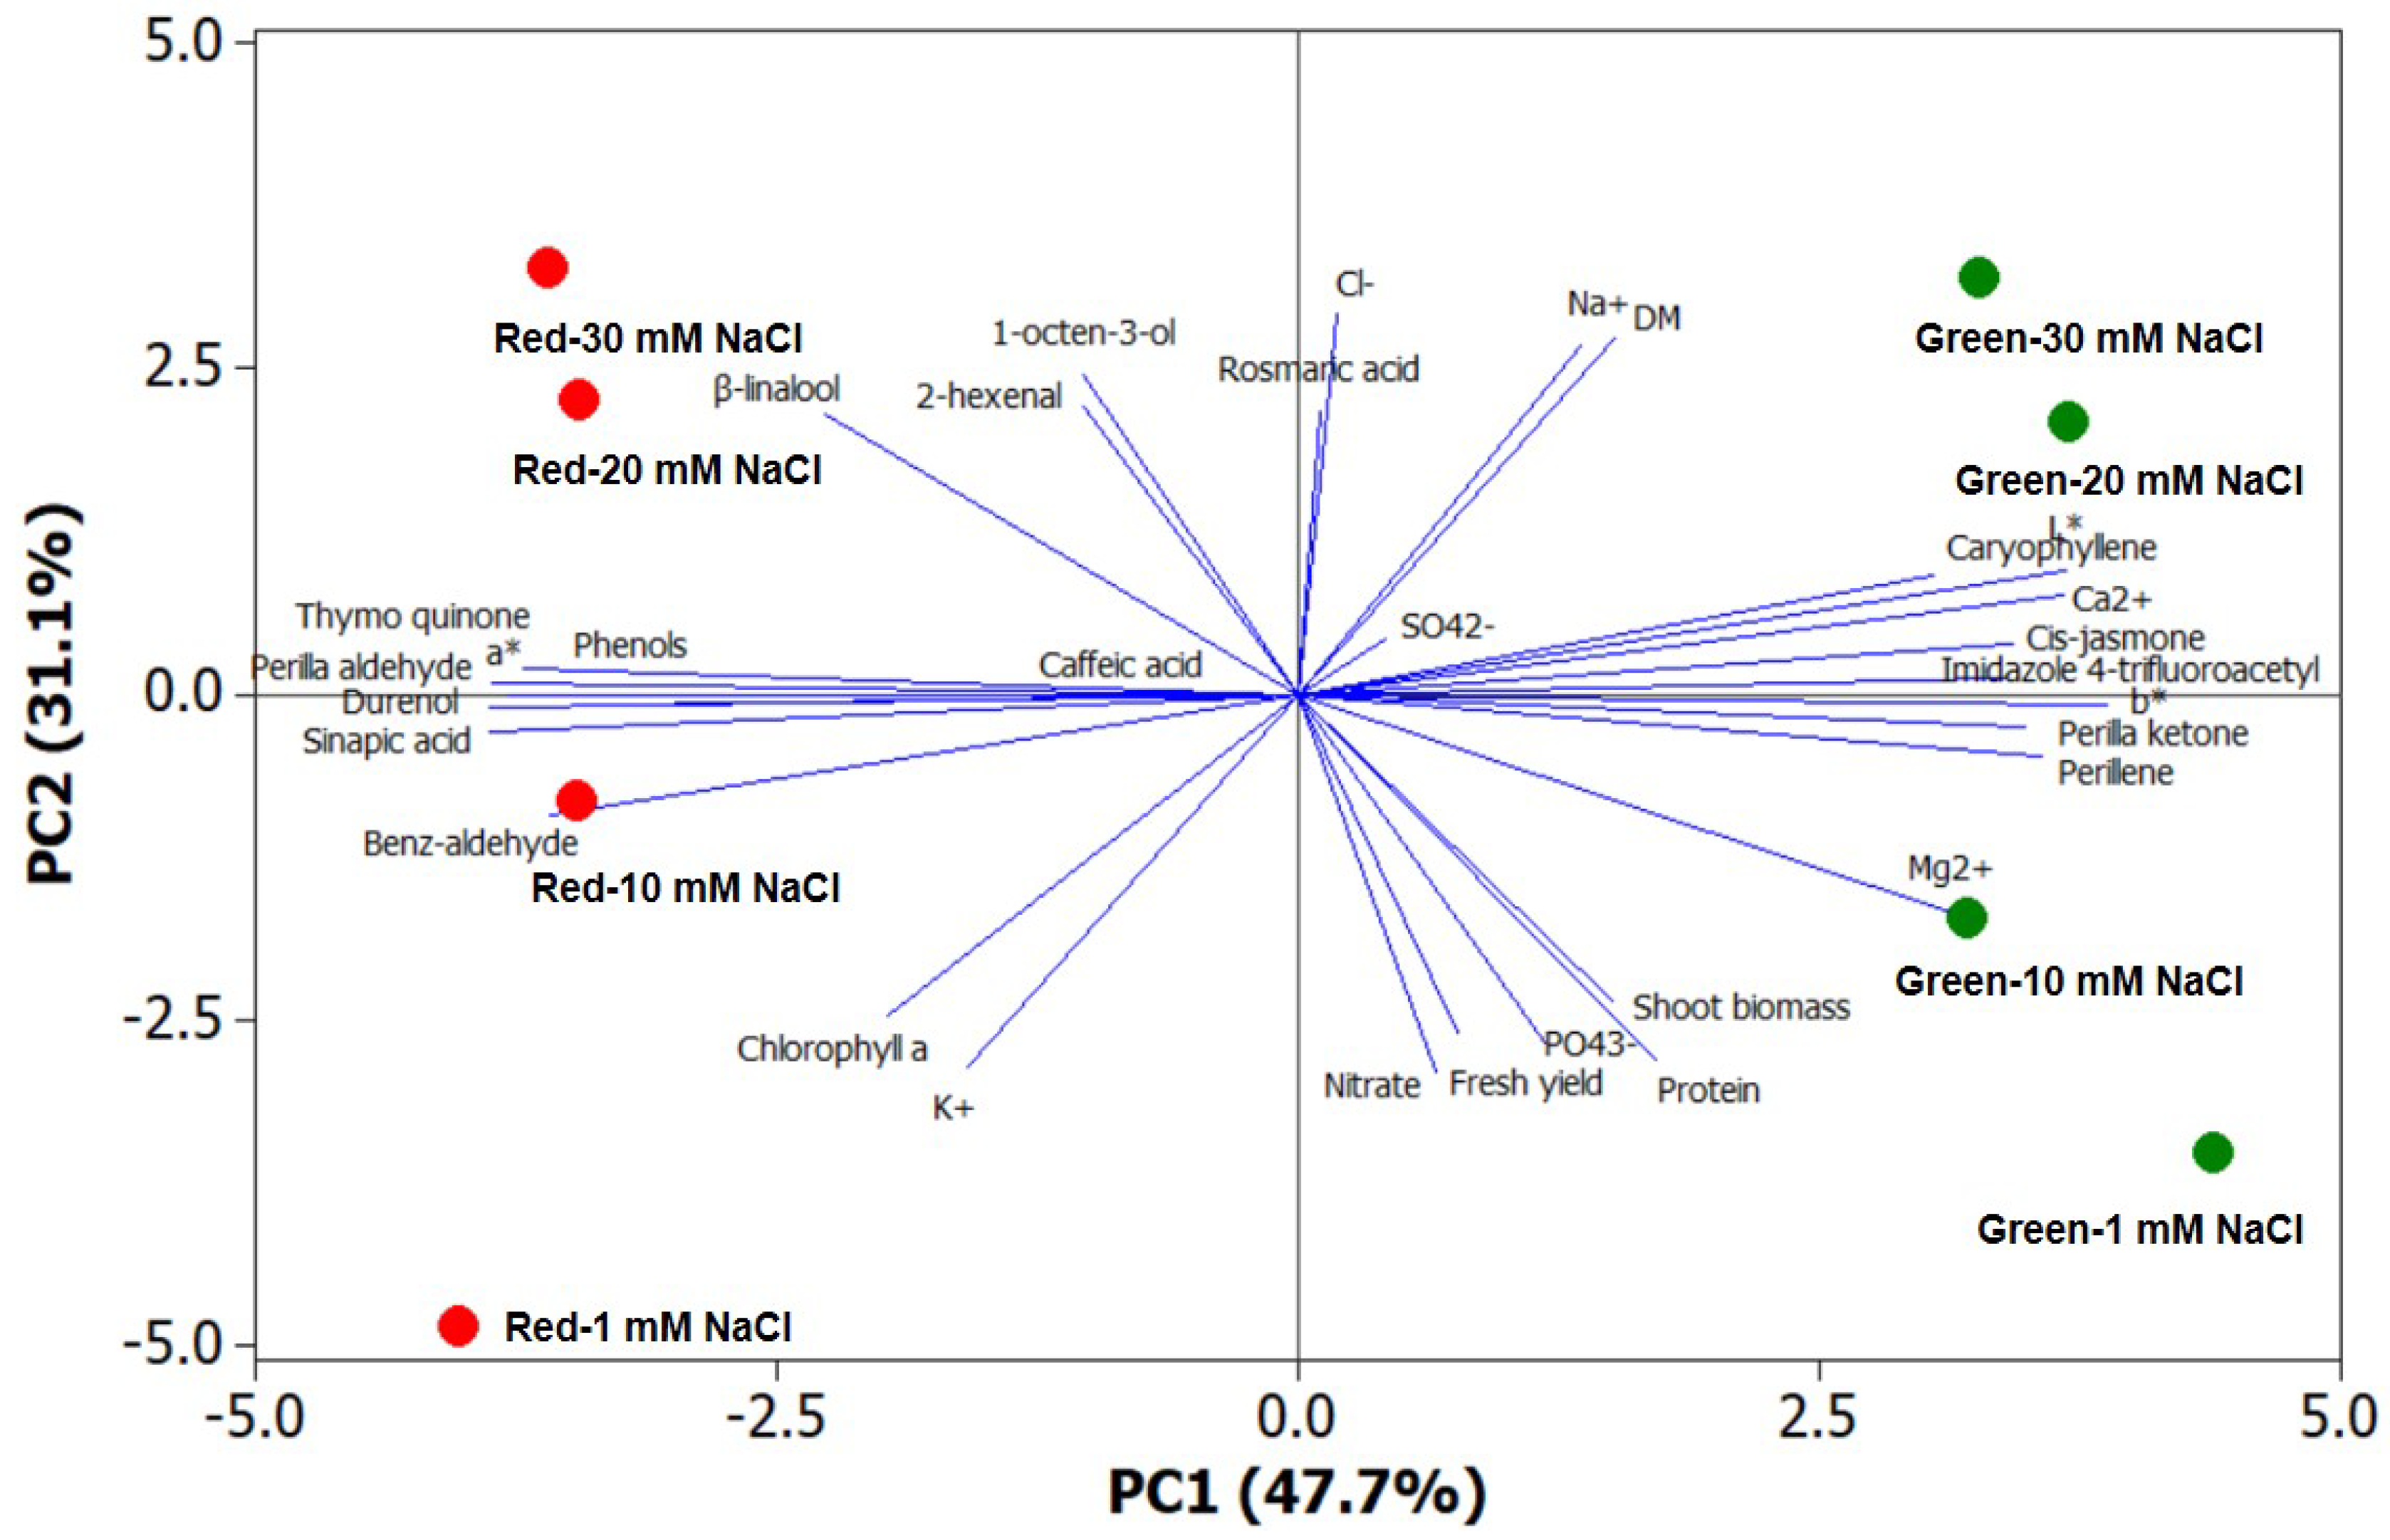
| Principal Components | PC1 | PC2 | PC3 |
|---|---|---|---|
| Eigenvalue | 15.3 | 10.0 | 2.6 |
| Percentage of variance | 47.7 | 31.2 | 8.2 |
| Cumulative variance | 47.7 | 78.9 | 87.1 |
| Eigen vectors a | |||
| Fresh yield | 0.208 | 0.808 | 0.498 |
| Shoot dry biomass | 0.383 | 0.735 | 0.505 |
| DM b | 0.318 | −0.891 | 0.034 |
| L* | 0.941 | −0.310 | 0.042 |
| a* | −0.991 | −0.019 | −0.005 |
| b* | 0.993 | 0.012 | 0.024 |
| PO43− | 0.310 | 0.843 | −0.133 |
| K+ | −0.397 | 0.905 | −0.092 |
| Ca2+ | 0.937 | −0.248 | −0.058 |
| Mg2+ | 0.809 | 0.518 | 0.157 |
| SO42− | 0.104 | −0.137 | 0.559 |
| Na+ | 0.340 | −0.849 | −0.336 |
| Cl− | 0.040 | −0.924 | −0.166 |
| Protein | 0.446 | 0.881 | −0.111 |
| Nitrate | 0.177 | 0.916 | 0.069 |
| Chlorophyll a | −0.498 | 0.783 | −0.148 |
| Rosmaric acid | 0.024 | −0.689 | 0.029 |
| Caffeic acid | −0.120 | 0.001 | 0.888 |
| Sinapic acid | −0.993 | 0.098 | 0.040 |
| Phenols | −0.872 | 0.027 | 0.202 |
| 2-Hexenal | −0.268 | −0.701 | 0.629 |
| Benzaldehyde | −0.917 | 0.301 | −0.130 |
| Perilla aldehyde | −0.969 | 0.008 | 0.097 |
| 1-Octen-3-ol | −0.272 | −0.771 | 0.067 |
| Durenol | −0.993 | 0.038 | 0.074 |
| β-Linalool | −0.586 | −0.0675 | 0.283 |
| Perillene | 0.914 | 0.139 | 0.159 |
| Caryophyllene | 0.777 | −0.302 | 0.347 |
| Perilla ketone | 0.892 | 0.071 | −0.169 |
| cis-Jasmone | 0.876 | −0.134 | 0.024 |
| 4-trifluoroacetylimidazole | 0.868 | −0.053 | 0.164 |
| Thymoquinone | −0.952 | −0.055 | 0.127 |
© 2019 by the authors. Licensee MDPI, Basel, Switzerland. This article is an open access article distributed under the terms and conditions of the Creative Commons Attribution (CC BY) license (http://creativecommons.org/licenses/by/4.0/).
Share and Cite
Rouphael, Y.; Kyriacou, M.C.; Carillo, P.; Pizzolongo, F.; Romano, R.; Sifola, M.I. Chemical Eustress Elicits Tailored Responses and Enhances the Functional Quality of Novel Food Perilla frutescens. Molecules 2019, 24, 185. https://doi.org/10.3390/molecules24010185
Rouphael Y, Kyriacou MC, Carillo P, Pizzolongo F, Romano R, Sifola MI. Chemical Eustress Elicits Tailored Responses and Enhances the Functional Quality of Novel Food Perilla frutescens. Molecules. 2019; 24(1):185. https://doi.org/10.3390/molecules24010185
Chicago/Turabian StyleRouphael, Youssef, Marios C. Kyriacou, Petronia Carillo, Fabiana Pizzolongo, Raffaele Romano, and Maria Isabella Sifola. 2019. "Chemical Eustress Elicits Tailored Responses and Enhances the Functional Quality of Novel Food Perilla frutescens" Molecules 24, no. 1: 185. https://doi.org/10.3390/molecules24010185