1. Introduction
Bioactive compounds are molecules that have health benefits on living organisms, tissues or cells, being comprised of a wide range of classes, such as vitamins, carotenoids (lycopene, β-carotene and xanthophylls) and phenolic compounds [
1]. These compounds are present in a wide range of foods (e.g., fruits, vegetables, plants and other food products) and its ingestion enables the induction of positive effects in the prevention and treatment of many human diseases, such as anxiety, insomnia, anorexia, cough and bronchitis [
2].
Throughout the years, phenolic compounds have been largely studied in several foods, namely edible plants, due to their therapeutic capabilities in pathologies related to the nervous and gastrointestinal systems [
3]; they also exhibit antioxidant, antitumor, anti-inflammatory and antiviral properties [
1]. These molecules are characterized by being a very heterogeneous group of a great variety of compounds, such as phenolic acids, coumarins, flavonoids, stilbenes, hydrolysable and condensed tannins, lignans and lignins [
3,
4]. Flavonoids are one of the most abundant groups within phenolic compounds; their main mechanism of action goes through their ability of capturing reactive oxygen species and chelate metal ions, having a distinct antioxidant action [
4]. Thus, the ingestion of antioxidants can significantly control the severity of chronic diseases, providing a close relationship between the uptake of free radicals and the involvement of endocrine responses. Therefore, the inclusion of antioxidants in the diet for the prevention of chronic diseases and for an improvement of general health, has been an important research target in recent decades [
5].
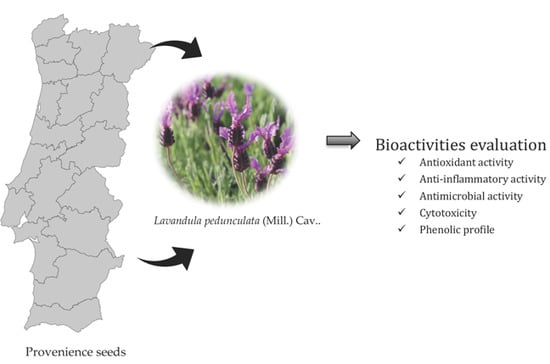
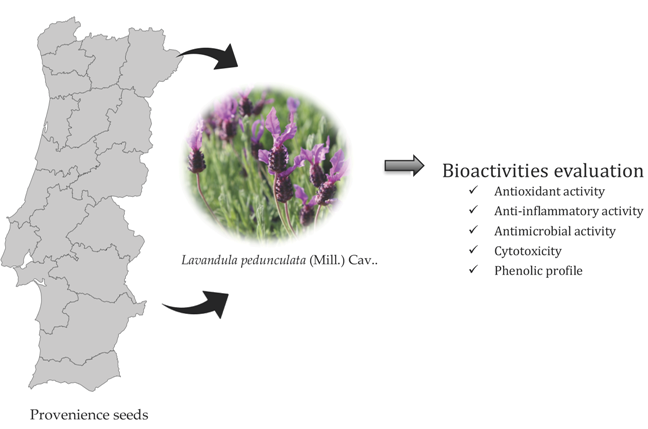
Lavandula pedunculata (Mill.) Cav. (common English name French lavender and known in Portugal as rosmaninho, arçã, rosmaninho maior or lavanda), is a species belonging to the Lamiaceae which is native to the Iberian Peninsula, North Africa and Turkey [
6,
7,
8]. In the Iberian Peninsula, this species has a widespread distribution and significant ethnobotanical uses documented [
6,
9]. It is considered the most resistant of all species of the
Lavandula genus, well adapted to continental climates, especially to annual variation in temperature (hot summers and cold winters), growing in altitudes up to 1700 m [
6,
9]. In the context of traditional medicine,
L. pedunculata has been used in infusions for internal and external applications, mainly recommended for the respiratory and digestive systems and as a therapeutic agent with antiseptic action for cleaning wounds [
6,
10].
Wild plant genetic resources, particularly of medicinal and aromatic species, have received increased interested worldwide. Besides
L. pedunculata traits and potential use in different domains (e.g., as source of bioactive compounds), this endemic species had poor representation in germplasm collections and has not been comprehensively characterized [
8]. Therefore, the Portuguese Genebank (BPGV) carried out in 2009, several collecting missions of
Lavandula germoplasm in different regions of the national territory, including
L. pedunculata [
8]. The main purpose was to collect plant diversity, promoting ex situ conservation and providing morphological, molecular, chemical, and biochemical information (germplasm characterization); the seeds of several wild populations (genebank accessions) were stored at the BPGV facilities, in Braga, Portugal [
8].
As bioactive molecules are often produced in response to changes in the surrounding environment, the same plant species growing at different sites may have different concentrations of the most promising compounds, or even different compounds in their constitution [
11]. Germplasm accessions conserved at genebanks might generate very good matrices to evaluate useful characteristics and bioactive properties, because they correspond to stored plant materials of the same species but of different provenance. Moreover, genebanks procedures, such as germplasm characterization, provide the description of plant germplasm and determine the expression of highly heritable characters ranging from morphological, agronomical, chemical features to bioactive properties or molecular markers.
The aim of the present study was to evaluate the phenolic profile of the hydroethanolic and aqueous extracts of thirteen Lavandula pedunculata (Mill.) Cav. samples, whose seeds originated from different regions of Portugal, and are conserved ex-situ in the Portuguese Genebank. The bioactive properties were explored in terms of antioxidant, anti-inflammatory, cytotoxicity and antimicrobial potential. Furthermore, the study also addressed L. pedunculata germoplasm characterization (e.g., chemical and biochemical characteristics), contributing with relevant data about the studied accessions, enabling eventual discrimination among them, resulting in better insight about the composition of the germplasm collection and its genetic diversity.
2. Results
2.1. Phenolic Compounds
Data related to the phenolic compounds identification (retention time, λmax in the visible region, molecular ion, main fragment ions in MS
2, and tentative identification) obtained by HPLC-DAD-ESI/MSn analysis of
Lavandula pedunculata (Mill.) Cav. samples are presented in
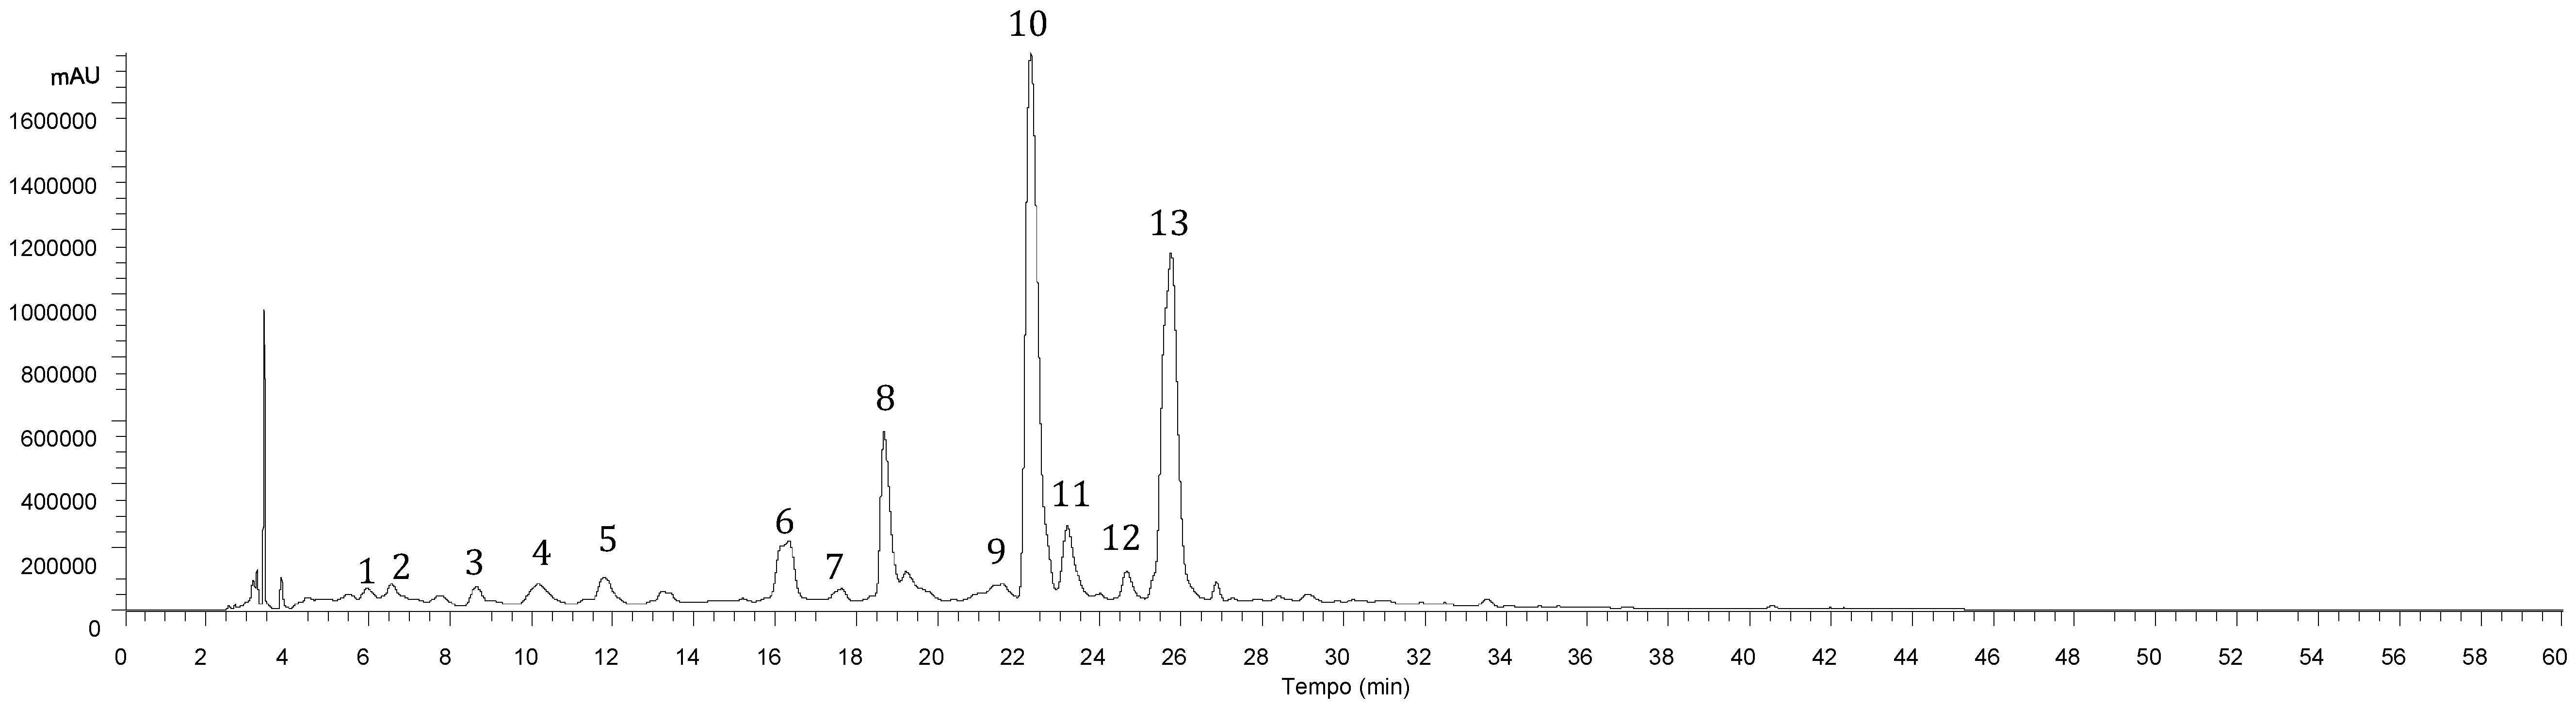
Table 1. All samples presented a similar profile (
Figure 1), revealing the presence of thirteen phenolic compounds, in both hydroethanolic and aqueous extracts, being nine identified as phenolic acids (mainly caffeic acid dimers, trimers and tetramers) and four flavonoids (mainly luteolin and eriodictyol glycoside derivatives).
Caffeic acid (compound
4), luteolin-7-
O-glucuronide (compound
8) and rosmarinic acid (compound
10) were positively identified by comparison with commercial standards. Rosmarinic acid has been one of the main compounds previously identified in
Lavandula species [
3,
12,
13,
14,
15]. Compounds
1 and
2,
3 and
7 were identified as caffeic,
p-coumaric and rosmarinic acid hexosides, based on the respective fragment ions released at
m/
z 179 [caffeic acid-H]
−, 163 [coumaric acid-H]
− and 359 [rosmarinic acid-H]
− after loss of a hexosyl moiety (−162 mu). With the exception of rosmarinic acid hexoside, the mentioned compounds have been found in
Lavandula x intermedia Emeric ex Loiseleur) Waste [
12].
Compound
9 ([M − H]
− at
m/
z 719) released a main MS
2 fragment at
m/
z 359 ([M − 2H]
2−, rosmarinic acid), which allowed its identification as sagerinic acid [
16]. Compound
11 ([M − H]
− at
m/
z 537) presented a similar UV spectrum and fragmentation pattern, consistent with the caffeic acid trimer lithospermic acid A [
16,
17,
18]. Other identities, with the same molecular weight (salvianolic acids H/I), were discarded because they present quite a different fragmentation pattern [
18,
19]. Thus, being assigned to lithospermic acid A. Compound
13 ([M − H]
− at
m/
z 717) presented a fragmentation pattern with successive losses of 198 mu (danshensu) or 180 mu (caffeic acid) units, coherent with salvianolic acid B (also known as lithospermic acid B) [
18,
19]. These compounds have not been previously identified in
Lavandula species, to the best of the authors’ knowledge.
The remaining compounds correspond to glycosylated flavones. Compound
5 ([M − H]
− at
m/
z 623) MS
2 fragments revealed the alternative loss of hexosyl (
m/
z at 461; −162 u) and glucuronyl (
m/
z at 285; −176 u) residues, indicating location of each residue on different positions of the aglycone. No information about the identity of the sugar moieties and location on the aglycone could be obtained, so, the compound was identified as luteolin-
O-hexosyl-
O-glucuronide [
20]. Compound
6 ([M − H]
− at
m/
z 463) was identified as a eriodictyol derivative, due to its UV-Vis spectra and MS fragmentation. This peak revealed the loss of glucuronyl (−176 u), therefore being assigned as eriodictyol-
O-glucuronide [
21]. Compound
12 ([M − H]
− at
m/
z 623) presented 42 u higher then compound 8, thus being assigned to methylluteolin-
O-glucuronide [
21]. Also, to the best of our knowledge, these compounds have not been previously identified in
Lavandula species.
In a previous study performed by Costa et al. [
3], using polar extracts from
Lavandula pedunculata subsp. lusitanica, six different phenolic compounds were detected (3-
O-caffeoylquinic acid, 4-
O-caffeoylquinic acid, 5-
O-caffeoylquinic acid, rosmarinic acid, luteolin and apigenin), nonetheless, only rosmarinic acid was the common phenolic acid identified, but revealed smaller amounts. However, also in this case, this compound proved to be the majority, in the hydroethanolic and ethanolic extracts. The differences observed between the different samples could be explained, due to the influence that the geographical area has on the chemical composition of plants, namely at the level of soil composition, climacteric environment, air humidity and daily sun exposure [
11]. Moreover, to the best of the authors’ knowledge, and with the exception of the previous mentioned authors, there are no more reports describing the phenolic composition of
L. pedunculata (Mill.) Cav.
Phenolic acids represent a significant part of this phenolic profile (
Table 2), highlighting salvianolic acid B (compound
13) and rosmarinic acid (compound
10) as the major phenolic compounds present in both types of extracts. Regarding flavonoids, luteolin-7-
O-glucuronide (compound
8) was the main compound present (
Table 2). In general, the aqueous extract revealed the highest content in phenolic compounds, revealing sample 8 (Ponte de Sôr, Portalegre) the highest concentration in total phenolic acids, flavonoids and total phenolic compounds for both the studied extracts. This difference could be explained to the chemical composition that each of the seeds initially presented and due to their different geographic origin.
2.2. Antioxidant Potential
The antioxidant activity of
L. pedunculata hydroethanolic and aqueous extracts was evaluated using different in vitro assays (DPPH radical-scavenging activity, reducing power, inhibition of β-carotene bleaching and inhibition of lipid peroxidation—TBARS) and the results are present in
Table 3. All samples, for both of the studied extracts, revealed antioxidant potential, EC
50 values between 530–14 μg/mL and 1833–17 μg/mL for aqueous and hydroethanolic extract, respectively. In general, there is not a large divergence regarding EC
50 values between the hydroethanolic and aqueous extracts. Accordingly, for aqueous extracts, sample 4 (Bragança) revealed the highest DPPH scavenging activity (EC
50 = 68.0 μg/mL), while sample 2 (Évora) revealed the highest reducing power (EC
50 = 51 μg/mL). For the β-carotene bleaching inhibition assay, samples 2 (Évora) and 10 (Castelo de Vide, Portalegre), with values of 253 and 236 μg/mL, respectively, revealed the highest potential. On the other hand, sample 1 (Marvão, Portalegre) revealed the highest antioxidant potential for the TBARS inhibition assay (14 μg/mL).
Otherwise, hydroethanolic extracts of samples 10 (Castelo de Vide, Portalegre), 11 (Elvas, Portalegre), 12 (Castelo de Vide, Portalegre), and 13 (Bragança) showed the lowest EC50 values for the β-carotene bleaching inhibition assay, presenting values of 252, 190, 223 and 214 μg/mL, respectively. Additionally, in the hydroethanolic extracts, samples 8 (Ponte de Sôr, Portalegre), 9 (Évora), and 2 (Évora) showed the highest antioxidant capacity for the DPPH scavenging activity, reducing power and TBARS inhibition assays, respectively. The highest EC50 values (lowest antioxidant activity) were detected in sample 13 (Bragança) for DPPH scavenging activity (257 μg/mL) and reducing power (216 μg/mL), in sample 8 for β-carotene bleaching inhibition (1833 μg/mL), and in samples 6 (Portalegre) and 11 (Elvas, Portalegre) in TBARS inhibition (63.5 and 62 μg/mL, respectively).
These results are in agreement with those found by Costa et al. [
3], where the antioxidant potential
L. pedunculata was evaluated by TBARS assay and at the highest concentration tested (5 mg/mL), the infusion, water and water:ethanol extracts completely prevented MDA production.
In a study performed by Pereira et al. [
15], the antioxidant activity of different extracts (n-hexane, dichloromethane, ethyl acetate, methanol and water) of
L. pedunculata was evaluated regarding the lipid peroxidation index (%), obtaining values that ranged from 26 to 41%. Moreover, Ferreira et al. [
23] tested the ethanolic extracts and decoctions of
L. pedunculata using the DPPH and β-carotene inhibition methods, in which these samples revealed antioxidant activity, presenting values between 93 and 20 mg/mL, respectively. Baptista et al. [
24], also studied the antioxidant potential for the essential oils and extracts of two native Portuguese
Lavandula species (
L. stoechas subsp. luisieri and
L. pedunculata) and considering the results obtained, there is some similarity in the results of the methanolic and aqueous extract, in comparison with the concentrations obtained in our study.
2.3. Anti-Inflammatory Activities
The in vitro anti-inflammatory results are present in
Table 3. In general, hydroethanolic extracts revealed more promising anti-inflammatory potential (EC
50 values ranging from 216 to 124 μg/mL), showing lower EC
50 values than the aqueous extracts (EC
50 values ranging between 140 to 301 μg/mL). Moreover, there were several samples that did not show anti-inflammatory activity (EC
50 > 400 μg/mL), being the absence of this bioactivity higher for the aqueous samples. The samples that presented this activity were samples 4 (Bragança), 5 (Arronches. Portalegre), 7 (Nisa, Portalegre), 8 (Ponte de Sôr, Portalegre), 9 (Évora), and 13 (Bragança) in hydroethanolic extract, and samples 1 (Marvão, Portalegre), 2 (Évora), 3 (Vila Viçosa, Évora), 6 (Portalegre), 9 (Évora), 10 (Castelo de Vide, Portalegre), 11 (Elvas, Portalegre), 12 (Castelo de Vide, Portalegre), and 13 (Bragança) for the aqueous extracts.
Sample 6 hydroethanolic extract (Portalegre) presented the highest anti-inflammatory potential (124 μg/mL), while for the aqueous extract, sample 8 (Ponte de Sôr, Portalegre) revealed the highest efficiency, presenting a concentration of 140 μg/mL. Similarly, Algieri et al. [
25] studied the anti-inflammatory activity of
L. stoechas hydromethanolic extract, which also exhibited a significantly inhibition of carrageenan-induced paw edema in mice. Therefore, the hydroethanolic extracts could also be considered as a good source of anti-inflammatory molecules.
2.4. Cytotoxicity
Table 4 summarizes the effects of
L. pedunculata hydroethanolic and aqueous extracts (infusions) on the inhibition of the growth of four human tumor cell lines (MCF-7, NCI-H460, HeLa and HepG2). In this study, it was evident the cytotoxic activity of
L. pedunculata in all the cell lines tested, ranging values between 374–82 μg/mL and 340–34 μg/mL, for aqueous and hydroethanolic extracts, respectively. Comparing the two types of studied extracts, the aqueous extracts showed anti-proliferative potential in more samples and in more cell lines, however it was the hydroethanolic extract that, overall, showed a higher cytotoxic potential, i.e., lower GI
50 values (34 μg/mL). Sample 6 (Portalegre) hydroethanolic extract presented the best cytotoxic potential in MCF-7 (values ranged from 53 to 236 μg/mL) and HepG2 (values between from 34 and 212 μg/mL) cell lines. On the other hand, sample 12 (Castelo de Vide, Portalegre) showed a higher antiproliferative capacity in NCI-H460 cell line (GI
50 values = 119 μg/mL); and sample 10 (Castelo de Vide, Portalegre) showed a lower GI
50 value in the HeLa cell line (62 μg/mL). In hydroethanolic extract, sample 6, 12 and 13 (Bragança) revealed lower antiproliferative capacity in NCI-H460 (340 μg/mL), MCF-7 (236 μg/mL) and HeLa (222 μg/mL) cell lines, respectively; in HepG2 cell line were samples 7 (Nisa, Portalegre) and 13 that evidenced a lower, with GI
50 values of 212 and 204 μg/mL, respectively.
On the other hand, the aqueous extract of sample 9 (Évora) revealed a better cytotoxic potential in MCF-7 and HepG2 cell lines, with values of 150 and 118 μg/mL, respectively. In the NCI-H460 cell line, the values ranged from 374 and 113 μg/mL, highlighting sample 4 (Bragança) with the highest antiproliferative activity. Meanwhile, for HeLa cell line, sample 12 (Castelo de Vide, Portalegre) showed the lowest GI50 value (82 μg/mL).
The cytotoxicity in non-tumor cells were tested using a primary culture cell line obtained from porcine liver (PLP2 cell culture) and was used as a preliminary toxicity model for normal cells. None of the samples showed toxicity (GI50 > 400 μg/mL), with the exception of hydroethanolic extract of sample 12 (Castelo de Vide, Portalegre), and aqueous extracts of sample 7 (Nisa, Portalegre), 8 (Ponte de Sôr, Portalegre) and 9 (Évora). However, the presented concentrations are much higher than those obtained for the antiproliferative inhibition using the studied tumor cell lines.
Despite being the same plant species, it is normal the existence of different results. The geographical origin of the seeds is one of the factors that can directly influence the chemical and nutritional composition of plants due to biotic and abiotic factors [
11], thus, in this case, as the seeds were harvested from different areas, this factor could lead to the observed oscillations in the bioactive potential.
There are few cytotoxicity studies carried out using this species, however the results described in literature revealed lower cytotoxic potential, when compared to our results. According to Pereira et al. [
15], the results obtained with
L. pedunculata methanolic extracts suggest that for concentrations up to 15 µg/mL and an incubation period of 24 h, no relevant cytotoxic effects were observed. Tang et al. [
26], tested five human tumor cell lines (NB4, A549, SHSY5Y, PC3, and MCF7) using the methanolic extract of
L. angustifolia, showed a weak inhibitory activity against the tested human tumor cell lines (IC
50 values ranging from 2.2–8.2 mM).
2.5. Antimicrobial Activity
The results on antibacterial and antifungal activities of
L. pedunculata hydroethanolic and aqueous extracts are presented in
Table 5. The samples were tested against a panel of eight bacteria and fungi strains, specifically selected on the basis of their importance to public health.
For antibacterial activity of the hydroethanolic extracts, samples 1 (Marvão, Portalegre) and 5 (Arronches, Portalegre) revealed a higher activity (lower MICs) for all the studied strains. In these cases, MIC values range from 20 µg/mL in sample 1 for the
Staphylococcus aureus strain and 40 µg/mL in sample 5 for the
Enterobacter cloacae strain. The lowest MBC values were observed for samples 1 and 3 (Vila Viçosa, Évora) in the inhibition of
Staphylococcus aureus strain (40 µg/mL). In the evaluation of
L. pedunculata aqueous extracts, sample 5 showed the lowest MIC and MBC, being more potent for
Bacillus cereus strain (MIC = 75 µg/mL and MBC = 150 µg/mL), along with the MBC of sample 8 (Ponte de Sôr, Portalegre) in
Escherichia coli strain (also 150 µg/mL). These results are in agreement with previous studies, where other plants species also showed antimicrobial activity: for example,
Castanea sativa Mill. flowers [
27],
Alnus rugosa L. aerial parts [
28], and
Veronica urticifolia Jacq. [
29]. Nikolic et al. [
30] studied the essential oils of different
Thymus species, such as
T. serpyllum,
T. algeriensis and
T. vulgaris, which showed antimicrobial activity. However, to the best of the author’s’ knowledge there are no studies reporting the antibacterial activity of the studied
Lavandula species.
Considering the antifungal activity, for hydroethanolic extracts, all samples revealed inhibitory and fungicidal activity. Sample 3 showed the best MIC values for all the tested strains, with the exception of Aspergillus versicolor and Aspergillus ochraceus, where samples 2 and 9 revealed the highest potential, respectively. Regarding the MFC, in general, most of the samples revealed promising results, being better for sample 13 aqueous extract. In the case of aqueous extracts, only a few samples showed activity in all the studied strains, meanwhile samples 2, 11, 12 and 13 showed inhibitory and fungicidal potential for all the studied fungi strains. Samples 9 and 11 presented the highest inhibitory capacity for all the fungal strains analysed. The best fungicide capacity was evident in sample 11 against Aspergillus versicolor strain.
The antifungal potential is, also, in agreement with other studies regarding antifungal activity of other plant species, which were carried out by other authors, such as
Castanea sativa [
27] and
Alnus rugosa [
28]. Once more, to the best of the authors’ knowledge, there are no previous studies on the antifungal activity of
L. pedunculata.
3. Materials and Methods
3.1. Samples and Samples Preparation
The studied samples concern plant materials (the top 20 cm of the flowering stems with inflorescences) randomly harvested in each of thirteen field plots of Lavandula pedunculata (Mill.) Cav. (botanical family Lamiaceae) grown at the Portuguese Genebank (Banco Português de Germoplasma Vegetal, BPGV).
The Portuguese Genebank conserves ex situ, using cold temperatures (e.g., 5–6 °C), a collection of medicinal and aromatic plants, including species of the genus
Lavandula. The col, lection consists of seed samples (accessions) of wild specimens that have been randomly collected in different natural populations within several Portuguese regions [
8].
For this study, the stored seeds of thirteen accessions of L. pedunculata, of the BPGV collection were sown and the plantlets transplanted outdoor to thirteen field plots, in BPGV farm at S. Pedro de Merelim, Braga, Northern Portugal (GPS coordinates 41°34’28.01’’ N; 8°27’09.21’’ S).
In 2015, the flowering parts in blossom of each accession grown were harvested, kept in paper bags at −20 °C, corresponding individually to a sample. Each sample of plant material (approximately 200 g) was subsequently lyophilized (FreeZone 4.5, Labconco, Kansas City, MO, USA), reduced to a fine dried powder (~20 mesh) and mixed to obtain a homogenate sample, corresponding to a total of thirteen different samples.
The thirteen studied accessions of
L. pedunculata were gathered wild in two Portuguese regions, Alentejo and Trás-os-Montes (
Table 6), altitude range between 100 and 1000 m [
8]. This species has several synonymies such as
Lavandula eliasii Sennen,
Lavandula pedunculata subsp.
pedunculata,
Lavandula stoechas subsp.
pedunculata (Mill.) Samp. ex Rozeira,
Lavandula stoechas subsp.
lusitanica (Chaytor) Rozeira, and
Stoechas pedunculata Mill. [
9].
The hydroethanolic extracts were obtained from the lyophilized plant material. The dried sample was extracted following a procedure previously described by Pereira et al. [
31]. A solution of ethanol/water (80:20
v/
v) (25 mL) was added to 1 g of sample and stirring for 1 h (25 °C at 150 rpm) and subsequently filtered through Whatman No. 4 paper. The residue was then re-extracted with an additional portion of 25 mL of the same solution (25 °C at 150 rpm) during 1 h. The combined extracts were evaporated to remove the ethanolic fraction (at 40 °C) and then the water was frozen and lyophilized.
The aqueous extracts (infusions) preparation was established according a study performed by Pereira et al. [
31]. Powdered samples (2 g) were added to 200 mL of boiling distilled water, left to stand at room temperature for 5 min, and then filtered under reduced pressure, frozen and lyophilized.
3.2. Standards and Reagents
Acetonitrile 99.9% was of HPLC grade from Fisher Scientific (Lisbon, Portugal). Phenolic compound standards (caffeic acid ≥ 99%, p-coumaric acid ≥ 90%; hesperetin ≥ 99%, luteolin-7-O-glucoside ≥ 99%, quercetin-3-O-glucoside ≥ 99%, rosmarinic acid ≥ 99% HPLC purity) were from Extrasynthese (Genay, France). Trypan blue, lipopolysaccharide (LPS), dexamethasone, acetic acid, formic acid, ellipticine, sulforhodamine B (SRB), trichloroacetic acid (TCA) and Tris were all purchased from Sigma-Aldrich (St. Louis, MO, USA). Dulbecco’s modified Eagle’s medium was purchased from HyClone. RAW264.7 cells were acquired from ECACC (‘‘European Collection of Animal Cell Culture”) (Salisburg, UK), Griess reagent system kit was purchased from Promega, Fetal bovine serum (FBS), L-glutamine, Hank’s balanced salt solution (HBSS), trypsin-EDTA (ethylenediaminetetraacetic acid), penicillin/streptomycin solution (100 U/mL and 100 mg/mL, respectively), RPMI-1640 and DMEM media were from Hyclone (Logan, UT, USA). Water was treated in Milli-Q water purification system (TGI Pure Water Systems, Greenville, SC, USA).
3.3. Analysis of Phenolic Compounds
The lyophilized extracts were re-dissolved at 5 mg/mL in ethanol/water (20:80,
v/
v) and 100% water for hydroethanolic and aqueous extract, respectively, and filtered through a 0.22-µm disposable LC filter disk. Chromatographic analyses were performed in a Dionex Ultimate 3000 UPLC (Thermo Scientific, San Jose, CA, USA) system equipped with a diode array detector (DAD) coupled to an electrospray ionization mass detector (LC-DAD-ESI/MSn) as previously described by Bessada et al. [
32].
Chromatographic separation was achieved with a Waters Spherisorb S3 ODS-2 C18 (3 μm, 4.6 mm × 150 mm, Waters, Milford, MA, USA) column thermostatted at 35 °C. The solvents used were: (A) 0.1% formic acid in water; (B) acetonitrile (HPLC purity). The elution gradient established was isocratic 15% B (5 min), 15% B to 20% B (5 min), 20-25% B (10 min), 25–35% B (10 min), 35–50% B (10 min), and re-equilibration of the column, using a flow rate of 0.5 mL/min. Double online detection was carried out in the DAD using 280, 330, 370 and 520 nm as preferred wavelengths and in a mass spectrometer (MS) connected to HPLC system via the DAD cell outlet.
MS detection was performed in negative mode, using a Linear Ion Trap LTQ XL mass spectrometer (Thermo Finnigan, San Jose, CA, USA) equipped with an ESI source. Nitrogen served as the sheath gas (50 psi); the system was operated with a spray voltage of 5 kV, a source temperature of 325 °C, a capillary voltage of −20 V. The tube lens offset was kept at a voltage of −66 V. The full scan covered the mass range from m/z 100 to 1500. The collision energy used was 35 (arbitrary units). Data acquisition was carried out with Xcalibur® data system (Thermo Finnigan, San Jose, CA, USA).
Compounds were carefully identified comparing the obtained information: retention times, UV-vis and mass spectra, with those obtained from standard compounds, when available. Otherwise, compounds were tentatively identified comparing the obtained information with available data reported in the literature. For the quantification, a calibration curve was constructed for each available phenolic standard based on the UV signal (maximum absorption of each standard compound lambda max). When a commercial standard was not available, the quantification was performed through the calibration curve of the most similar available standard. The results were expressed as mg/g of extract.
3.4. Evaluation of the Antioxidant Activity
The lyophilized extracts were re-dissolved in ethanol/water (80:20 v/v) and water for hydroethanolic and aqueous extracts, respectively (final concentration 10 mg/mL), and submitted to various in vitro colorimetric assays (DPPH radical-scavenging activity, reducing power, inhibition of β-carotene bleaching and inhibition of lipid peroxidation—TBARS).
DPPH radical-scavenging activity was performed using an ELX800 Microplate Reader (Bio-Tek). The reaction mixture in each one of the 96-wells consisted of one of the different concentrations of the extracts (30 µL) and the methanolic solution containing DPPH radicals (6 × 10⁻⁵ mol/L, 270 µL). The mixture was left to stand for 60 min in the dark. The reduction of the DPPH radical was determined by measuring the absorption at 515 nm. The radical scavenging activity (RSA) was calculated by the equation: % RSA = [(ADPPH − AS)/ADPPH] × 100 (AS is the absorbance of the solution when the sample extract has been added at a particular level and ADPPH is the absorbance of the DPPH solution). The extract concentration providing 50% of the radicals scavenging activity (EC50) was calculated from the graph of RSA percentage against extract concentration.
Reducing power evaluation was performed using the Microplate Reader cited above. The different concentrations of the extracts (0.5 mL) were mixed with sodium phosphate buffer (200 mmol/L, pH 6.6, 0.5 mL) and potassium ferricyanide (1% w/v, 0.5 mL). For each concentration, the mixture was incubated at 50 °C during 20 min, and then was added trichloroacetic acid (10% w/v, 0.5 mL). The mixture (0.8 mL) was poured in the 48-wells, as were deionized water (0.8 mL) and ferric chloride (0.1% w/v, 0.16 mL), and was measured the absorbance at 690 nm. The extract concentration providing 0.5 of absorbance (EC50) was calculated from the graph of absorbance at 690 nm against extract concentrations.
In inhibition of β-carotene bleaching, a solution of β-carotene was previously prepared dissolving β-carotene (2 mg) in chloroform (10 mL) and 2 mL of this solution were pipetted into a round-bottom flask. After chloroform removed (at 40 °C under vacuum) linoleic acid (40 mg), Tween 80 emulsifier (400 mg), and distilled water (100 mL) were added with vigorous shaking. Aliquots (4.8 mL) of this emulsion were transferred into different tubes containing different concentrations of the extracts (0.2 mL). The tubes were shaken and incubated (at 50 °C) in a water bath. As soon as the emulsion was added to each tube, the zero-time absorbance was measured at 470 nm. β-carotene bleaching inhibition was calculated using the equation: β-carotene content after 2 h of assay/initial β-carotene content) × 100. The extract concentration providing 50% antioxidant activity (EC50) was calculated by interpolation from the graph of β-carotene bleaching inhibition percentage against extract concentration.
Lipid peroxidation inhibition was evaluated using a porcine (Sus scrofa) brains (obtained from official slaugh-tered animals). This is homogenized with Polytron in an ice-cold Tris–HCl buffer (20 mM, pH 7.4) to produce a 1:2, w/v brain tissue homogenate which was centrifuged (3000× g; 10 min). Analiquot (100 μL) of the supernatant was incubated with the sample solutions (200 μL) in the presence of FeSO4 (10 mM; 100 μL) and ascorbic acid (0.1 mM; 100 μL) at 37 °C during 1 h. The reaction was stopped by the addition of trichloroacetic acid (28%, w/v, 500 μL), and then thiobarbituric acid (TBA, 2%, w/v, 380 μL). The mixture was then heated at 80 °C during 20 min. After centrifugation (3000× g; 10 min), the color intensity of the malondialdehyde (MDA)–TBA complex in the supernatant was measured (at 532 nm). The inhibition ratio (%) was calculated using the formula: inhibition ratio (%) = [(A − B)/A] × 100% (A were the absorbance of the control and B were the absorbance of sample solution). The extract concentration providing 50% of antioxidant activity (EC50) was calculated from the graph of TBARS formation inhibition against extract concentrations.
All the results were expressed in EC
50 values (µg/mL) and trolox was used as positive control [
33].
3.5. Evaluation of the Cytotoxicity
3.5.1. General
For cytotoxicity evaluation all lyophilized extracts were re-dissolved in water, with a final solution of 8 mg/mL and diluted to different concentrations. The assay was performed according a procedure described by Guimarães et al. [
34]. Ellipticine was used as positive control and the results were calculated as GI
50 values (sample concentration that inhibited 50% of the net cell growth).
3.5.2. In Tumor Cell Lines
Four human tumor cell lines were used to acee the cytotoxicity evaluation: MCF-7 (breast adenocarcinoma), NCI-H460 (non-small cell lung cancer), HeLa (cervical carcinoma) and HepG2 (hepatocellular carcinoma). Cells were routinely maintained as adherent cell cultures in RPMI-1640 medium containing 10% heat-inactivated FBS (MCF-7, NCI-H460 and HCT-15) and 2 mM glutamine or in DMEM supplemented with 10% FBS, 2 mM glutamine, 100 U/mL penicillin and 100 mg/mL streptomycin (HeLa and HepG2 cells), at 37 °C, in a humidified air incubator containing 5% CO
2. The cell lines were plated an appropriate density (1.0 × 10
4 cells/well) in 96-well plates and allowed to attach for 24 h. Cells were then treated for 48 h with several extract concentrations. Following this incubation period, the adherent cells were fixed by adding cold 10% trichloroacetic acid (TCA, 100 μL) and incubated during 60 min at 4 °C. Plates were then washed with deionized water and dried; sulforhodamine B solution (0.1% in 1% acetic acid, 100 μL) was then added to each plate well and incubated during 30 min at room temperature. Unbound SRB was removed by washing with 1% acetic acid. Plates were air-dried, the bound SRB was solubilized with 10 mM Tris (200 μL) and the absorbance was measured at 540 nm in the microplate reader cited above. The results were expressed in GI
50 values; sample concentration that inhibited 50% of the net cell growth [
34].
3.5.3. In Non-Tumor Cells
For the hepatotoxicity evaluation, a cell culture was prepared from a freshly harvested porcine liver obtained from a local slaughter house, and it was designed as PLP2. Briefly, the liver tissues were rinsed in hank’s balanced salt solution containing 100 U/mL penicillin, 100 µg/mL streptomycin and divided into 1 × 1 mm
3 explants. Some of these explants were placed in 25 cm
2 tissue flasks in DMEM medium supplemented with 10% fetal bovine serum, 2 mM nonessential amino acids and 100 U/mL penicillin, 100 mg/mL streptomycin and incubated at 37 °C with a humidified atmosphere containing 5% CO
2. The medium was changed every two days. Cultivation of the cells was continued with direct monitoring every two to three days using a phase contrast microscope. Before confluence was reached, cells were subcultured and plated in 96-well plates at a density of 1.0 × 10
4 cells/well, and cultivated in DMEM medium with 10% FBS, 100 U/mL penicillin and 100 µg/mL streptomycin [
34].
3.6. Evaluation of the Anti-Inflammatory Activity
For the cells treatment, the mouse macrophage-like cell line RAW 264.7 was cultured in DMEM medium supplemented with 10% heat-inactivated fetal bovine serum, glutamine and antibiotics at 37 °C under 5% CO2, in humidified air. For each experiment, cells were detached with a cell scraper. In the experiment cell density of 5 × 10⁵ cells/mL was used, and the proportion of dead cells was less than 5% according to the Trypan blue dye exclusion test. Cells were seeded in 96-well plates at 150,000 cells/well and allowed do attach to the plate overnight. Subsequently, cells were treated with the several concentrations of each extract during 1 h. Dexamethasone (50 µM) was used as a positive control for the experiment. The following step was the stimulation with LPS (1 µg/mL) for 18 h. The effect of all the tested samples in the absence of LPS was also analyzed, to observe if they induced changes in Nitric oxide (NO) basal levels. In negative controls, no LPS was added. Both extracts and LPS were dissolved in supplemented DMEM.
Anti-inflammatory assay was performed in concentration range 400–125 μg/mL and dexamethasone (50 μM) was used as a positive control. The mouse macrophage-like cell line RAW 264.7 stimulated with LPS was used in the assay. Nitric oxide (NO) production was studied with Griess Reagent System kit. Results were expressed as EC
50 values (μg/mL) equal to the sample concentration providing a 50% inhibition of NO production [
35].
3.7. Evaluation of the Antimicrobial Activity
3.7.1. Antibacterial Activity
Escherichia coli (ATCC (American type culture collection) 35210),
Enterobacter cloacae (ATCC 35030),
Salmonella typhimurium (ATCC 13311), and
Pseudomonas aeruginosa (ATCC 27853), were the used Gram-negative bacteria used, while
Listeria monocytogenes (NCTC (National collection of type cultures) 7973),
Micrococcus flavus (ATCC 10240),
Bacillus cereus (clinical isolate),
Staphylococcus aureus (ATCC 6538), were the used Gram-positive bacteria. The minimum inhibitory (MIC) and minimum bactericidal (MBC) concentrations were determined by the microdilution method. Each fresh overnight culture of bacteria was adjusted spectrophotometrically (625 nm) to a concentration of 1 × 10
5 CFU/mL. Dilutions of inocula were cultured on solid medium to verify the absence of contamination and check the validity of each inoculum. Different dilutions of the aqueous extract were added to the wells containing 100 μL of Tryptic Soy Broth (TSB) and afterwards, 10 μL of inoculum was added to all wells. The microplates were incubated for 24 h at 37 °C. The MIC of the samples was detected following the addition of 40 μL of iodonitrotetrazolium chloride (INT) (0.2 mg/mL) and incubation at 37 °C for 30 min. The lowest concentration that produced a significant inhibition (around 50%) of the growth of the bacteria in comparison with the positive control was identified as the MIC. MICs, obtained from the susceptibility testing of various bacteria to tested extracts were determined also by a colorimetric microbial viability assay based on the reduction of the INT colour and compared with a positive control for each bacterial strain. MBC were determined by serial sub-cultivation of 10 μL into microplates containing 100 μL of TSB. The lowest concentration that showed no growth after this sub-culturing was read as the MBC [
36]. The results were expressed in mg/mL.
3.7.2. Antifungal Activity
Aspergillus ochraceus (ATCC 12066),
Aspergillus versicolor (ATCC 11730),
Aspergillus niger (ATCC 6275),
Aspergillus fumigatus (ATCC 1022),
Trichoderma viride (IAM (Culture Collection, Center for Cellular and Molecular Research, Institute of Molecular and Cellular Biosciences, The University of Tokyo, Japan) 5061),
Penicillium funiculosum (ATCC 36839),
Penicillium ochrochloron (ATCC 9112) and
Penicillium verrucosum var.
cyclopium (food isolate) were used. Fungal spores were washed from the surface of agar plates with sterile 0.85% saline containing 0.1% Tween 80 (
v/
v). The spore suspension was adjusted with sterile saline to a concentration of approximately 1.0 × 10
5 in a final volume of 100 μL per well. The inocula were stored at 4 °C for further use. Dilutions of each inoculum were cultured on solid MA to verify the absence of contamination and to check the validity of the inoculum. MIC determination was also performed by a serial dilution technique using 96-well microtitre plates. The investigated sample was dissolved in water and added to broth malt medium with a fungal inoculum. The microplates were incubated during 72 h at 28 °C. The lowest concentrations without visible growth (as assessed using a binocular microscope) were defined as the MICs. The minimum bactericidal and fungicidal concentrations (MBC and MFC) were determined by serial sub-cultivation of 2 μL in microtitre plates containing 100 μL of malt broth per well and further incubation for 72 h at 28 °C. The lowest concentration with no visible growth was defined as the MFC, indicating 99.5% killing of the original inoculum. Streptomycin and ampicillin, bifonazole and ketoconazole (in a range of 0.01 to 5 mg/mL) were used as positive controls and for negative control 5% DMSO was used [
36]. The results were expressed in μg/mL.
3.8. Statistical Analysis
In this study all the assays were carried out in triplicate. The results are expressed as mean values and standard deviation (SD). All results were analyzed using one-way analysis of variance (ANOVA) followed by Tukey’s HSD Test with α = 0.05. These analyses were carried out using IBM SPSS Statistics, Version 23.0. (IBM Corp., Armonk, New York, USA).
4. Conclusions
Overall, the study of natural matrices allows a greater knowledge of their chemical composition and, therefore, a more adequate applicability. The present study allowed to deep knowledge on the phenolic profile of L. pedunculata, since samples with different origins were studied. In general, most of the samples revealed diverse bioactive properties, such as, cytotoxicity, antioxidant, anti-inflammatory and antimicrobial activity. The aqueous extracts showed a higher concentration of phenolic compounds and a higher antioxidant activity; nevertheless, the hydroethanolic extracts exhibited a higher anti-inflammatory potential in most of the samples, as also a higher antiproliferative capacity and antimicrobial activity. This may be due to the fact that hydroethanolic extracts contains other compounds (non-phenolic compounds), which could be correlated with these bioactivities.
Besides the great importance of L. pedunculata bioactive properties, these results also highlight the existing variances between samples from different geographical origin. Further studies are required to correlate biotic and abiotic factors with the chemical composition of the specimens.
The studied plant materials were obtained from previously conserved seeds (accessions) of different L. pedunculata populations, of the Portuguese Genebank collection. These outcomes contributed to data on important chemical characteristics, which might distinguish accessions within a species. Such characterization provides essential information assuring the best utilization of the conserved germplasm to the final users, meeting the goal of ex situ conservation of germplasm in genebanks.

 ,
, 

