Article

Assessing Nutritional Traits and Phytochemical Composition of Artisan Jams Produced in Comoros Islands: Using Indigenous Fruits with High Health-Impact as an Example of Biodiversity Integration and Food Security in Rural Development

1
Dipartimento di Scienze Agrarie, Forestali e Alimentari, Università degli Studi di Torino, 10095 Grugliasco, Italy
2
École National de Cuisine et d’Application-Codcom, 167 Moroni, Comoros
3
Dipartimento di Scienze della Vita e Biologia dei Sistemi, Università degli Studi di Torino, 10123 Torino, Italy
*
Author to whom correspondence should be addressed.
Molecules 2018, 23(10), 2707; https://doi.org/10.3390/molecules23102707
Submission received: 19 September 2018 / Revised: 12 October 2018 / Accepted: 18 October 2018 / Published: 20 October 2018
(This article belongs to the Collection Advances in Food Analysis)

Abstract

:
In the Comoros Islands, as in other developing countries, malnutrition and food insecurity affect a very large percentage of the population. Developing fruit-based products in order to make profit, reduce poverty and improve indigenous people diet could be very important for local population of countries as Comoros Islands. The aim of the present work was to study the chemical composition of jams and jellies produced from seven fruit species harvested in Grand Comore Island. The following parameters were studied sugars and organic acids, total phenolics, total anthocyanins and high-performance liquid chromatography (HPLC) fingerprint of the main phytochemicals. Antioxidant activity was also measured. A multivariate approach (Principal Component Analysis) was performed in order to better characterize the products and to set a potential analytical tool for jam characterisation. Results showed that the analysed products are a good source of polyphenolic constituents, as caffeic and gallic acids, catechin and quercetin and volatile compounds, as limonene and γ-terpinene: these molecules may be considered as suitable markers for these fruit-derived products as characterizing the chromatographic patterns. The characterisation of these products and their nutritional and nutraceutical traits is important as valorisation of local food production for poverty reduction and rural development. Further benefits of this approach include the maintenance of local agro-biodiversity as raw material for fruit-based products and the strengthening of food security practices.

Graphical Abstract

1. Introduction

The Comoros Islands are situated off the coast of East Africa (290 km), at the northern entrance of the channel of Mozambique between Madagascar and the southern-east African mainland. The archipelago is composed of four main islands: Grand Comore (Ngazidja), Anjouan (Ndzuani), Mohéli (Mwali) and Mayotte (Maore). Comoros Islands are characterized by high plant biodiversity but less than one-sixth of the land remains covered by forest due to a rapid deforestation mainly caused by domestic firewood consumption [1].
Comoros, one of the world’s poorest countries, has an economy based on subsistence agriculture and fishing. In the Comoros Union, as in all the developing countries, malnutrition and food insecurity are the main challenges: in particular energy, malnutrition in children and micronutrient deficiencies (e.g., vitamin deficiency and nutritional anaemias), are important public health issues influencing productivity, maternal/infant health and intellectual development. The improvement of productivity and post-harvest techniques is pivotal to increase Comorian smallholder farmers’ income in order to help fighting poverty and ensure a medium-high nutrition [2].
On the other hand, an abundance of tropical fruit species, often underexploited, grown in semi-natural conditions occurring in Comoros. Tropical fruits attract special attention as they usually have stronger antioxidant properties than common fruits, thanks to bioactive compounds as polyphenols (anthocyanins, flavonoids, phenolic acids and tannins), carotenoids, organic acids and vitamins (B2, B6, C, E, P, PP), as reported in several studies [3,4]. Health-promoting components occurring in these fruits, in particular polyphenols, also show anti-microbial, anti-carcinogenic and anti-viral effects [5]. Therefore, tropical fruits show a high considerable horticultural and nutritional importance for the diet of the rural population [6] in specific critical periods of the year providing sustenance to millions of people. Unfortunately, a significant amount (30–40%) of total fruit production in developing countries is wasted due to poor postharvest handling and inadequate marketing and/or storage facility [7]. Moreover, most of population in these countries lives in rural areas and depends on subsistence agriculture for their livelihoods. In these settlements, agriculture is dependent on rainfall. Inadequacy of food during the dry season and in early summer before the harvest period exposes people to inadequate intake of both macro- and micro-nutrients [6].
Fruit processing industries making preserves, jams, sauces and jellies play an important role in reducing these losses of fruit production, thriving largely as a domestic-product market [8]. In particular, some of the most popular postharvest-stable products made from fruit are jams and jellies, both at the household and commercial levels. Jams and jellies are defined as a mixture, brought to a suitable gelled consistency, of sugars, pulp of one or more fruits and water [9]. To manufacture these products, fruits and sugars are combined in a similar ratio, followed by cooking, to produce a tasty product of sufficiently high sugar content with satisfactory keeping qualities [10]. Jam processing is an important strategy to preserve perishable fruits and improve food security in developing countries [11].
Considering new potential agro-industrial and commercial activities related to jam and jelly production, including value-added product labelling, it is of essential importance to guarantee both high quality and compliance with the product specification. For these purposes, increasingly sophisticated analytical methodologies, based on chemical markers, have been developed. Chemical fingerprint methods include the analysis of organic acids, pigments (as carotenoids and anthocyanins), sugars, phenolics and other bioactive compounds [12]. In particular, secondary plant metabolites are very suitable as chemotaxonomic markers [13]. Quantitative differences may occur depending on fruit genotype (e.g., species and cultivar), maturity stages and environmental growth [14], storage conditions [15] and on presence of the skin in fruit-based products [16]. In previous research, they have been successfully used for the determination of the adulteration of some fruit jams and jellies as reported by Dragovic-Uzelac et al. [17].
The aim of the present work was to study chemical compositions of jams and jellies from seven tropical fruit species, harvested near Moroni in Comoros Islands. The following parameters were studied: sugar and organic acid contents, total phenolics (TPC), total anthocyanins (TAC) and fingerprint of the main phytochemicals with demonstrated health-promoting activity by high-performance liquid chromatography (HPLC). Furthermore, antioxidant activity was measured in these products. A multivariate approach (Principal Component Analysis—PCA) was performed in order to better characterize fruit-based products and set a potential analytical tool for analysis and characterisation of local jams and jellies. This study could contribute to the commercial valorisation of these fruit-derived products in rural communities in Comoros Islands thereby reducing post-harvest losses, promoting food security, enhancing small farmers’ income and contributing to a sustainable rural development.

2. Results and Discussion

2.1. Nutraceutical Properties

Food processing plays an important role in the bioactive compound degradation, because several transformations of phenolics occur to produce yellowish or brownish pigments [18]: the final product outward appearance is a crucial in determination of consumers’ choices and anthocyanins are the main food colorants responsible for intense colour (associated with raw material freshness and good quality) [19]. Moreover, physical and biological factors as temperature increase and enzymatic activity may be very important in degradation of polyphenolic compounds [10].
In this research, the used methods allowed a rapid measurement of TAC and TPC: the Folin-Ciocalteu method suffers many interferences but it can be a complementary technique applied to confirm and support chromatography results, as reported in this study. The TPC ranged from 10.98 ± 2.18 mgGAE/100gPr (mango jam, CM2) to 625.34 ± 67.86 mgGAE/100gPr (red guava jam, CM8), while TAC ranged from 0.59 ± 0.25 mgC3G/100gPr (mango jam, CM2) to 9.56 ± 0.46 mgC3G/100gPr (orange jam, CM7): values obtained from the analysed extracts (Table 1) were higher than values reported by Poiana et al. [20] and Rababah et al. [21]; the differences in phenolic and anthocyanin content could be due to the effects of several internal and external factors on plant material (genetic variability, climatic conditions and environmental factors) [
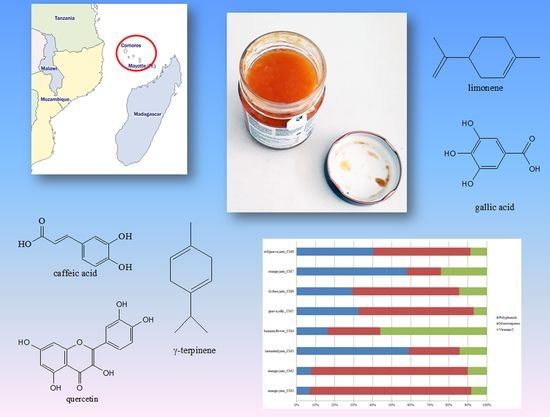
22]. In particular, Comoros pedoclimatic conditions such as volcanic soil, high temperatures, well distributed rains, influence polyphenolic content in fresh fruits and related products.
Bioactive compound redox properties allow them to act as reducing agents, hydrogen donators and singlet oxygen quenchers [23]. In this research, the Ferric Reducing Antioxidant Power (FRAP) assay was used to evaluate antioxidant capacity of fruit jams and jellies, studying the ability of antioxidants to reduce Fe3+ ions to Fe2+ ions. Jams and jelly FRAP value ranged from 4.71 ± 2.07 mmol Fe2+ kgPr−1 (mango jam, CM1) to 25.50 ± 0.28 mmol Fe2+ kgPr−1 (red guava jam, CM8) as shown in Table 1, in accordance with other studies [24,25].
Antioxidant activity of fruit-derived products was determined by different bioactive molecules (e.g., polyphenols, as anthocyanins and vitamin C) [26]; for example, antioxidant activity of cyanidin is about 4 times higher compared to ascorbic acid [27]. In this study, the TPC/TAC/antioxidant activity correlation was positive: results showed a significant Pearson correlation coefficients (R = 0.6636 for TPC/antioxidant activity and R = 0.4347 for TAC/antioxidant activity).

2.2. Phytochemical Composition

Antioxidant (polyphenols and vitamin C) and anti-inflammatory (terpenes) compounds are the main biologically active substances in fresh fruits and derived products: synergistic or additive health-promoting effects of different phytochemicals (phytocomplex) contribute to biological activity better than a single molecule or a group of few compounds [28]. In this study 22 biologically active compounds together with 9 nutritional substances were selected as markers for HPLC fingerprinting due to their importance in humans [29]. In Supplementary material (Suppl. Figure S1) HPLC chromatograms of orange jams are reported as an example of analysed fruit-based products.
An important question in HPLC analysis is whether the peak comprises one or more components. In quality control and research analysis, impurities hidden behind the peak of interest can falsify results and an undetected component might lead to a loss of essential information. In this research, a peak purity check was assessed in order to control if peaks were pure or contained impurities comparing spectra recorded during the elution of each peak. No-coeluting peaks were detected. Moreover, HPLC-DAD does not allow a definitive identification of phytochemicals. Indeed, liquid chromatography (LC) coupled to mass (MS) or mass/mass spectrometry (MS2) is one of the most effective technique for analysis on complex plant extract/fresh fruit/derived product providing a rapid and accurate identification of phytochemicals, as phenolics. For this reason, future developments are necessary but in this preliminary study HPLC-DAD was a simply, rapid and effective approach to describe considered samples in relation to the research aim. Additional markers with demonstrated biological activity could be also taken into consideration for a better identification of the chromatographic pattern of fruit-derived products, together with a mass spectrometry detection of unknown peaks.
The chemical fingerprint of analysed jams and jellies is reported in Table 2, Table 3 and Table 4 (phenolics, other health-promoting components and nutritional substances, respectively). The total bioactive compound content (TBCC) was calculated as the sum of the main molecules (polyphenols, monoterpenes and vitamin C) selected for their biological proved effects on humans and detected in the extracts: TBCC value ranged from 94.25 ± 4.13 mg/100 gPr (banana flower, CM4) to 357.50 ± 2.10 mg/100 gPr (orange jam, CM7). This is only a preliminary study on tropical fruit-based jams: in further fingerprint studies, other markers with health-promoting capacity or positive nutritional value should be added for a complete chromatographic pattern characterisation coupling a mass spectrometry (MS) detection of unknown peaks to a UV-visible determination.
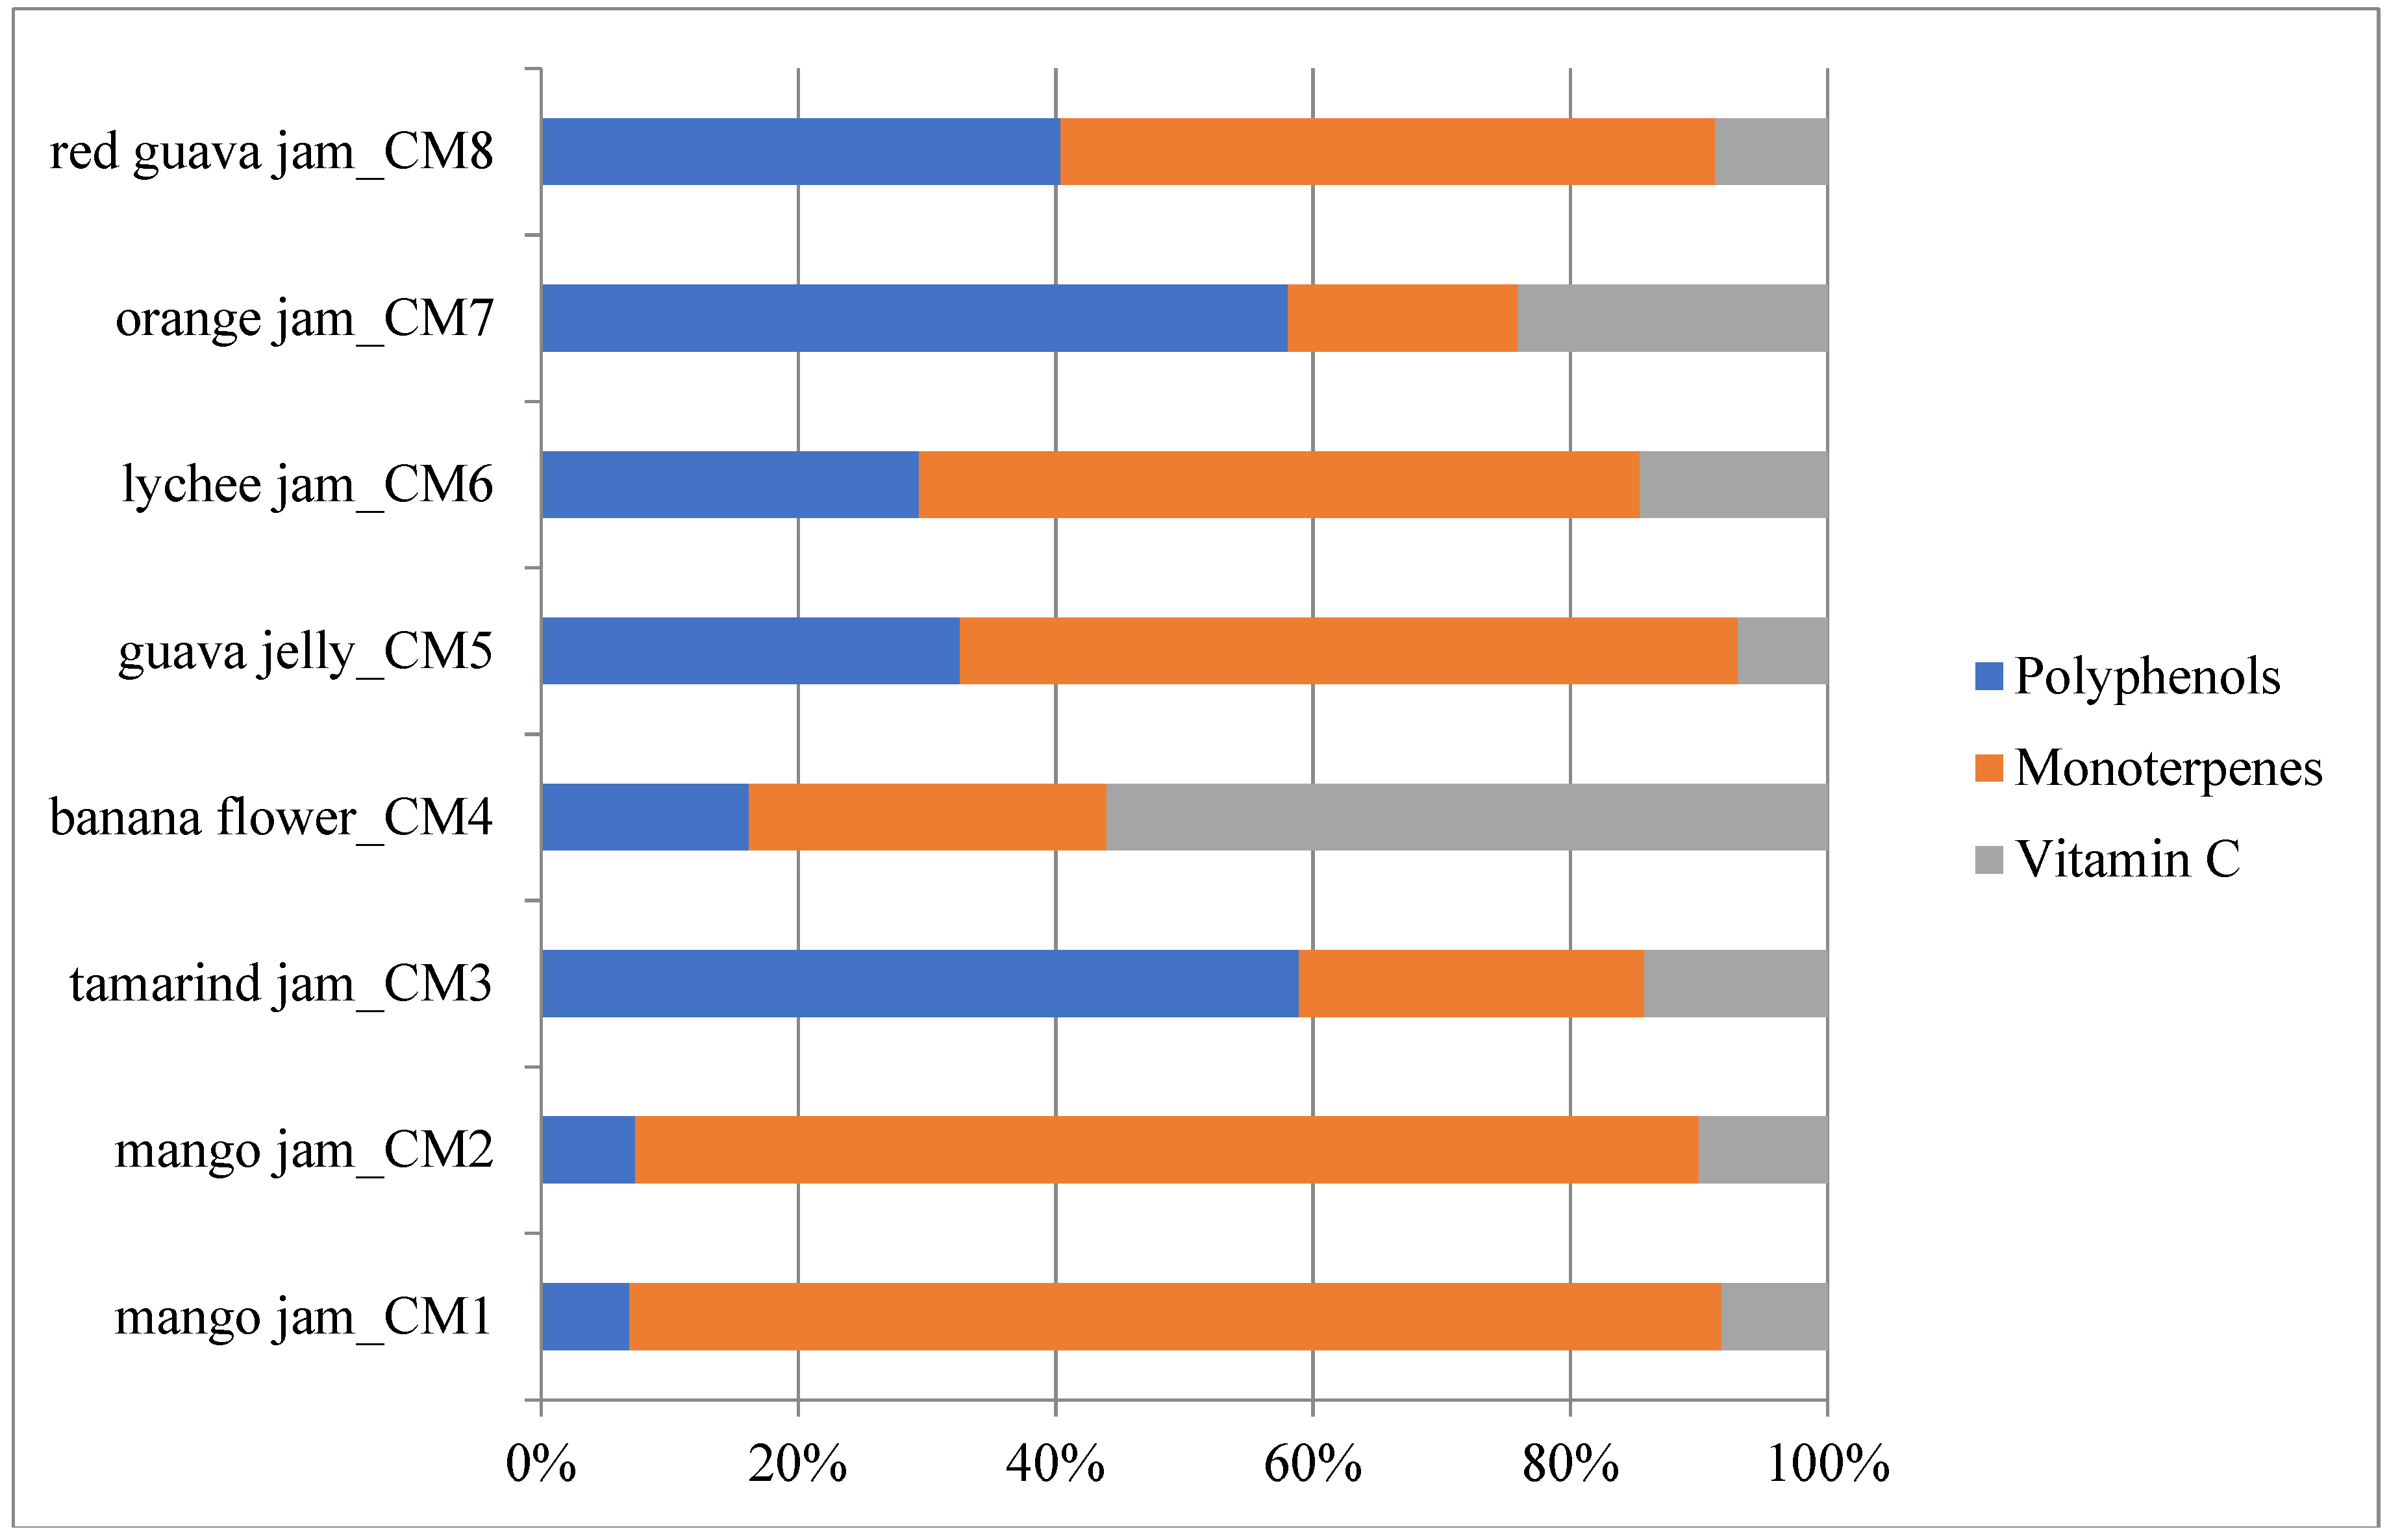
In Figure 1 identified health-promoting substances were grouped into bioactive classes for the evaluation of the single contribution of each class to total phytocomplex/TBCC (mean values were considered). The most important class in tamarind (CM3) and orange (CM6) jams was polyphenols (58.93% and 58.07%, respectively), expressed as the sum of anthocyanins, phenolic acids, flavanols, catechins and tannins, while monoterpenes were the first class in mango jam (83.79%), guava jelly (60.48%) and lychee jam (56.04%). Banana flower showed a high percentage of vitamin C (56.05%), while red guava jam presented similar content of polyphenols and monoterpenes (40.37% and 50.93%, respectively) with a positive percentage of vitamin C (8.70%).
Results showed that analysed fruit jams and jellies are a very good source of polyphenolic compounds. 
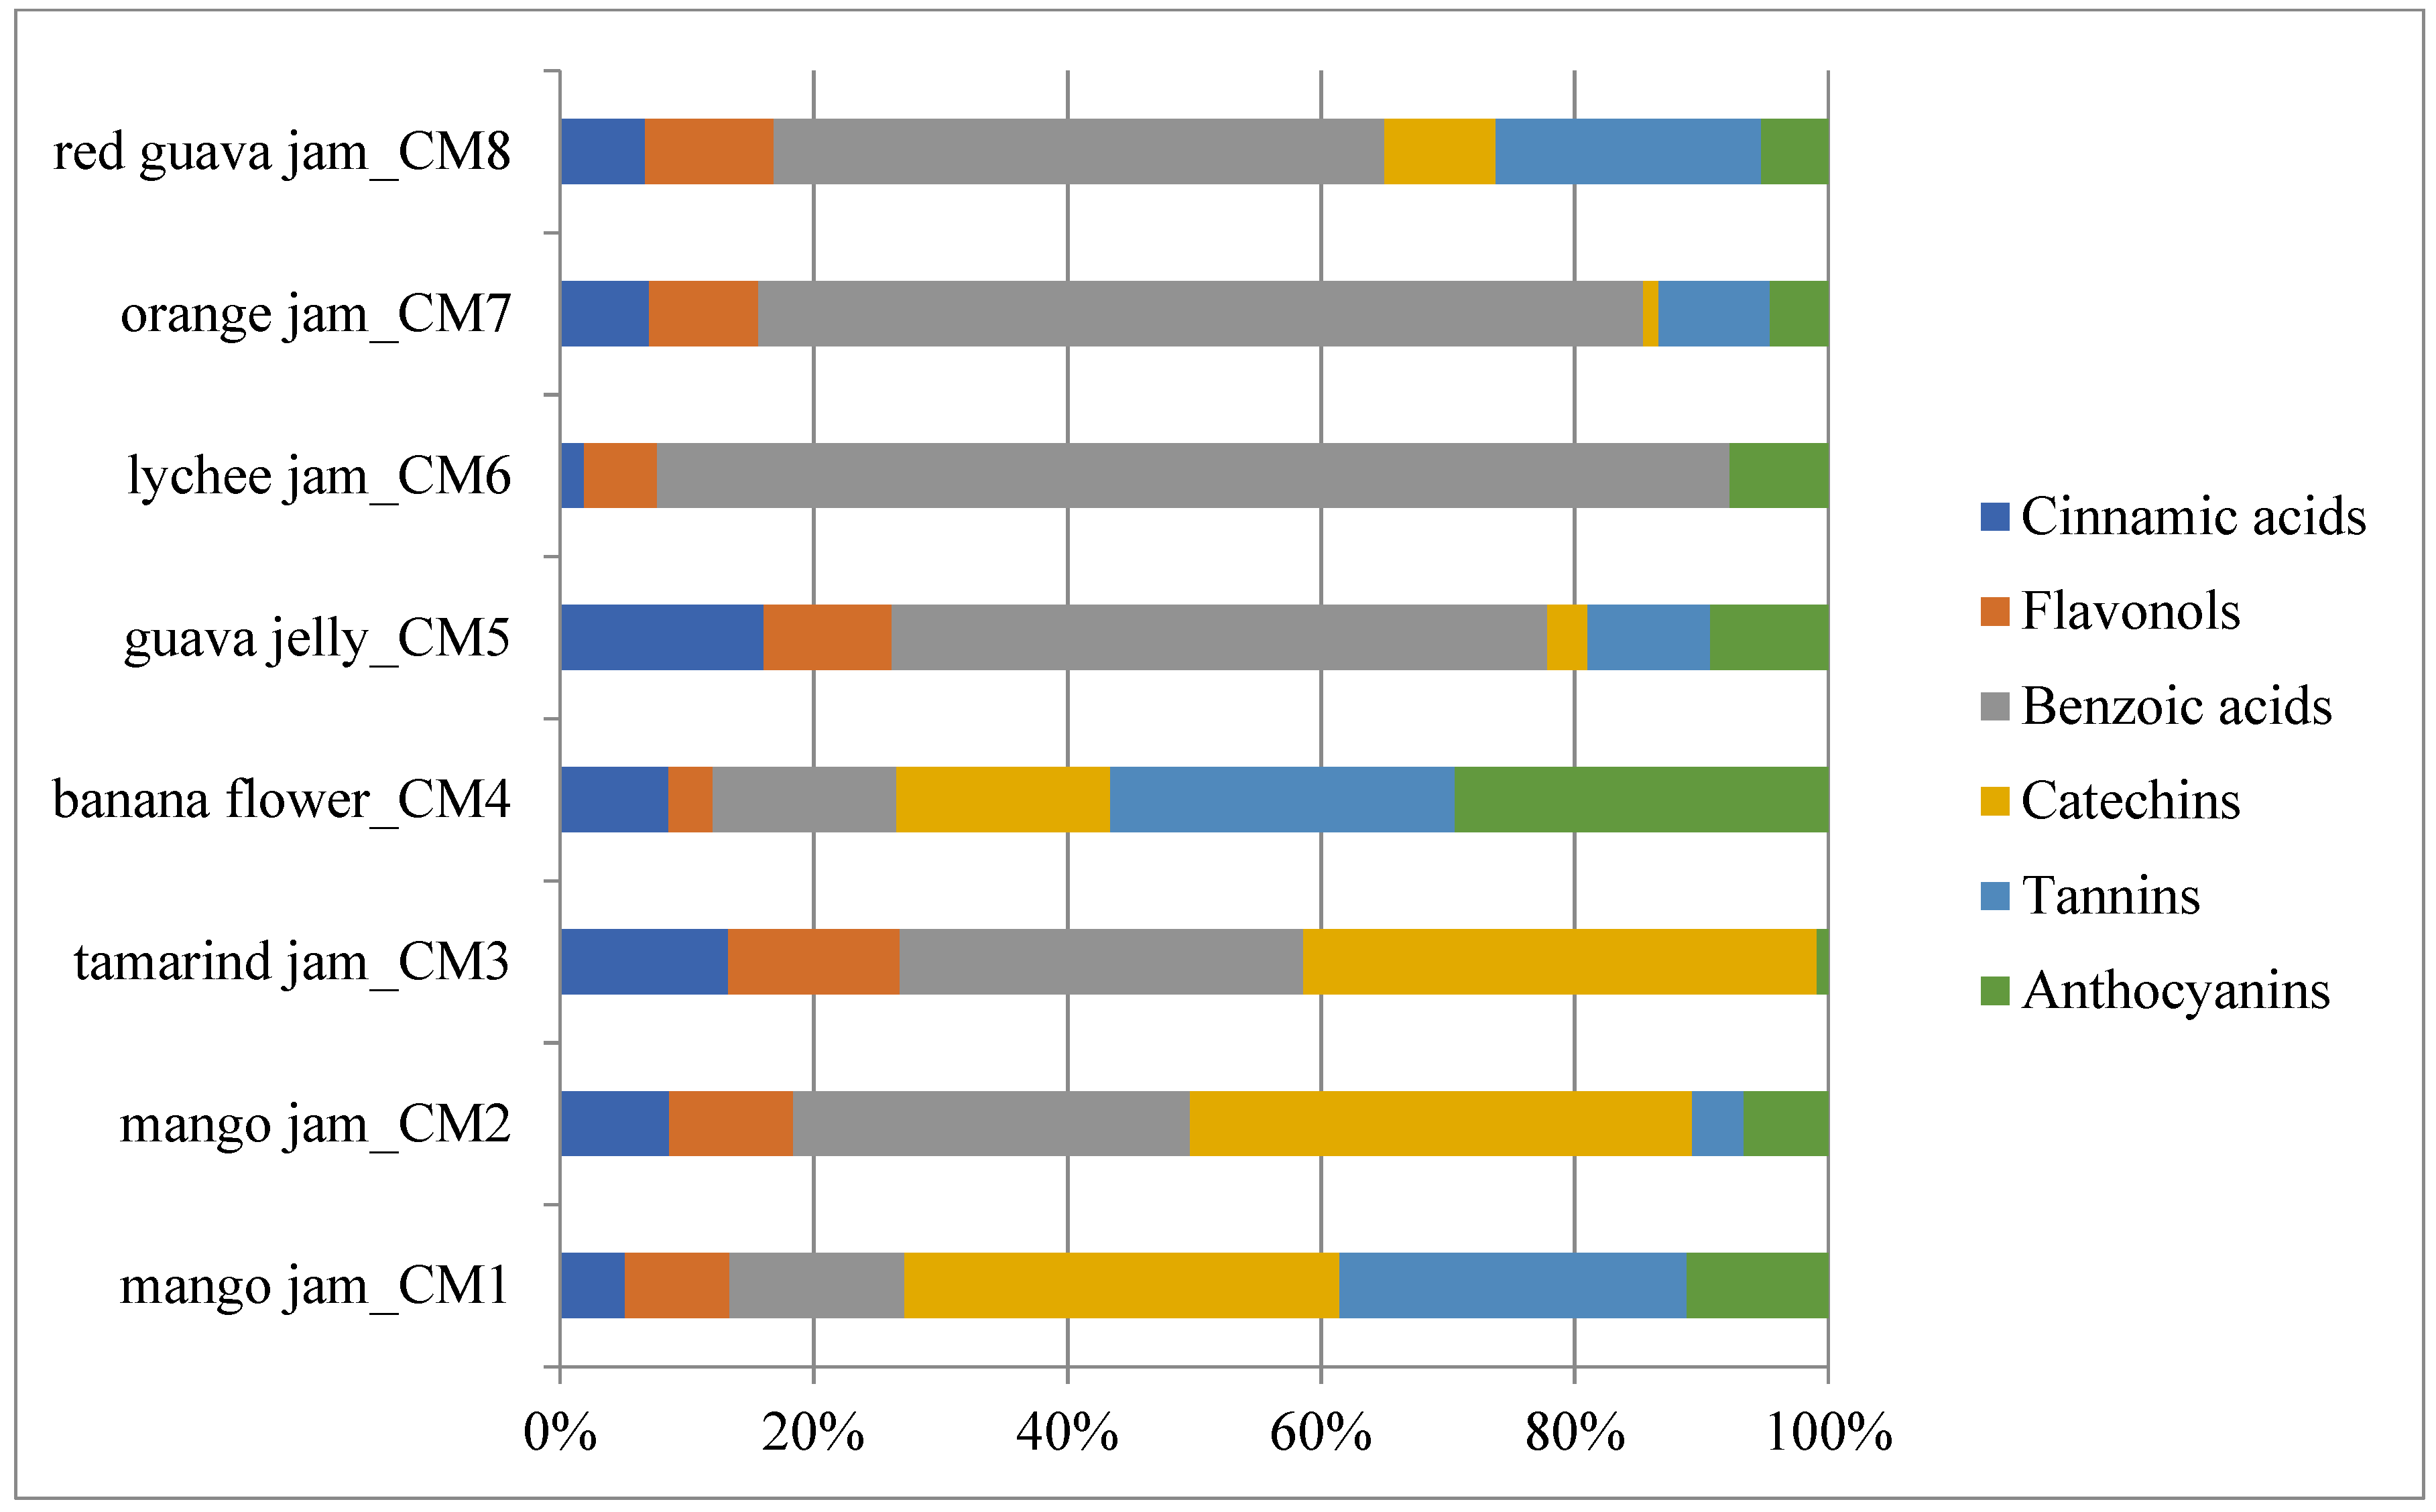
Figure 2 reports the single contribution of each polyphenolic class to total polyphenols detected by HPLC. Catechins were the most important class in mango and tamarind jams (36.93% and 40.53%, respectively), while phenolic acids (cinnamic acids plus benzoic acids) were the most important classes in guava jelly (67.75%) and in lychee (86.46%), orange (76.77%) and red guava (54.82%) jams. Banana flower showed a high percentage of tannins and anthocyanins (27.21% and 29.42%, respectively), followed by catechins (16.81%) and benzoic acids (14.53%).
Analysed jams and jellies presented interesting quali-quantitative polyphenolic profiles if compared to commercial products derived from common temperate fruits; in particular, they showed higher TPC values and relative antioxidant activity than strawberry (101.40 mgGAE/100 gPr) [25], apricot (51.49 mgGAE/100 gPr) [21], berry fruits (336.67 mgGAE/100 gPr) [24], peach (18.85 mgGAE/100 gPr) and apple (20.07 mgGAE/100 gPr) [16]. Moreover, jams from tropical fruits showed higher values of specific phenolic markers as coumaric, caffeic and ferulic acids (lychee, banana and guava), catechin (tamarind) and rutin (mango) than commercial products derived from berry fruits (the content values in berry fruits were 0.39 mg/100 gPr for coumaric acid, 1.38 mg/100 gPr for caffeic acid, 0.13 mg/100 gPr for ferulic acid, 3.93 mg/100 gPr for catechin and 0.26 mg/100 gPr for rutin) [19]. These results may contribute to better valorise the products derived from local biodiversity compared to imported commercial ones and improve food industry in the Comoros Islands with the potential exportation of these productions.
In some studies, phenolic compound characterisation was mainly used for chemotaxonomic purposes; moreover, some researchers reported that fruit processing during jam/jelly production did not change much the qualitative polyphenolic profile [10,30]. In this research, each product showed a specific phenolic composition characterised by the presence of one or more specific markers. Chlorogenic acid proved to be characteristic of tamarind jam (11.45 ± 0.73 mg/100 gPr), guava jelly (13.77 ± 0.55 mg/100 gPr) and orange jam (12.97 ± 0.19 mg/100 gPr) and it could be used as a marker to prove the addition of these fruits to other jams. Moreover, chlorogenic acid is considered a preferential substrate for the catecholase activity of polyphenol oxidase and it may be important during fruit processing [31]. Caffeic acid was detected in all the fruit-derived products in a close range between 0.49 ± 0.13 mg/100 gPr (tamarind jam, CM3) and 0.76 ± 0.12 mg/100 gPr (lychee jam, CM6) similar to other studies [32,33]. Coumaric acid was the most important cinnamic acid in red guava jam-CM8 (5.58 ± 0.80 mg/100 gPr), while ferulic acid was present in tamarind jam-CM3 (1.38 ± 0.22 mg/100 gPr) and orange jam-CM7 (1.00 ± 0.11 mg/100 gPr) as reported by Jimohand Onabanjo [34] and Marquina et al. [35]. Caffeic, ferulic and coumaric acids could be involved in the oxidation processes and colour development during technological processing [36]. Flavonoids (flavanols and catechins) were also demonstrated to be important as markers for orange and tamarind jam quality control [37], because flavonoids are not affected by the manufacturing process. Flavonols quench active oxygen species [38] and inhibit in vitro oxidation of low-density lipoproteins reducing thrombotic tendency. In this research, the most effective flavonol selected as marker was quercetin in guava jelly (7.56 ± 0.03 mg/100 gPr) and jams of tamarind (11.44 ± 0.96 mg/100 gPr), orange (15.69 ± 1.11 mg/100 gPr) and red guava (7.62 ± 0.20 mg/100 gPr), while rutin proved to be characteristic of mango jams (0.94 ± 0.04 mg/100 gPr for CM1 and 0.86 ± 0.03 mg/100 gPr for CM2) according to other studies [39,40]. The identification of catechin (maximum value of 40.64 ± 1.56 mg/100 gPr in tamarind jam) and epicatechin (maximum value of 4.03 ± 0.16 mg/100 gPr in red guava jam) could be useful: indeed, they are involved in the lipid peroxidation inhibition and human cancer cell line proliferation as other similar compounds [41]. The presence of tannins in adequate amounts in orange and red guava jams (18.24 ± 2.52 mg/100 gPr and 19.79 ± 0.50 mg/100 gPr, respectively) are positive as they are free radical quenchers [42]. High levels of ellagic acid in tamarind jam (23.30 ± 1.96 mg/100 gPr) and orange jam (57.11 ± 1.64 mg/100 gPr) as well as high content of gallic acid in guava jelly (42.02 ± 0.58 mg/100 gPr) and orange jam (87.72 ± 1.81 mg/100 gPr) were also detected: these molecules are endowed with numerous biological properties, as anticancer, anti-inflammatory and anti-HIV replication activities [43]. These preliminary results on phenolic composition demonstrate the need of identifying more bioactive substances for control of the authenticity of fruit-based products.
Anthocyanins have frequently been also considered for the cited purposes, because their specific patterns may allow the classification of fruit species and relative derived products and the characterization of their nutraceutical and nutritional traits (e.g., detection of admixtures of fruits with a more stable colour during jam processing). As previously discussed, anthocyanins are of prominent importance in guava jelly (8.35 ± 1.13 mgC3G/100gPr), orange jam (9.56 ± 0.46 mgC3G/100gPr) and red guava jam (4.99 ± 0.67 mgC3G/100gPr) because i) they are important for quality traits, due to their levels directly related to the product colour and ii) they have been proved to show several health-promoting activities and a high potential phytochemical value [44]. As opposed to other polyphenolic compounds, composition in anthocyanins may be subject to modification during processing and storage steps as reported by Garzon and Wrolstad [45]: in particular, enzymation during jam processing may change anthocyanin patterns [46]. During jam and jelly storage new pyranoanthocyanins may also be formed by direct reaction of anthocyanins with cinnamic acids, as shown by Schwarz et al. [47]. For this reason, anthocyanins may be only used as quantitative markers in the quality control of jams and similar products.
Monoterpenes represent an important fraction of the TBCC in analysed fruit-based products, in particular limonene in mango jam (103.53 ± 3.12 mg/100 gPr) and guava jelly (102.75 ± 0.58 mg/100 gPr) and γ-terpinene in jams of mango (48.07 ± 2.30 mg/100 gPr) and red guava (43.01 ± 0.16 mg/100 gPr): the plant terpenoids are a large class of phytochemicals used for their aromatic qualities and antioxidant and anti-inflammatory activity [48]. Monoterpenes are non-nutritive dietary substances with antibacterial and antitumor activity found in the essential oils of several plants [49] and several studies reported their chemopreventive activity against several cancers [50].
Vitamin C value was obtained as the sum of ascorbic and dehydroascorbic acids due to their biological activity in humans [51]. In this research banana flower and orange jams showed a high vitamin C content (52.82 ± 0.57 mg/100 gPr and 86.07 ± 0.48 mg/100 gPr, respectively). Other analysed products showed good values of vitamin C (about 10–25 mg/100 gPr) according to previous similar studies [52,53].
Organic acids in fruits are little influenced by changes during processing and storage and show a good stability if compared to pigments and flavour compounds. Accordingly, their identification may be suitable for the estimation of fruit amount and for the fruit quality control [54]. However, since organic acids (e.g., citric acid) are indispensable technological components of most derived-products, they are not applicable as quality control markers in fruit jams and jellies. Furthermore, organic acid composition is influenced by genetic factors (e.g., cultivar) and degree of ripeness, limiting their applicability as a quantitative marker in fruit-derived products [55]. In any case, they are important antioxidants with multi-purpose uses in pharmacology as reported by Eyduran et al. [56]. They were also utilised as food acidifiers by food companies [
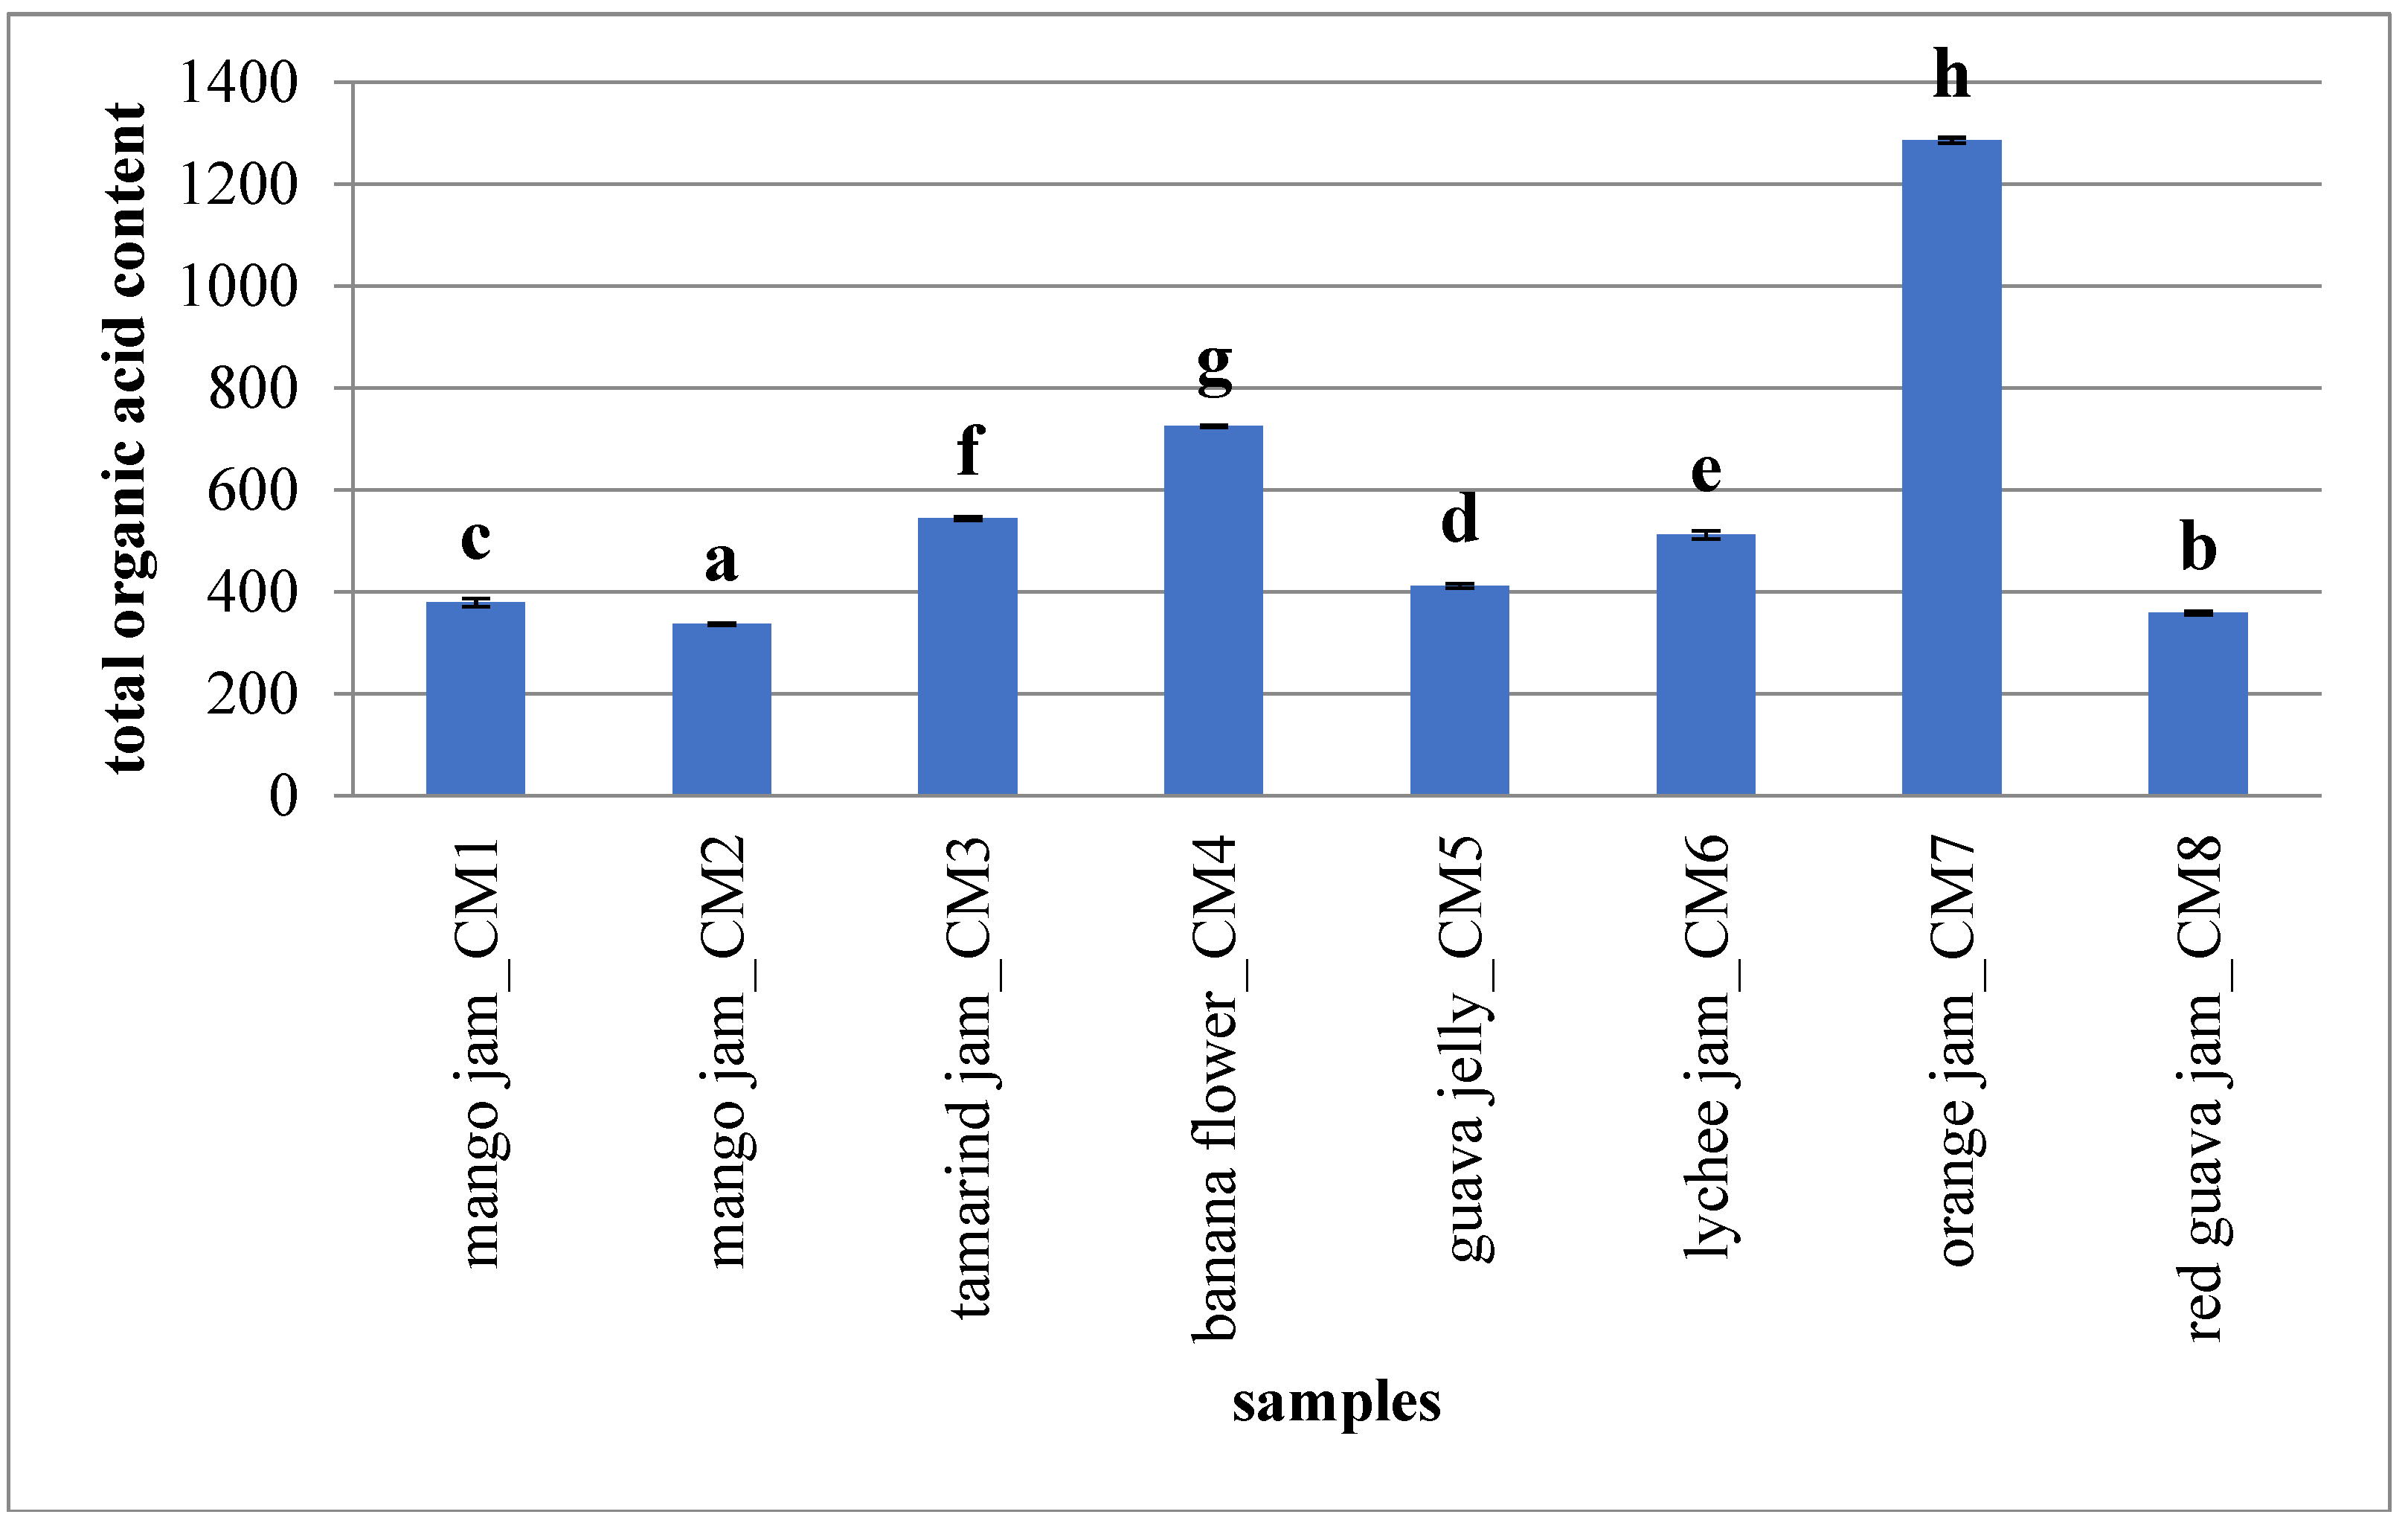
57]. In this research orange jam showed high variability in organic acid composition: in particular, succinic acid (406.65 ± 4.40 mg/100 gPr) and quinic acid (391.13 ± 2.19 mg/100 gPr) were found to be suitable markers for jam characterization because they were not detected in other analysed fruit-based products and represent specific molecules of orange jam chromatographic pattern as shown by Cejudo-Bastante et al. [58] and Flores et al. [59]. Similarly, malic acid could be a specific marker for mango jams and tartaric acid for guava jelly and jams of lychee and red guava. Figure 3 shows total organic acid content in analysed fruit-based products.
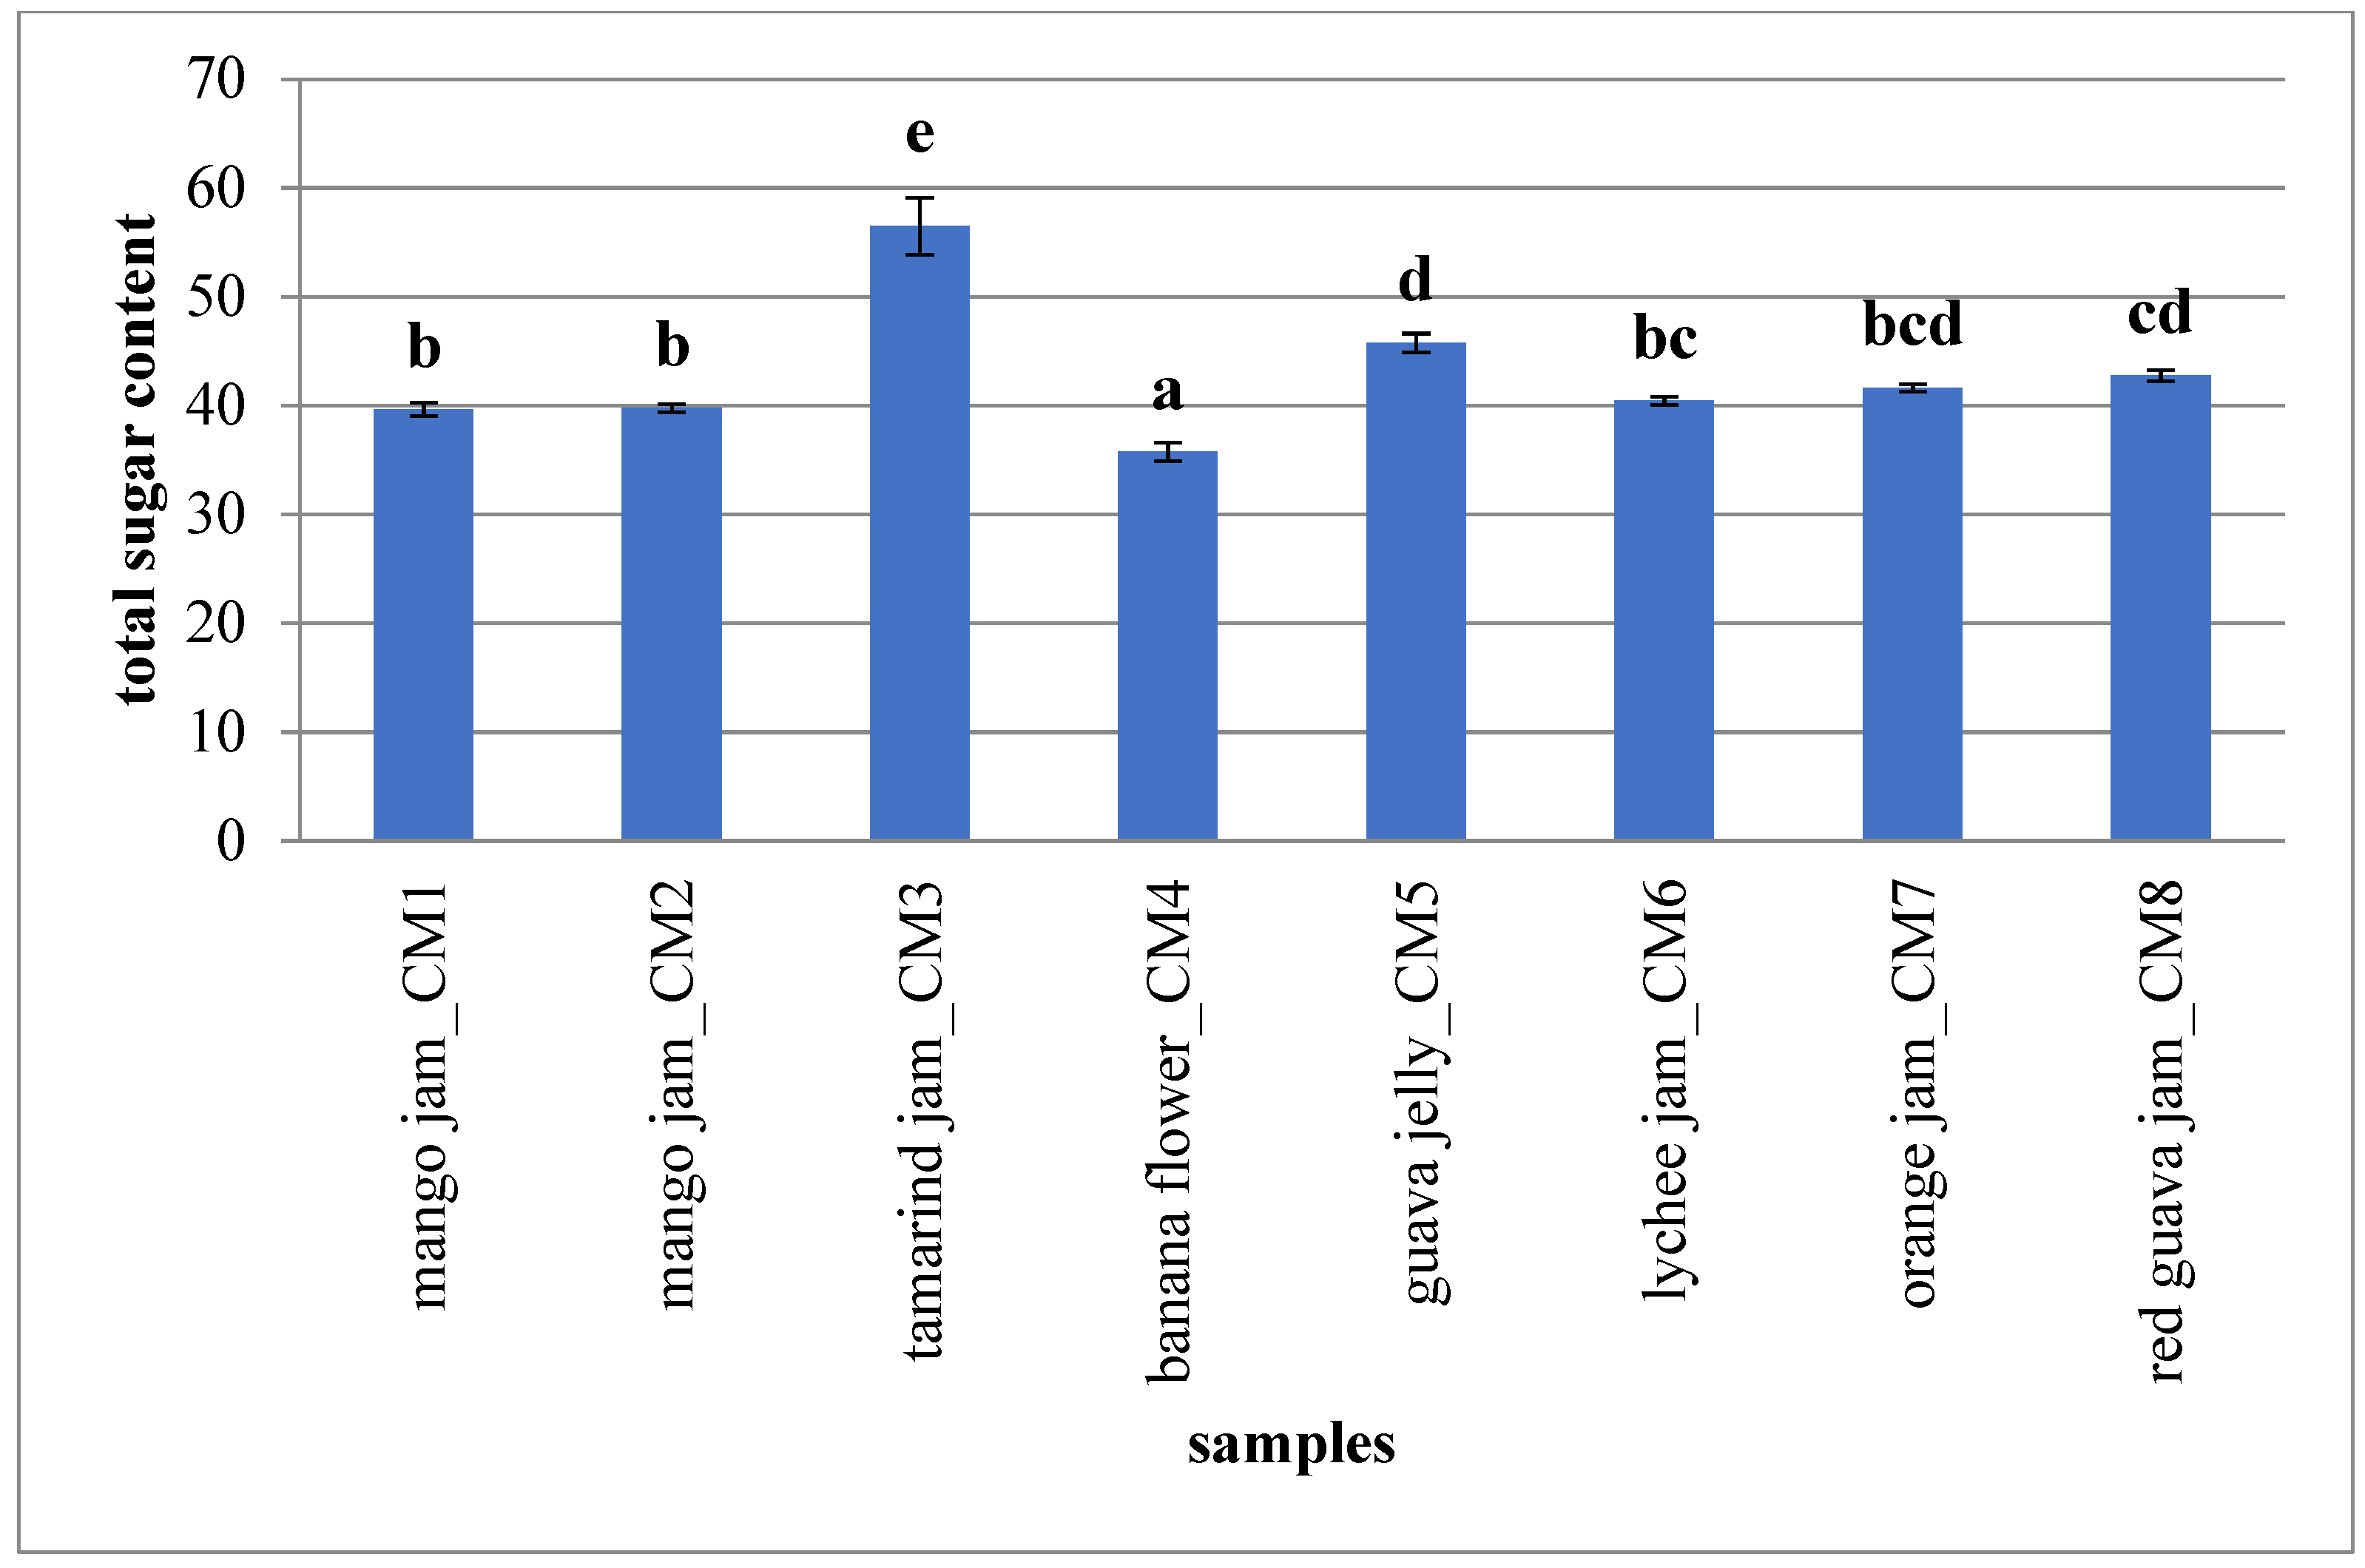
Apart from organic acids, the sugar pattern was also utilised for fruit species differentiation, while their use as quantifiers of fruit content is very limited. Identical sugar profiles, used often for the detection of illegal adulterations as the admixture of sugar solutions or fruit juices, were observed for fruits from different countries as well as for different genotype [55]. In this research sugar pattern (Figure 4) was studied in order to evaluate the nutritional potential of analysed fruit-derived products. Tamarind jam showed the highest sugar content (56.50 ± 2.70 g/100 gPr), expressed as sum of fructose (15.35 ± 0.14 g/100 gPr), glucose (27.64 ± 2.33 g/100 gPr) and sucrose (13.51 ± 0.23 g/100 gPr). Other analysed products presented a total sugar content of about 40 g/100 gPr as reported in other studies [60,61].

2.3. Multivariate Analysis

Single markers of the same phytochemical group were combined in bioactive classes for multivariate data handling. For the visualisation of potential differences in the products and easily characterize analysed jams and jellies, PCA was performed on all the data and it reduced the initial variables (TPC, antioxidant activity, TAC, content of 9 chemical classes) to three principal components (86.74% of total variance), placing the eight fruit-based products in the PCA score plot (Figure 5) in relation to phytochemical composition, nutritional properties and nutraceutical traits. PC1 and PC2 well represent the system information (70.20% of total variance); the PCA results showed five groups, highlighted in Figure 5 with circles, without statistical meaning, according to the phytochemical results; the groups were named α (guava jelly—CM5, red guava jam—CM8), β (tamarind jam—CM3), χ (lychee jam—CM6), δ (orange jam—CM7) and ε (mango jam, genotype 1—CM1, mango jam, genotype 2—CM2, banana flower—CM4).
PCA loading plot showed a correlation between most of the polyphenolic classes (phenolic acids, tannins, anthocyanins and flavanols), vitamin C, organic acids and PC1 (43.15% of total variance) and a correlation between TPC, catechins, antioxidant activity, sugars and PC2 (27.05% of total variance). Monoterpenes showed an intermediate position between PC1 and PC2 (Figure 6). Polyphenolic compounds (in particular, benzoic acids, tannins and anthocyanins) and vitamin C presented a high discriminating power among different samples, as reported in other studies [37,55], as well as catechins.
These results showed that PCA classification obtained from main bioactive groups, nutritional traits and nutraceutical properties characterized the analysed products according to the different chemical pattern and provided information on the phytochemical markers with the most influence on the phytocomplex. A chemometric method was applied coupled to an HPLC fingerprint technique for a better recognition of analysed products as reported by Tzouros and Arvanitoyannis [62]. Different marker compounds were found to be the most discriminating variables, which could be applied to accurate composition control of fruit jams and jellies; in particular, the phytocomplex graphical view showed that genotypes included in the α and δ PCA group (guava jelly/red guava jam and orange jam, respectively) present the highest amount of antioxidant compound classes (polyphenols and vitamin C) together with the highest amount of volatile molecules (organic acids and monoterpenes), the most responsible compounds for the product aroma. The combination of chromatographic fingerprinting and chemometrics could be an effective potential tool for quality control of fruit-based products avoiding potential voluntary or involuntary adulterations and contaminations [63]. The analysis of other samples from different origin and nature are required to ensure that the proposed methodology is applicable to the authentication of jellies and jams from Comoros Islands or to the detection of their adulteration. In the present research, this methodology only showed that jams from Comoros Islands may be differentiated among them in relation to their fruit phytochemical composition. Therefore, further additional experiments are required for demonstrating that this methodology can be used for adulteration detection and/or authentication. These hyphenated techniques could also be positively used for the evaluation and differentiation of several products in local markets setting a potential tool to obtain label certifications for the valorisation of local productions.

3. Materials and Methods

A detailed description of the used extraction protocols and analytical methods is reported in the Supplementary material.

3.1. Plant. Material

The investigated material consisted of fruit-derived products prepared from 7 species (Mangifera indica L.—two genotypes, Tamarindus indica L., Musa × paradisiaca L., Psidium cattleyanum Sabine, Litchi chinensis Sonn., Citrus sinensis (L.) Osbeck and Psidium guajava L.). Fruits were picked at commercial maturity stage during the 2017 from commercial orchards managed by the Coopérative et Mutuelle des Comores pour le Développement (Codcom) in Moroni, Comoros Islands. CODCOM is a non-governmental organization involved in poverty reduction in Comoros and in the countries of the Indian Ocean. Physiologically mature fruits were randomly selected from three plants for each biological replication (n = 3). Fruits were manually harvested from the plants based on selected qualitative parameters (e.g., colour, firmness and total soluble solids), considering also literature and experience of the local researchers and technicians. Fruits were then sorted, washed and stored in a 4 °C cold room for less than 5 days until jam and jelly preparation. Inedible parts were rejected.

3.2. Preparation of Fruit-Derived Products

A standard commercial procedure to manufacture jams and jellies was followed.
Fruit (1 kg) was reduced to fine particles with a commercial food processor for approximately 30 s. Jam formulation was 50% fruit, 48% sugar and 2% pectin mix (composed of dextrose, pectin and fumaric acid). pH was checked and adjusted if needed by addition of 50% citric acid solution (10–15 mL) to a target pH of 3.0. An essence of vanilla or cinnamon was added to improve the sensory properties of the final products. Sugar was added and the mixture was boiled for 30–40 min to a final concentration of 65°Brix (approximately 105 °C final boiling point). The jam was packed at 90 °C in 350 mL glass jars, immediately sealed with plastisol lined metal lids and inverted for 5 min to sterilize the lids. The jars were then returned to normal position for air-cooling.
For the preparation of 1 kg fruit jelly, 500 g filtered fruit juice, 550 g sugar, 5 g citric acid was used. Five g of pectin were added. The remaining sugar was mixed with fruit juice and heated until the total soluble solid (TSS) become near to 55°Brix. Then sugar mixed pectin was added and continued the heating until TSS becomes near to 58°Brix. The citric acid was added and continued the heating. When TSS of the jelly becomes 67°Brix, jelly was poured in a sterilized glass bottle and parafinning the cap.

3.3. Spectrophotometric Analysis

Total polyphenolic content (TPC) was determined according to the Folin-Ciocalteu colorimetric method [64,65]; results were expressed as mg of gallic acid equivalents (GAE) per 100 g of product (Pr).
Total anthocyanin content (TAC) was determined using the pH-differential method [66,67] and expressed as milligrams of cyanidin-3-O-glucoside (C3G) per 100 g of product (mgC3G/100 gPr).
Antioxidant activity was evaluated by Ferric Reducing Antioxidant Power (FRAP) assay [68], with the results expressed as millimoles of ferrous iron (Fe2+) equivalents per kilogram (solid food) of Pr.

3.4. Chromatographic Analysis

Chromatographic analysis was carried out using an Agilent 1200 high-performance liquid chromatograph coupled to an Agilent UV-Vis diode array detector (Agilent Technologies, Santa Clara, CA, USA), based on HPLC methods previously validated for fresh fruits, herbal medicines and other food products [2,69].Composition of solvents, used gradient elution conditions and UV-Vis wavelengths were listed and described in Table 5, while calibration parameters for all the used analytical standards were reported in Table 6 [70].

3.5. Statistical Analysis

Uni- and multivariate analysis (MVA) were carried out on all of the samples. Data were treated by one-factor analysis of variance (ANOVA) and the averages were compared with Tukey’s HSD post-hoc comparison test at significance level p < 0.05 (N = 3). Correlation between antioxidant activity and TPC/TAC was evaluated with Pearson’s coefficient (R) at p < 0.05 (N = 3). For discrimination of the investigated samples, principal component analysis (PCA) was performed on the column-centred data. All calculations were performed with statistical software package IBM SPSS Statistics 22.0 (IBM, Armonk, NY, USA).

4. Conclusions

In this study, spectrophotometric and chromatographic methods coupled to chemometrics were used for phytochemical analysis in order to detect and quantify bioactive substances and characterize nutraceutical properties and nutritional traits in fruit-based products from Comoros Islands. HPLC profile of phenolic compounds may be used as ‘‘fingerprint’’ in the detection ofquali-quantitative differences in jellies and jams.
Results showed that analysed fruit jams and jellies could be a good source of polyphenolic constituents, as benzoic and cinnamic acids, catechins and flavanols and volatile compounds, as organic acids and monoterpenes: these molecules were found to be suitable markers for product characterization because they were specific compounds of the obtained chromatographic patterns. For this reason, even if each analytical approach has its limitations which restrict its applicability, the identification of these chemical markers could be a simple, rapid and generally available potential tool for quality control and labelling of local jams and jellies.
Moreover, the characterisation of these products and their nutritional and nutraceutical traits could be important to valorise local food production and to raise incomes for local population in the Comoros Islands, particularly women that work in agri-food industry. The obtained incomes could be useful to reduce poverty; indeed, the advances in local food production can be important in poverty reduction and deserves greater attention in rural development: it is necessary to link the evidence of poverty impact to simple policy recommendations in order to potentially integrate the promotion of local fruit-based products into national-level planning.
Finally, further benefits of this approach include the potential for a better nutrition, maintenance of biodiversity and environmentally sustainable food systems.

Supplementary Materials

The supplementary materials are available online.

Author Contributions

D.D., S.H., C.G. and G.L.B. conceived and designed the experiments; S.H. proceeded to collect plant material and prepare fruit-based products; D.D. performed the chemical experiments and instrumental HPLC analysis; D.D. and M.G.M. statistically analysed the data; M.D.B., I.R. and G.G. contributed to manuscript elaboration; D.D. wrote the paper. All authors have read and approved the final manuscript.

Funding

This research received no external funding.

Conflicts of Interest

Authors declare no conflict of interest.

References

  1. Sewall, B.J.; Granek, E.F.; Trewhella, W.J. The endemic Comoros Islands fruit bat Rousettus obliviosus: Ecology, conservation, and red list status. Oryx 2003, 37, 344–352. [Google Scholar] [CrossRef]
  2. Soifoini, T.; Donno, D.; Jeannoda, V.; Rakotoniaina, E.; Hamidou, S.; Achmet, S.M.; Solo, N.R.; Afraitane, K.; Giacoma, C.; Beccaro, G.L. Bioactive compounds, nutritional traits, and antioxidant properties of Artocarpus altilis (Parkinson) fruits: Exploiting a potential functional food for food security on the Comoros Islands. J. Food Qual. 2018, in press. [Google Scholar] [CrossRef]
  3. Clevidence, B. Tropical and subtropical fruits: Phytonutrients and anticipated health benefits. In Proceedings of the III International Symposium on Tropical and Subtropical Fruits, Fortaleza, Ceara, Brazil, 12–17 September 2004; pp. 485–498. [Google Scholar]
  4. Lim, Y.Y.; Lim, T.T.; Tee, J.J. Antioxidant properties of several tropical fruits: A comparative study. Food Chem. 2007, 103, 1003–1008. [Google Scholar] [CrossRef]
  5. Sajise, P.; Ahmad, I. Conservation and sustainable use of tropical and sub-tropical fruits: Current status and prospects. In Proceedings of the International Workshop on Tropical and Subtropical Fruits, Chiang Mai, Thailand, April 2007; pp. 97–112. [Google Scholar]
  6. Chivandi, E.; Mukonowenzou, N.; Nyakudya, T.; Erlwanger, K.H. Potential of indigenous fruit-bearing trees to curb malnutrition, improve household food security, income and community health in sub-saharan africa: A review. Food Res. Int. 2015, 76, 980–985. [Google Scholar] [CrossRef]
  7. Reardon, T.; Barrett, C.B.; Berdegué, J.A.; Swinnen, J.F.M. Agrifood industry transformation and small farmers in developing countries. World Dev. 2009, 37, 1717–1727. [Google Scholar] [CrossRef]
  8. Singh, S.; Jain, S.; Singh, S.; Singh, D. Quality changes in fruit jams from combinations of different fruit pulps. J. Food Process. Preserv. 2009, 33, 41–57. [Google Scholar] [CrossRef]
  9. Codex_Alimentarius. Codex Standard for Jams, Jellies and Marmalades (Codex Stan 296-2009). Available online: http://www.codexalimentarius.org (accessed on 27 March 2018).
  10. Kim, D.O.; Padilla-Zakour, O. Jam processing effect on phenolics and antioxidant capacity in anthocyanin-Rich fruits: Cherry, plum, and raspberry. J. Food Sci. 2004, 69, S395–S400. [Google Scholar] [CrossRef]
  11. Rosa, A.; Atzeri, A.; Deiana, M.; Scano, P.; Incani, A.; Piras, C.; Cesare Marincola, F. Comparative antioxidant activity and 1H NMR profiling of Mediterranean fruit products. Food Res. Int. 2015, 69, 322–330. [Google Scholar] [CrossRef]
  12. Puiggròs, F.; Solà, R.; Bladé, C.; Salvadó, M.-J.; Arola, L. Nutritional biomarkers and foodomic methodologies for qualitative and quantitative analysis of bioactive ingredients in dietary intervention studies. J. Chromatogr. A 2011, 1218, 7399–7414. [Google Scholar] [CrossRef] [PubMed]
  13. Donno, D.; Cavanna, M.; Beccaro, G.L.; Mellano, M.G.; Torello-Marinoni, D.; Cerutti, A.K.; Bounous, G. Currants and strawberries as bioactive compound sources: Determination of antioxidant profiles with HPLC-DAD/MS. J. App. Bot. Food Qual. 2013, 86, 1–10. [Google Scholar]
  14. Gonzalez-Molina, E.; Moreno, D.A.; Garcia-Viguera, C. Genotype and harvest time influence the phytochemical quality of fino lemon juice (Citrus limon (L.) Burm. F.) for industrial use. J. Agric. Food Chem. 2008, 56, 1669–1675. [Google Scholar] [CrossRef] [PubMed]
  15. Tibaldi, G.; Fontana, E.; Nicola, S. Growing conditions and postharvest management can affect the essential oil of Origanum vulgare L. spp. hirtum (Link) ietswaart. Ind. Crop. Prod. 2011, 34, 1516–1522. [Google Scholar] [CrossRef]
  16. Bengoechea, M.L.; Sancho, A.I.; Bartolomé, B.; Estrella, I.; Gómez-Cordovés, C.; Hernández, M.T. Phenolic composition of industrially manufactured purees and concentrates from peach and apple fruits. J. Agric. Food Chem. 1997, 45, 4071–4075. [Google Scholar] [CrossRef]
  17. Dragovic-Uzelac, V.; Pospišil, J.; Levaj, B.; Delonga, K. The study of phenolic profiles of raw apricots and apples and their purees by HPLC for the evaluation of apricot nectars and jams authenticity. Food Chem. 2005, 91, 373–383. [Google Scholar] [CrossRef]
  18. Clifford, M.N. Anthocyanins—Nature, occurrence and dietary burden. J. Agric. Food Chem. 2000, 80, 1063–1072. [Google Scholar] [CrossRef]
  19. Banaś, A.; Korus, A.; Tabaszewska, M. Quality assessment of low-sugar jams enriched with plant raw materials exhibiting health-promoting properties. J. Food Sci. Technol. 2018, 55, 408–417. [Google Scholar] [CrossRef] [PubMed]
  20. Poiana, M.-A.; Moigradean, D.; Dogaru, D.; Mateescu, C.; Raba, D.; Gergen, I. Processing and storage impact on the antioxidant properties and color quality of some low sugar fruit jams. Rom. Biotechnol. Lett. 2011, 16, 6504–6512. [Google Scholar]
  21. Rababah, T.M.; Al-Mahasneh, M.A.; Kilani, I.; Yang, W.; Alhamad, M.N.; Ereifej, K.; Al-u’datt, M. Effect of jam processing and storage on total phenolics, antioxidant activity, and anthocyanins of different fruits. J. Sci. Food Agric. 2011, 91, 1096–1102. [Google Scholar] [CrossRef] [PubMed]
  22. Heimler, D.; Romani, A.; Ieri, F. Plant polyphenol content, soil fertilization and agricultural management: A review. Eur. Food Res. Technol. 2017, 243, 1107–1115. [Google Scholar] [CrossRef]
  23. Donno, D.; Randriamampionona, D.; Andriamaniraka, H.; Torti, V.; Mellano, M.G.; Giacoma, C.; Beccaro, G.L. Biodiversity and traditional medicinal plants from Madagascar: Phytochemical evaluation of Brachylaena ramiflora (DC.) Humbert decoctions and infusions. J. Appl. Bot. Food Qual. 2017, 90, 205–2013. [Google Scholar]
  24. Šavikin, K.; Zdunić, G.; Janković, T.; Tasić, S.; Menković, N.; Stević, T.; Đorđević, B. Phenolic content and radical scavenging capacity of berries and related jams from certificated area in Serbia. Plant. Food Hum. Nutr. 2009, 64, 212–217. [Google Scholar] [CrossRef] [PubMed]
  25. Da Silva Pinto, M.; Lajolo, F.M.; Genovese, M.I. Bioactive compounds and antioxidant capacity of strawberry jams. Plant. Food Hum. Nutr. 2007, 62, 127–131. [Google Scholar] [CrossRef] [PubMed]
  26. Wang, H.; Cao, G.; Prior, R.L. Oxygen radical absorbing capacity of anthocyanins. J. Agric. Food Chem. 1997, 45, 304–309. [Google Scholar] [CrossRef]
  27. Veberic, R.; Slatnar, A.; Bizjak, J.; Stampar, F.; Mikulic-Petkovsek, M. Anthocyanin composition of different wild and cultivated berry species. LWT-Food Sci. Technol. 2015, 60, 509–517. [Google Scholar] [CrossRef]
  28. Jia, N.; Xiong, Y.L.; Kong, B.; Liu, Q.; Xia, X. Radical scavenging activity of black currant (Ribes nigrum L.) extract and its inhibitory effect on gastric cancer cell proliferation via induction of apoptosis. J. Funct. Foods 2012, 4, 382–390. [Google Scholar] [CrossRef]
  29. Donno, D.; Beccaro, G.L.; Mellano, M.G.; Cerutti, A.K.; Bounous, G. Goji berry fruit (Lycium spp.): Antioxidant compound fingerprint and bioactivity evaluation. J. Funct. Foods 2015, 18, 1070–1085. [Google Scholar] [CrossRef]
  30. Silva, B.M.; Andrade, P.B.; Gonçalves, A.C.; Seabra, R.M.; Oliveira, M.B.; Ferreira, M.A. Influence of jam processing upon the contents of phenolics, organic acids and free amino acids in quince fruit (Cydonia oblonga Miller). Eur. Food Res. Technol. 2004, 218, 385–389. [Google Scholar] [CrossRef]
  31. Wojdyło, A.; Oszmiański, J.; Bielicki, P. Polyphenolic composition, antioxidant activity, and polyphenol oxidase (PPO) activity of quince (Cydonia oblonga Miller) varieties. J. Agric. Food Chem. 2013, 61, 2762–2772. [Google Scholar] [CrossRef] [PubMed]
  32. Cabral, T.A.; de Morais Cardoso, L.; Pinheiro-Sant’Ana, H.M. Chemical composition, vitamins and minerals of a new cultivar of lychee (Litchi chinensis cv. Tailandes) grown in Brazil. Fruits 2014, 69, 425–434. [Google Scholar] [CrossRef]
  33. Singh, D.; Wangchu, L.; Moond, S.K. Processed Products of Tamarind. Nat. Prod. Radiance 2007, 6, 315–321. [Google Scholar]
  34. Jimoh, S.; Onabanjo, O. Potentials of Tamarindus indica (L.) in jam production. J. Agric. Soc. Res. 2012, 12, 29–43. [Google Scholar]
  35. Marquina, V.; Araujo, L.; Ruíz, J.; Rodríguez-Malaver, A.; Vit, P. Composition and antioxidant capacity of the guava (Psidium guajava L.) fruit, pulp and jam. Arch. Latinoam. Nutr. 2008, 58, 98–102. [Google Scholar] [PubMed]
  36. Sánchez-Salcedo, E.M.; Mena, P.; García-Viguera, C.; Martínez, J.J.; Hernández, F. Phytochemical evaluation of white (Morus alba L.) and black (Morus nigra L.) mulberry fruits, a starting point for the assessment of their beneficial properties. J. Funct. Foods 2015, 12, 399–408. [Google Scholar] [CrossRef]
  37. Garcia-Viguera, C.; Tomás-Barberán, F.A.; Ferreres, F.; Artés, F.; Tomás-Lorente, F. Determination of Citrus jams genuineness by flavonoid analysis. Eur. Food Res. Technol. 1993, 197, 255–259. [Google Scholar]
  38. Del Rio, D.; Rodriguez-Mateos, A.; Spencer, J.P.; Tognolini, M.; Borges, G.; Crozier, A. Dietary (poly) phenolics in human health: Structures, bioavailability, and evidence of protective effects against chronic diseases. Antioxid. Redox Signal. 2013, 18, 1818–1892. [Google Scholar] [CrossRef] [PubMed]
  39. Kansci, G.; Koubala, B.B.; Mbome, I.L. Biochemical and physicochemical properties of four mango varieties and some quality characteristics of their jams. J. Food Process. Preserv. 2008, 32, 644–655. [Google Scholar] [CrossRef]
  40. López, R.; Ramírez, A.; de Fariñas Graziani, L. Physicochemical and microbiological evaluation of 3 commercial guava jams (Psidium guajava L.). Arch. Latinoam. Nutr. 2000, 50, 291–295. [Google Scholar] [PubMed]
  41. Seeram, N.P. Berry fruits: Compositional elements, biochemical activities, and the impact of their intake on human health, performance, and disease. J. Agric. Food Chem. 2008, 56, 627–629. [Google Scholar] [CrossRef] [PubMed]
  42. Ammar, I.; Ennouri, M.; Bouaziz, M.; Ben Amira, A.; Attia, H. Phenolic profiles, phytchemicals and mineral content of decoction and infusion of Opuntia ficus-indica flowers. Plant. Food Hum. Nutr. 2015, 70, 388–394. [Google Scholar] [CrossRef] [PubMed]
  43. Landete, J.M. Ellagitannins, ellagic acid and their derived metabolites: A review about source, metabolism, functions and health. Food Res. Int. 2011, 44, 1150–1160. [Google Scholar] [CrossRef]
  44. Ştefănuţ, M.N.; Căta, A.; Pop, R.; Moşoarcă, C.; Zamfir, A.D. Anthocyanins HPLC-DAD and MS characterization, total phenolics, and antioxidant activity of some berries extracts. Anal. Lett. 2011, 44, 2843–2855. [Google Scholar] [CrossRef]
  45. Garzon, G.; Wrolstad, R. Comparison of the stability of pelargonidin-based anthocyanins in strawberry juice and concentrate. J. Food Sci. 2002, 67, 1288–1299. [Google Scholar] [CrossRef]
  46. Kammerer, D.; Carle, R.; Schieber, A. Detection of peonidin and pelargonidin glycosides in black carrots (Daucus carota ssp. Sativus var. Atrorubens alef.) by high-performance liquid chromatography/electrospray ionization mass spectrometry. Rapid Commun. Mass Spectrom. 2003, 17, 2407–2412. [Google Scholar] [CrossRef] [PubMed]
  47. Schwarz, M.; Wray, V.; Winterhalter, P. Isolation and identification of novel pyranoanthocyanins from black carrot (Daucus carota L.) juice. J. Agric. Food Chem. 2004, 52, 5095–5101. [Google Scholar] [CrossRef] [PubMed]
  48. Papaefthimiou, D.; Papanikolaou, A.; Falara, V.; Givanoudi, S.; Kostas, S.; Kanellis, A.K. Genus Cistus: A model for exploring labdane-type diterpenes’ biosynthesis and a natural source of high value products with biological, aromatic, and pharmacological properties. Front. Chem. 2014, 2, 35. [Google Scholar] [CrossRef] [PubMed]
  49. Trombetta, D.; Castelli, F.; Sarpietro, M.G.; Venuti, V.; Cristani, M.; Daniele, C.; Saija, A.; Mazzanti, G.; Bisignano, G. Mechanisms of antibacterial action of three monoterpenes. Antimicrob. Agents Chemother. 2005, 49, 2474–2478. [Google Scholar] [CrossRef] [PubMed]
  50. Crowell, P.L. Prevention and therapy of cancer by dietary monoterpenes. J. Nutr. 1999, 129, S775–S778. [Google Scholar] [CrossRef] [PubMed]
  51. Cazares-Franco, M.C.; Ramirez-Chimal, C.; Herrera-Hernandez, M.G.; Nunez-Colin, C.A.; Hernandez-Martinez, M.A.; Guzman-Maldonado, S.H. Physicochemical, nutritional and health-related component characterization of the underutilized mexican serviceberry fruit Malacomeles denticulata (Kunth) G. N. Jones. Fruits 2014, 69, 47–60. [Google Scholar] [CrossRef]
  52. Mattila, P.H.; Hellström, J.; McDougall, G.; Dobson, G.; Pihlava, J.-M.; Tiirikka, T.; Stewart, D.; Karjalainen, R. Polyphenol and vitamin c contents in European commercial blackcurrant juice products. Food Chem. 2011, 127, 1216–1223. [Google Scholar] [CrossRef] [PubMed]
  53. Georgé, S.; Brat, P.; Alter, P.; Amiot, M.J. Rapid determination of polyphenols and vitamin c in plant-derived products. J. Agric. Food Chem. 2005, 53, 1370–1373. [Google Scholar] [CrossRef] [PubMed]
  54. Donno, D.; Cerutti, A.K.; Prgomet, I.; Mellano, M.G.; Beccaro, G.L. Foodomics for mulberry fruit (Morus spp.): Analytical fingerprint as antioxidants’ and health properties’ determination tool. Food Res. Inter. 2015, 69, 179–188. [Google Scholar] [CrossRef]
  55. Fügel, R.; Carle, R.; Schieber, A. Quality and authenticity control of fruit purées, fruit preparations and jams—A review. Trends Food Sci. Technol. 2005, 16, 433–441. [Google Scholar] [CrossRef]
  56. Eyduran, S.P.; Ercisli, S.; Akin, M.; Beyhan, O.; Gecer, M.K.; Eyduran, E.; Erturk, Y.E. Organic acids, sugars, vitamin c, antioxidant capacity and phenolic compounds in fruits of white (Morus alba L.) and black (Morus nigra L.) mulberry genotypes. J. Appl. Bot. Food Qual. 2015, 88, 134–138. [Google Scholar]
  57. Soyer, Y.; Koca, N.; Karadeniz, F. Organic acid profile of turkish white grapes and grape juices. J. Food Compos. Anal. 2003, 16, 629–636. [Google Scholar] [CrossRef]
  58. Cejudo-Bastante, C.; Castro-Mejías, R.; Natera-Marín, R.; García-Barroso, C.; Durán-Guerrero, E. Chemical and sensory characteristics of orange based vinegar. J. Food Sci. Technol. 2016, 53, 3147–3156. [Google Scholar] [CrossRef] [PubMed]
  59. Flores, P.; Hellín, P.; Fenoll, J. Determination of organic acids in fruits and vegetables by liquid chromatography with tandem-mass spectrometry. Food Chem. 2012, 132, 1049–1054. [Google Scholar] [CrossRef]
  60. Chinnici, F.; Spinabelli, U.; Riponi, C.; Amati, A. Optimization of the determination of organic acids and sugars in fruit juices by ion-exclusion liquid chromatography. J. Food Compos. Anal. 2005, 18, 121–130. [Google Scholar] [CrossRef]
  61. Touati, N.; Tarazona-Díaz, M.P.; Aguayo, E.; Louaileche, H. Effect of storage time and temperature on the physicochemical and sensory characteristics of commercial apricot jam. Food Chem. 2014, 145, 23–27. [Google Scholar] [CrossRef] [PubMed]
  62. Tzouros, N.; Arvanitoyannis, I. Agricultural produces: Synopsis of employed quality control methods for the authentication of foods and application of chemometrics for the classification of foods according to their variety or geographical origin. Crit. Rev. Food Sci. Nutr. 2001, 41, 287–319. [Google Scholar] [CrossRef] [PubMed]
  63. Reid, L.M.; O’Donnell, C.P.; Downey, G. Potential of SPME-GC and chemometrics to detect adulteration of soft fruit purees. J. Agric. Food Chem. 2004, 52, 421–427. [Google Scholar] [CrossRef] [PubMed]
  64. Slinkard, K.; Singleton, V.L. Total phenol analysis: Automation and comparison with manual methods. Am. J. Enol. Vitic. 1977, 28, 49–55. [Google Scholar]
  65. Sánchez-Rangel, J.C.; Benavides, J.; Heredia, J.B.; Cisneros-Zevallos, L.; Jacobo-Velázquez, D.A. The Folin–Ciocalteu assay revisited: Improvement of its specificity for total phenolic content determination. Anal. Methods 2013, 5, 5990–5999. [Google Scholar] [CrossRef]
  66. Lee, J.; Durst, R.W.; Wrolstad, R.E. Determination of total monomeric anthocyanin pigment content of fruit juices, beverages, natural colorants, and wines by the pH differential method: Collaborative study. J. AOAC Int. 2005, 88, 1269–1278. [Google Scholar] [PubMed]
  67. Giusti, M.M.; Wrolstad, R.E. Characterization and measurement of anthocyanins by UV-visible spectroscopy. Curr. Protoc. Food Anal. Chem. 2001, 00, F1.2.1–F1.2.13. [Google Scholar] [CrossRef]
  68. Benzie, I.F.; Strain, J.J. Ferric reducing/antioxidant power assay: Direct measure of total antioxidant activity of biological fluids and modified version for simultaneous measurement of total antioxidant power and ascorbic acid concentration. Meth. Enzymol. 1999, 299, 15–27. [Google Scholar] [PubMed]
  69. Donno, D.; Mellano, M.G.; Prgomet, Z.; Beccaro, G.L. Advances in Ribes × nidigrolaria Rud. Bauer and A. Bauer fruits as potential source of natural molecules: A preliminary study on physico-chemical traits of an underutilized berry. Sci. Hortic. 2018, 237, 20–27. [Google Scholar] [CrossRef]
  70. Donno, D.; Mellano, M.G.; De Biaggi, M.; Riondato, I.; Rakotoniaina, E.N.; Beccaro, G.L. New findings in Prunus padus L. fruits as a source of natural compounds: Characterization of metabolite profiles and preliminary evaluation of antioxidant activity. Molecules 2018, 23, 725. [Google Scholar] [CrossRef] [PubMed]
  71. Mok, D.K.W.; Chau, F.T. Chemical information of chinese medicines: A challenge to chemist. Chemom. Intell. Lab. Syst. 2006, 82, 210–217. [Google Scholar] [CrossRef]
Sample Availability: Samples of the compounds are not available from the authors.
Figure 1. Phytocomplex representation of analysed fruit-derived products. The mean value of each analysed sample is given (N = 3).
Molecules 23 02707 g001
Figure 2. Polyphenolic phytocomplex representation of analysed fruit-derived products. The mean value of each analysed sample is given (N = 3).
Molecules 23 02707 g002
Figure 3. Total organic acid content of analysed fruit-derived products. The mean value of each analysed sample is given (N = 3). Different letters for each class indicate the significant differences at p < 0.05. Results are expressed as mg/100 g of product.
Molecules 23 02707 g003
Figure 4. Total sugar content of analysed fruit-derived products. The mean value of each analysed sample is given (N = 3). Different letters for each class indicate the significant differences at p < 0.05. Results are expressed as g/100 g of product.
Molecules 23 02707 g004
Figure 5. PCA score plot of fruit-derived products (eight samples and three replications per sample). The ellipses around each object group only indicate the position of a category in the plot without statistical meaning, based on the phytochemical results.
Molecules 23 02707 g005
Figure 6. PCA loading plot of fruit-based products showing correlation among nutritional traits, nutraceutical properties and bioactive compound classes and PCs.
Molecules 23 02707 g006
Table 1. Nutraceutical traits of the analysed fruit-derived products.
Total Polyphenolic ContentAntioxidant ActivityTotal Anthocyanin Content
(mgGAE/100 gPr)(mmol Fe2+/kgpr)(mgC3G/100 gPr)
SampleIDMean ValueSDTukey TestMean ValueSDTukey TestMean ValueSDTukey Test
mango jamCM111.111.34a4.712.07a1.480.26ab
mango jamCM210.982.18a7.860.36b0.590.25a
tamarind jamCM3484.9581.89d23.970.28d0.870.43ab
banana flowerCM413.061.85a19.231.29c4.491.62c
guava jellyCM5437.132.44d25.400.35d8.351.13d
lychee jamCM6266.967.95c23.010.07d3.150.66bc
orange jamCM7124.5027.49b16.620.89c9.560.46d
red guava jamCM8625.3467.86e25.500.28d4.990.67c
Mean value and standard deviation (SD) of each sample is given (N = 3). Different letters for each class indicate the significant differences at p < 0.05. GAE = gallic acid equivalent; C3G = cyanidin 3-O-glucoside. Pr = product.
Table 2. Phytochemical fingerprint of the polyphenolic compounds in analysed jams and jellies.
Mango Jam, CM1Mango Jam, CM2Tamarind Jam, CM3Banana Flower, CM4Guava Jelly, CM5Lychee Jam, CM6Orange Jam, CM7Red Guava Jam, CM8
Mean ValueSDMean ValueSDMean ValueSDMean ValueSDMean ValueSDMean ValueSDMean ValueSDMean ValueSD
Cinnamic acidscaffeic acid0.6780.1700.7610.1010.4980.1340.7490.1540.6870.0340.7640.1160.5710.1100.7440.204
chlorogenic acidn.d./n.d./11.4540.731n.d./13.7660.546n.d./12.9710.185n.d./
coumaric acidn.d./n.d./n.d./0.5560.509n.d./n.d./n.d./5.5830.797
ferulic acidn.d./n.d./1.3770.217n.d./n.d./n.d./1.0010.110n.d./
Flavonolshyperosiden.d./n.d./n.d./0.3560.033n.d./1.0270.116n.d./n.d./
isoquercitrinn.d./n.d./0.4910.006n.d./0.5250.034n.d./1.1400.1100.5410.155
quercetinn.d./n.d./11.4410.963n.d./7.5620.034n.d./15.6941.1077.6210.204
quercitrin0.1610.0300.0070.0031.6400.2570.1730.0191.0010.0341.3340.1161.1520.1101.4770.256
rutin0.9360.0360.8580.034n.d./n.d./n.d./n.d./n.d./n.d./
Benzoic acidsellagic acid1.1670.2641.2280.15423.3021.9621.6040.3654.4440.3163.7990.11657.1051.6374.5610.607
gallic acid0.6680.1051.5350.2328.5710.3140.6110.07042.0230.58230.6500.88687.7241.81240.9551.727
Catechinscatechin0.8720.0231.7490.17540.6441.5581.2160.1620.3270.034n.d./0.4360.1104.2870.204
epicatechin3.6830.3281.7470.400n.d./1.3480.1842.5230.034n.d./2.0150.1104.0310.157
Tanninscastalaginn.d./n.d./n.d./2.5950.4254.3840.034n.d./15.2102.4149.7730.295
vescalagin3.6390.1740.3590.008n.d./1.5540.3714.3390.205n.d./3.0310.11010.0120.204
Mean value and standard deviation (SD) of each sample is given (N = 3). Results are expressed as mg/100 gPr. Pr = product. n.d. = not detected.
Table 3. Phytochemical fingerprint of monoterpenes and vitamin C in analysed jams and jellies.
Mango Jam, CM1Mango Jam, CM2Tamarind Jam, CM3Banana Flower, CM4Guava Jelly, CM5Lychee Jam, CM6Orange Jam, CM7Red Guava Jam, CM8
Mean ValueSDMean ValueSDMean ValueSDMean ValueSDMean ValueSDMean ValueSDMean ValueSDMean ValueSD
Monoterpeneslimonene103.5293.11631.2010.588n.d./n.d./102.7500.58233.6020.68718.8180.47251.3193.204
phellandrene27.8432.3807.8090.5407.4970.219n.d./4.6710.0344.6680.116n.d./4.9460.204
sabinene8.1400.04512.1871.14611.2731.180n.d./12.8471.02012.8110.687n.d./12.3320.797
γ-terpinene24.5522.46448.0672.301n.d./17.9492.09739.0020.03419.0690.49237.0840.50543.0050.155
terpinolenen.d./n.d./26.9442.7188.2280.2137.7310.0347.4730.8867.9260.1107.7150.564
Vitamin Cascorbic acid15.0580.36210.1780.07220.3970.11749.6990.35618.0740.13818.9780.05754.0620.07419.1040.487
dehydroascorbic acid0.8130.1301.8150.1633.7670.2833.1230.2131.1380.1921.1960.22532.0030.4011.2790.234
Mean value and standard deviation (SD) of each sample is given (N = 3). Results are expressed as mg/100gPr. Pr = product. n.d. = not detected.
Table 4. Phytochemical fingerprint of nutritional substances in analysed jams and jellies.
Mango Jam, CM1Mango Jam, CM2Tamarind Jam, CM3Banana Flower, CM4Guava Jelly, CM5Lychee Jam, CM6Orange Jam, CM7Red Guava Jam, CM8
Mean ValueSDMean ValueSDMean ValueSDMean ValueSDMean ValueSDMean ValueSDMean ValueSDMean ValueSD
Organic acidscitric acid16.2174.05829.6960.469522.5832.566694.5803.627326.9503.030268.4222.629287.9114.614200.4082.204
malic acid357.8783.679302.5282.531n.d./21.9261.696n.d./n.d./n.d./n.d./
oxalic acid4.7410.1984.5730.41621.4440.5308.4410.1028.1940.117n.d./6.6290.11023.7170.797
quinic acidn.d./n.d./n.d./n.d./n.d./138.2331.263391.1282.192n.d./
succinic acidn.d./n.d./n.d./n.d./n.d./n.d./406.6484.401n.d./
tartaric acidn.d./n.d./n.d./n.d./76.7241.513105.3584.157193.4973.661134.6371.729
Sugarsfructose11.7010.03811.3160.10015.3530.14012.2750.28721.3410.03414.8140.11613.6200.11014.4280.204
glucose14.5050.32113.6200.40127.6372.32612.3420.11112.6150.03411.0440.11613.0900.11013.4130.155
sucrose13.4440.33914.8310.68013.5090.23111.1311.08411.8010.86714.5730.49214.9350.11014.9040.157
Mean value and standard deviation (SD) of each sample is given (N = 3). Results are expressed as mg/100gPr. Pr = product. n.d. = not detected.
Table 5. Chromatographic conditions of the used methods.
MethodCompounds of InterestStationary PhaseMobile PhaseFlow (mL min−1)Wavelength (nm)
Acinnamic acids, flavanols KINETEX-C18 column (4.6 × 150 mm, 5 μm)A: 10 mM KH2PO4/H3PO4, pH = 2.81.5330
B: CH3CN
Bbenzoic acids, catechins, KINETEX-C18 column (4.6 × 150 mm, 5 μm)A: H2O/CH3OH/HCOOH (5:95:0.1 v/v/v), pH = 2.50.6280
tannins B: CH3OH/HCOOH (100:0.1 v/v)
Cmonoterpenes KINETEX-C18 column (4.6 × 150 mm, 5 μm)A: H2O1.0210, 220,
B: CH3CN 235, 250
Dorganic acids KINETEX-C18 column (4.6 × 150 mm, 5 μm)A: 10 mM KH2PO4/H3PO4, pH = 2.80.6214
B: CH3CN
Evitamins KINETEX-C18 column (4.6 × 150 mm, 5 μm)A: 5 mM C16H33N(CH3)3Br/50 mM KH2PO4, pH = 2.50.9261, 348
B: CH3OH
Fsugars SphereClone-NH2 column (4.6 × 250 mm, 5 μm)A: H2O0.5200, 267,
B: CH3CN 286
Elution conditions. Method A: gradient analysis: 5%B to 21%B in 17 min + 21%B in 3 min (2 min conditioning time); Method B: gradient analysis: 3%B to 85%B in 22 min + 85%B in 1 min (2 min conditioning time); Method C: gradient analysis: 30%B to 56%B in 15 min + 56%B in 2 min (3 min conditioning); Method D: gradient analysis: 5%B to 14%B in 10 min + 14%B in 3 min (2 min conditioning time); Method E: isocratic analysis: ratio of phase A and B: 95:5 in 10 min (5 min conditioning time); Method F: isocratic analysis: ratio of phase A and B: 5:85 in 12 min (3 min conditioning time). Chromatographic separation was performed on a Kinetex-C18 column (Phenomenex, Torrance, CA, USA) and a SphereClone-NH2 column (Phenomenex, Torrance, CA, USA).
Table 6. Calibration parameters for all the used analytical standards.
ClassStandardCalibration Curve EquationR2Calibration Curve Range (mg L−1)
Cinnamic acidscaffeic acidy = 59.046x + 200.60.996111–500
chlorogenic acidy = 13.583x + 760.050.984111–500
coumaric acidy = 8.9342x + 217.40.997111–500
ferulic acidy = 3.3963x − 4.95241.000111–500
Flavonolshyperosidey = 7.1322x − 4.5830.999111–500
isoquercitriny = 8.3078x + 26.6210.999111–500
quercetiny = 3.4095x − 98.3070.998111–500
quercitriny = 2.7413x + 5.63670.998111–500
rutiny = 6.5808x + 30.8310.999111–500
Benzoic acidsellagic acidy = 29.954x + 184.520.99862.5–250
gallic acidy = 44.996x + 261.860.99962.5–250
Catechinscatechiny = 8.9197x + 66.9521.00062.5–250
epicatechiny = 12.88x − 43.8160.99962.5–250
Tanninscastalaginy = 4.236x − 8.5351.00062.5–250
vescalaginy = 4.939x − 1.2321.00062.5–250
Monoterpeneslimoneney = 0.1894x − 5.4200.999125–1000
phellandreney = 8.783x − 145.30.998125–1000
sabineney = 18.14x − 10040.998125–1000
γ-terpineney = 0.4886x − 23.020.999125–1000
terpinoleney = 26.52x + 876.80.999125–1000
Organic acidscitric acidy = 1.0603x − 22.0921.000167–1000
malic acidy = 1.415x − 80.2540.996167–1000
oxalic acidy = 6.4502x + 6.15030.998167–1000
quinic acidy = 0.8087x − 38.0210.998167–1000
succinic acidy = 0.9236x − 8.08230.995167–1000
tartaric acidy = 1.8427x + 15.7961.000167–1000
Vitaminsascorbic acidy = 42.71x + 27.9690.999100–1000
dehydroascorbic acidy = 4.1628x + 140.010.99930–300
Sugarfructosey = 1.8548x + 1.23240.999125–1000
glucosey = 0.1269x − 0.11070.998125–1000
sucrosey = 0.296x − 3.22021.000125–1000
Single bioactive molecules were identified and quantified using selected biomarkers with a positive role in human health (“multi-marker approach”) according to Mok and Chau [71]. All the results were expressed as mg/100 g of product (Pr), except sugars (expressed as g/100 g of Pr). Total bioactive compound content (TBCC) were determined as sum of selected compounds and expressed as mg/100 g of product.

