Comparative Evaluation of Total Antioxidant Capacities of Plant Polyphenols


Abstract
:
1. Introduction
2. Results and Discussion


| Compound | 1 | 2 | 3 | 4 | 5 | 6 |
|---|---|---|---|---|---|---|
| Hydroxybenzoic acids | ||||||
| 2,3-dihydroxybenzoic acid | COOH | OH | OH | H | H | H |
| 4-hydroxybenzoic acid | COOH | H | H | OH | H | H |
| Gallic acid | COOH | H | OH | OH | OH | H |
| Syringic acid | COOH | H | OMe | OH | OMe | H |
| Vanillic acid | COOH | H | OMe | OH | H | H |
| Hydroxycinnamic acids | ||||||
| Caffeic acid | Acr | H | OH | OH | H | H |
| Caftaric acid | AcrTa | H | OH | OH | H | H |
| p-coumaric acid | Acr | H | H | OH | H | H |
| Trans-3-hydroxycinnamic acid | Acr | H | OH | H | H | H |
| Trans-ferulic acid | Acr | H | OMe | OH | H | H |
| o-coumaric acid | Acr | H | H | H | H | OH |

| Compound | 2–3 | 3 | 4 | 7 | 3′ | 4′ | 5′ |
|---|---|---|---|---|---|---|---|
| Anthocyanidins | |||||||
| Cyanidin | d | H | OH | OH | OH | H | OH |
| Delphinidin | d | H | OH | OH | OH | OH | OH |
| Malvidin | d | H | OH | OMe | OH | OMe | OH |
| Pelargonidin | d | H | OH | H | OH | H | OH |
| Dihydroflavonols | |||||||
| Dihydrokaempferol | s | 2H | =O | OH | H | OH | H |
| Dihydromyricetin | s | 2H | =O | OH | OH | OH | OH |
| Dihydroquercetin | s | 2H | =O | OH | OH | OH | H |
| Flavanols | |||||||
| Catechin | s | OH | 2H | OH | OH | OH | H |
| Epicatechin | s | OH | 2H | OH | OH | OH | H |
| Flavanones | |||||||
| Hesperetin | s | 2H | =O | OH | OH | OMe | H |
| Hesperidin (Hesperetin-7-O-rutinoside) | s | 2H | =O | ORut | OH | OMe | H |
| Naringenin | s | 2H | =O | OH | H | OH | H |
| Flavone | |||||||
| Apigenin | d | H | =O | OH | H | OH | H |
| Flavonols | |||||||
| Galangin | d | OH | =O | OH | H | H | H |
| Isorhamnetin | d | OH | =O | OH | OMe | OH | H |
| Kaempferol | d | OH | =O | OH | H | OH | H |
| Kaempferol-3-O-glucoside | d | OGlc | =O | OH | H | OH | H |
| Kaempferol-3-O-glucuronide | d | OGln | =O | OH | H | OH | H |
| Kaempferol-3-O-rutinoside | d | ORut | =O | OH | H | OH | H |
| Myricetin | d | OH | =O | OH | OH | OH | OH |
| Myricetin-3-O-glucoside | d | OGlc | =O | OH | OH | OH | OH |
| Quercetin | d | OH | =O | OH | OH | OH | H |
| Quercetin-3-O-galactoside | d | OGal | =O | OH | OH | OH | H |
| Quercetin-3-O-glucoside | d | OGlc | =O | OH | OH | OH | H |
| Quercetin-3-O-glucuronide | d | OGln | =O | OH | OH | OH | H |
| Quercetin-3-O-rutinoside | d | ORut | =O | OH | OH | OH | H |
| Compound | TEAC | FRAP | DPPH | FC |
|---|---|---|---|---|
| Anthocyanidins | ||||
| Cyanidin | 1.267 | 2.136 | 1.445 | 1.245 |
| Delphinidin | 2.030 | 2.043 | 1.585 | 1.173 |
| Malvidin | 1.402 | 1.066 | 0.714 | 0.942 |
| Pelargonidin | 0.998 | 1.155 | 0.577 | 0.597 |
| Dihydroflavonols | ||||
| Dihydrokaempferol | 0.307 | 0.092 | 0.029 | 0.741 |
| Dihydromyricetin | 1.256 | 0.747 | 1.003 | 0.603 |
| Dihydroquercetin | 0.598 | 0.962 | 0.741 | 0.785 |
| Flavanols | ||||
| Catechin | 1.888 | 1.255 | 1.146 | 1.040 |
| Epicatechin | 2.081 | 1.082 | 0.178 | 0.987 |
| Flavanones | ||||
| Hesperetin | 0.659 | 0.057 | 0.079 | 0.869 |
| Hesperidin (Hesperetin-7-O-rutinoside) | 0.769 | 0.031 | 0.016 | 0.856 |
| Naringenin | 0.326 | 0.000 | 0.000 | 0.760 |
| Flavones | ||||
| Apigenin | 0.576 | 0.000 | 0.000 | 0.650 |
| Flavonols | ||||
| Galangin | 0.801 | 0.161 | 0.255 | 0.586 |
| Isorhamnetin | 0.718 | 0.783 | 0.423 | 1.145 |
| Kaempferol | 0.778 | 0.852 | 0.427 | 0.702 |
| Kaempferol-3-O-glucoside | 0.598 | 0.031 | 0.000 | 0.491 |
| Kaempferol-3-O-glucuronide | 0.535 | 0.021 | 0.000 | 0.516 |
| Kaempferol-3-O-rutinoside | 0.285 | 0.026 | 0.000 | 0.455 |
| Myricetin | 2.170 | 2.105 | 1.349 | 1.100 |
| Myricetin-3-O-glucoside | 1 | 1 | 1 | 1 |
| Quercetin | 1.743 | 2.945 | 1.470 | 1.496 |
| Quercetin-3-O-galactoside | 0.794 | 1.332 | 1.130 | 0.993 |
| Quercetin-3-O-glucoside | 0.702 | 1.425 | 1.067 | 1.124 |
| Quercetin-3-O-glucuronide | 0.654 | 1.281 | 1.092 | 1.088 |
| Quercetin-3-O-rutinoside | 0.688 | 1.188 | 1.050 | 1.132 |
| Hydroxybenzoic acids | ||||
| 2,3-dihydroxybenzoic acid | 0.744 | 1.875 | 0.784 | 0.528 |
| 4-hydroxybenzoic acid | 0.021 | 0.000 | 0.000 | 0.197 |
| Gallic acid | 1.903 | 1.503 | 1.098 | 0.535 |
| Siryngic acid | 0.875 | 0.853 | 0.462 | 0.278 |
| Vanillic acid | 0.511 | 0.026 | 0.246 | 0.391 |
| Hydroxycinnamic acids | ||||
| Caffeic acid | 0.628 | 1.813 | 0.763 | 0.596 |
| Caftaric acid | 0.617 | 1.792 | 0.852 | 0.537 |
| p-coumaric acid | 0.335 | 0.000 | 0.011 | 0.380 |
| Trans-3-hydroxycinnamic acid | 0.383 | 0.000 | 0.000 | 0.312 |
| Trans-ferulic acid | 0.759 | 0.419 | 0.370 | 0.508 |
| o-coumaric acid | 0.574 | 0.000 | 0.008 | 0.397 |
| Other | ||||
| Ascorbate | 0.629 | 0.666 | 0.457 | 0.234 |
| Trolox | 0.661 | 0.903 | 0.438 | 0.231 |


| TEAC | FRAP | DPPH | |
|---|---|---|---|
| FRAP | 0.4321 | - | - |
| p < 10−4 | |||
| DPPH | 0.4314 | 0.8137 | - |
| p < 10−4 | p < 10−4 | ||
| FCR | 0.3068 | 0.3951 | 0.4499 |
| p = 3.76 × 10⁻⁴ | p < 10−4 | p < 10−4 |
| Structure | TEAC | FRAP | DPPH | FCR |
|---|---|---|---|---|
| Flavonoids | ||||
| 3′-OH and 4′-OH both present in ring-B * | 0.560 # | 0.746 | 0.833 | 0.654 |
| p = 2.93 × 10⁻³ | p < 10−4 | p < 10−4 | p < 10−4 | |
| 2,3 double bond and 4-oxo both present in ring-C | p = 0.232 | p = 0.868 | p = 0.874 | p = 0.932 |
| 3-OH present in ring-C | 0.703 | 0.548 | p = 0.075 | p = 0.062 |
| p < 10−4 | p = 3.78 × 10⁻³ | |||
| Phenolic acids | ||||
| 3-OH absent | p = 0.250 | −0.740 | −0.670 | p = 0.057 |
| p = 9.26 × 10⁻³ | p = 0.024 | |||

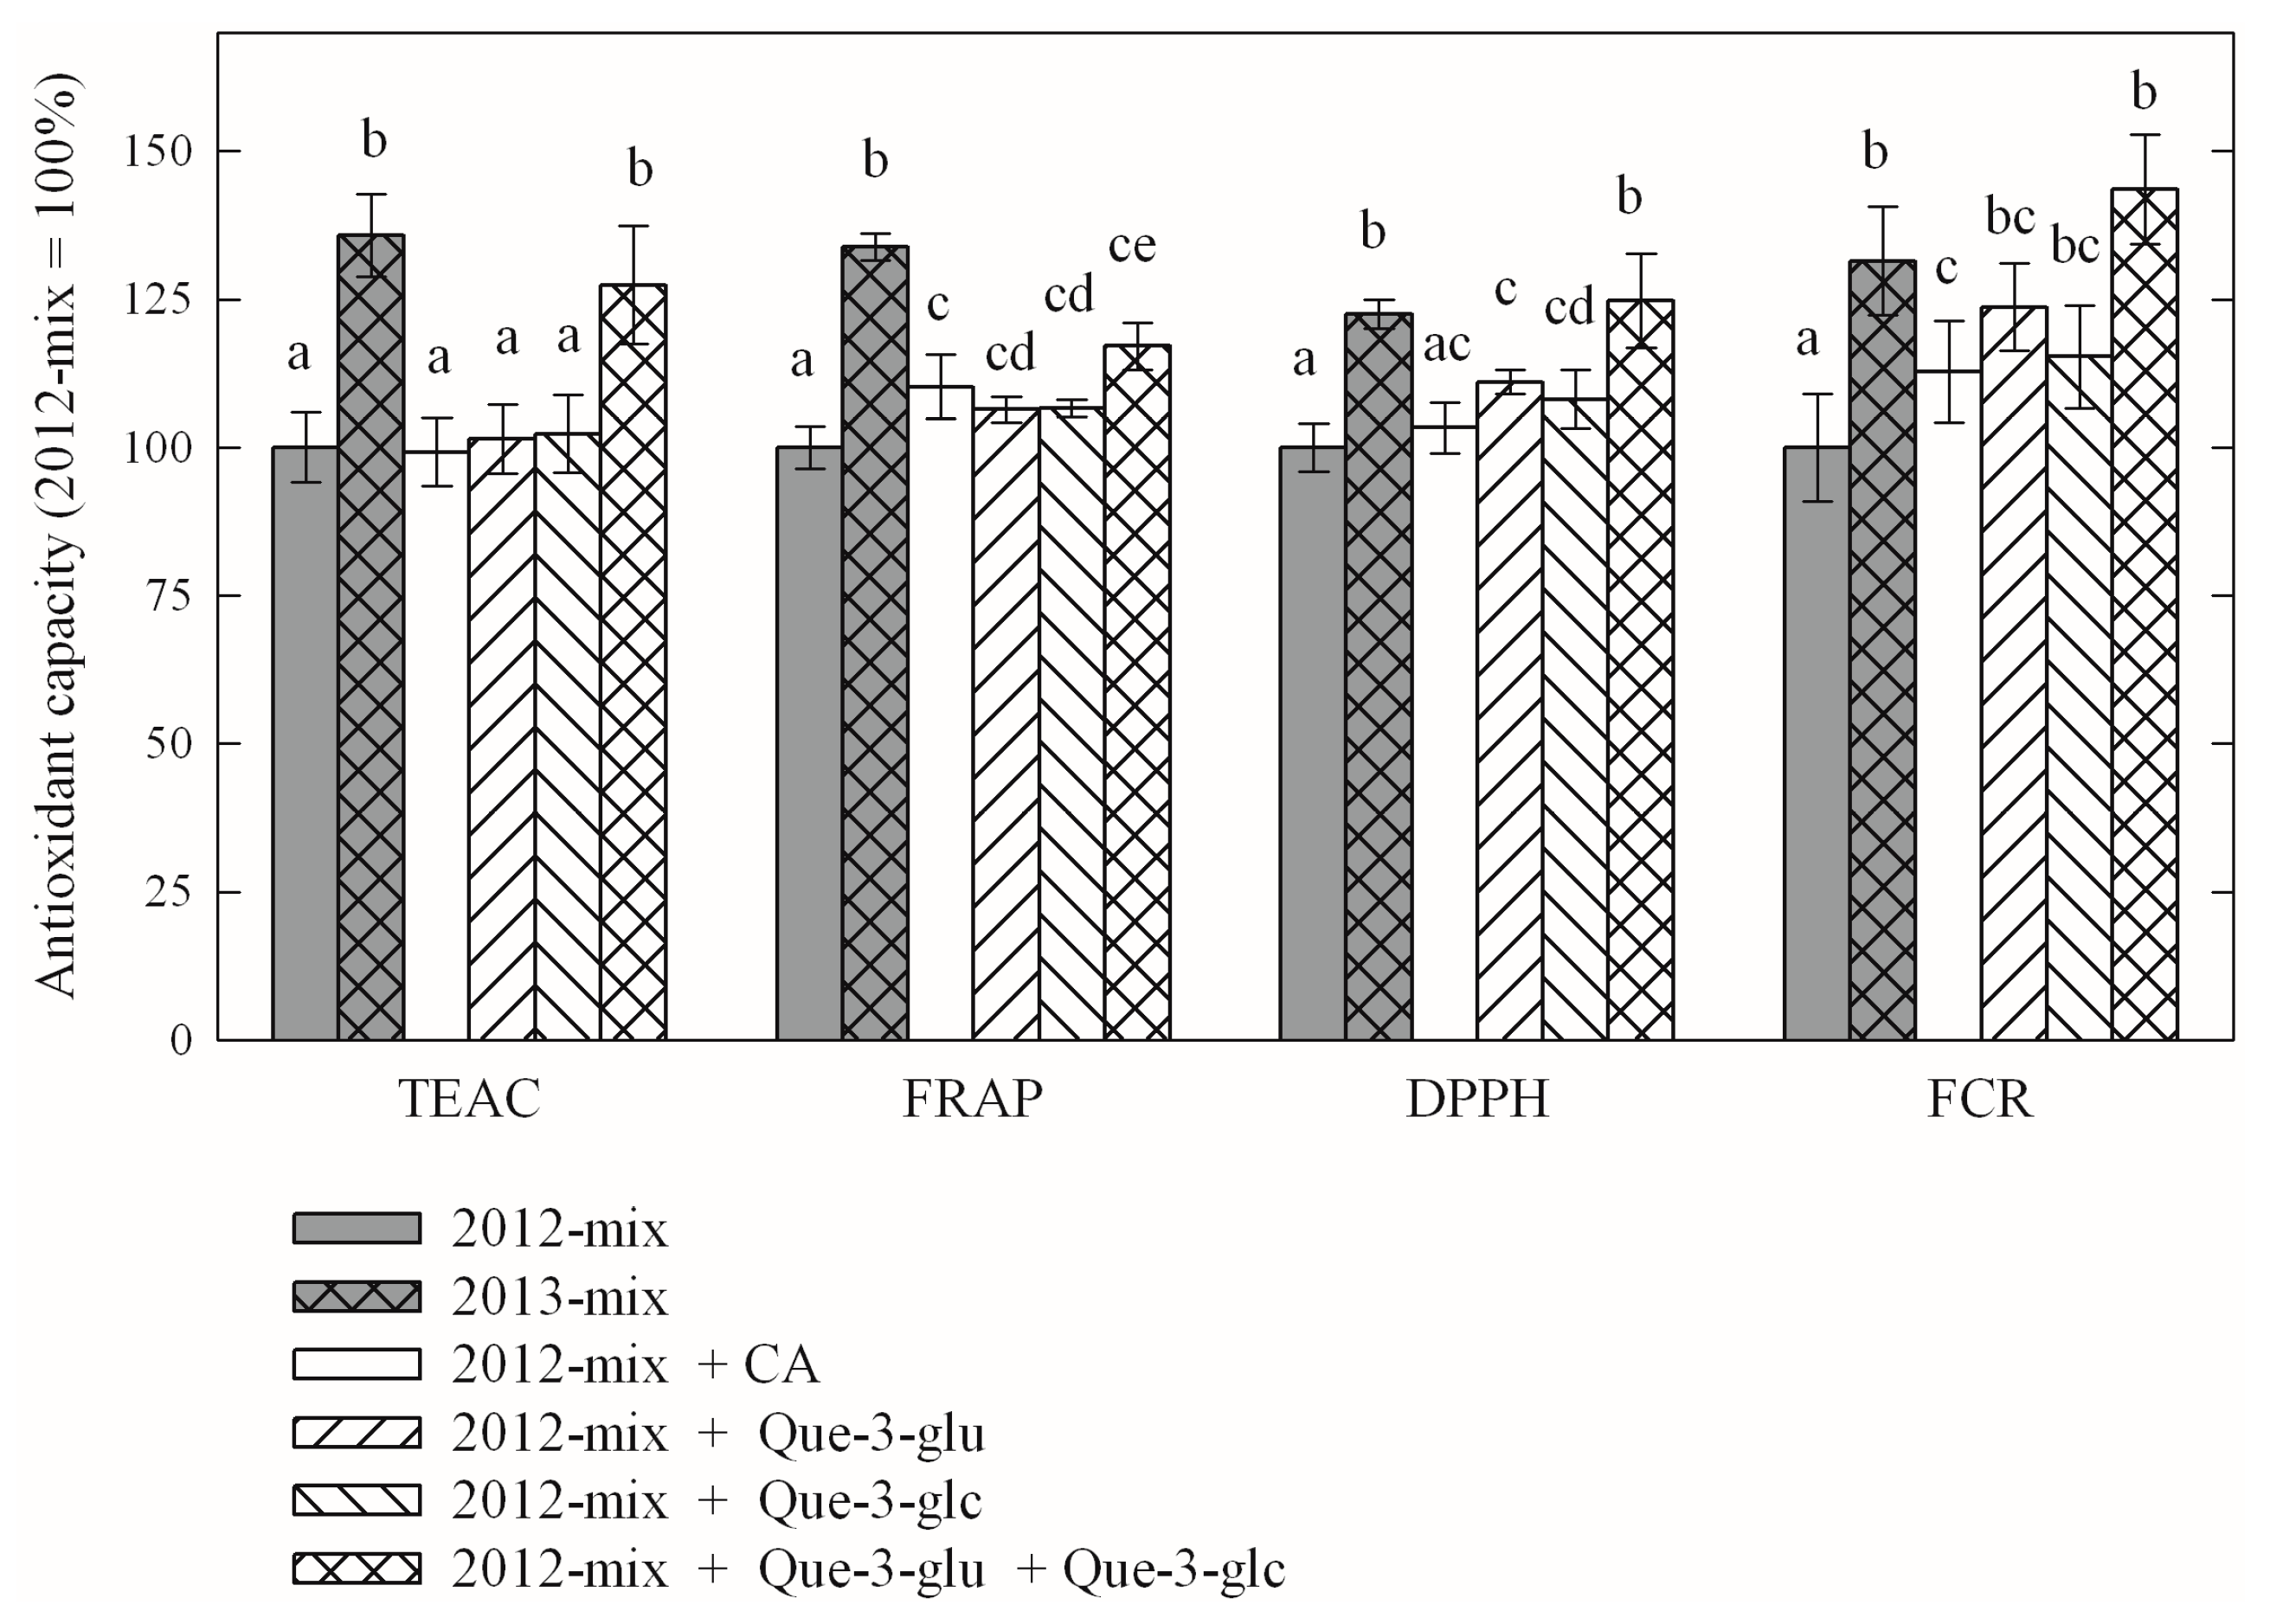
| Compound | Year-2012 | Year-2013 (% of Year-2012) |
|---|---|---|
| Caftaric acid | 1.39 | 1.60 * (113%) |
| Kaempferol-3-O-glucoside | 0.03 | 0.03 (100%) |
| Kaempferol-3-O-glucuronide | 0.04 | 0.05 (120%) |
| Quercetin-3-O-glucoside | 0.98 | 1.38 * (129%) |
| Quercetin-3-O-glucuronide | 3.57 | 4.23 * (115%) |
| Quercetin-3-O-rutinoside | 0.23 | 0.22 (96%) |
| Compound | TEAC | FRAP | DPPH | FCR |
|---|---|---|---|---|
| year-2013 average (% of year-2012 average) | 120.12% | 126.13% | 111.50% | 132.16% |
| comparison of year-2012 and year-2013 averages p value of paired t-test | <10−4 | <10−4 | 1.55 × 10⁻³ | <10−4 |

3. Materials and Methods
3.1. Chemicals
3.2. Plant Material
3.3. Folin-Ciocalteu Reactivity (FCR)
3.4. Trolox Equivalent Antioxidant Capacity (TEAC)
3.5. Ferric Reducing Antioxidant Power (FRAP)
3.6. Determination of DPPH Radical Scavenging Capacity
3.7. HPLC-MS
3.8. Data Analysis
Acknowledgments
Author Contributions
Conflicts of Interest
Abbreviations
| ABTS | 2,2′-azinobis(3-ethylbenzothiazoline)-6-sulfonatic acid, IUPAC name: (2Z)-3-ethyl-2-[(E)-(3-ethyl-6-sulfonato-1,3-benzothiazol-2-ylidene)hydrazinylidene]-1,3-benzothiazole-6-sulfonate |
| ASA | ascorbate |
| CA | caftaric acid, (2R,3R)-2-[(E)-3-(3,4-dihydroxyphenyl)prop-2-enoyl]oxy-3-hydroxybutanedioic acid |
| DPPH | 2,2-diphenyl-1-picrylhydrazyl |
| FCR | Folin-Ciocalteu reactivity |
| FRAP | Ferric Reducing Antioxidant Potential |
| Myr-3-glc | myricetin-3-O-glucoside, 5,7-dihydroxy-3-[(2S,5S,6R)-3,4,5-trihydroxy-6(hydroxymethyl)oxan-2-yl] oxy-2-(3,4,5-trihydroxyphenyl)chromen-4-one |
| TAC | Total Antioxidant Capacity |
| TEAC | Trolox Equivalent Antioxidant Capacity |
| TPTZ | 2,4,6-tripyridin-2-yl-1,3,5-triazine |
| Que-3-glc | quercetin-3-O-glucoside, 2-(3,4-dihydroxyphenyl)-5,7-dihydroxy-3-[2S,3R,4S,5S,6R)-3,4,5-trihydroxy-6-(hydroxymethyl)oxan-2-yl]oxychromen-4-one |
| Que-3-glu | quercetin-3-O-glucuronide, (2S,3S,4S,5R,6S)-6-[2-(3,4-dihydroxyphenyl)-5,7-dihydroxy-4-oxochromen-3-yl]oxy-3,4,5-trihydroxyoxane-2-carboxylic acid |
References
- Michalak, A. Phenolic compounds and their antioxidant activity in plants growing under heavy metal stress. Pol. J. Environ. Stud. 2006, 15, 523–530. [Google Scholar]
- Grace, S.C.; Logan, B.A. Energy dissipation and radical scavenging by the plant phenylpropanoid pathway. Philos. Trans. R. Soc. Lond. 2000, 355, 1499–1510. [Google Scholar] [CrossRef] [PubMed]
- Havsteen, B.H. The biochemistry and medical significance of the flavonoids. Pharmacol. Ther. 2002, 96, 67–202. [Google Scholar] [CrossRef]
- Rice-Evans, C.; Miller, N.J.; Paganga, G. Structure antioxidant activity relationships of flavonoids and phenolic acids. Free Radic. Biol. Med. 1996, 20, 933–956. [Google Scholar] [CrossRef]
- Robak, J.; Gryglewski, R.J. Flavonoids are scavengers of superoxide anions. Biochem. Pharmacol. 1988, 37, 837–841. [Google Scholar] [CrossRef]
- Cao, G.; Alessio, H.; Cutler, R. Oxygen-radical absorbance capacity assay for antioxidants. Free Radic. Biol. Med. 1993, 14, 303–311. [Google Scholar] [CrossRef]
- Aust, D.S.; Morehouse, A.L.; Thomas, E.C. Role of metal sin oxygen radical reactions. Free Radic. Biol. Med. 1985, 1, 3–25. [Google Scholar] [CrossRef]
- Winterbourn, C.C. Toxicity of iron and hydrogen peroxide: The Fenton reaction. Toxicol. Lett. 1995, 82–83, 969–974. [Google Scholar] [CrossRef]
- Bergman, M.; Perelman, A.; Dubinsky, Z.; Grossman, S. Scavenging of reactive oxygen species by a novel glucurinated flavonoid antioxidant isolated and purified from spinach. Phytochemistry 2003, 62, 753–762. [Google Scholar] [CrossRef]
- Agati, G.; Brunetti, C.; Di Ferdinando, M.; Ferrini, F.; Pollastri, S.; Tattini, M. Functional roles of flavonoids in photoprotection: New evidence, lessons from the past. Plant Physiol. Biochem. 2013, 72, 35–45. [Google Scholar] [CrossRef] [PubMed]
- Majer, P.; Neugart, S.; Krumbein, A.; Schreiner, M.; Hideg, É. Singlet oxygen scavenging by leaf flavonoids contributes to sunlight acclimation in Tilia platyphyllos. Environ. Exp. Bot. 2014, 100, 1–9. [Google Scholar] [CrossRef]
- Brown, J.E.; Khodr, H.; Hider, R.C.; Rice-Evans, C.A. Structural dependence of flavonoid interactions with Cu2+ ions: Implications for their antioxidant properties. Biochem. J. 1998, 330, 1173–1178. [Google Scholar] [CrossRef] [PubMed]
- Rice-Evans, C.; Miller, N.; Paganga, G. Antioxidant properties of phenolic compounds. Trends Plant Sci. 1997, 2, 152–159. [Google Scholar] [CrossRef]
- Blois, S.M. Antioxidant determinations by the use of a stable free radical. Nature 1958, 181, 1199–1200. [Google Scholar] [CrossRef]
- Re, R.; Pellegrini, N.; Proteggente, A.; Pannala, A.; Yang, M.; Rice-Evans, C. Antioxidant activity applying an improved ABTS radical cation decolorization assay. Free Radic. Biol. Med. 1999, 26, 1231–1237. [Google Scholar] [CrossRef]
- Benzie, I.F.F.; Strain, J.J. The ferric reducing ability of plasma (FRAP) as a measure of “antioxidant power”: The FRAP assay. Anal. Biochem. 1996, 239, 70–76. [Google Scholar] [CrossRef] [PubMed]
- Szőllősi, R.; Szőllősi-Varga, I. Total antioxidant power in some species of Labiatae, adaptation of FRAP method. Acta Biol. Szeged. 2002, 46, 125–127. [Google Scholar]
- Goupy, P.; Dufour, C.; Loonis, M.; Dangles, O. Quantitative kinetic analysis of Hydrogen transfer reactions from dietary polyphenols to the DPPH radical. J. Agric. Food Chem. 2003, 51, 615–622. [Google Scholar] [CrossRef]
- Foti, M.C.; Daquino, C.; Geraci, C. Electron-transfer reaction of cinnamic acids and their methyl esters with the DPPH radical in alcoholic solutions. J. Org. Chem. 2004, 69, 2309–2314. [Google Scholar] [CrossRef] [PubMed]
- Foti, M.C. Use and abuse of the DPPH radical. J. Agric. Food Chem. 2015, 63, 8765–8776. [Google Scholar] [CrossRef]
- Frankel, E.N.; Meyer, A.S. The problems of using one dimensional methods to evaluate multifunctional food and biological antioxidants. J. Sci. Food Agric. 2000, 80, 1925–1941. [Google Scholar] [CrossRef]
- Clarke, G.; Ting, N.K.; Wiart, C.; Fry, J. High correlation of 2,2-diphenyl-1-picrylhydrazyl (DPPH) radical scavenging, ferric reducing activity potential ant total phenolics content indicates redundancy in use of all three assays to screen for antioxidant activity of extracts of plants from the Malaysian rainforest. Antioxid 2013, 2, 1–10. [Google Scholar]
- Huang, D.; Ou, B.; Prior, R.L. The chemistry behind antioxidant capacity assays. J. Agric. Food Chem. 2005, 53, 1841–1856. [Google Scholar] [CrossRef] [PubMed]
- Singleton, V.L.; Rossi, J.A. Colorimetry of total phenolics with phosphomolybdic-phosphotungstic acid reagents. Am. J. Enol. Vitic. 1965, 16, 144–158. [Google Scholar]
- Singleton, V.L.; Orthofer, R.; Lamuela-Raventos, R.M. Analysis of total phenols and other oxidation substrates and antioxidants by means of Folin-Ciocalteu reagent. Meth. Enzymol. 1999, 299, 152–178. [Google Scholar]
- Folin, O.; Ciocalteu, V. Tyrosine and tryptophane determinations proteins. J. Biol. Chem. 1927, 73, 627–650. [Google Scholar]
- Pannala, A.S.; Chan, T.S.; O’Brien, P.J.; Rice-Evans, C.A. Flavonoid B-Ring Chemistry and Antioxidant Activity: Fast Reaction Kinetics. Biochem. Biophys. Res. Commun. 2001, 282, 1161–1168. [Google Scholar] [CrossRef] [PubMed]
- Kähkönen, M.P.; Hopia, I.A.; Vuorela, J.H.; Rauha, J-P.; Pihlaja, K.; Kujala, S.T.; Heinonen, M. Antioxidant activity of plant extracts containing phenolic compounds. J. Agric. Food Chem. 1999, 47, 3954–3962. [Google Scholar] [CrossRef] [PubMed]
- Agati, G.; Azzarello, E.; Pollastri, S.; Tattini, M. Flavonoids as antioxidants in plants: Location and functional significance. Plant Sci. 2012, 196, 67–76. [Google Scholar] [CrossRef] [PubMed]
- Firuzi, O.; Lacanna, A.; Petrucci, R.; Marrosu, G.; Saso, L. Evaluation of the antioxidant activity of flavonoids by “ferric reducing antioxidant power” assay and cyclic voltammetry. BBA Gen. Subj. 2005, 1721, 174–184. [Google Scholar] [CrossRef] [PubMed]
- Muselík, J.; García-Alonso, M.; Martín-López, M.P.; Žemlička, M.; Rivas-Gonzalo, J.C. Measurement of antioxidant activity of wine catechins, procyanidins, anthocyanins and pyranoanthocyanins. Int. J. Mol. Sci. 2007, 8, 797–809. [Google Scholar] [CrossRef]
- Nanjo, F.; Goto, K.; Seto, R.; Suzuki, M.; Sakai, M.; Hara, Y. Scavenging effects of tea catechins and their derivatives on 1,1-diphenyl-2-picrylhydrazyl radical. Free Radic. Biol. Med. 1996, 21, 895–902. [Google Scholar] [CrossRef]
- Samra, M.A.; Chedea, V.S.; Economou, A.; Calokerinos, A.; Kefalas, P. Antioxidant/prooxidant properties of model phenolic compounds: Part I. Studies on equimolar mixtures by chemiluminescence and cyclic voltammetry. Food Chem. 2011, 125, 622–629. [Google Scholar] [CrossRef]
- Prieto, M.A.; Curran, T.P.; Gowen, A.; Vázquez, J.A. An efficient methodology for quantification of synergy and antagonism in single electron transfer antioxidant assays. Food Res. Int. 2015, 67, 284–298. [Google Scholar] [CrossRef]
- Bors, W.; Heller, W.; Michael, C.; Saran, M. Structural principles of flavonoid antioxidants. In Free Radicals and the Liver; Csomó, G., Fehér, J., Eds.; Springer: Berlin, Germany, 1992; pp. 77–95. [Google Scholar]
- Lokesh, K.N.; Venkatarangana, M. Exemplified screening standardization of potent antioxidant nutraceuticals by principles of design of experiments. J. Funct. Food 2015, 17, 260–270. [Google Scholar]
- Irakli, M.; Katsantonis, D.; Kleisirais, F. Evaluation of quality attributes, nutraceutical components and antioxidant potential of wheat bread substitued with rice bran. J. Cereal Sci. 2015, 65, 74–80. [Google Scholar] [CrossRef]
- Salah, N.; Miller, N.K.; Paganga, G.; Tijburg, L.; Bolwell, G.P.; Rice-Evans, C.A. Polyphenolic flavanols as scavengers of aqueous phase radicals and as chain-breaking antioxidants. Arch. Biochem. Biophys. 1995, 322, 339–346. [Google Scholar] [CrossRef]
- Rocco, A.; Fanali, C.; Dugo, L.; Mondello, L. A nano-LC/UV method for the analysis of principal phenolic compounds in commercial citrus juices and evaluation of antioxidant potential. Electrophoresis 2014, 35, 1701–1708. [Google Scholar] [CrossRef] [PubMed]
- Larson, R.A. The antioxidants of higher plants. Phytochemistry 1988, 27, 969–978. [Google Scholar] [CrossRef]
- Razzaghi-Asl, N.; Garrido, J.; Khazraei, H.; Borges, F.; Firuzi, O. Antioxidant properties of hydroxycinnamic acids: A review of structure-activity relationships. Curr. Med. Chem. 2013, 20, 4436–4450. [Google Scholar] [CrossRef] [PubMed]
- Nenadis, N.; Lazaridou, O.; Tsimidou, M.Z. Use of reference compounds in antioxidant activity assessment. J. Agric. Food Chem. 2007, 55, 5452–5460. [Google Scholar] [CrossRef]
- Cao, G.; Sofic, E.; Prior, R.L. Antioxidant and prooxidant behavior of flavonoids: Structure-activity relationships. Free Radic. Biol. Med. 1997, 22, 749–760. [Google Scholar] [CrossRef]
- Montoro, P.; Braca, A.; Pizza, C.; De Tommasi, N. Structure-antioxidant activity relationships of flavonoids isolated from different plant species. Food Chem. 2005, 92, 349–355. [Google Scholar] [CrossRef]
- Das, S.; Mitra, I.; Batuta, S.; Alam, N.; Roy, K.; Begum, A.N. Design, synthesis and exploring the quantitative structure-activity relationship of some antioxidant flavonoid analogues. Bioorg. Med. Chem. Lett. 2014, 24, 5050–5054. [Google Scholar] [CrossRef] [PubMed]
- Burda, S.; Oleszek, W. Antioxidant and antiradical activities of flavonoids. J. Agric. Food Chem. 2001, 49, 2774–2779. [Google Scholar] [CrossRef] [PubMed]
- Williams, R.J.; Spencer, J.P.E.; Rice-Evans, C. Flavonoids: Antioxidants or signalling molecules? Free Radic. Biol. Med. 2004, 36, 838–849. [Google Scholar] [CrossRef] [PubMed]
- DeGraft-Johnson, J.; Kolodziejczyk, K.; Krol, M.; Nowak, P.; Krol, B.; Nowak, D. Ferric-reducing ability power of selected plant polyphenols and their metabolites: Implications for clinical studies on the antioxidant effects of fruits and vegetable consumption. Basic Clin. Pharmacol. Toxicol. 2007, 100, 345–352. [Google Scholar] [CrossRef] [PubMed]
- Bors, W.; Heller, W.; Michel, C.; Saran, M. Flavonoids as antioxidants: Determination of radical-scavenging efficiencies. Method Enzymol. 1990, 186, 343–355. [Google Scholar]
- Fukumoto, L.R.; Mazza, G. Assessing antioxidant and prooxidant activities of phenolic compounds. J. Agric. Food Chem. 2000, 48, 3597–3604. [Google Scholar] [CrossRef] [PubMed]
- Heim, K.E.; Tagliaferro, A.R.; Bobilya, D.J. Flavonoid antioxidants: Chemistry, metabolism and structure-activity relationships. J. Nutr. Biochem. 2002, 13, 572–584. [Google Scholar] [CrossRef]
- Van Acker, S.A.B.E.; De Groot, M.J.; van den Berg, D.J.; Tromp, M.N.J.L.; den Kelder, G.D.O.; van der Vijgh, W.J.F.; Bast, A. A quantum chemical explanation of the antioxidant activity of flavonoid. Chem. Res. Toxicol. 1996, 9, 1305–1312. [Google Scholar] [CrossRef] [PubMed]
- Olszewska, M. Separation of quercetin, sexangularetin, kaempferol and isorhamnetin for simultaneous HPLC determination of flavonoid aglycones in inflorescences, leaves and fruits of three Sorbus species. J. Pharm. Biomed. 2008, 48, 629–635. [Google Scholar] [CrossRef] [PubMed]
- Boué, S.M.; Carter-Wientjes, C.H.; Shih, B.Y.; Cleveland, T.E. Identification of flavone aglycones and glycosides in soybean pods by liquid chromatography-tandem mass spectrometry. J. Chromatogr. 2003, 991, 61–68. [Google Scholar] [CrossRef]
- Wollenweber, E.; Dietz, V.H. Occurrence and distribution of free flavonoid aglycones in plants. Phytochemistry 1981, 20, 869–932. [Google Scholar] [CrossRef]
- Lee, K.Y.; Alexander, D.; Wulff, J.; Olsen, J.E. Changes in metabolite profiles in Norway spruce shoot tips during short-day induced winter bud development and long-day induced bud flush. Metabolomics 2014, 10, 842–858. [Google Scholar] [CrossRef]
- Neugart, S.; Fiol, M.; Schreiner, M.; Rohn, S.; Zrenner, R.; Kroh, L.W.; Krumbein, A. Low and moderate photosynthetically active radiation affects the flavonol glycosides and hydroxycinnamic acid derivatives in kale (Brassica oleracea var. sabellica) dependent on two low temperatures. Plant Physiol. Biochem. 2013, 72, 161–168. [Google Scholar] [PubMed]
- Hofmann, R.W.; Swinny, E.E.; Bloor, S.J.; Markham, K.R.; Ryan, K.G.; Campbell, B.D.; Jordan, B.R.; Fountain, D.W. Responses of nine Trifolium repens L. populations to ultraviolet-B radiation: Differential flavonol glycoside accumulation and biomass production. Ann. Bot. 2000, 86, 527–537. [Google Scholar] [CrossRef]
- Winter, T.R.; Rostás, M. Ambient ultraviolet radiation induces protective responses in soybean but does not attenuate indirect defense. Environ. Pollut. 2008, 155, 290–297. [Google Scholar] [CrossRef] [PubMed]
- Sultana, B.; Anwar, F. Flavonols (kaempferol, quercetin, myricetin) contents of selected fruits, vegetables and medicinal plants. Food Chem. 2008, 108, 879–884. [Google Scholar] [CrossRef] [PubMed]
- Calderón-Montaño, J.M.; Burgos-Morón, E.; Pérez-Guerrero, C.; López-Lazaro, M. A review on the dietary flavonoid kaempferol. Med. Chem. 2011, 11, 298–344. [Google Scholar] [CrossRef]
- Devi, P.K.; Malar, S.D.; Nabavi, F.S.; Sureda, A.; Xiao, J.; Nabavi, M.S.; Daglia, M. Kaempferol and inflammation: From chemistry to medicine. Pharmacol. Res. 2015, 99, 1–10. [Google Scholar] [CrossRef] [PubMed]
- Fernandes, F.; Ramalhosa, E.; Pires, P.; Verdial, J.; Valentão, P.; Andrade, P.; Bento, A.; Albert-Pereira, J. Vitis vinifera leaves toward bioactivity. Ind. Prod. Crop. 2013, 43, 434–440. [Google Scholar] [CrossRef]
- Schwarz, M.; Picazo-Bacete, J.J.; Winterhalter, P.; Hermosín-Gutiérrez, I. Effect of copigments and grape cultivar ont he color of red wines fermented after the addition of copigments. J. Agric. Food Chem. 2005, 53, 8372–8381. [Google Scholar] [CrossRef] [PubMed]
- Jones, G.W.; Davies, R.E. Climate influences on grapevine phenology, grape composition, and wine production and quality for Bordeaux, France. Am. J. Enol. Vitic. 2000, 51, 249–261. [Google Scholar]
- Csepregi, K.; Kocsis, M.; Hideg, É. On the spectrophotometric determination of total phenolic and flavonoid contents. Acta Biol. Hung. 2013, 64, 509–518. [Google Scholar] [CrossRef] [PubMed]
- Majer, P.; Hideg, É. Developmental stage is an important factor that determines the antioxidant responses of young and old grapevine leaves under UV irradiation in a green-house. Plant Physiol. Biochem. 2012, 50, 15–23. [Google Scholar] [CrossRef] [PubMed]
- Szőllősi, R.; Szőllősi-Varga, I. Total antioxidant power in some species of Labiatae, adaptation of FRAP method. Acta Biol. Szeg. 2002, 46, 125–127. [Google Scholar]
- Sample Availability: Test compounds are commercially available. Samples of the compounds are not available from the authors.
© 2016 by the authors. Licensee MDPI, Basel, Switzerland. This article is an open access article distributed under the terms and conditions of the Creative Commons by Attribution (CC-BY) license ( http://creativecommons.org/licenses/by/4.0/).
Share and Cite
Csepregi, K.; Neugart, S.; Schreiner, M.; Hideg, É. Comparative Evaluation of Total Antioxidant Capacities of Plant Polyphenols. Molecules 2016, 21, 208. https://doi.org/10.3390/molecules21020208
Csepregi K, Neugart S, Schreiner M, Hideg É. Comparative Evaluation of Total Antioxidant Capacities of Plant Polyphenols. Molecules. 2016; 21(2):208. https://doi.org/10.3390/molecules21020208
Chicago/Turabian StyleCsepregi, Kristóf, Susanne Neugart, Monika Schreiner, and Éva Hideg. 2016. "Comparative Evaluation of Total Antioxidant Capacities of Plant Polyphenols" Molecules 21, no. 2: 208. https://doi.org/10.3390/molecules21020208