
Pharmacokinetics of Tyrosol Metabolites in Rats

Abstract
:
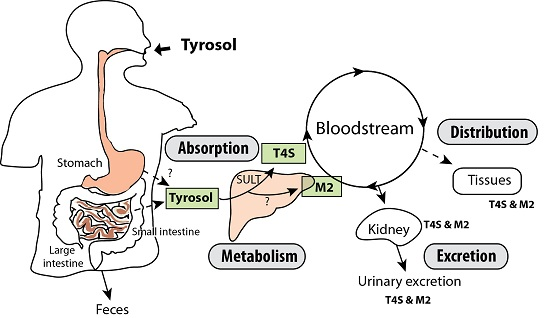
1. Introduction
2. Results and Discussion
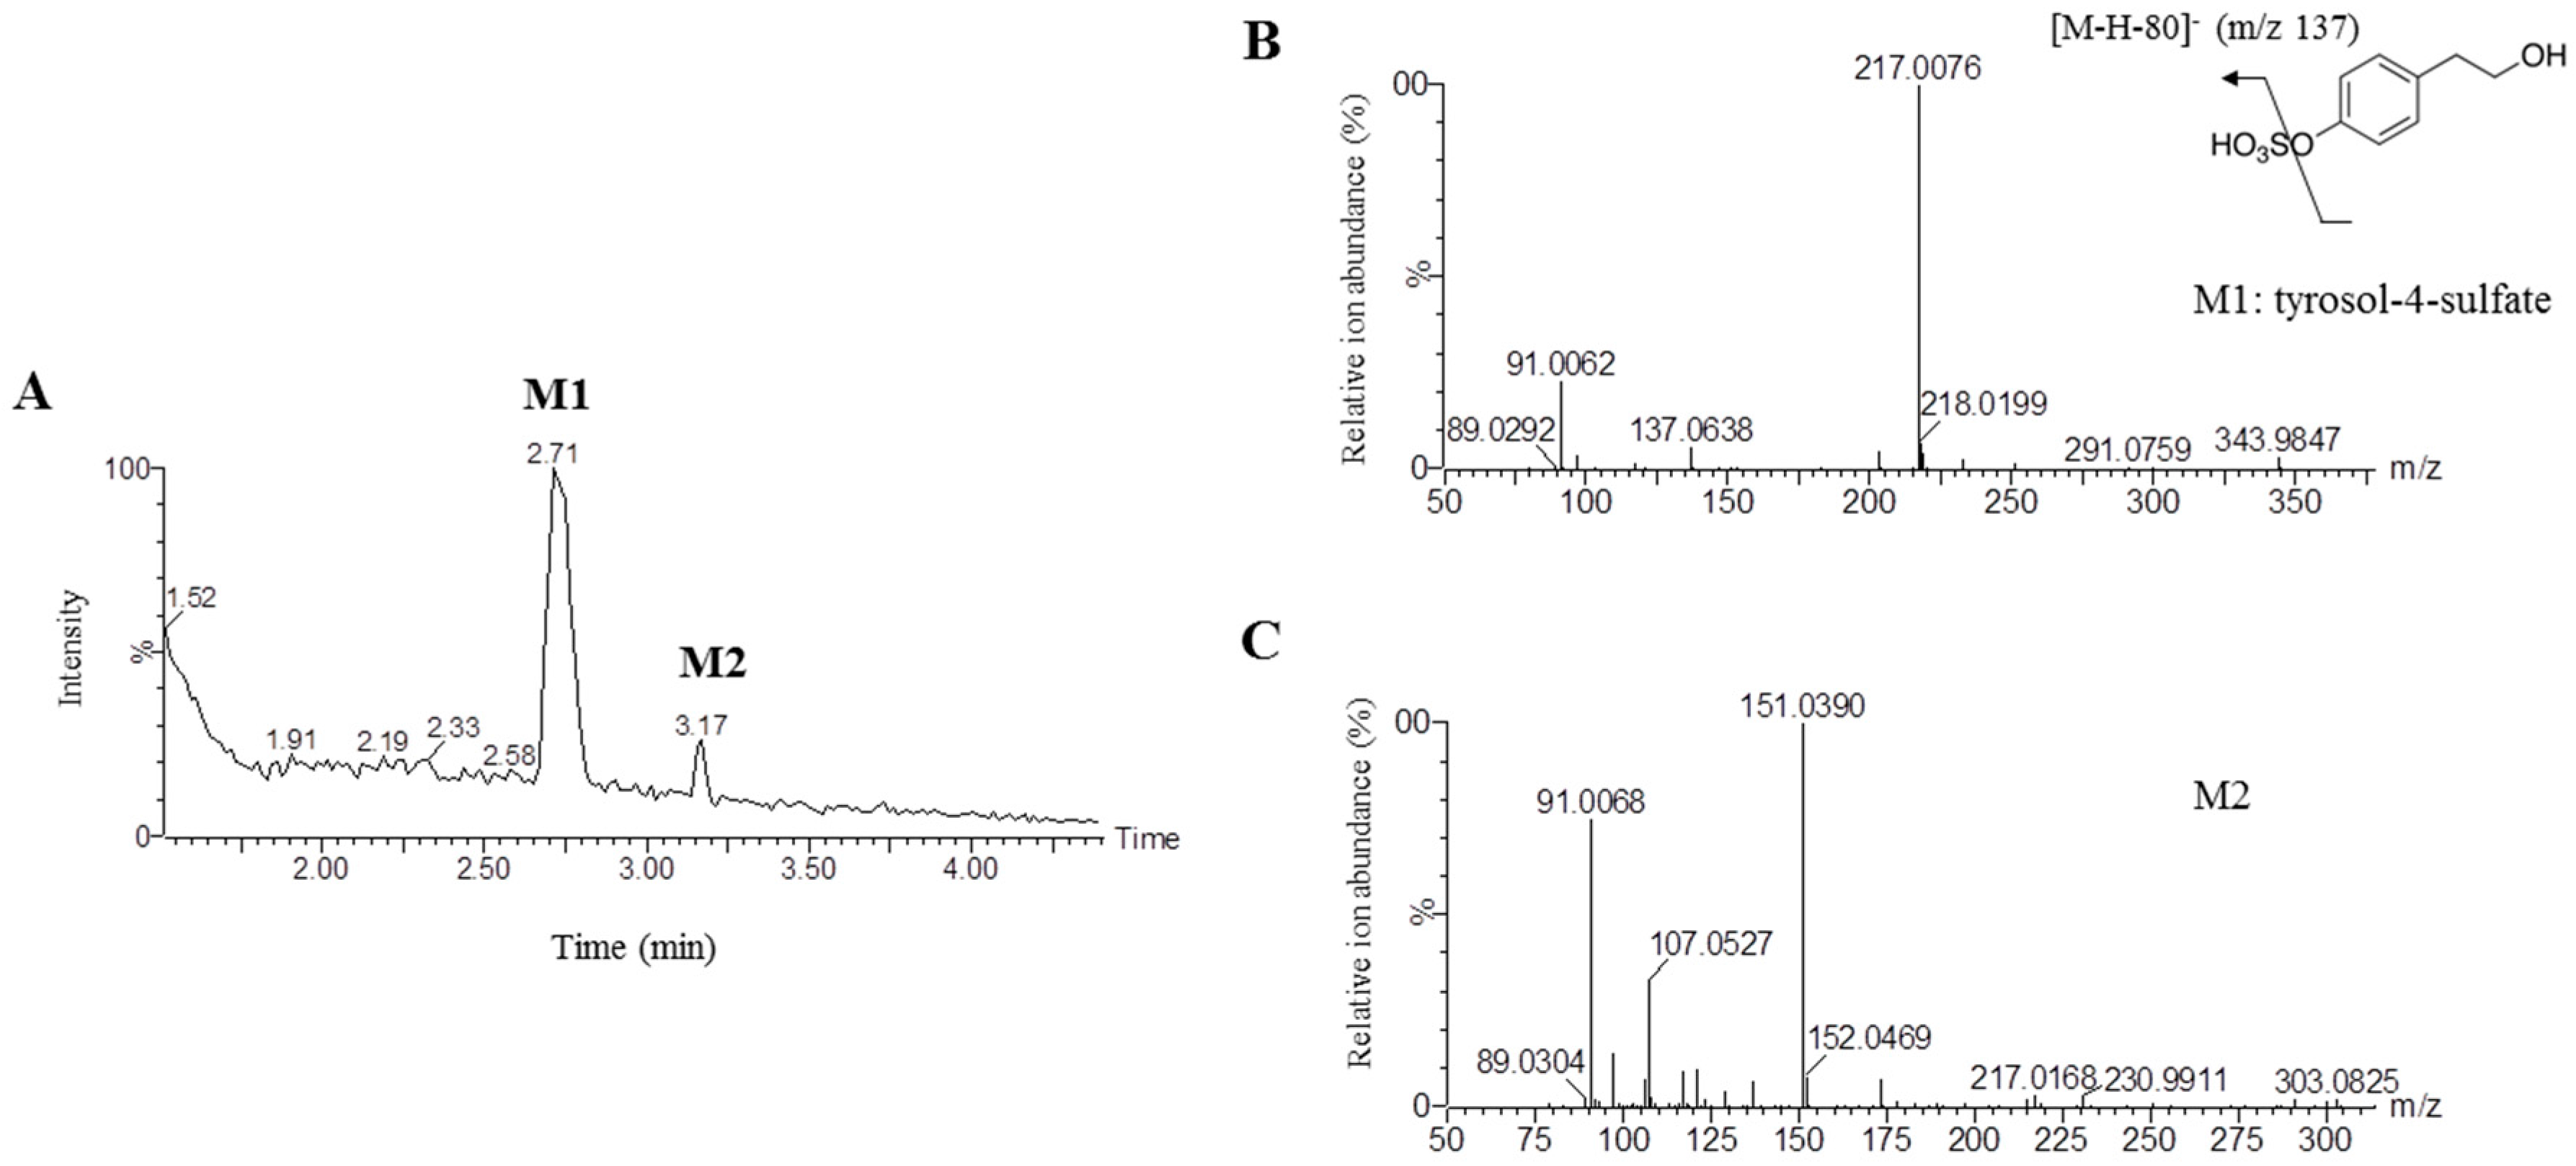
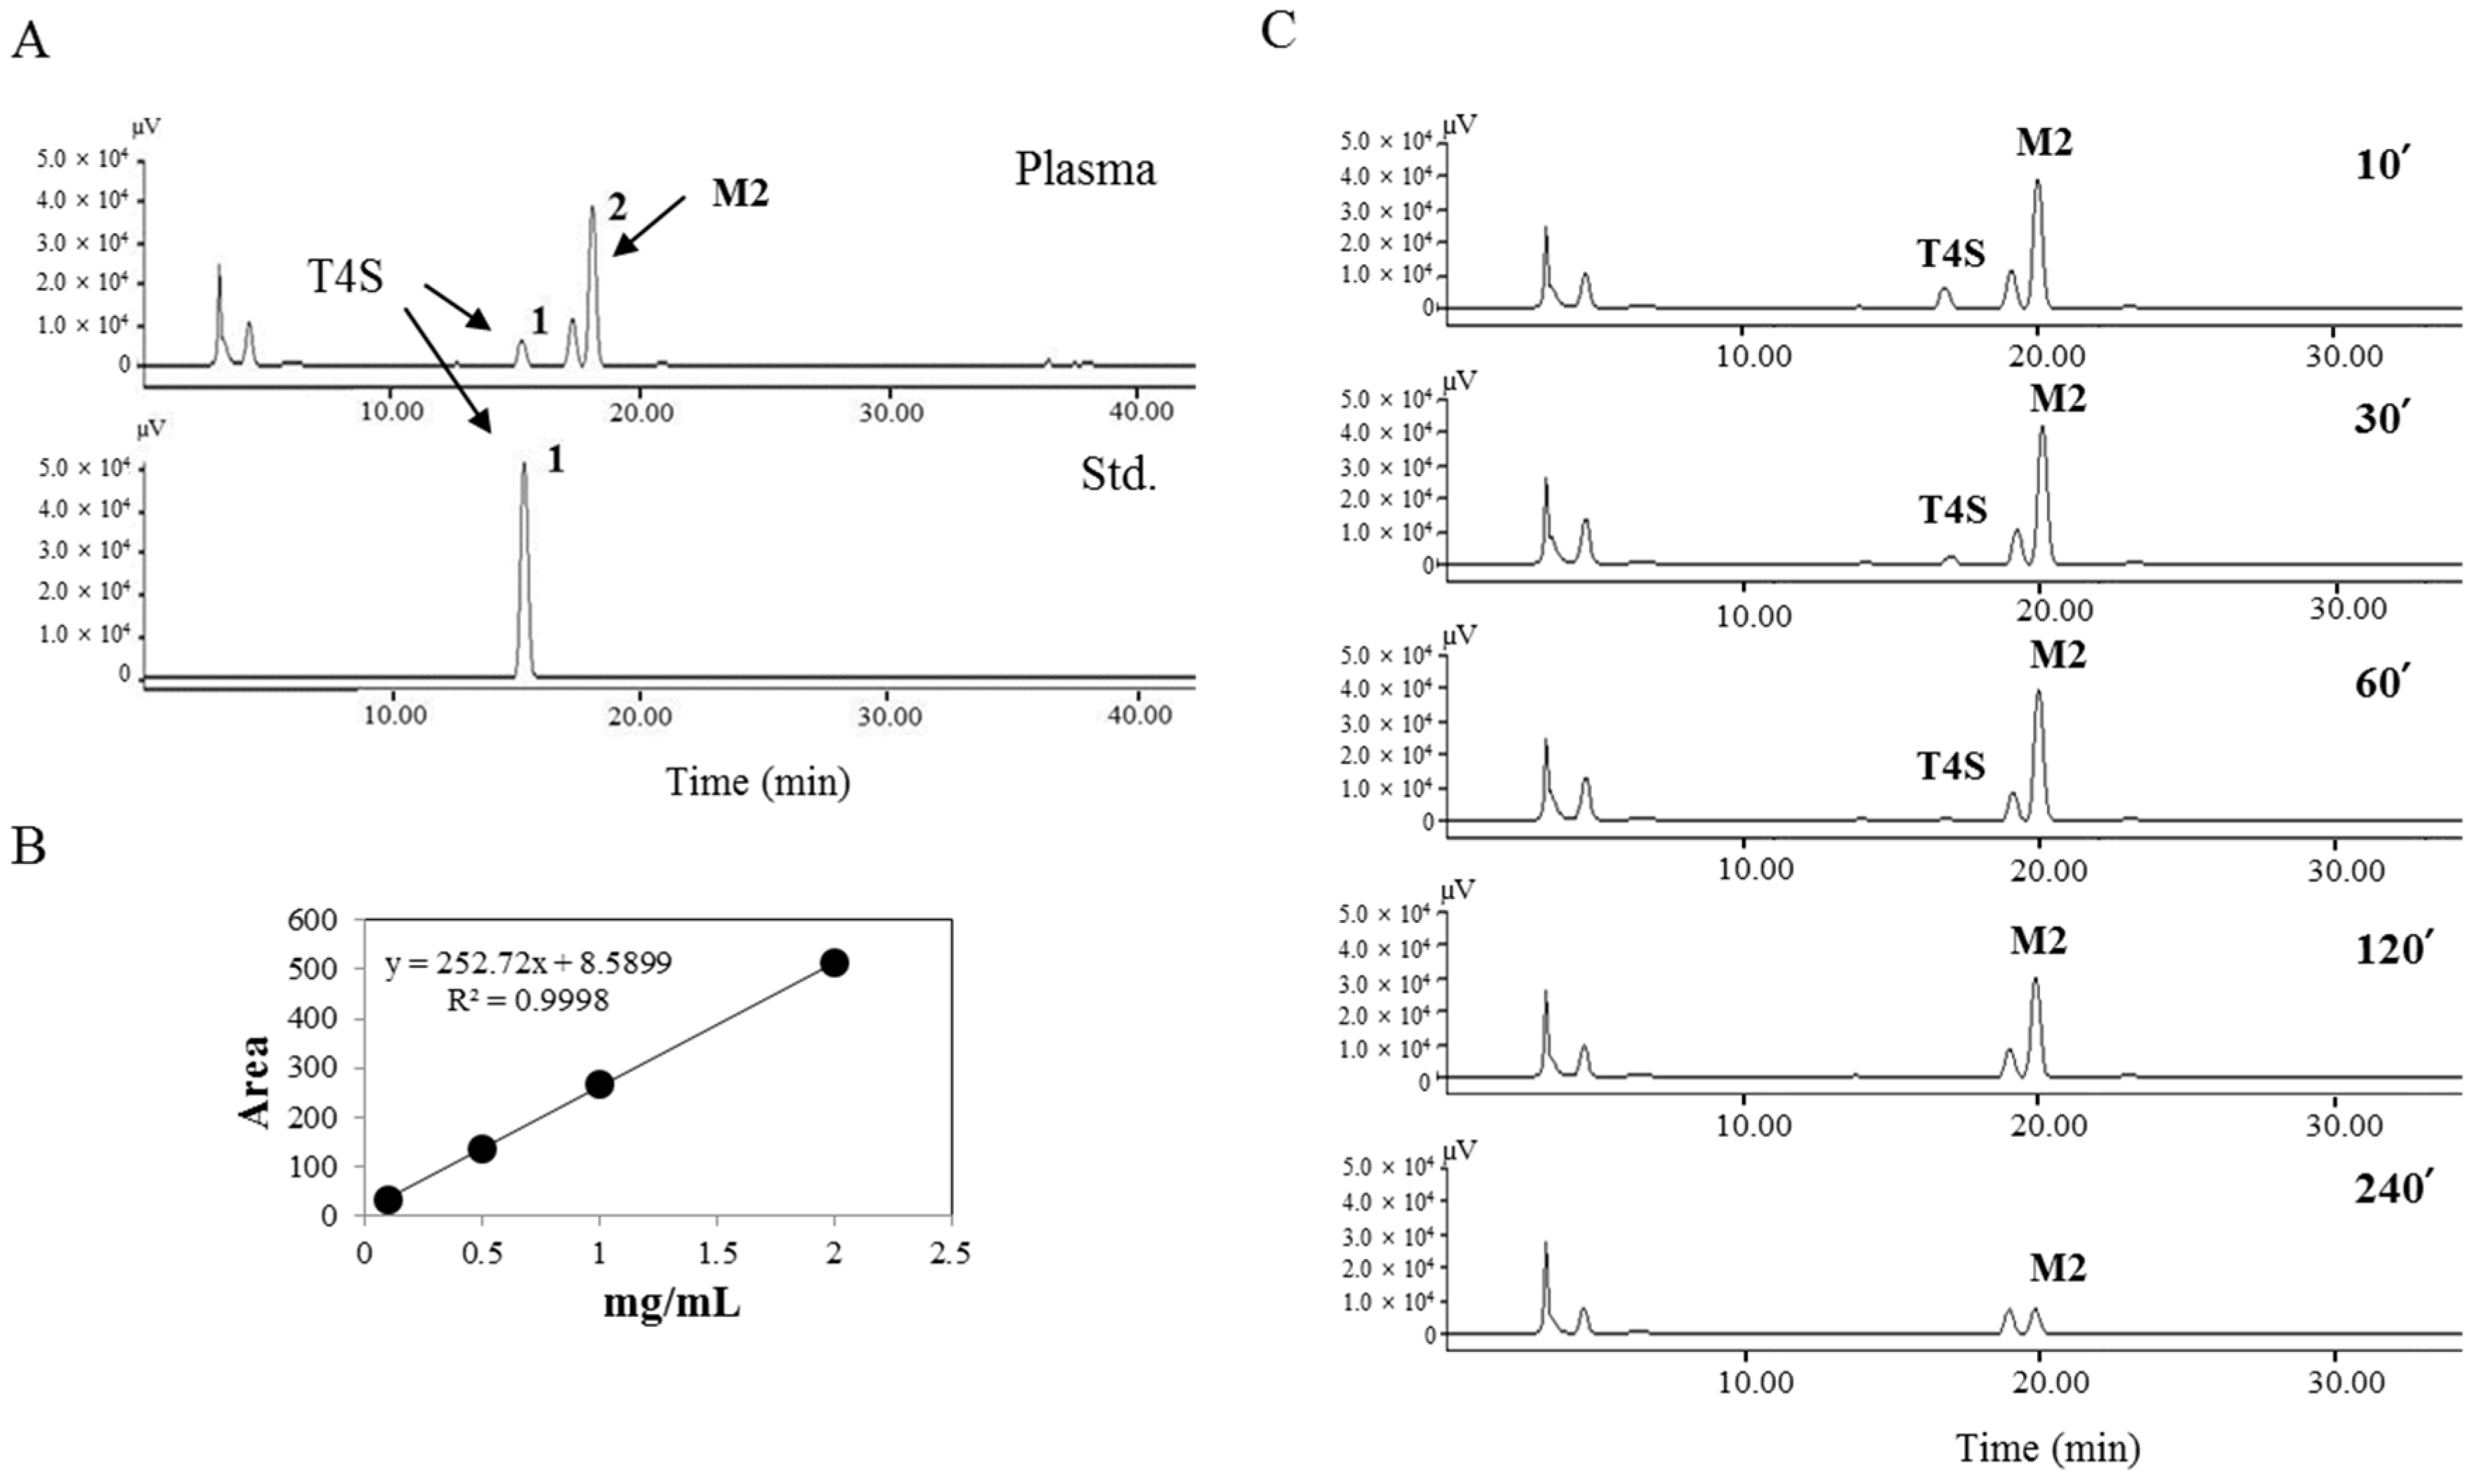
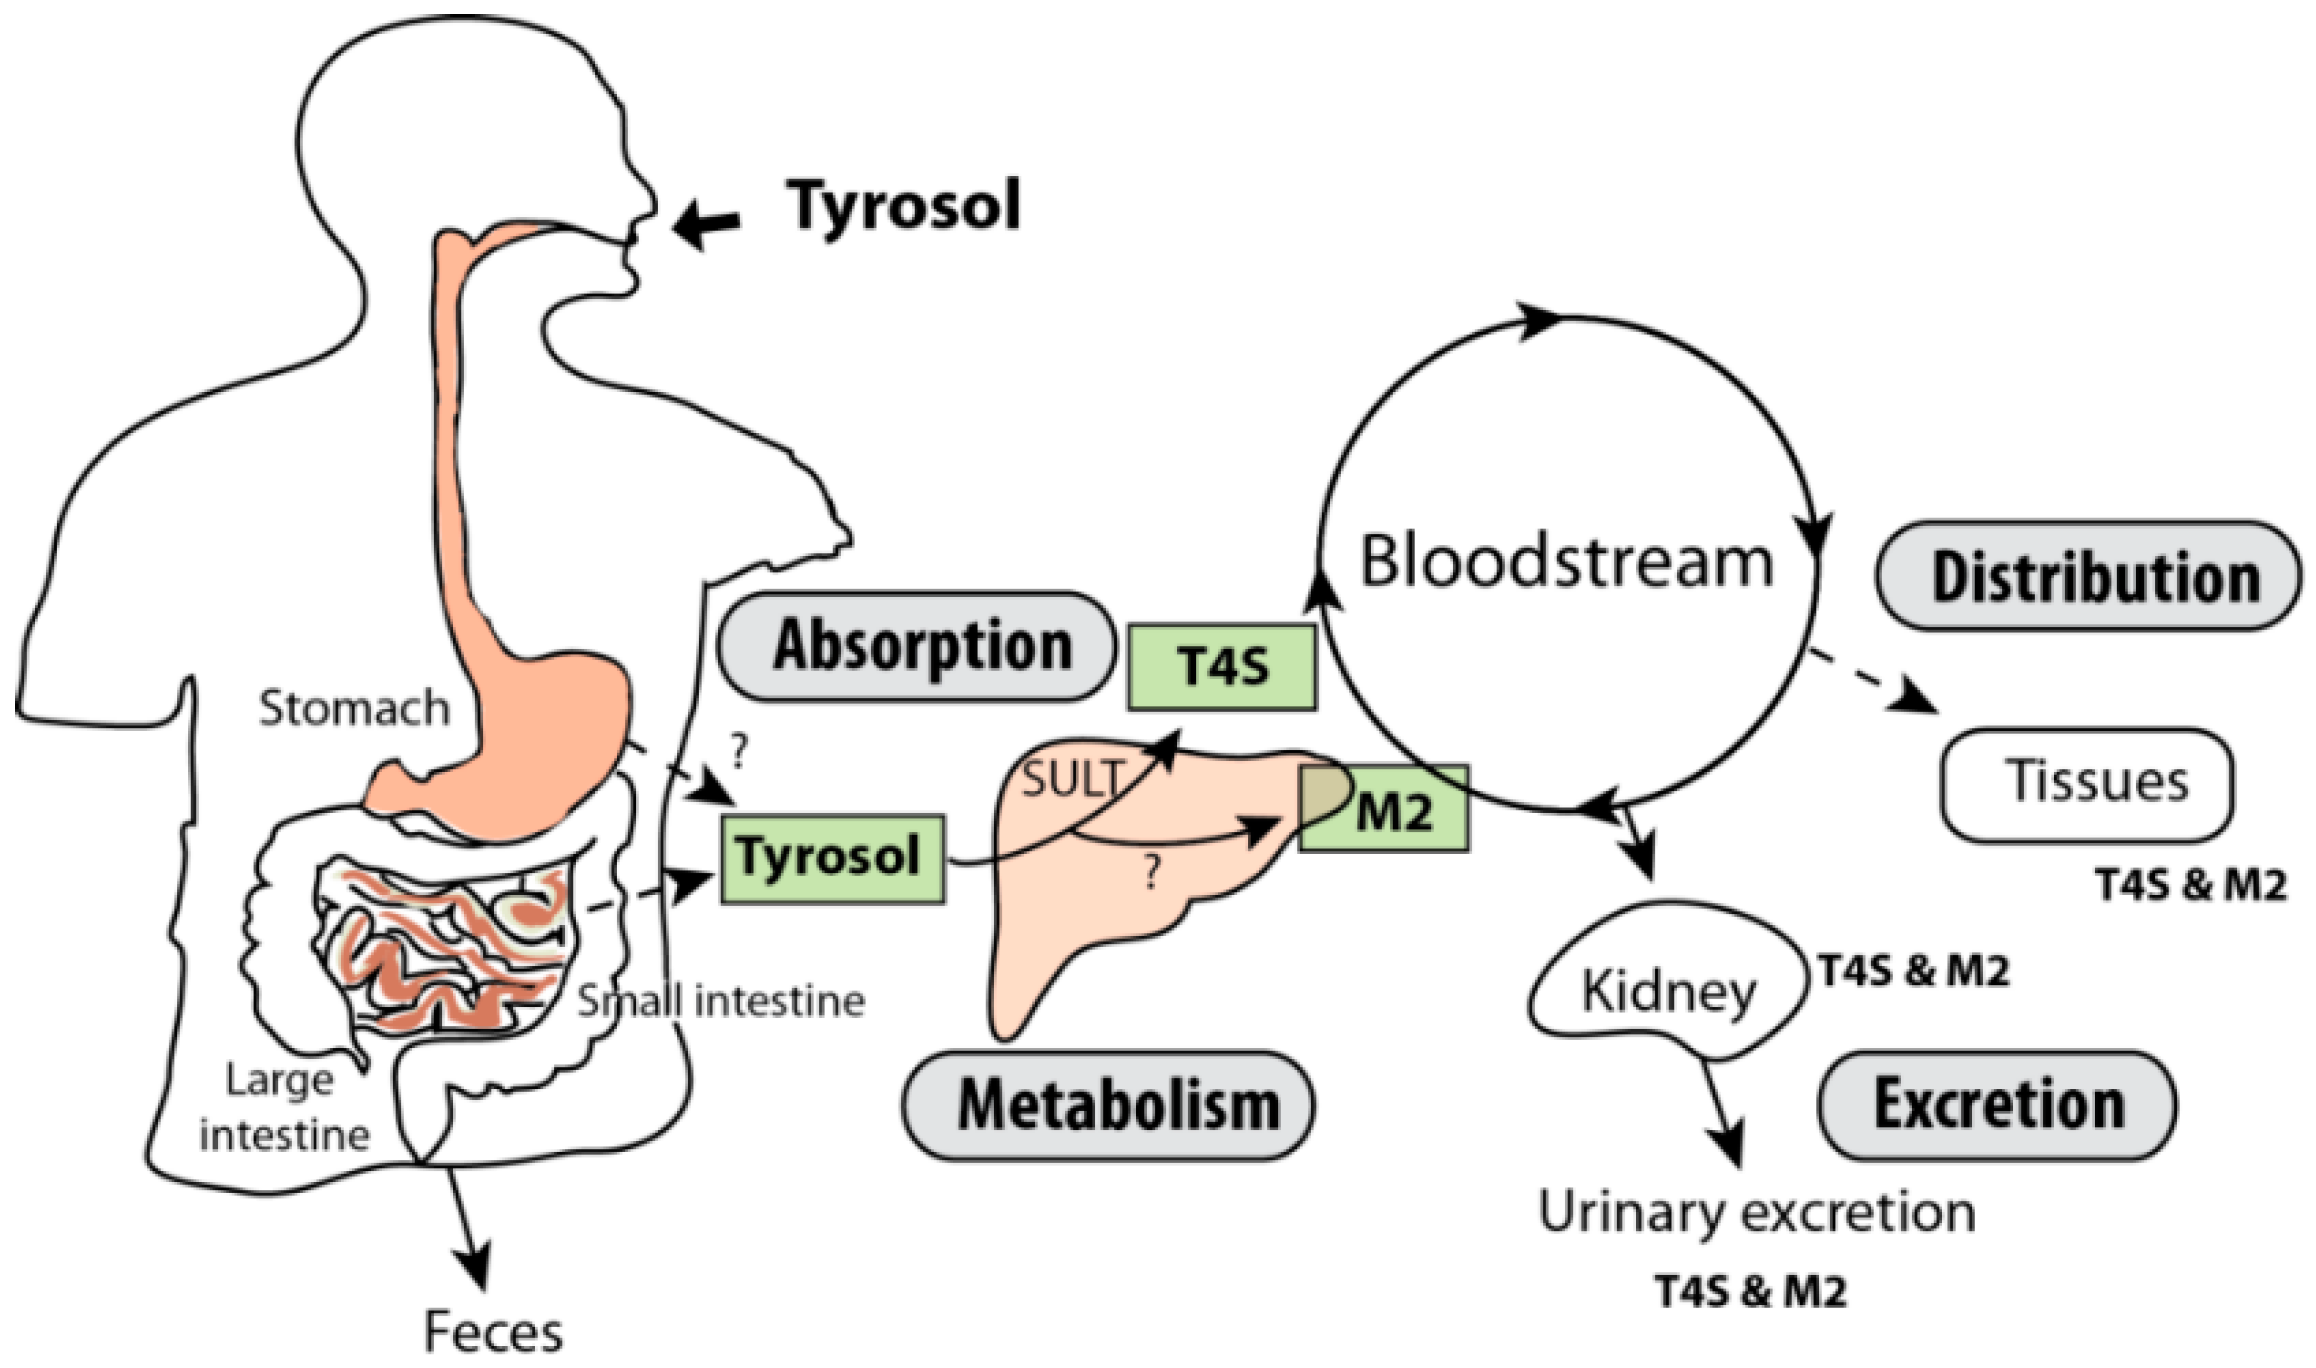
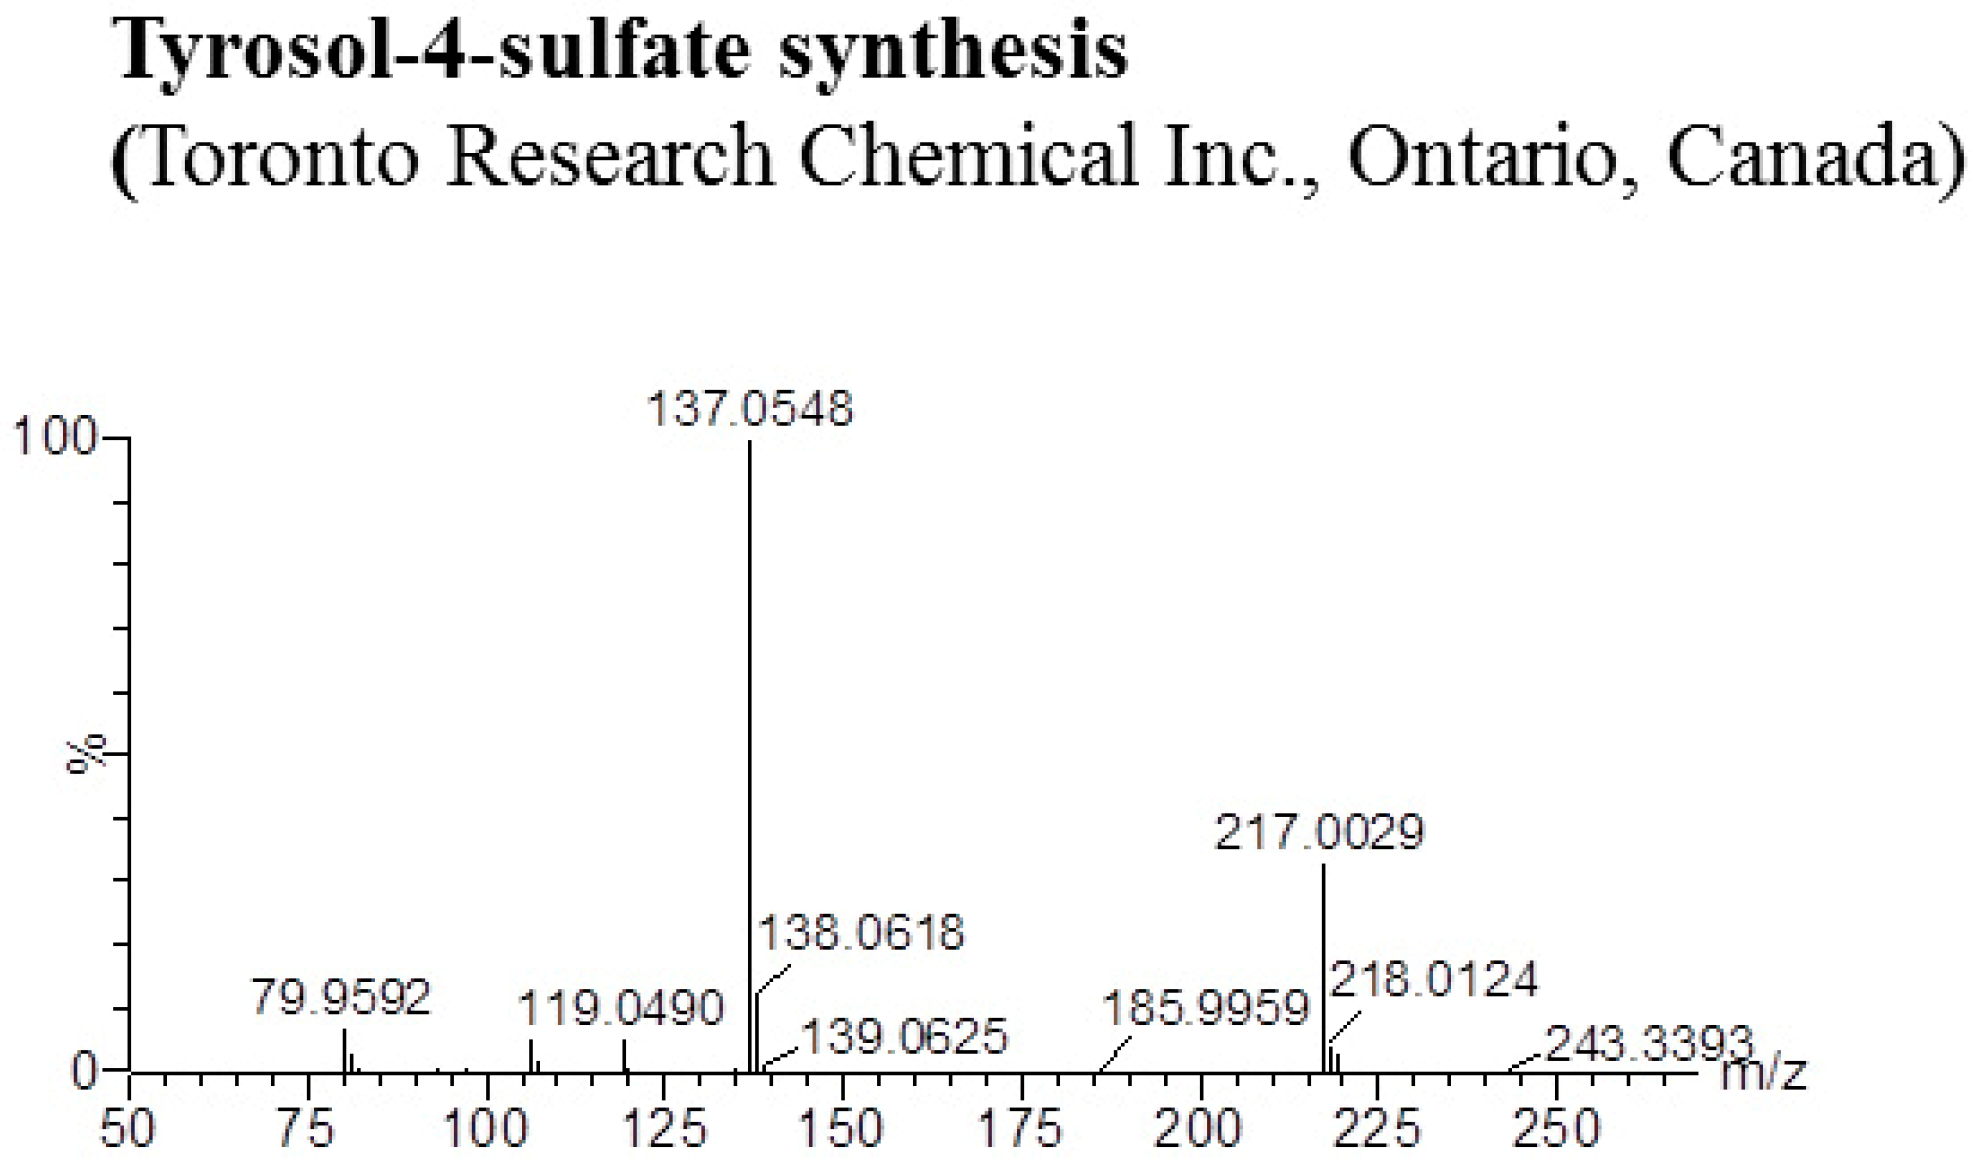
2.1. Identification of Tyrosol Metabolites

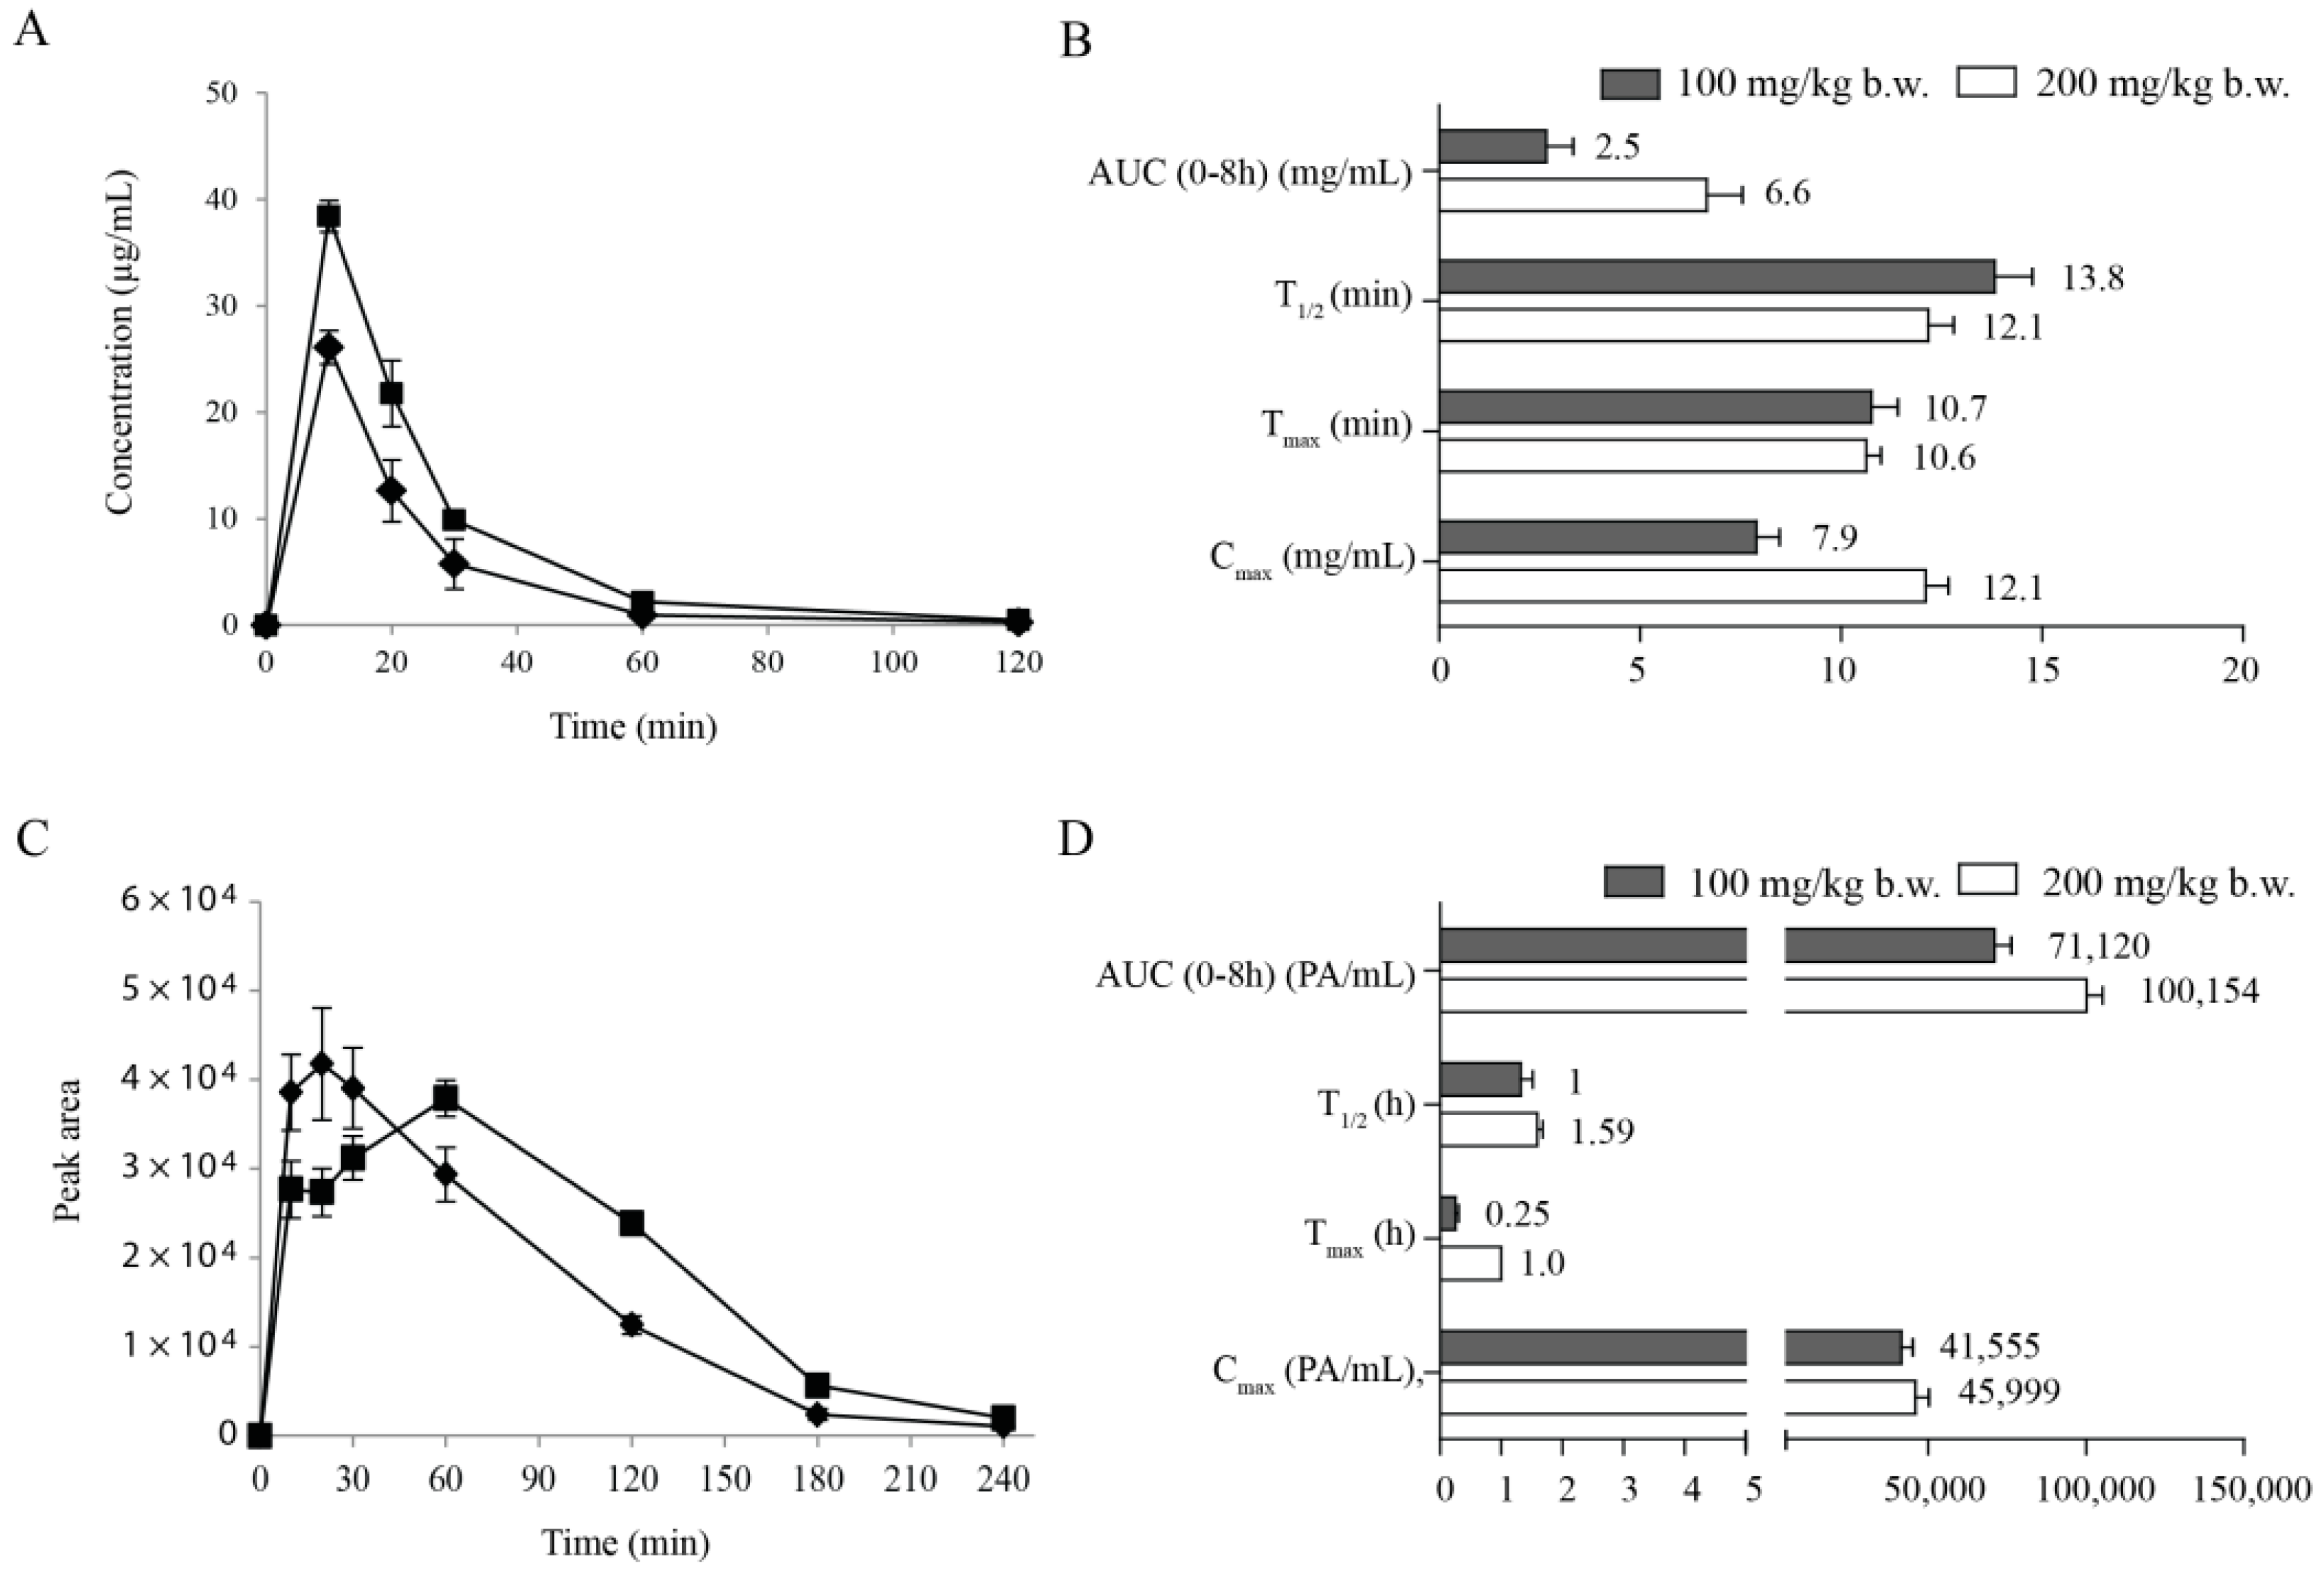
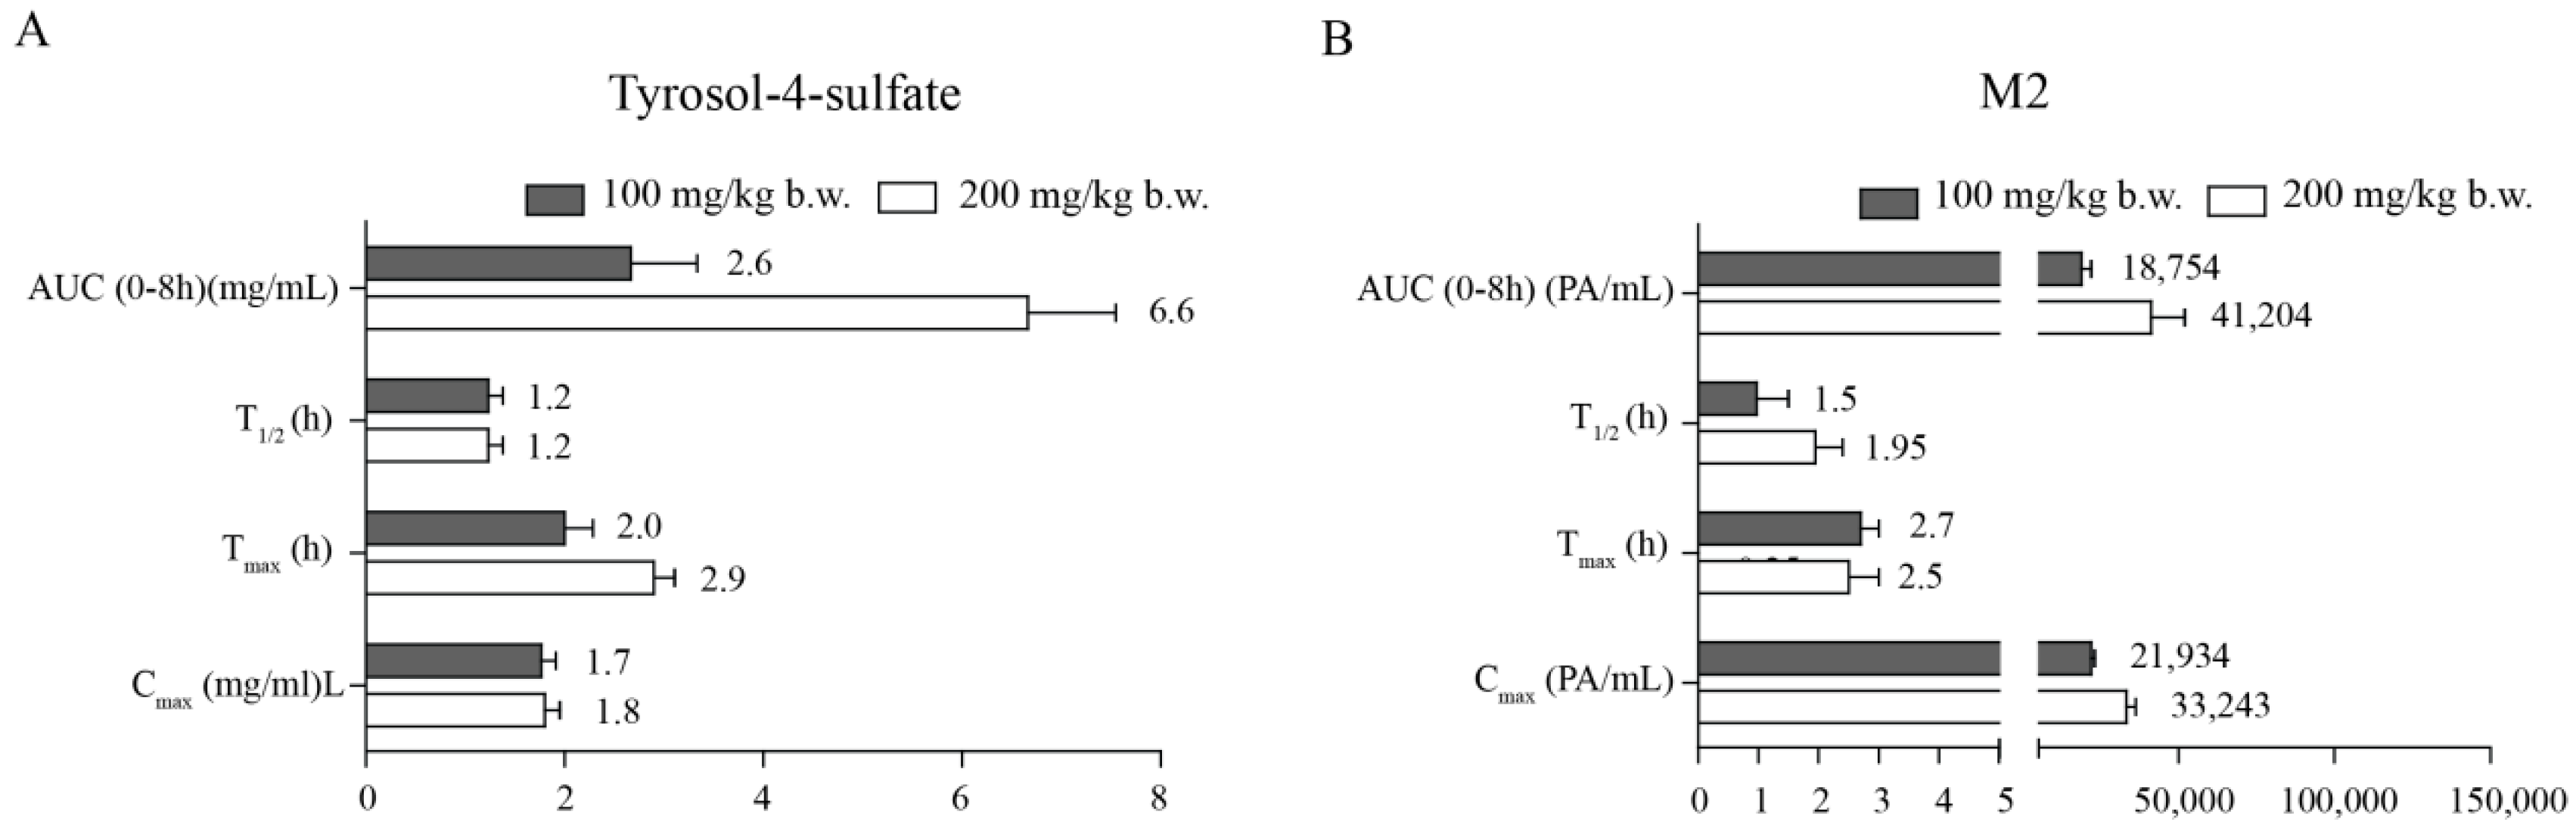
2.2. Pharmacokinetic Study


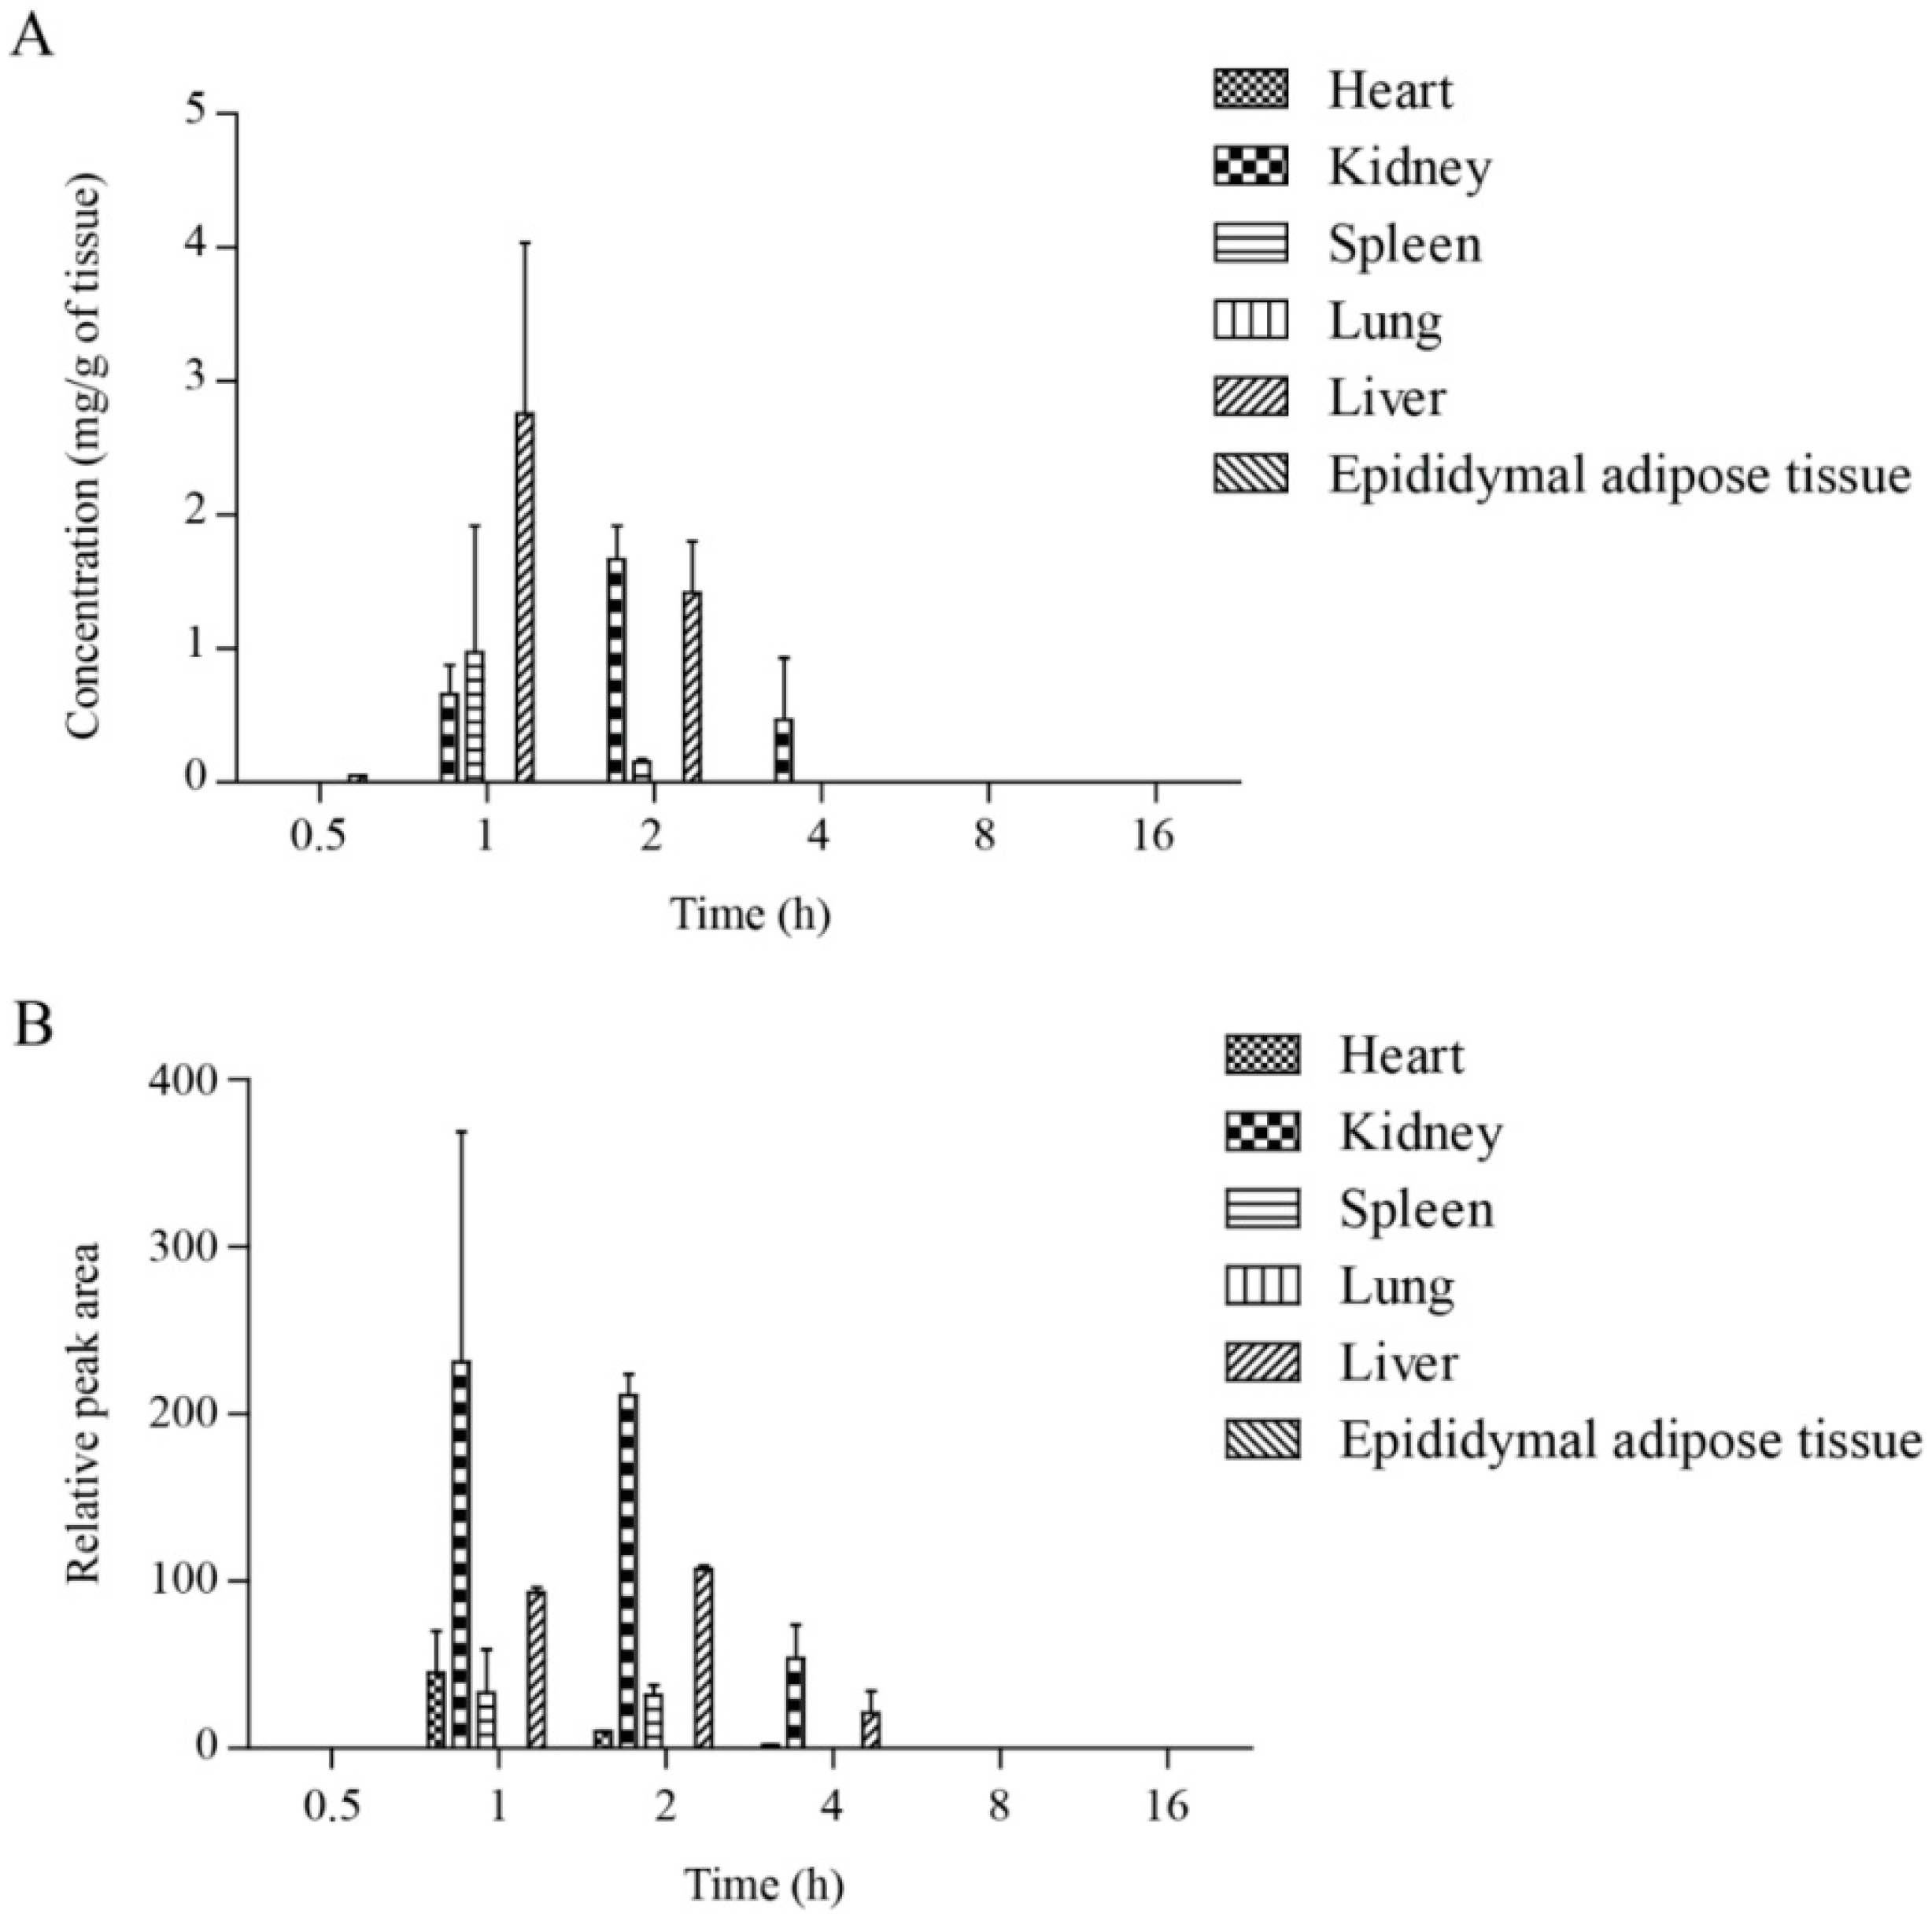
2.3. Tissue Distribution of Tyrosol-Derived Metabolites


3. Materials and Methods
3.1. Materials
3.2. Treatment of Animals
3.3. Plasma Extraction
3.4. Tissue Extraction
3.5. UPLC-MS Analysis
3.6. HPLC Analysis
3.7. Analysis of Pharmacokinetics
4. Conclusions
Acknowledgments
Author Contributions
Conflicts of Interest
Abbreviations
| T4S | Tyrosol-4-sulfate |
| UPLC-Q-TOF-MS | ultra-performance liquid chromatography and quadrupole time-of-flight mass spectrometry |
| HPLC | high-performance liquid chromatography |
| ROS | reactive oxygen species |
| Cmax | maximum plasma concentration |
| Tmax | time to maximum plasma concentration |
| T1/2 | elimination half-life |
Appendix

References
- Bathaie, S.Z.; Faridi, N.; Nasimian, A.; Heidarzadeh, H.; Tamanoi, F. How phytochemicals prevent chemical carcinogens and/or suppress tumor growth? Enzymes 2015, 37, 1–42. [Google Scholar] [PubMed]
- Navarro, E.; Funtikova, A.N.; Fito, M.; Schroder, H. Can metabolically healthy obesity be explained by diet, genetics, and inflammation? Mol. Nutr. Food Res. 2015, 59, 75–93. [Google Scholar] [CrossRef] [PubMed]
- Howes, M.J.; Simmonds, M.S. The role of phytochemicals as micronutrients in health and disease. Curr. Opin. Clin. Nutr. Metab. Care 2014, 17, 558–566. [Google Scholar] [CrossRef] [PubMed]
- Fortalezas, S.; Tavares, L.; Pimpao, R.; Tyagi, M.; Pontes, V.; Alves, P.M.; McDougall, G.; Stewart, D.; Ferreira, R.B.; Santos, C.N. Antioxidant properties and neuroprotective capacity of strawberry tree fruit (Arbutus unedo). Nutrients 2010, 2, 214–229. [Google Scholar] [CrossRef] [PubMed]
- Gris, E.F.; Mattivi, F.; Ferreira, E.A.; Vrhovsek, U.; Filho, D.W.; Pedrosa, R.C.; Bordignon-Luiz, M.T. Stilbenes and tyrosol as target compounds in the assessment of antioxidant and hypolipidemic activity of vitis vinifera red wines from southern Brazil. J. Agric. Food Chem. 2011, 59, 7954–7961. [Google Scholar] [CrossRef] [PubMed]
- Tuck, K.L.; Hayball, P.J. Major phenolic compounds in olive oil: Metabolism and health effects. J. Nutr. Biochem. 2002, 13, 636–644. [Google Scholar] [CrossRef]
- Bayram, B.; Ozcelik, B.; Schultheiss, G.; Frank, J.; Rimbach, G. A validated method for the determination of selected phenolics in olive oil using high-performance liquid chromatography with coulometric electrochemical detection and a fused-core column. Food Chem. 2013, 138, 1663–1669. [Google Scholar] [CrossRef] [PubMed]
- Bevilacqua, L.; Buiarelli, F.; Coccioli, F.; Jasionowska, R. Identification of compounds in wine by HPLC-tandem mass spectrometry. Ann. Chim. 2004, 94, 679–689. [Google Scholar] [CrossRef] [PubMed]
- Wang, S.-J.; Lee, H.-J.; Cho, J.-Y.; Park, K.-H.; Moon, J.-H. Isolation and identification of antioxidant from makgeolli. Korean J. Food Sci. Technol. 2012, 44, 7. [Google Scholar] [CrossRef]
- Canuelo, A.; Gilbert-Lopez, B.; Pacheco-Linan, P.; Martinez-Lara, E.; Siles, E.; Miranda-Vizuete, A. Tyrosol, a main phenol present in extra virgin olive oil, increases lifespan and stress resistance in Caenorhabditis elegans. Mech. Ageing Dev. 2012, 133, 563–574. [Google Scholar] [CrossRef] [PubMed]
- Chandramohan, R.; Pari, L.; Rathinam, A.; Sheikh, B.A. Tyrosol, a phenolic compound, ameliorates hyperglycemia by regulating key enzymes of carbohydrate metabolism in streptozotocin induced diabetic rats. Chem. Biol. Interact. 2015, 229, 44–54. [Google Scholar] [CrossRef] [PubMed]
- Lee, H.; Im, S.W.; Jung, C.H.; Jang, Y.J.; Ha, T.Y.; Ahn, J. Tyrosol, an olive oil polyphenol, inhibits ER stress-induced apoptosis in pancreatic β-cell through JNK signaling. Biochem. Biophys. Res. Commun. 2016, 469, 748–752. [Google Scholar] [CrossRef] [PubMed]
- Chernyshova, G.A.; Plotnikov, M.B.; Smol’iakova, V.I.; Krasnov, E.A. Main pharmacokinetic parameters of p-tyrosol after intravenous injection in rats. Part III: Distribution of p-tyrosol in rat. Eksp. Klin. Farmakol. 2011, 74, 27–29. [Google Scholar] [PubMed]
- Mateos, R.; Goya, L.; Bravo, L. Metabolism of the olive oil phenols hydroxytyrosol, tyrosol, and hydroxytyrosyl acetate by human hepatoma HepG2 cells. J. Agric. Food Chem. 2005, 53, 9897–9905. [Google Scholar] [CrossRef] [PubMed]
- Visioli, F.; Galli, C.; Bornet, F.; Mattei, A.; Patelli, R.; Galli, G.; Caruso, D. Olive oil phenolics are dose-dependently absorbed in humans. FEBS Lett. 2000, 468, 159–160. [Google Scholar] [CrossRef]
- Suarez, M.; Romero, M.P.; Macia, A.; Valls, R.M.; Fernandez, S.; Sola, R.; Motilva, M.J. Improved method for identifying and quantifying olive oil phenolic compounds and their metabolites in human plasma by microelution solid-phase extraction plate and liquid chromatography-tandem mass spectrometry. J. Chromatogr. B Anal. Technol. Biomed. Life Sci. 2009, 877, 4097–4106. [Google Scholar] [CrossRef] [PubMed]
- Miro-Casas, E.; Covas, M.I.; Fito, M.; Farre-Albadalejo, M.; Marrugat, J.; de la Torre, R. Tyrosol and hydroxytyrosol are absorbed from moderate and sustained doses of virgin olive oil in humans. Eur. J. Clin. Nutr. 2003, 57, 186–190. [Google Scholar] [CrossRef] [PubMed]
- Covas, M.I.; de la Torre, R.; Fito, M. Virgin olive oil: A key food for cardiovascular risk protection. Br. J. Nutr. 2015, 113 (Suppl. 2), S19–S28. [Google Scholar] [CrossRef] [PubMed]
- Sarna, L.K.; Sid, V.; Wang, P.; Siow, Y.L.; House, J.D.; Karmin, O. Tyrosol attenuates high fat diet-induced hepatic oxidative stress: Potential involvement of cystathionine β-synthase and cystathionine γ-lyase. Lipids 2015. [CrossRef] [PubMed]
- Obach, R.S. Pharmacologically active drug metabolites: Impact on drug discovery and pharmacotherapy. Pharmacol. Rev. 2013, 65, 578–640. [Google Scholar] [CrossRef] [PubMed]
- Atzeri, A.; Lucas, R.; Incani, A.; Penalver, P.; Zafra-Gomez, A.; Melis, M.P.; Pizzala, R.; Morales, J.C.; Deiana, M. Hydroxytyrosol and tyrosol sulfate metabolites protect against the oxidized cholesterol pro-oxidant effect in Caco-2 human enterocyte-like cells. Food Funct. 2015. [Google Scholar] [CrossRef] [PubMed]
- Vauzour, D.; Corona, G.; Spencer, J.P. Caffeic acid, tyrosol and p-coumaric acid are potent inhibitors of 5-S-cysteinyl-dopamine induced neurotoxicity. Arch. Biochem. Biophys. 2010, 501, 106–111. [Google Scholar] [CrossRef] [PubMed]
- Warleta, F.; Quesada, C.S.; Campos, M.; Allouche, Y.; Beltran, G.; Gaforio, J.J. Hydroxytyrosol protects against oxidative DNA damage in human breast cells. Nutrients 2011, 3, 839–857. [Google Scholar] [CrossRef] [PubMed]
- Sample Availability: Samples of the compounds not are available from the authors.
© 2016 by the authors. Licensee MDPI, Basel, Switzerland. This article is an open access article distributed under the terms and conditions of the Creative Commons by Attribution (CC-BY) license ( http://creativecommons.org/licenses/by/4.0/).
Share and Cite
Lee, D.-H.; Kim, Y.-J.; Kim, M.J.; Ahn, J.; Ha, T.-Y.; Lee, S.H.; Jang, Y.J.; Jung, C.H. Pharmacokinetics of Tyrosol Metabolites in Rats. Molecules 2016, 21, 128. https://doi.org/10.3390/molecules21010128
Lee D-H, Kim Y-J, Kim MJ, Ahn J, Ha T-Y, Lee SH, Jang YJ, Jung CH. Pharmacokinetics of Tyrosol Metabolites in Rats. Molecules. 2016; 21(1):128. https://doi.org/10.3390/molecules21010128
Chicago/Turabian StyleLee, Da-Hye, Yang-Ji Kim, Min Jung Kim, Jiyun Ahn, Tae-Youl Ha, Sang Hee Lee, Young Jin Jang, and Chang Hwa Jung. 2016. "Pharmacokinetics of Tyrosol Metabolites in Rats" Molecules 21, no. 1: 128. https://doi.org/10.3390/molecules21010128