Article

Correlation between Cytotoxic Activities and Reduction Potentials of Heterocyclic Quinones

1
Faculty of Pharmaceutical Sciences, Kobe Pharmaceutical University, Higashinada, Kobe 658-8558, Japan
2
Division of Molecular Pharmacology, Cancer Chemotherapy Center, Japanese Foundation for Cancer Research, Tokyo, Japan
*
Author to whom correspondence should be addressed.
Molecules 2010, 15(9), 6559-6569; https://doi.org/10.3390/molecules15096559
Submission received: 23 August 2010 / Revised: 7 September 2010 / Accepted: 16 September 2010 / Published: 20 September 2010
(This article belongs to the Collection Bioactive Compounds)

Abstract

:
To search for possible anti-tumor agents or anti-tumor promoters among natural or synthetic products, we used cyclic voltammetry to determine the reduction-oxidation potentials of heterocyclic quinones in phosphate buffer at pH 7.2. We determined the growth inhibitory- and cytotoxic activities of 12 heterocyclic quinone anti-tumor agent candidates against a panel of 39 human cancer cell lines (JFCR39). The average concentrations of the heterocyclic quinones required for 50% growth inhibition (GI50) against JFCR39 ranged from 0.045 to 13.2 μM, and the 50% lethal concentration (LC50) against JFCR39 ranged from 0.398 to 77.7 μM. The average values of GI50 or LC50 of the heterocyclic quinones correlated significantly with their reduction potentials. These results suggested that reduction-oxidation potentials could be a useful method for the discovery of novel antitumor agents.

1. Introduction

Naturally occurring quinones, which are widely distributed throughout both the animal and plant kingdoms, typically function as pigments and as intermediates in cellular respiration and photosynthesis. Several of these molecules possess anti-neoplastic chemotherapeutic properties [1,2]. Quinones are found in many drugs, including anthracyclines, daunorubicin, doxorubicin, mitomycin, mitoxantrones, and saintopin, all of which are used in the clinical therapy of solid tumors. The cytotoxic effects of these quinones are primarily due to inhibition of DNA topoisomerase-II [3,4]. Several recent publications have highlighted the anti-tumor activity of kigelinone (2-(1-hydroxyethyl)-5(or 8)-hydroxynaphtho[2,3-b]furan-4,9-dione), a furanonaphthoquinone molecule isolated from Tabebuia cassinoides [5]. Heterocyclic quinones containing nitrogen atoms possess excellent anti-tumor [6,7] and other biologic activities [8,9]. Previously, we reported the in vitro anti-tumor promoting activity of heterocyclic quinines, as evidenced by inhibitory effects on 12-O-tetradecanoylphorbol-13-acetate (TPA)-induced Epstein-Barr virus early antigen (EBV-EA) activation in Raji cells [10,11]. Standard redox potential is important in determining the physiological activity of drugs [12]. We employed cyclic voltammetry to determine the standard redox or first reduction potentials of anthraquinones, bianthraquinones, naphthoquinones, and azaanthraquinones at a physiological pH of 7.2. We found a significant correlation between the standard redox or first reduction potentials and the inhibitory effects (log IC50) of these compounds on EBV-EA activation [13,14,15,16,17,18].
In this study, we have attempted to expand the potential use of reduction-oxidation potentials determined by cyclic voltammetry to the discovery of anti-tumor agents. We determined the growth inhibitory- and cytotoxic activities of 12 heterocyclic quinine anti-tumor agent candidates against a panel of 39 human cancer cell lines (JFCR39), an information-rich and pharmacologically well characterized drug discovery system [19,20,21,22,23]. Subsequently, we measured the reduction-oxidation potentials of these compounds in phosphate buffer at pH 7.2. Then, we examined the correlation between the activities (log GI50 and log LC50) and first reduction potentials of these compounds. Furthermore, we calculated additional molecular properties of heterocyclic quinones using the CAChe MOPAC program and the PM3 method [24], and identified the partition coefficient (log P) and LUMO energy as useful parameters that could help predict anti-tumor activities of these compounds.

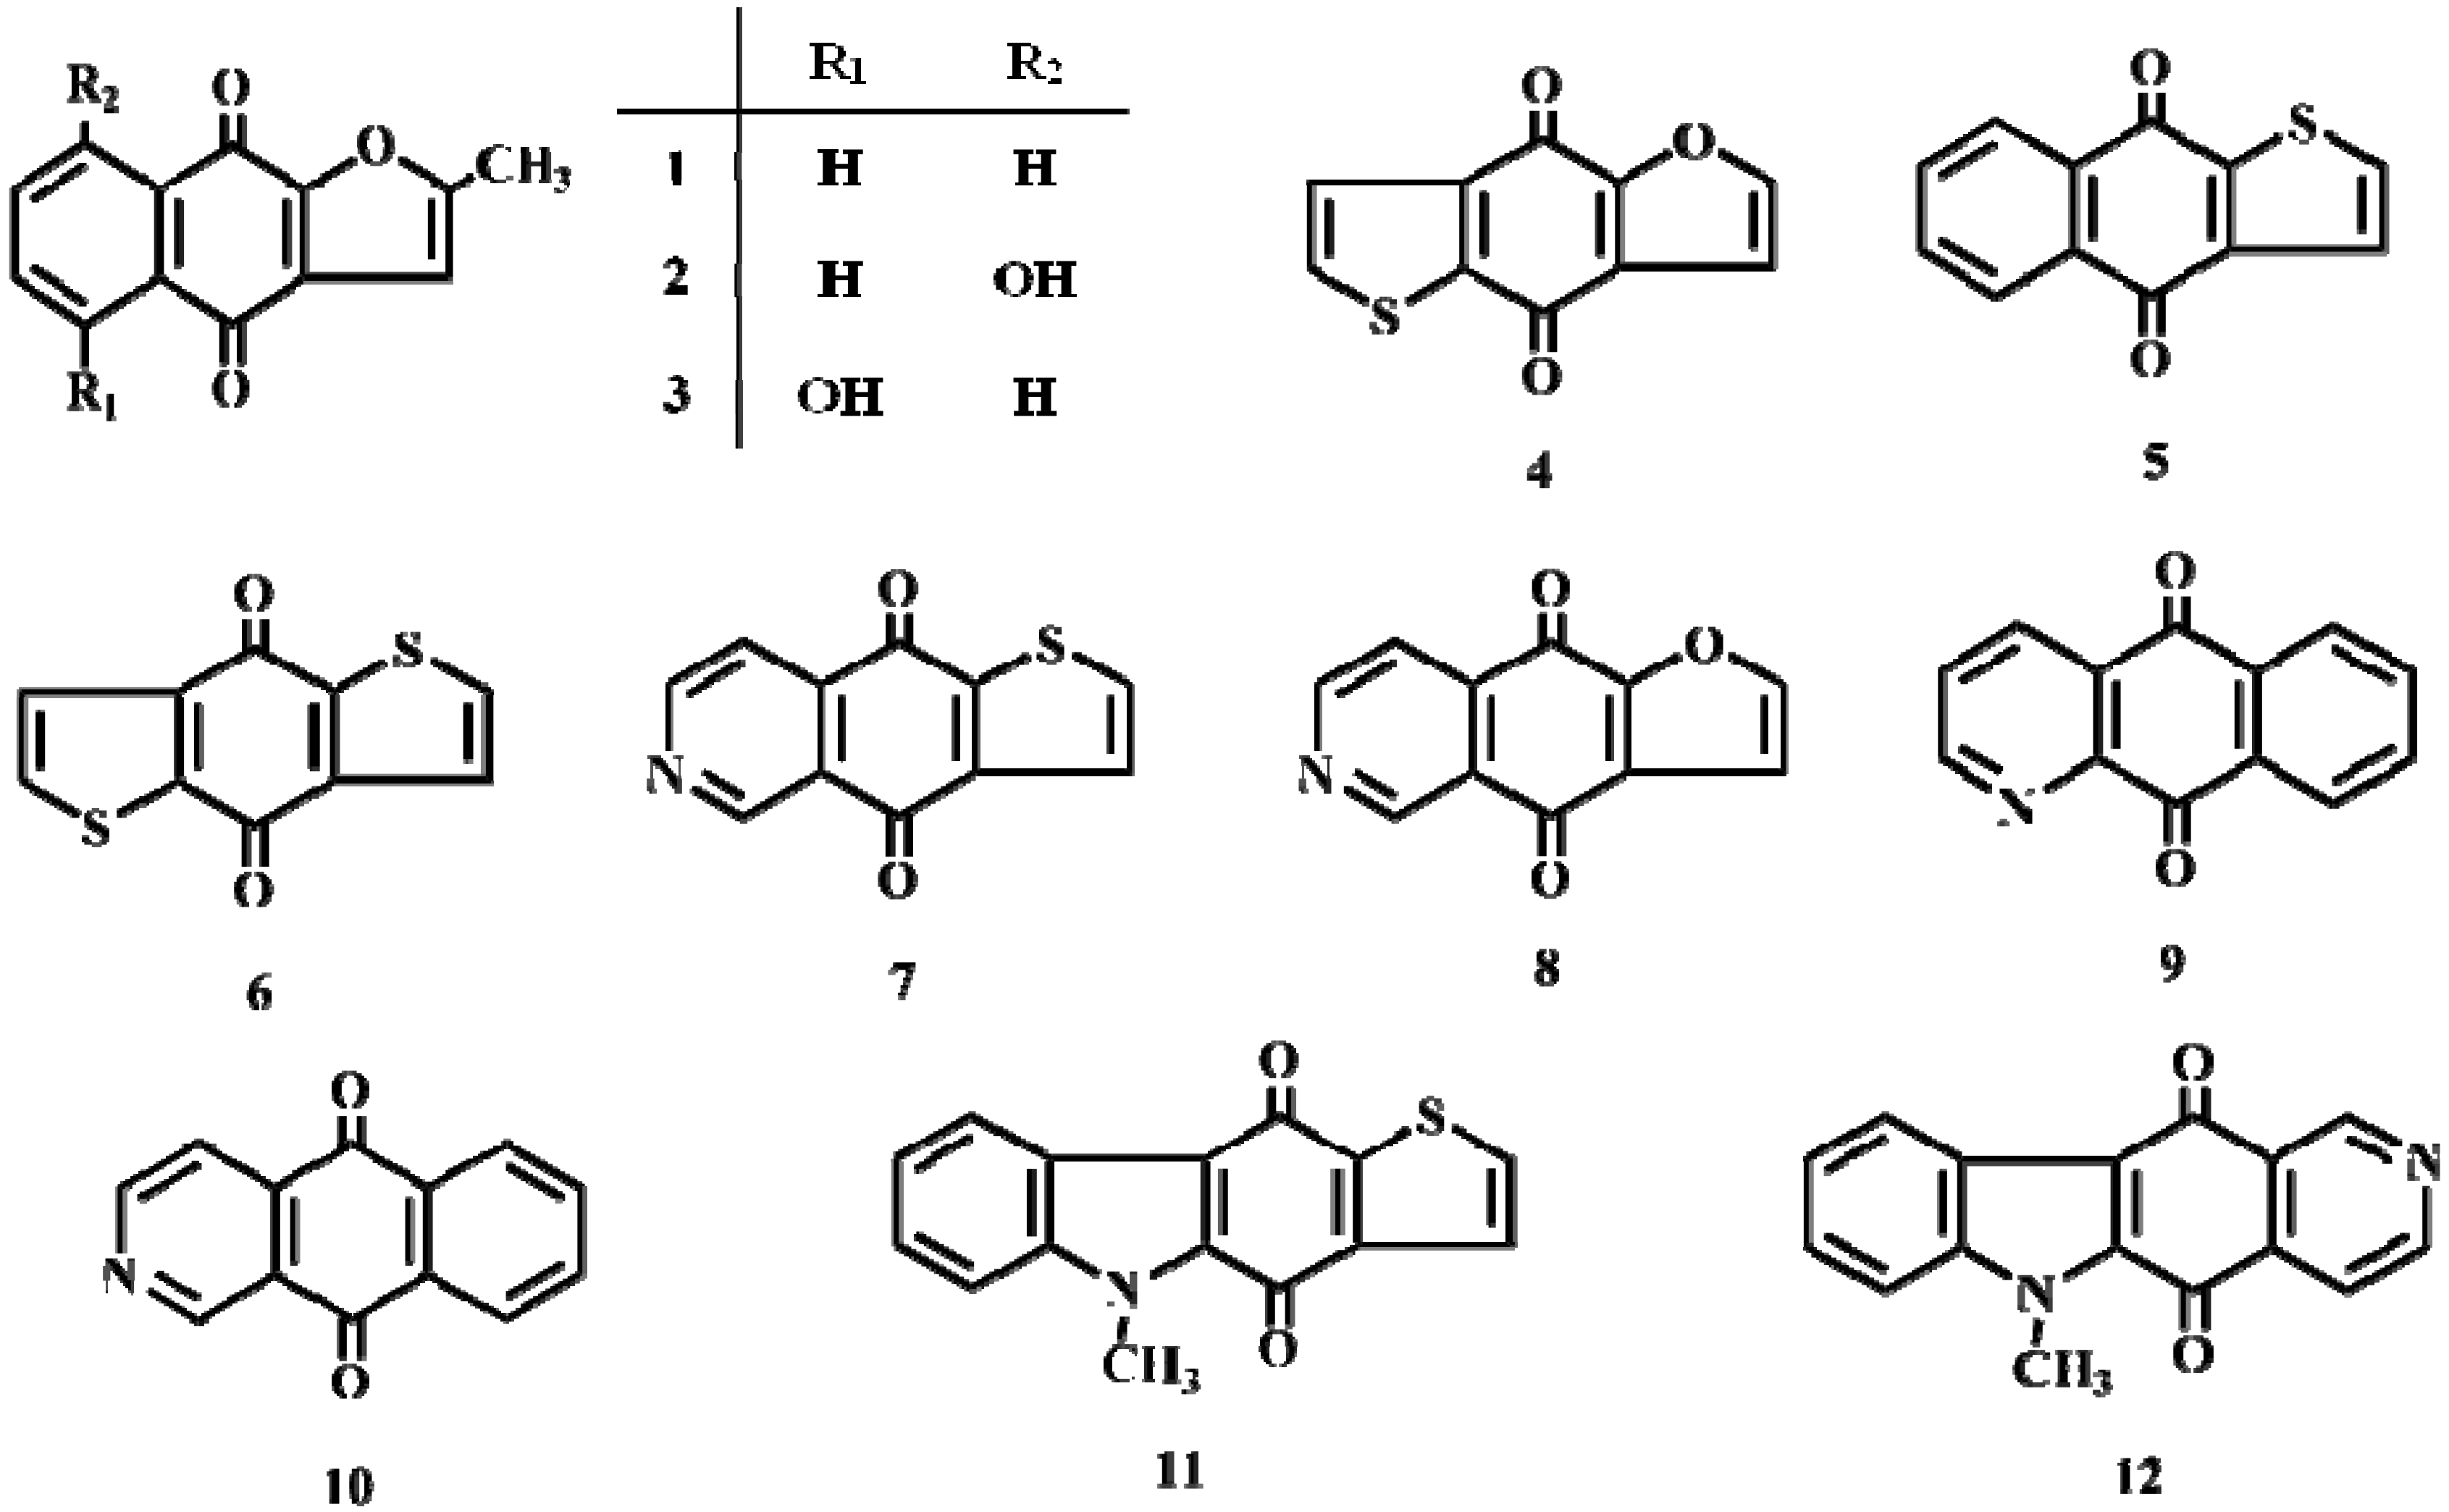
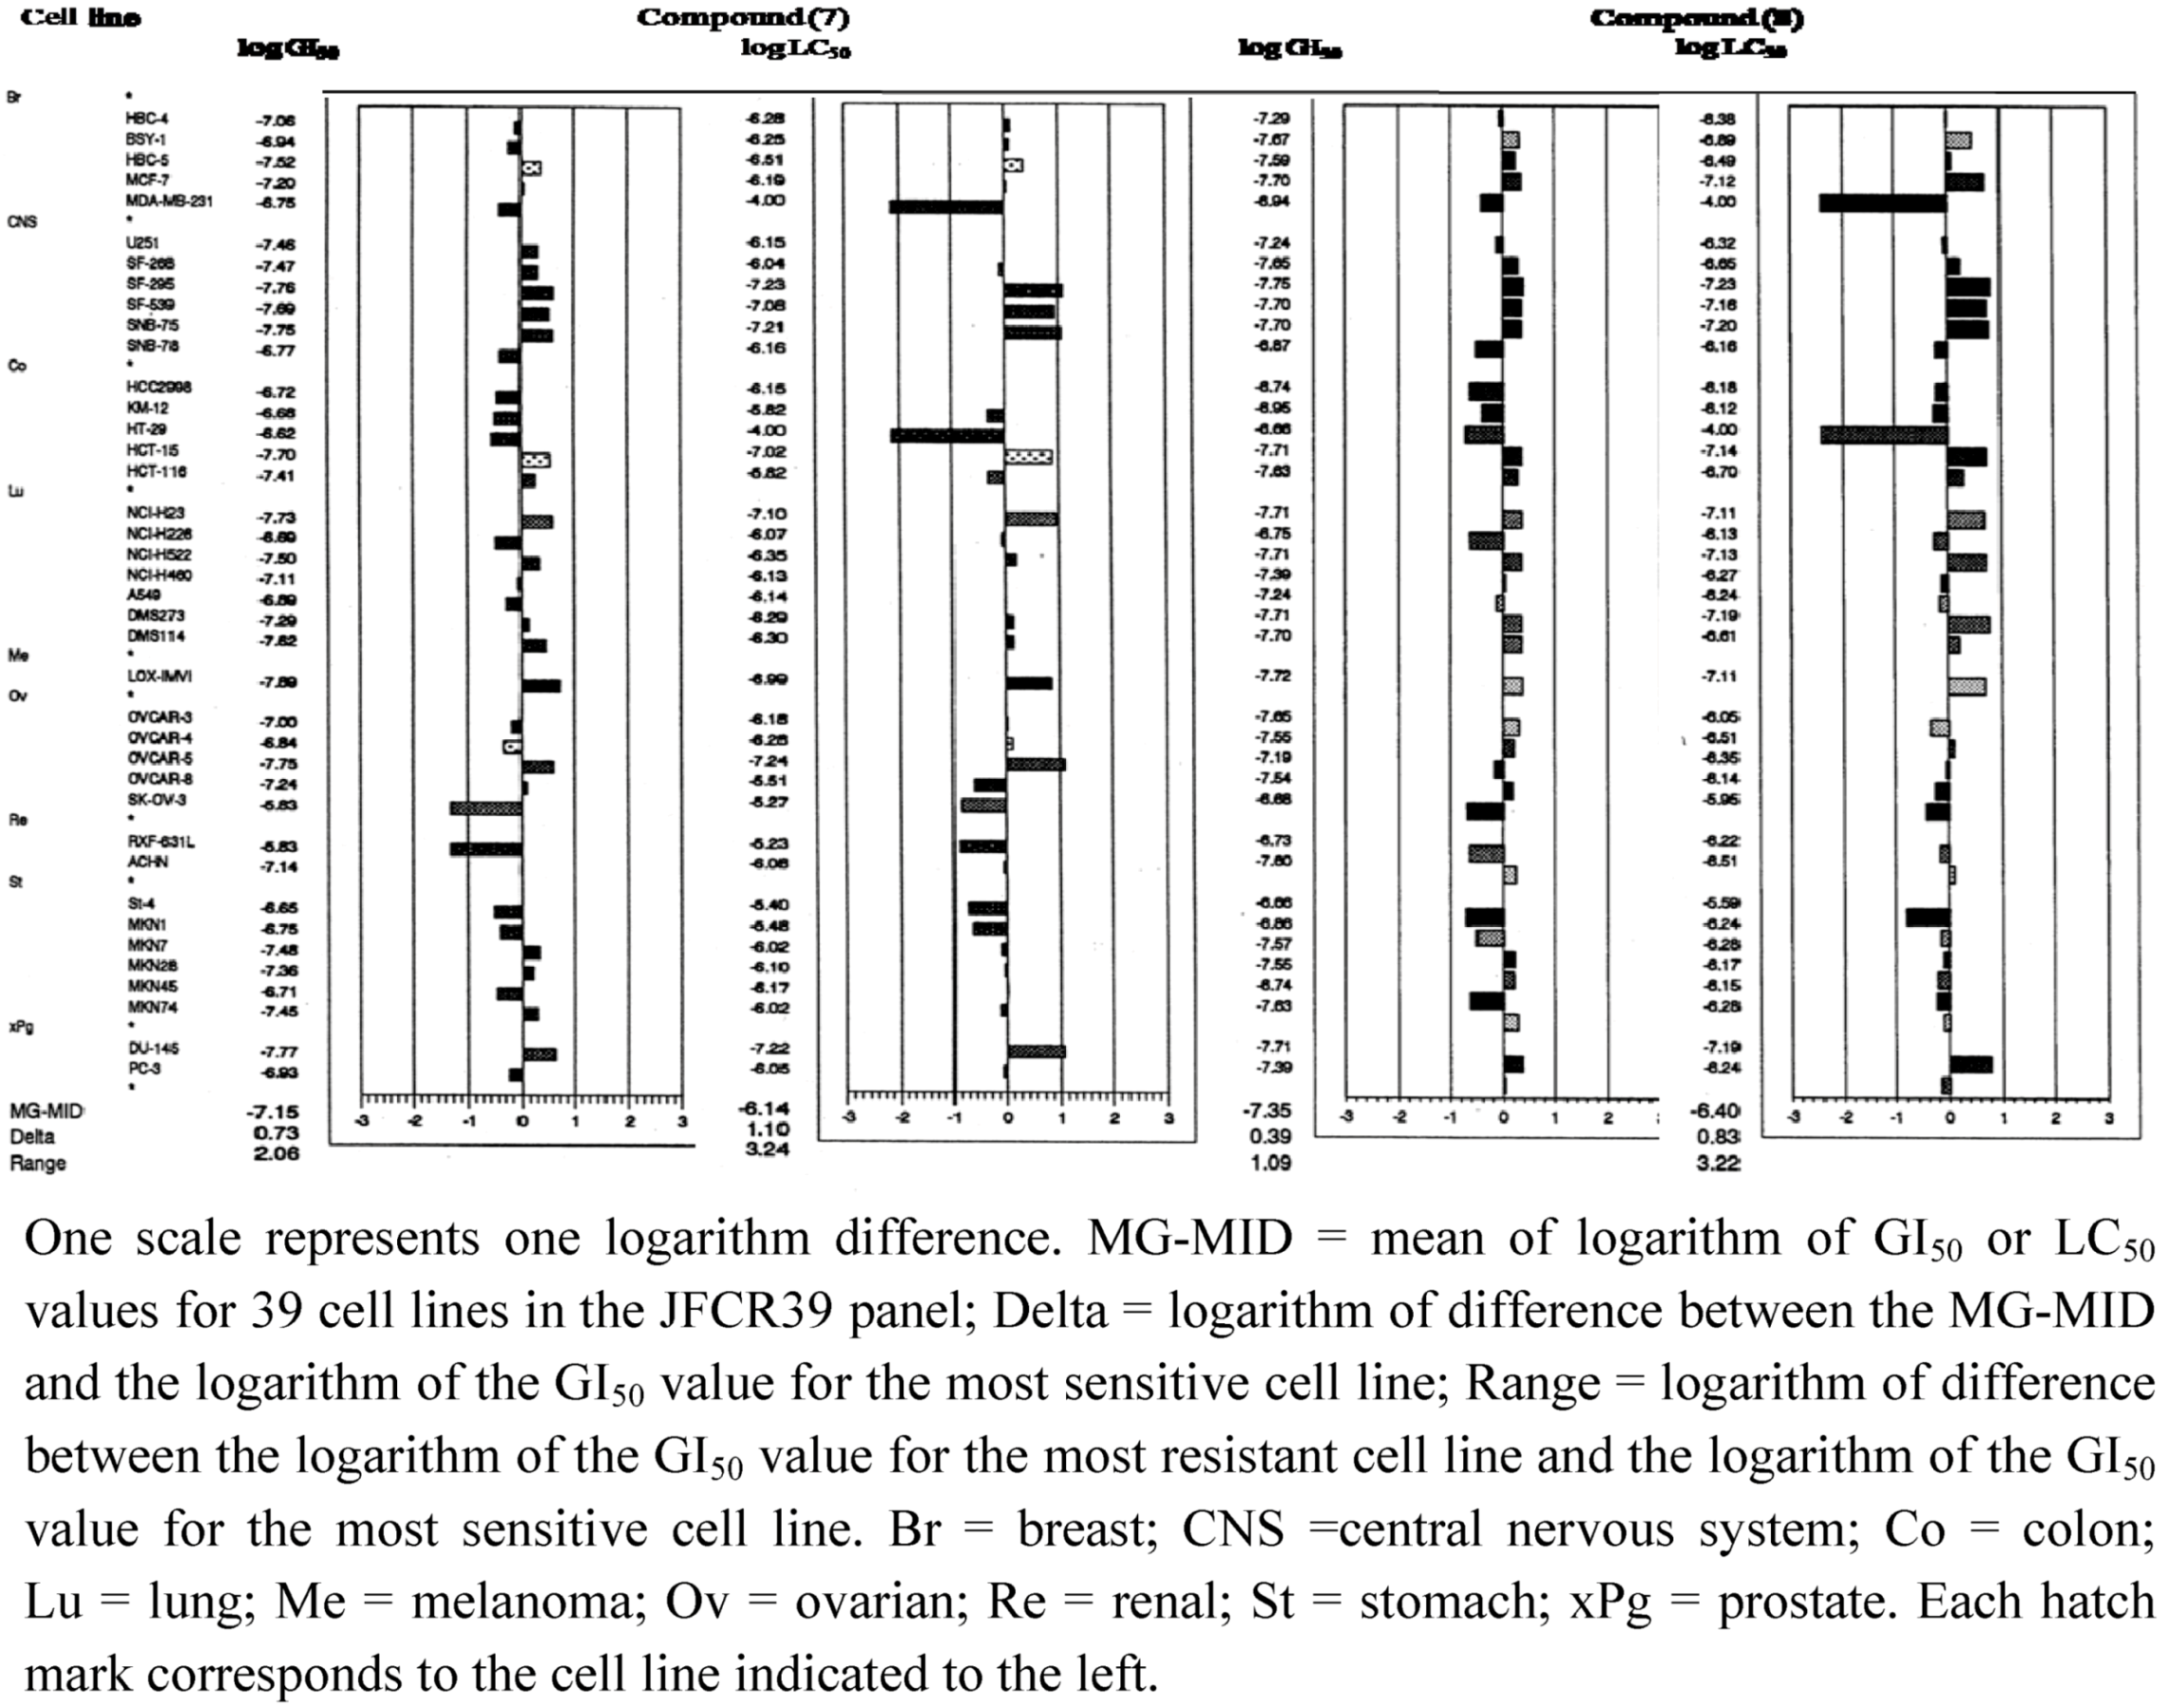
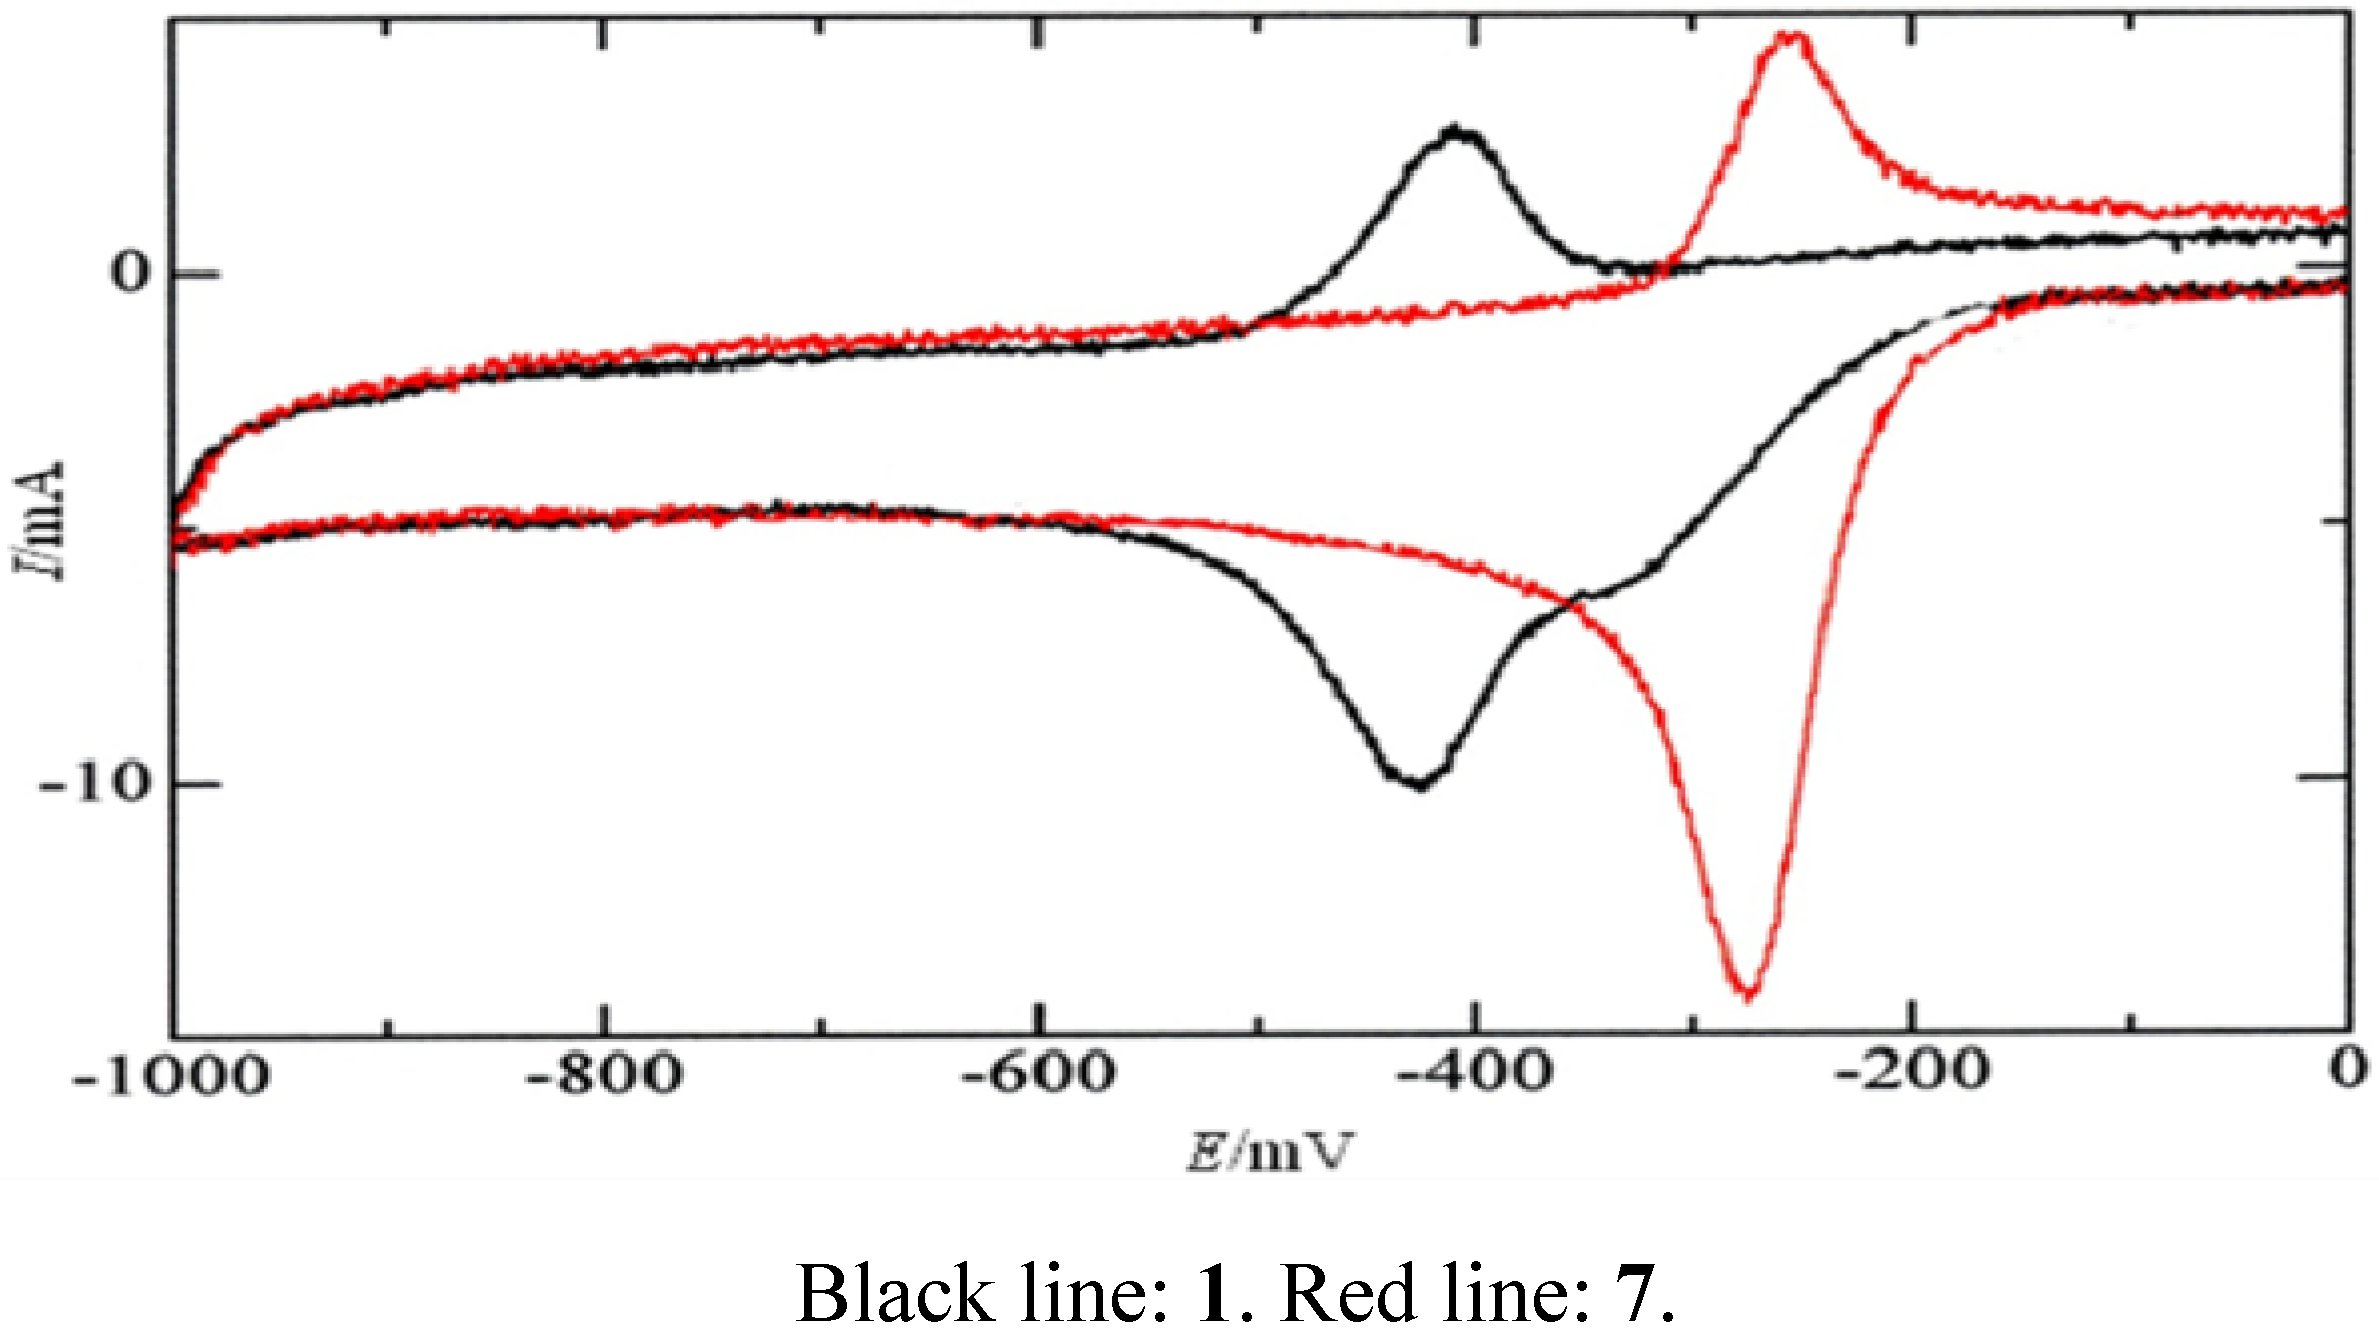
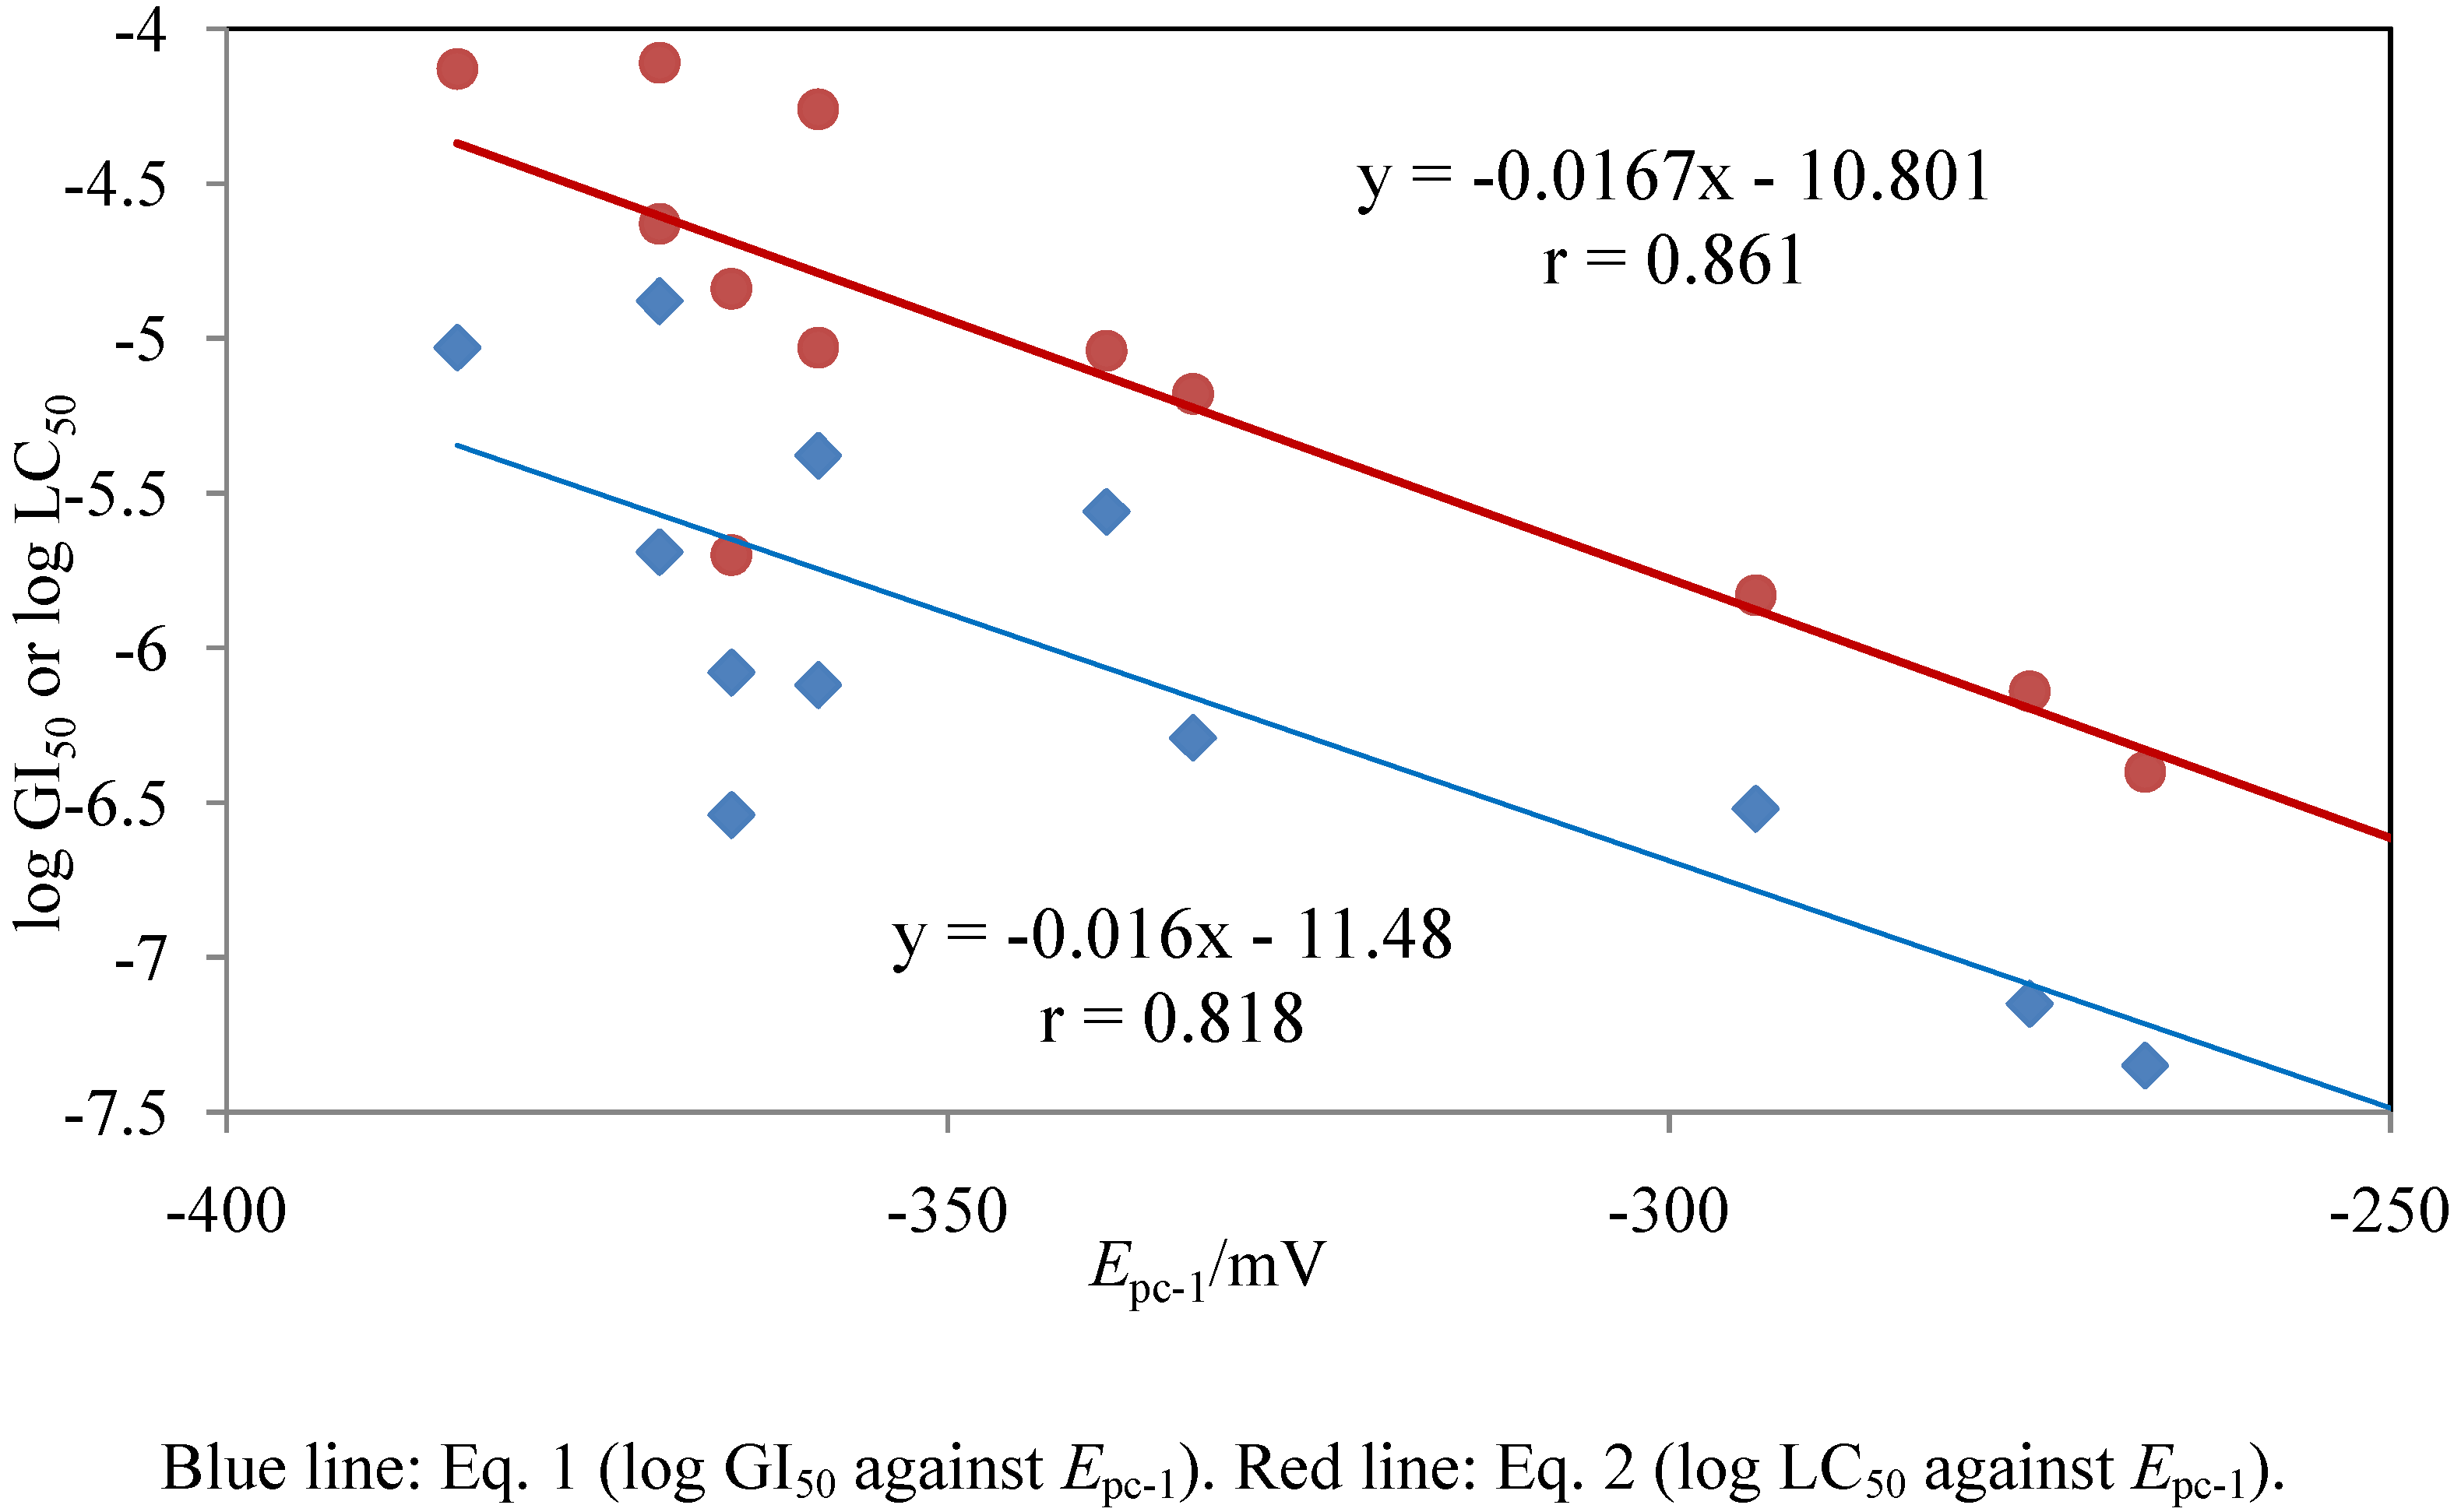
2. Results and Discussion

Twelve heterocyclic quinones (Figure 1) were tested for their growth inhibitory- and cytotoxic activities against JFCR 39 cells; the results (the means of GI50 and LC50 values) are summarized in Table 1. Compounds 2-4, 6-8, and 12 were cytotoxic (GI50: 0.045-0.831 μM). Compounds 7 and 8 exhibited the highest levels of cytotoxicity, with GI50 values of 0.071 and 0.045 μM and LC50 values of 0.724 and 0.398 μM, respectively. In contrast, compounds 9 and 11 were minimally cytotoxic, with GI50 values of 13.18 and 9.33 μM, respectively. The presence of a phenolic hydroxy group increased the potency of compounds having similar backbone molecular structures (1→2,3); a similar tendency was observed for anthraquinones [18]. Replacement of the thiophene for a furan ring showed a similar tendency in activity (4 and 6, 7 and 8). The pyridine ring with the nitrogen in the 2 position lead to heteroquinones with good potency. Replacement of the pyridine (2 position of the nitrogen) for a thiophene ring reduced the activity (7>6, 8>4, 12>11).
The graphs displaying the means of the growth-inhibition of GI50 and cytotoxicity (LC50) of compounds (7 and 8) demonstrated the potent anti-cancer effects of these compounds (Figure 2). The GI50 and LC50 values for compounds 7 and 8 indicated that these compounds were more effective against the lung cancer line NCI-H23, the colorectal cancer cell line HCT-15, the melanoma line LOX-IMVI, the central nervous system cell lines SF-295 and SNB-75, and the prostate cancer line DU-145.
Figure 1. Structures of heterocyclic quinone derivatives.
Molecules 15 06559 g001
Table 1. Growth inhibitory- (GI50) and cytotoxic (LC50) activities of heterocyclic quinone derivatives against 39 human cancer cell lines in the JFCR39 panel.
MG-MID of log GI50(μM)MG-MID of log LC50 (μM)
1-5.56(2.75) -5.04 (9.12)
2-6.08(0.831) -4.84 (14.45)
3-6.29(0.513) -5.18 (6.61)
4-6.52(0.302) -5.83 (1.48)
5-5.38(4.17) -4.26 (54.95)
6-6.54(0.288) -5.70 (2.00)
7-7.15(0.071) -6.14 (0.724)
8-7.35(0.045) -6.40 (0.398)
9-4.88(13.18) -4.11 (77.62)
10-5.69(2.04) -4.63 (23.44)
11-5.03(9.33) -4.13 (74.13)
12-6.12(0.759) -5.03 (9.33)
GI50: 50% Growth inhibition concentration (M); LC50: 50% Lethal concentration (M); MG-MID: Mean of logarithm of GI50 or LC50 values for 39 cell lines in the JFCR39 panel.
Figure 2. Growth inhibitory- and cytotoxic activities of compounds 7 and 8 against 39 human cancercell lines in the JFCR39 panel. Mean graph was produced by computer processing of the 50% growth inhibition (GI50) values. Logarithm of the GI50 value for each cell line is indicated. In the plot, columns to the right of zero indicate that thesensitivity of the cell line to the compound, and columns to the left indicate resistance to the compound. The x–axis represents logarithm of difference between the mean of GI50 valuesfor 39 cell lines and the GI50 value for each cell line in the JFCR39 panel.
Molecules 15 06559 g002
The COMPARE algorithm was established for the JFCR39 panel, which can predict the mode of action of a test compound based on the similarity in the fingerprint (see Figure 2), a growth inhibition profile of a compound across the JFCR-39 panel, to the reference compounds with known mode of actions [19,21]. We analyzed the fingerprints of the heterocyclic quinone derivatives. In the development of the heterocyclic quinones, furanonaphthoquinones went ahead, and, as for 1, anti-tumor activity was already proved in vivo [25]. Compounds 4 and 6 were designed based on compound 1, and compounds 7 and 8 were designed based on 4. Compounds 7 and 8 were apparently more cytotoxic in vitro than 4. Although compounds 4 and 6-8 inherited a characteristic of compound 1, they were different in the fingerprints from any of known anti-cancer drugs listed in the database of the JFCR-39 [20], suggesting that these compounds had very unique modes of action (data not shown). We are interested in whether these compounds might display anti-tumor effects in vivo.
Figure 3. Cyclic voltammograms of compounds 1 and 7 at a PFC electrode in 3:1 (v/v) 0.1 M phosphate buffer (pH 7.2) – ethanol. Voltage scan rate: 20 mV s-1.
Molecules 15 06559 g003
Cyclic voltammograms of 1 and 7 obtained at 20 mV s–1 (Figure 3) demonstrated that compound 1 produced two (one is a shoulder peak) cathodic (reduction) peaks, while compound 7 produced one cathodic peak (cathodic and anodic peak potentials at 20 mV s–1 are summarized in Table 2). When the voltage scan rate was increased (up to 100 mV s–1), the peak current of the second sharp reduction peak (accompanied by an anodic peak) increased, to become larger than that of the first reduction peak; therefore, this peak pair was an adsorption wave due to the redox reaction of the heterocyclic quinone derivative adsorbed at the electrode surface. The corresponding anodic peak, however, was not detected for all compounds tested, likely due to the instability of the reduction product. Accordingly, the first reduction peak potential at 20 mV s–1 (Epc-1) was used to examine any connection to cytotoxic activity. The values of log GI50 or log LC50 were plotted against the first reduction potential (Epc-1 in mV) of compounds 1-12 in Figure 4. Plots demonstrated a correlation of the log GI50 or log LC50 values with Epc-1. The log GI50 and log LC50 were represented by the regression equations:
log GI50 = –0.016 Epc-1 – 11.48 (n = 12, r = 0.818)
log LC50 = –0.0167 Epc-1 – 10.801 (n = 12, r = 0.861)
where n and r are the numbers of test compounds and correlation coefficients, respectively.
In studies examining structure-activity relationships, electronic properties have typically been used as useful parameters. We therefore examined the correlation of log GI50 and log LC50 with the electronic properties of heterocyclic quinones (1-12), including HOMO, LUMO energy, steric energy, total energy, solvent accessible surface area (SASA), and log P (Table 3). Log P was determined to be the most effective parameter:
log GI50 = –6.732 + 0.807 log P (n = 12, r = 0.789)
log LC50 = –5.814 + 0.835 log P (n = 12, r = 0.820)
LUMO energy also correlated well with anti-tumor activity:
log GI50 = 0.822 + 4.075 LUMO (n = 12, r = 0.730)
log LC50 = 1.453 + 3.891 LUMO (n = 12, r = 0.700)
We performed multiple regression analyses for the log GI50 and log LC50 values using electronic and molecular properties of the heterocyclic quinone derivatives:
log GI50 = –6.097 – 0.012 Epc-1 – 2.338 LUMO (n = 12, r = 0.893)
log GI50 = –9.864 – 0.010 Epc-1 + 0.429 log P (n = 12, r = 0.869)
log LC50 = –6.357 – 0.013 Epc-1 – 1.930 LUMO (n = 12, r = 0.911)
log GI50 = –9.187 – 0.011 Epc-1 + 0.428 log P (n = 12, r = 0.910)
Thus, Epc-1, LUMO, and log P were promising parameters to predict GI50 and LC50. It remains unclear, however, why these parameters correlate well with the GI50 and LC50 values of hererocyclic quinones.
Table 2. First and second cathodic peak potentials (Epc-1 and Epc-2) and the anodic peak potential (Epa) versus Ag/AgCl (saturated NaCl) obtained at 20 mVs-1 for heterocyclic quinone derivatives.
CompoundEpc-1 (mV)Epc-2 (mV)Epa (mV)
1- 339- 426- 400
2- 365- 435- 417
3- 333- 429- 411
4- 294- 282
5- 359- 245- 431
6- 365- 330
7- 275- 253
8- 267- 245
9- 370- 245- 374
10- 370- 362
11- 384
12- 359(- 640)- 336
Figure 4. Regression plot of log GI50 or log LC50 and the first reduction potential at pH 7.2 of heterocyclic quinone derivatives with their cytotoxic activity.
Molecules 15 06559 g004
Table 3. Electronic properties of heterocyclic quinone derivatives.
Steric energy (kcal/mole)Total energy (eV)LUMO (eV)HOMO (eV)SASA*3log P
1-11.449-114.15-1.470-9.626102.261.750
2-16.057-126.4-1.387-9.523104.581.466
3-16.000-126.4-1.407-9.545104.521.466
4-0.746-103.66-1.809-9.97494.668-0.230
5-13.257-104.02-1.685-9.994100.341.286
6-3.978-100.72-1.914-10.064100.420.113
7-10.420-106.18-1.913-10.14899.581-0.026
8-6.835-109.12-1.774-10.08793.707-0.369
9-17.281-109.49-1.537-10.25899.8961.547
10-19.072-109.49-1.636-10.33999.3621.148
11-5.210-131.74-1.647-8.749118.071.070
12-11.186-137.2-1.631-8.835116.860.931
r*10.3960.2470.7300.2500.4320.789
r*20.5080.3460.7000.2900.4980.820
r*1: Correlation coefficient with log GI50; r*2: Correlation coefficient with log LC50; r*3: Solvent accessible surface area.

3. Experimental

3.1. Instruments, reagents and materials

List analytical instruments used-MS and NMR data are given. 2-Methylnaphtho[2,3-b]furan-4,9-dione (1), 2-methyl-8-hydroxynaphtho[2,3-b]furan-4,9-dione (2), and 2-methyl-5-hydroxynaphtho[2,3-b]furan-4,9-dione (3) were synthesized from 2-acetyl-5-methyl-furan and phthalic anhydride derivatives [25]. Thieno[2,3-b]benzofuran-4,8-dione (4), naphtho[2,3-b]thiophen-4,9-dione (5), benzo[1,2-b:4,5-b’]dithiophene-4,8-dione (6), thieno[2,3-g]isoquinoline-4,9-dione (7), furano[2,3-g]isoquinoline-4,9-dione (8), 5-methyl-4H-thieno[3,2-b]carbazole-4,10(5H)-dione (11), and 6-methyl-5H-pyrido[4,3-b]-carbazole-5,11(6H)-dione (12) were prepared by tandem-directed metalation reaction [26]. Benzo[g]quinoline-5,10-dione (9) was synthesized from 5,8-quinolone and cyclohexadiene derivatives [11]. Benzo[g]isoquinoline-5,10-dione (10) was synthesized from 5,8-isoquinolone and cyclohexadiene derivatives [27].
Furano[2,3-g]isoquinoline-4,9-dione (8). HR-EI-MS m/z: 199.0281 (Calcd. for C11H5NO3, 199.0269); 1H-NMR (300 MHz, CDCl3) δ: 7.05 (1H, d, J = 1.8 Hz, 2-H), 7.87 (1H, d, J = 1.8 Hz, 3-H), 8.03 (1H, d, J = 5.0 Hz, 8-H), 9.10 (1H, d, J = 5.0 Hz, 7-H), 9.43 (1H, s, 5-H).
5-Methyl-4H-thieno[3,2-b]carbazole-4,10(5H)-dione (11). HR-EI-MS m/z: 267.0349 (Calcd. for C15H9NO2S, 267.0353); 1H-NMR (300 MHz, CDCl3) δ: 4.19 (3H, s, CH3), 7.41 (3H, m, 3,6,9-H), 7.55 (2H, m, 7,8-H), 8.34 (1H, d, J = 5.0 Hz, 2-H).

3.2. Cell lines and cell cultures

The panel of human cancer cell lines, described by Yamori et al. [19,20,21,22,23], consists of the following 39 human cancer cell lines: lung cancer, NCI-H23, NCI-H226, NCI-H522, NCI-H460, A549, DMS273, and DMS114; colorectal cancer, HCC-2998, KM-12, HT-29, HCT-15, and HCT-116; gastric cancer, MKN-1, MKN-7, MKN-28, MKN-45, MKN-74, and St-4; ovarian cancer, OVCAR-3, OVCAR-4, OVCAR-5, OVCAR-8, and SK-OV-3; breast cancer, BSY-1, HBC-4, HBC-5, MDA-MB-231, and MCF-7; renal cancer, RXF-631L and ACHN; melanoma, LOX-IMVI; glioma, U251, SF-268, SF-295, SF-539 , SNB-75, and SNB-78; and prostate cancer, DU-145 and PC-3. All cell lines were cultured at 37 ºC under 5% CO2 in RPMI 1640 medium (Nissui Pharmaceutical, Tokyo, Japan) supplemented with 5% fetal bovine serum, penicillin (100 units/mL), and streptomycin (100 μg/mL).
Inhibition experiments were performed to assess the sensitivity of cells to various chemicals as described by Yamori et al. [19]. Growth inhibition was assessed using a sulforhodamine B (SRB) assay to determine the changes in total cellular protein after cancer cells were incubated for 48 h in the presence of test compounds [19,28,29]. Absorbances at 525 nm were measured in control wells (C) and test wells at time 0 (T0) and at the indicated times thereafter (T). Cell growth values were calculated as follows: (i) when T > T0, cell growth (%) = 100 × ([T – T0]/[C – T0]), while (ii) when T < T0, cell growth (%) = 100 × ([T – T0]/T0). GI50 was calculated as 100 × ([T – T0]/[C – T0]) = 50. The LC50, an index of cytotoxic effect, was determined as the concentration of the compound at which 100 × (T – T0)/T0 = –50. The mean graph was produced by computer processing of the GI50 (LC50) values as described [19]. For each chemical, assays were performed using five concentrations (for example, 10-4, 10-5, 10-6, 10-7, and 10-8 M) and a negative control. All assays were performed in duplicate. Mean graphs, which show differential growth inhibition of each drug against the cell line panel, was generated based on calculations using a set of GI50 values [29,30]. To analyze correlations between the means of compounds A and B, we developed a COMPARE computer algorithm as described by Paull et al. [28]. Correlation coefficients were calculated according to the following formula: r = (Σ(xi-xm)(yi-ym))/(Σ(xi-xm)2Σ(yi-ym)2)1/2, in which xi and yi are log GI50 values for compounds A and Bagainst each cell line and xm and ym are the mean values of xi and yi, respectively. We verified the accuracy of measured data by checking the dose response curves of reference control chemicals, such as mitomycin-C, paclitaxel, and SN-38, in every experiment.

3.3. Electrochemical measurements

Cyclic voltammetric measurements were performed on a conventional three-electrode system using a laboratory-constructed microcomputer-controlled system in which the working electrode potential was controlled by a potentiostat (Hokuto Denko, HA-301). Plastic-formed-carbon (PFC) electrodes with a surface area of 0.071 cm2 (BAS, PFCE-3), Ag/AgCl (saturated NaCl) electrodes, and platinum coil electrodes were used as the working, reference, and counter electrodes, respectively. Before recording each voltammogram, the working electrode was pretreated as previously described [13]. Aliquots of 0.05 mM heterocyclic quinone solutions in 3:1 (v/v) 0.1 M phosphate buffer containing 0.1 M KCl (pH 7.2)-ethanol were degassed using purified N2 gas prior to voltammetric measurements. The electrolytic cell was water-jacketed to maintain a constant temperature of 25 ± 0.1 ºC.

3.4. Correlation coefficients

Correlations of the electrochemical and electronic parameters with the cytotoxic activities of heterocyclic quinones were determined using Pearson's correlation coefficient.

4. Conclusions

We have determined the growth inhibitory- and cytotoxic activities of 12 heterocyclic quinone anti-tumor agent candidates against a panel of 39 human cancer cell lines (JFCR39). The first reduction potentials, determined at a physiological pH (7.2), correlated with the cytotoxic activities against JFCR 39 of the heterocyclic quinones. In addition, log P and LUMO energy were also useful parameters to predict the cytotoxic activity. In our previous study, the first reduction potentials also correlated with the inhibitory effects of anthraquinone derivatives on EBV-EA activation; both the number of hydroxy groups and LUMO were useful parameters to predict inhibitory activity [18]. From these results, a reliable prediction of the cytotoxic activity of various quinone derivatives can be made using their reduction potentials without in vitro screening.

Acknowledgements

This study was supported in part by grants from the Ministry of Education, Culture, Sports, Science and Technology of Japan and by the “High-Tech Research Center” Project for Private Universities, a matching fund subsidy from the Ministry of Education, Culture, Sports, Science and Technology, for 2004-2008.
  • Sample Availability: Samples of the compounds 1, 2 and 3 (mix), 5, 6, 9 and 11 are available from the authors.

References and Notes

  1. Asche, C. Antitumour quinones. Mini-Rev. Med. Chem. 2005, 5, 449–467. [Google Scholar] [CrossRef]
  2. Srinivas, G.; Babykutty, S.; Sathiadevan, P.P.; Srinivas, P. Molecular mechanism of emodin action: transition from laxative ingredient to an antitumor agent. Med. Res. Rev. 2007, 27, 591–608. [Google Scholar] [CrossRef]
  3. Foye, M.O. Cancer Chemotherapeutic Agents; American Chemical Society: Washigton, D.C., USA, 1995. [Google Scholar]
  4. Martinez, R.; Chacon-Garcia, L. The search of DNA-intercalators as antitumoral drugs: What it worked and what did not work. Curr. Med. Chem. 2005, 12, 127–151. [Google Scholar] [CrossRef]
  5. Rao, M.M.; Kingston, D.I. Plant anticancer agents. XII. Isolation and structure elucidation of new cytotoxic quinones from Tabebuia cassinoides. J. Nat. Prod. 1982, 45, 600–604. [Google Scholar] [CrossRef]
  6. Giorgi-Renault, S.G.; Renault, J.; Baron, M.; Servolles, P.; Paoletti, C.; Cros, S. Heterocyclic quinones. VI: Synthesis and antitumoral effects of 5,10-benzo[g]quinoxalinediones and aza-analogs. Eur. J. Med. Chem-Chim. Ther. 1985, 20, 144–148. [Google Scholar]
  7. Lee, H.-J.; Kim, J.S.; Park, S.-Y.; Suh, M.-E.; Kim, H.J.; Seo, E.-K.; Lee, C.-O. Synthesis and cytotoxicity evaluation of 6,11-dihydro-pyridazo- and 6,11-dihydro-pyrido[2,3-b]phenazine-6,11-diones. Bioorg. Med. Chem. 2004, 12, 1623–1628. [Google Scholar] [CrossRef]
  8. Pratt, Y.T.; Drake, N.L. Quinolinequinones. V. 6-Chloro- and 7-chloro-5,8-quinolinequinones. J. Am. Chem. Soc. 1960, 82, 1155–1161. [Google Scholar] [CrossRef]
  9. Katoh, A.; Ueda, S.; Ohkanda, J.; Hirota, M.; Komine, H.; Mitsuhashi, K. Isolation of the intermediates and improved synthesis of pyrido[1′,2′:1,2]imidazo[4,5-b]pyrazines and –quinoxalines. Heterocycles 1992, 34, 1965–1972. [Google Scholar] [CrossRef]
  10. Konoshima, T.; Kozuka, M.; Koyama, J.; Okatani, T.; Tagahara, K.; Tokuda, H. Studies on inhibitors of skin tumor promotion, VI. Inhibitory effects of quinones on Epstein-Barr virus activation. J. Nat. Prod. 1989, 52, 987–995. [Google Scholar] [CrossRef]
  11. Koyama, J.; Morita, I.; Tagahara, K.; Osakai, T.; Hotta, H.; Yang, M.X.; Mukainaka, T.; Nishino, H.; Tokuda, H. Correlation with redox potentials and inhibitory effects on Epstein-Barr virus activation of azaanthraquinones. Chem. Pharm. Bull. 2001, 49, 1214–1216. [Google Scholar] [CrossRef]
  12. Kano, K.; Konse, T.; Nishimura, N.; Kubota, T. Electrochemical properties of adriamycin absorbed on a mercury electrode surface. Bull. Chem. Soc. Jpn. 1984, 57, 2383–2390. [Google Scholar] [CrossRef]
  13. Koyama, J.; Tagahara, K.; Osakai, T.; Tsujino, Y.; Tsurumi, S.; Nishino, H.; Tokuda, H. Inhibitory effects on Epstein-Barr virus activation of anthraquinones: correlation with redox potentials. Cancer Lett. 1997, 115, 179–183. [Google Scholar] [CrossRef]
  14. Koyama, J.; Morita, I.; Kobayashi, N.; Osakai, T.; Hotta, H.; Takayasu, J.; Nishino, H.; Tokuda, H. Correlation of redox potentials and inhibitory effects on Epstein-Barr virus activation of naphthoquinones. Cancer Lett. 2003, 201, 25–30. [Google Scholar] [CrossRef]
  15. Koyama, J.; Morita, I.; Kobayashi, N.; Osakai, T.; Hotta, H.; Takayasu, J.; Nishino, H.; Tokuda, H. Correlation of redox potentials and inhibitory effects on Epstein-Barr virus activation of 2-azaanthraquinones. Cancer Lett. 2004, 212, 1–6. [Google Scholar] [CrossRef]
  16. Koyama, J.; Morita, I.; Kobayashi, N.; Osakai, T.; Nishino, H.; Tokuda, H. Correlation between reduction potentials and inhibitory effects on Epstein-Barr virus activation of poly-substituted anthraquinones. Cancer Lett. 2005, 225, 193–198. [Google Scholar] [CrossRef]
  17. Koyama, J.; Inoue, M.; Morita, I.; Kobayashi, N.; Osakai, T.; Nishino, H.; Tokuda, H. Correlation between reduction potentials and inhibitory effects on Epstein-Barr virus activation by emodin derivatives. Cancer Lett. 2006, 241, 263–267. [Google Scholar] [CrossRef]
  18. Koyama, J.; Nishino, Y.; Morita, I.; Kobayashi, N.; Osakai, T.; Tokuda, H. Correlation between reduction potentials and inhibitions of Epstein-Barr virus activation by anthraquinone derivatives. Bioorg. Med. Chem. Lett. 2008, 18, 4106–4109. [Google Scholar] [CrossRef]
  19. Yamori, T.; Matsunaga, A.; Sato, S.; Yamazaki, K.; Komi, A.; Ishizu, K.; Mita, I.; Edatsugi, H.; Matsuba, Y.; Takezawa, K.; Nakanishi, O.; Kohno, H.; Nakajima, Y.; Komatsu, H.; Andoh, T.; Tsuruo, T. Quinolinequinones. V. 6-Chloro- and 7-chloro-5,8-quinolinequinones. Cancer Res. 1999, 59, 4042–4049. [Google Scholar]
  20. Dan, S.; Tsunoda, T.; Kitahara, O.; Yanagawa, R.; Zembutsu, H.; Katagiri, T.; Yamazaki, K.; Nakamura, Y.; Yamori, T. An integrated database of chemosensitivity to 55 anticancer drugs and gene expression profiles of 39 human cancer cell lines. Cancer Res. 2002, 62, 1139–1147. [Google Scholar]
  21. Yaguchi, S.; Fukui, Y.; Koshimizu, I.; Yoshimi, H.; Matsuno, T.; Gouda, H.; Hirono, S.; Yamazaki, K.; Yamori, T. Antitumor activity of ZSTK474, a new phosphatidylinositol 3-kinase inhibitor. J. Natl. Cancer Inst. 2006, 98, 545–556. [Google Scholar] [CrossRef]
  22. Nakatsu, N.; Nakamura, T.; Yamazaki, K.; Sadahiro, S.; Makuuchi, H.; Kanno, J.; Yamori, T. Evaluation of action mechanisms of toxic chemicals using JFCR39, a panel of human cancer cell lines. Mol. Pharmacol. 2007, 72, 1171–1180. [Google Scholar] [CrossRef]
  23. Kong, D.; Dan, S.; Yamazaki, K.; Yamori, T. Inhibition profiles of phosphatidylinositol 3-kinase inhibitors against PI3K superfamily and human cancer cell line panel JFCR39. Eur. J. Cancer 2010, 46, 1111–1121. [Google Scholar] [CrossRef]
  24. Stewart, J.J.P. Optimization of parameters for semiempirical methods. I. Method. J. Comput. Chem. 1989, 10, 209–220. [Google Scholar] [CrossRef]
  25. Hirai, K.; Koyama, J.; Pan, J.; Simamura, E.; Shimada, H.; Yamori, T.; Sato, S.; Tagahara, K.; Tsuruo, T. Furanonaphthoquinone analogs possessing preferential in antitumor activity compared to normal cells. Cancer Detection Prev. 1999, 23, 539–550. [Google Scholar] [CrossRef]
  26. Watanabe, M.; Snieckus, V. Tandem directed metalation reactions. Short syntheses of polycyclic aromatic hydrocarbons and ellipticine alkaloids. J. Am. Chem. Soc. 1980, 102, 1457–1460. [Google Scholar] [CrossRef]
  27. Koyama, J.; Morita, I.; Kobayashi, N.; Osakai, T.; Usuki, Y.; Taniguchi, M. Structure-activity relations of azafluorenone and azaanthraquinone as antimicrobial compounds. Bioorg. Med. Chem Lett. 2005, 15, 1079–1082. [Google Scholar] [CrossRef]
  28. Paull, K.D.; Shoemaker, R.H.; Hodes, L.; Monks, A.; Scudiero, D.A.; Rubinstein, L.; Plowman, J.; Boyd, M.R. Display and analysis of patterns of differential activity of drugs against human tumor cell lines: development of mean graph and COMPARE algorithm. J. Natl. Cancer Inst. 1989, 81, 1088–1092. [Google Scholar] [CrossRef]
  29. Monks, A.; Scudiero, D.A.; Skehan, P.; Shoemaker, R.H.; Paull, K.D.; Vistica, D.; Hose, C.; Langley, J.; Cronise, P.; Vaigo-Wolff, A.; Gary-Goodrichi, M.; Campbell, H.; Mayo, J.; Boyd, M.R. Feasibility of a high-flux anticancer drug screen using a diverse panel of cultured human tumor cell lines. J. Nat. Cancer Inst. 1991, 83, 757–766. [Google Scholar] [CrossRef]
  30. Yamori, T.; Sato, S.; Chikazawa, H.; Kadota, T. Anti-tumor efficacy of paclitaxel against human lung cancer xenografts. Jpn. J. Cancer Res. 1997, 88, 1205–1210. [Google Scholar] [CrossRef]

