Antioxidant Capacities and Total Phenolic Contents of 56 Wild Fruits from South China


Abstract
:1. Introduction
2. Results and Discussion
2.1. Antioxidant capacities of the 56 wild fruits

| No. | Scientific Name of Plant | Sampling Location | FRAP values (μmol Fe(II)/g) | ||
|---|---|---|---|---|---|
| Water-soluble fraction | Fat-soluble fraction | Total | |||
| 1 | Mallotus apelta | Guangdong | 6.15 ± 0.36 | 16.2 ± 1.63 | 22.4 ± 1.99 |
| 2 | Smilax china | Guangdong | 35.0 ± 2.69 | 84.8 ± 5.86 | 120 ± 8.55 |
| 3 | Gardenia jasminoides | Guangdong | 8.25 ± 0.11 | 4.42 ± 0.13 | 12.7 ± 0.24 |
| 4 | Helicteres angustifolia | Guangdong | 12.2 ± 0.24 | 2.15 ± 0.14 | 14.4 ± 0.38 |
| 5 | Eucalyptus robusta | Guangdong | 125 ± 2.49 | 377 ± 3.92 | 502 ± 6.41 |
| 6 | Ficus benjamina | Guangdong | 6.34 ± 0.38 | 1.92 ± 0.13 | 8.26 ± 0.51 |
| 7 | Ilex rotunda | Guangdong | 35.9 ± 2.63 | 19.9 ± 1.26 | 55.8 ± 3.89 |
| 8 | Allamanda schottii | Guangdong | 12.0 ± 1.02 | 38.4 ± 0.90 | 50.4 ± 1.92 |
| 9 | Areca triandra | Guangdong | 0.67 ± 0.04 | 0.61 ± 0.04 | 1.28 ± 0.08 |
| 10 | Alpinia zerumbet | Guangdong | 8.87 ± 0.51 | 6.11 ± 0.34 | 15.0 ± 0.85 |
| 11 | Schefflera heptaphylla | Guangdong | 6.30 ± 0.14 | 10.6 ± 0.48 | 16.9 ± 0.62 |
| 12 | Ficus hispida | Guangdong | 4.93 ± 0.17 | 1.33 ± 0.11 | 6.26 ± 0.28 |
| 13 | Melaleuca leucadendron | Guangdong | 68.1 ± 3.48 | 146 ± 5.38 | 214 ± 8.86 |
| 14 | Lagerstroemia speciosa | Guangdong | 42.2 ± 1.79 | 182 ± 7.89 | 225 ± 9.68 |
| 15 | Acronychia pedunculata | Guangdong | 4.31 ± 0.26 | 10.5 ± 0.29 | 14.8 ± 0.55 |
| 16 | Litsea rotundifolia | Guangdong | 17.6 ± 0.80 | 9.99 ± 0.48 | 27.6 ± 1.28 |
| 17 | Lantana camara | Guangdong | 4.31 ± 0.19 | 1.81 ± 0.03 | 6.12 ± 0.22 |
| 18 | Dianella ensifolia | Guangdong | 2.66 ± 0.10 | 3.02 ± 0.18 | 5.68 ± 0.28 |
| 19 | Microcos paniculata | Guangdong | 18.8 ± 0.35 | 9.71 ± 0.08 | 28.5 ± 0.43 |
| 20 | Melastoma candidum | Guangdong | 95.2 ± 5.89 | 45.6 ± 2.88 | 141 ± 8.77 |
| 21 | Diplospora dubia | Guangdong | 47.0 ± 2.41 | 117 ± 6.56 | 164 ± 8.97 |
| 22 | Dolichandrone caudafelina | Guangdong | 41.1 ± 2.39 | 5.64 ± 0.13 | 46.7 ± 2.52 |
| 23 | Asparagus cochinchinensis | Hong Kong | 1.71 ± 0.06 | 2.02 ± 0.01 | 3.73 ± 0.07 |
| 24 | Psychotria asiatica | Hong Kong | 41.3 ± 0.11 | 8.65 ± 0.68 | 49.9 ± 0.79 |
| 25 | Lagerstroemia indica | Hong Kong | 52.8 ± 2.32 | 98.3 ± 0.32 | 151 ± 2.64 |
| 26 | Nandina domestica | Hong Kong | 51.1 ± 3.38 | 59.0 ± 0.63 | 110 ± 4.01 |
| 27 | Alpinia hainanensis | Hong Kong | 5.67 ± 0.31 | 7.66 ± 0.21 | 13.3 ± 0.52 |
| 28 | Gordonia axillaris | Hong Kong | 74.4 ± 3.25 | 106 ± 7.90 | 180 ± 11.2 |
| 29 | Rhodomyrtus tomentosa | Hong Kong | 45.3 ± 2.77 | 35.4 ± 1.16 | 80.7 ± 3.93 |
| 30 | Breynia fruticosa | Hong Kong | 8.76 ± 0.68 | 5.50 ± 0.31 | 14.3 ± 0.99 |
| 31 | Eurya chinensis | Hong Kong | 40.8 ± 2.52 | 21.6 ± 0.27 | 62.4 ± 2.79 |
| 32 | Duranta erecta | Hong Kong | 5.49 ± 0.40 | 9.20 ± 0.05 | 14.7 ± 0.45 |
| 33 | Melastoma sanguineum | Hong Kong | 143 ± 2.00 | 145 ± 8.44 | 288 ± 10.4 |
| 34 | Eurya nitida | Hong Kong | 83.3 ± 2.63 | 345 ± 9.39 | 428 ± 12.0 |
| 35 | Pyracantha fortuneana | Hong Kong | 18.1 ± 0.14 | 6.09 ± 0.09 | 24.2 ± 0.23 |
| 36 | Caryota mitis | Hong Kong | 35.6 ± 1.50 | 138 ± 2.50 | 174 ± 4.00 |
| 37 | Viburnum fordiae | Jiangxi | 75.7 ± 2.06 | 70.0 ± 1.16 | 146 ± 3.22 |
| 38 | Xanthium sibiricum | Jiangxi | 1.47 ± 0.11 | 1.70 ± 0.01 | 3.17 ± 0.12 |
| 39 | Celtis sinesis | Jiangxi | 3.17 ± 0.30 | 1.67 ± 0.08 | 4.84 ± 0.38 |
| 40 | Solanum torvum | Jiangxi | 3.46 ± 0.22 | 1.78 ± 0.05 | 5.24 ± 0.27 |
| 41 | Melia azedarach | Jiangxi | 8.30 ± 0.39 | 7.07 ± 0.50 | 15.4 ± 0.89 |
| 42 | Symplocos paniculata | Jiangxi | 6.51 ± 0.19 | 5.01 ± 0.07 | 11.5 ± 0.26 |
| 43 | Solanum americanum | Jiangxi | 1.32 ± 0.06 | 2.21 ± 0.11 | 3.53 ± 0.17 |
| 44 | Ardisia crenata | Jiangxi | 13.7 ± 0.60 | 20.1 ± 0.90 | 33.9 ± 1.50 |
| 45 | Cinnamomum camphora | Jiangxi | 10.2 ± 0.59 | 10.1 ± 0.80 | 20.3 ± 1.39 |
| 46 | Lagerstroemia indica | Jiangxi | 118 ± 1.49 | 137 ± 4.26 | 254 ± 5.75 |
| 47 | Parthenocissus dalzielii | Jiangxi | 20.3 ± 1.32 | 66.5 ± 3.53 | 86.8 ± 4.85 |
| 48 | Loropetalum chinense | Jiangxi | 22.0 ± 0.32 | 33.2 ± 2.12 | 55.2 ± 2.44 |
| 49 | Rosa laevigata | Jiangxi | 86.9 ± 2.18 | 58.2 ± 1.13 | 145 ± 3.31 |
| 50 | Viburnum sempervirens | Jiangxi | 35.0 ± 1.01 | 73.4 ± 4.01 | 108 ± 5.02 |
| 51 | Diospyros kaki | Jiangxi | 1.88 ± 0.13 | 1.63 ± 0.09 | 3.51 ± 0.22 |
| 52 | Vernici afordii | Jiangxi | 30.6 ± 1.39 | 51.7 ± 2.10 | 82.3 ± 3.49 |
| 53 | Swida austrosinensis | Jiangxi | 22.0 ± 0.62 | 35.2 ± 0.54 | 57.2 ± 1.16 |
| 54 | Hibiscus sabdariffa | Jiangxi | 8.68 ± 0.26 | 7.20 ± 0.29 | 15.9 ± 0.55 |
| 55 | Rhus chinensis | Jiangxi | 21.3 ± 0.30 | 38.5 ± 0.18 | 59.8 ± 0.48 |
| 56 | Aralia armata | Jiangxi | 1.94 ± 0.04 | 1.90 ± 0.09 | 3.84 ± 0.13 |
| No. | Scientific Name of Plant | TEAC values (μmol Trolox/g) | ||
|---|---|---|---|---|
| Water-soluble fraction | Fat-soluble fraction | Total | ||
| 1 | Mallotus apelta | 4.06 ± 0.13 | 22.1 ± 0.82 | 26.2 ± 0.95 |
| 2 | Smilax china | 24.4 ± 1.46 | 98.2 ± 4.73 | 123 ± 6.19 |
| 3 | Gardenia jasminoides | 2.26 ± 0.04 | 3.80 ± 0.08 | 6.06 ± 0.12 |
| 4 | Helicteres angustifolia | 5.99 ± 0.29 | 4.61 ± 0.23 | 10.6 ± 0.52 |
| 5 | Eucalyptus robusta | 184 ± 2.14 | 957 ± 5.79 | 1140 ± 7.93 |
| 6 | Ficus benjamina | 3.12 ± 0.10 | 5.78 ± 0.34 | 8.90 ± 0.44 |
| 7 | Ilex rotunda | 19.7 ± 0.13 | 18.8 ± 0.32 | 38.5 ± 0.45 |
| 8 | Allamanda schottii | 6.75 ± 0.21 | 30.0 ± 1.73 | 36.7 ± 1.94 |
| 9 | Areca triandra | 0.46 ± 0.02 | 6.05 ± 0.39 | 6.51 ± 0.41 |
| 10 | Alpinia zerumbet | 6.09 ± 0.28 | 14.7 ± 0.62 | 20.8 ± 0.90 |
| 11 | Schefflera heptaphylla | 2.02 ± 0.14 | 4.25 ± 0.11 | 6.27 ± 0.25 |
| 12 | Ficus hispida | 2.35 ± 0.18 | 2.83 ± 0.06 | 5.18 ± 0.24 |
| 13 | Melaleuca leucadendron | 138 ± 4.71 | 323 ± 2.17 | 461 ± 6.88 |
| 14 | Lagerstroemia speciosa | 58.0 ± 0.59 | 264 ± 16.8 | 322 ± 17.4 |
| 15 | Acronychia pedunculata | 2.73 ± 0.08 | 19.2 ± 0.05 | 21.9 ± 0.13 |
| 16 | Litsea rotundifolia | 11.5 ± 0.56 | 16.8 ± 0.65 | 28.3 ± 1.21 |
| 17 | Lantana camara | 1.75 ± 0.09 | 3.68 ± 0.17 | 5.43 ± 0.26 |
| 18 | Dianella ensifolia | 0.62 ± 0.03 | 3.70 ± 0.04 | 4.32 ± 0.07 |
| 19 | Microcos paniculata | 9.61 ± 0.16 | 15.2 ± 0.05 | 24.8 ± 0.21 |
| 20 | Melastoma candidum | 93.8 ± 4.47 | 88.6 ± 1.00 | 182 ± 5.47 |
| 21 | Diplospora dubia | 66.4 ± 0.26 | 91.0 ± 0.80 | 157 ± 1.06 |
| 22 | Dolichandrone caudafelina | 17.3 ± 0.56 | 17.6 ± 0.02 | 34.9 ± 0.58 |
| 23 | Asparagus cochinchinensis | 0.37 ± 0.01 | 3.68 ± 0.19 | 4.05 ± 0.20 |
| 24 | Psychotria asiatica | 36.1 ± 1.58 | 33.6 ± 1.36 | 69.7 ± 2.94 |
| 25 | Lagerstroemia indica | 73.2 ± 0.81 | 119 ± 1.12 | 192 ± 1.93 |
| 26 | Nandina domestica | 20.7 ± 0.24 | 57.3 ± 0.54 | 78.0 ± 0.78 |
| 27 | Alpinia hainanensis | 3.73 ± 0.15 | 26.8 ± 1.63 | 30.5 ± 1.78 |
| 28 | Gordonia axillaris | 79.4 ± 0.40 | 265 ± 11.7 | 344 ± 12.1 |
| 29 | Rhodomyrtus tomentosa | 29.7 ± 0.94 | 48.7 ± 1.93 | 78.4 ± 2.87 |
| 30 | Breynia fruticosa | 4.83 ± 0.12 | 11.0 ± 0.42 | 15.8 ± 0.54 |
| 31 | Eurya chinensis | 33.5 ± 0.23 | 40.7 ± 0.78 | 74.2 ± 1.01 |
| 32 | Duranta erecta | 1.76 ± 0.08 | 19.0 ± 0.88 | 20.8 ± 0.96 |
| 33 | Melastoma sanguineum | 130 ± 8.77 | 275 ± 12.7 | 404 ± 21.5 |
| 34 | Eurya nitida | 56.0 ± 2.52 | 422 ± 11.6 | 478 ± 14.1 |
| 35 | Pyracantha fortuneana | 7.40 ± 0.25 | 18.1 ± 0.88 | 25.5 ± 1.13 |
| 36 | Caryota mitis | 27.3 ± 0.35 | 361 ± 10.4 | 389 ± 10.8 |
| 37 | Viburnum fordiae | 88.0 ± 2.32 | 54.8 ± 3.90 | 143 ± 6.22 |
| 38 | Xanthium sibiricum | 12.0 ± 0.01 | 11.4 ± 0.14 | 23.3 ± 0.15 |
| 39 | Celtis sinesis | 11.3 ± 0.08 | 12.3 ± 0.11 | 23.6 ± 0.19 |
| 40 | Solanum torvum | 11.3 ± 0.05 | 10.6 ± 0.16 | 22.0 ± 0.21 |
| 41 | Melia azedarach | 10.5 ± 0.10 | 7.03 ± 0.25 | 17.5 ± 0.35 |
| 42 | Symplocos paniculata | 10.4 ± 0.10 | 14.0 ± 0.52 | 24.4 ± 0.62 |
| 43 | Solanum americanum | 12.2 ± 0.03 | 10.9 ± 0.15 | 23.1 ± 0.18 |
| 44 | Ardisia crenata | 5.91 ± 0.15 | 39.2 ± 2.06 | 45.1 ± 2.21 |
| 45 | Cinnamomum camphora | 9.65 ± 0.11 | 8.14 ± 0.09 | 17.8 ± 0.20 |
| 46 | Lagerstroemia indica | 64.1 ± 3.26 | 45.0 ± 1.87 | 109 ± 5.13 |
| 47 | Parthenocissus dalzielii | 19.6 ± 1.76 | 88.6 ± 3.08 | 108 ± 4.84 |
| 48 | Loropetalum chinense | 16.5 ± 1.40 | 46.1 ± 0.56 | 62.6 ± 1.96 |
| 49 | Rosa laevigata | 67.7 ± 0.32 | 78.4 ± 4.51 | 146 ± 4.83 |
| 50 | Viburnum sempervirens | 17.8 ± 0.58 | 96.4 ± 1.56 | 114 ± 2.14 |
| 51 | Diospyros kaki | 0.77 ± 0.03 | 2.95 ± 0.17 | 3.72 ± 0.20 |
| 52 | Vernici afordii | 18.2 ± 0.43 | 92.4 ± 3.67 | 111 ± 4.10 |
| 53 | Swida austrosinensis | 14.5 ± 0.20 | 40.0 ± 2.72 | 54.5 ± 2.92 |
| 54 | Hibiscus sabdariffa | 4.34 ± 0.16 | 9.50 ± 0.23 | 13.8 ± 0.39 |
| 55 | Rhus chinensis | 29.0 ± 1.60 | 86.4 ± 5.28 | 115 ± 6.88 |
| 56 | Aralia armata | 0.91 ± 0.03 | 2.47 ± 0.12 | 3.38 ± 0.15 |

| Parameter | Water-soluble fraction | Fat-soluble fraction | Total |
|---|---|---|---|
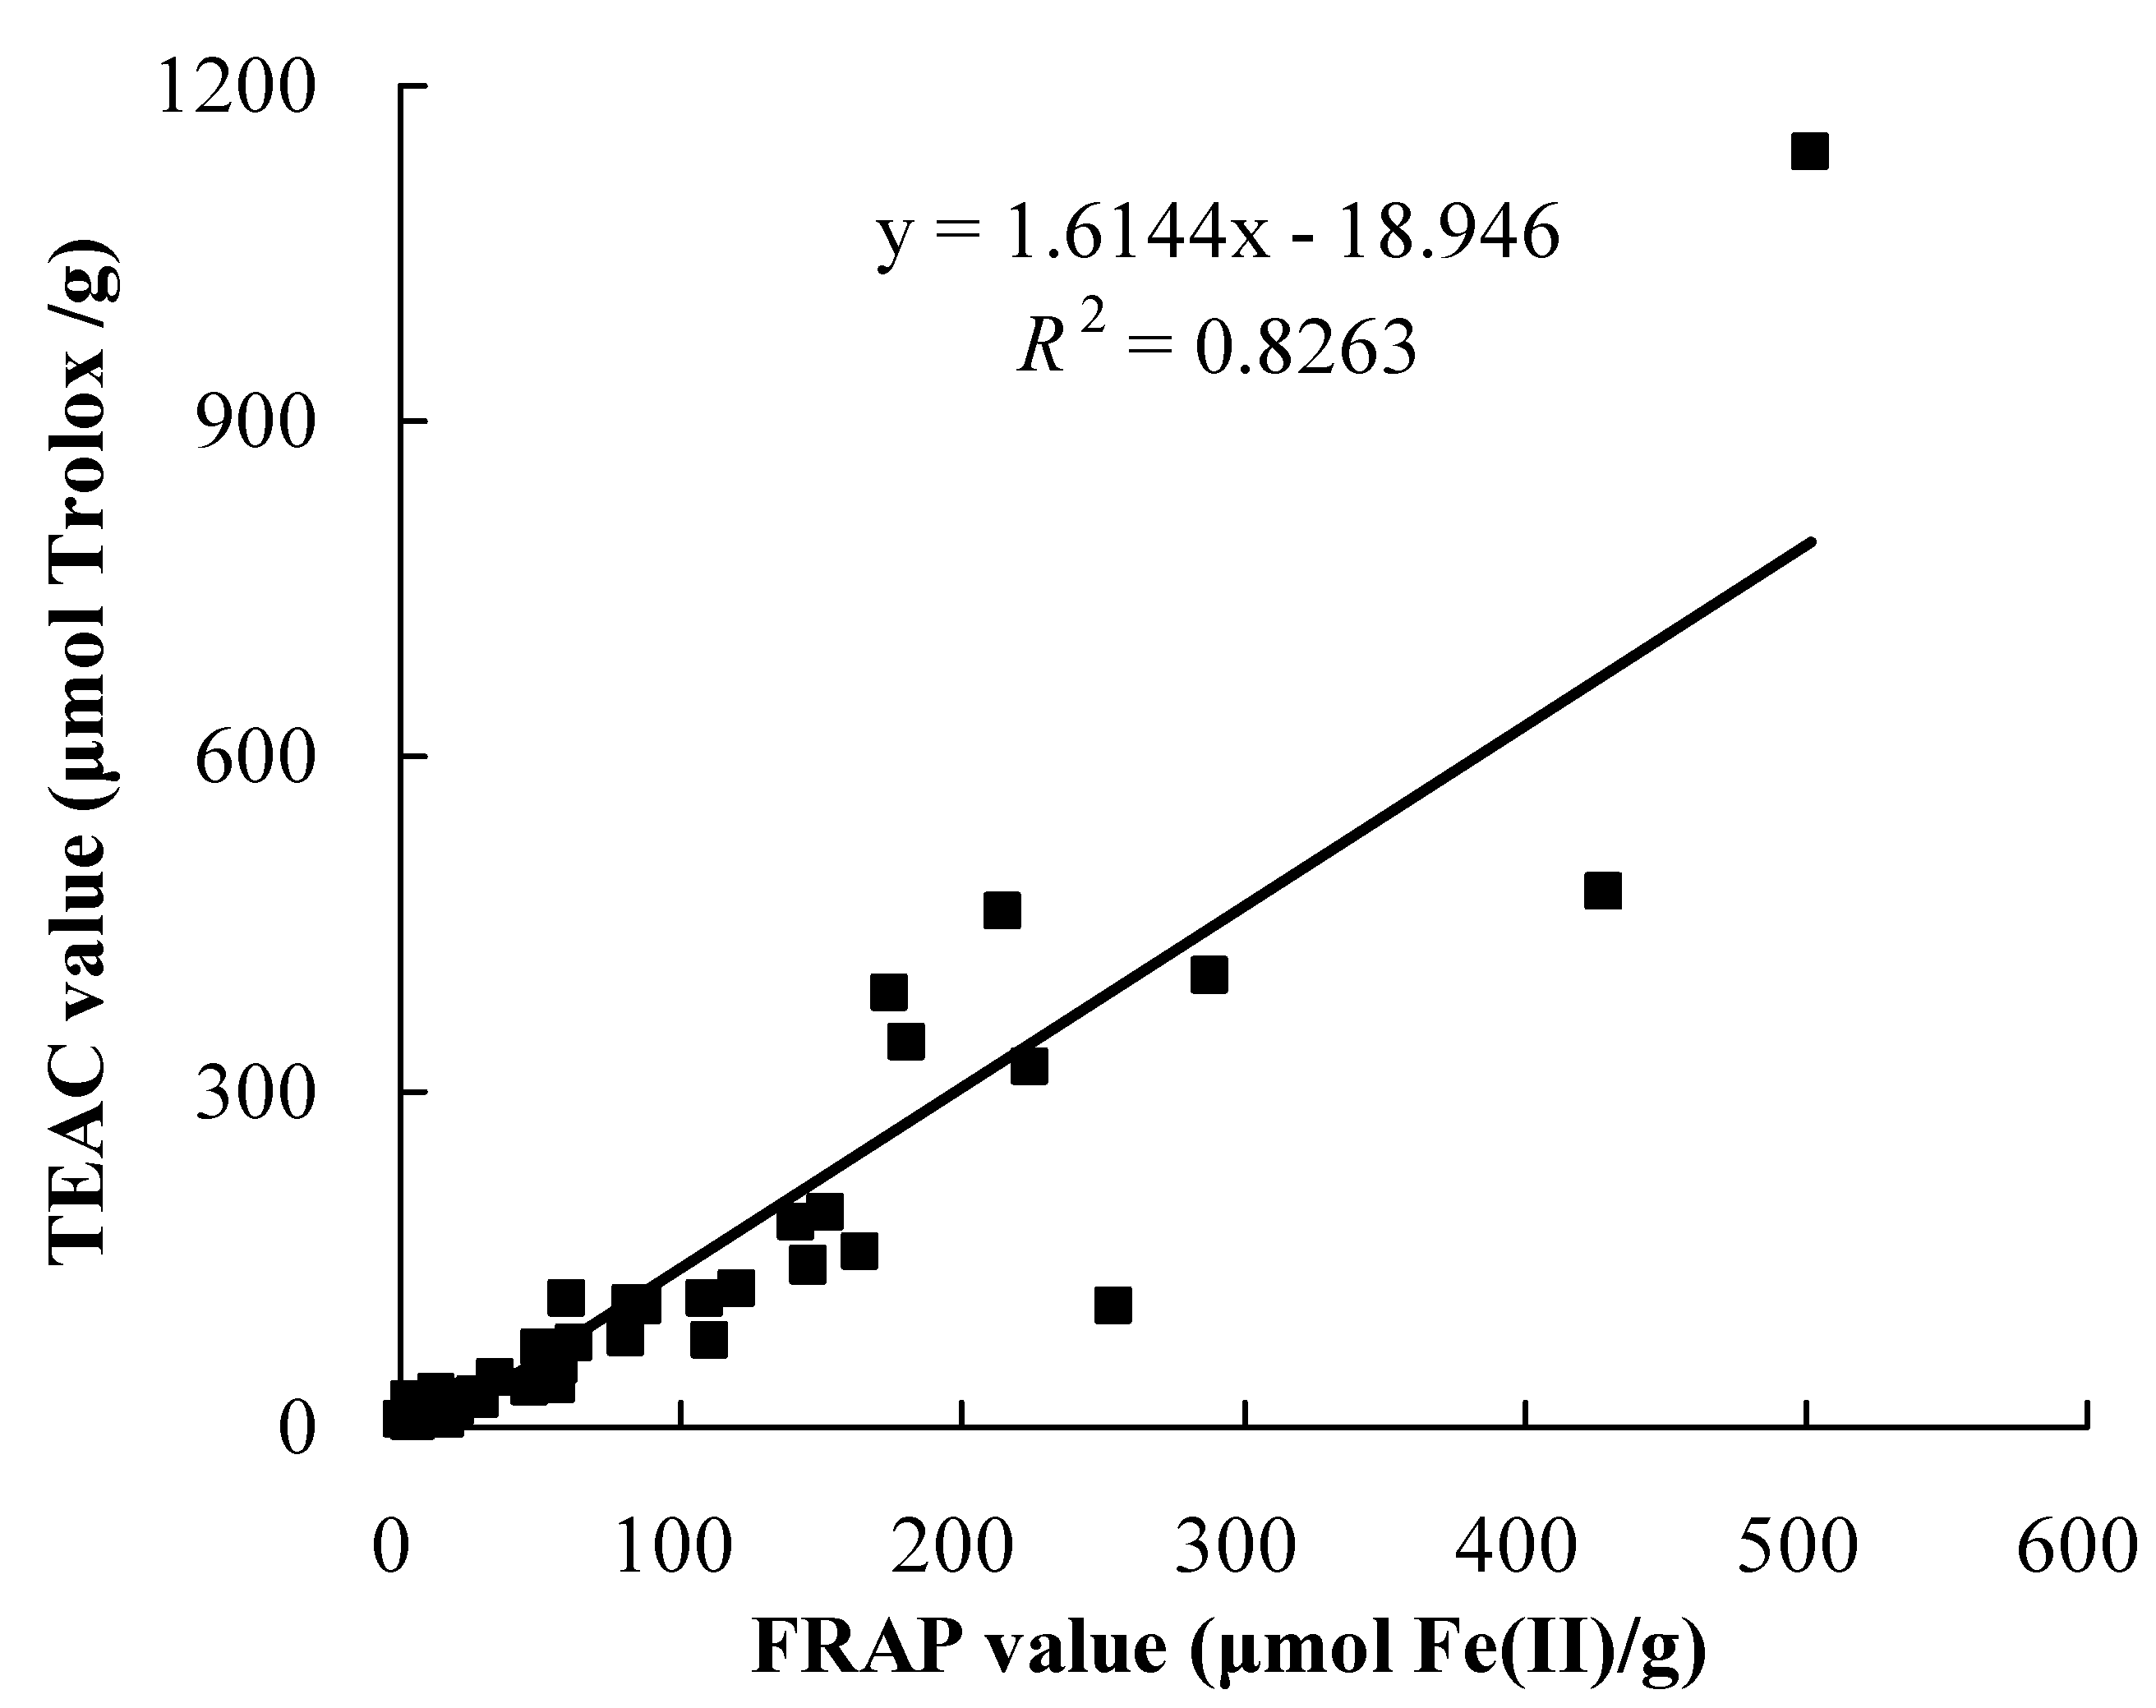
| TEAC value vs | Y = 1.0038X − 2.1363 | Y = 1.8305X − 8.6945 | Y = 1.6144X − 18.946 |
| FRAP value | R2 = 0.7895 | R2 = 0.8334 | R2 = 0.8263 |
| FRAP value vs | Y= 10.063X + 0.9349 | Y = 9.6777X − 12.752 | Y = 9.6354X − 10.3 |
| Total phenolic content | R2 = 0.7956 | R2 = 0.9051 | R2 = 0.8916 |
| TEAC value vs | Y = 11.978X − 6.6924 | Y = 18.997X − 40.128 | Y = 16.995X − 48.868 |
| Total phenolic content | R2 = 0.8834 | R2 = 0.8675 | R2 = 0.8793 |
2.2. Total phenolic content of 56 wild fruits
| No. | Scientific Name of Plant | Total phenolic contents (mg GAE/g) | ||
|---|---|---|---|---|
| Water-soluble fraction | Fat-soluble fraction | Total | ||
| 1 | Mallotus apelta | 1.74 ± 0.10 | 6.11 ± 0.18 | 7.85 ± 0.28 |
| 2 | Smilax china | 4.80 ± 0.22 | 11.0 ± 0.56 | 15.8 ± 0.78 |
| 3 | Gardenia jasminoides | 0.72 ± 0.01 | 1.16 ± 0.06 | 1.88 ± 0.07 |
| 4 | Helicteres angustifolia | 1.07 ± 0.04 | 1.05 ± 0.06 | 2.12 ± 0.10 |
| 5 | Eucalyptus robusta | 14.1 ± 0.56 | 40.7 ± 2.49 | 54.8 ± 3.05 |
| 6 | Ficus benjamina | 0.68 ± 0.02 | 0.95 ± 0.05 | 1.63 ± 0.07 |
| 7 | Ilex rotunda | 2.96 ± 0.06 | 3.36 ± 0.28 | 6.32 ± 0.34 |
| 8 | Allamanda schottii | 1.31 ± 0.04 | 7.37 ± 0.44 | 8.68 ± 0.48 |
| 9 | Areca triandra | 0.06 ± 0.01 | 0.43 ± 0.03 | 0.49 ± 0.04 |
| 10 | Alpinia zerumbet | 1.29 ± 0.10 | 2.91 ± 0.21 | 4.20 ± 0.31 |
| 11 | Schefflera heptaphylla | 0.54 ± 0.03 | 1.31 ± 0.06 | 1.85 ± 0.09 |
| 12 | Ficus hispida | 0.51 ± 0.02 | 0.75 ± 0.02 | 1.26 ± 0.04 |
| 13 | Melaleuca leucadendron | 9.28 ± 0.37 | 16.4 ± 1.22 | 25.6 ± 1.59 |
| 14 | Lagerstroemia speciosa | 5.22 ± 0.03 | 14.9 ± 0.32 | 20.1 ± 0.35 |
| 15 | Acronychia pedunculata | 0.46 ± 0.01 | 3.13 ± 0.04 | 3.59 ± 0.05 |
| 16 | Litsea rotundifolia | 2.06 ± 0.12 | 3.79 ± 0.30 | 5.85 ± 0.42 |
| 17 | Lantana camara | 0.62 ± 0.02 | 0.92 ± 0.01 | 1.54 ± 0.03 |
| 18 | Dianella ensifolia | 0.26 ± 0.02 | 1.15 ± 0.02 | 1.41 ± 0.04 |
| 19 | Microcos paniculata | 2.68 ± 0.06 | 3.60 ± 0.13 | 6.28 ± 0.19 |
| 20 | Melastoma candidum | 8.56 ± 0.30 | 7.61 ± 0.68 | 16.2 ± 0.98 |
| 21 | Diplospora dubia | 7.49 ± 0.42 | 10.9 ± 0.12 | 18.4 ± 0.54 |
| 22 | Dolichandrone caudafelina | 3.15 ± 0.20 | 2.48 ± 0.02 | 5.63 ± 0.22 |
| 23 | Asparagus cochinchinensis | 0.29 ± 0.01 | 0.61 ± 0.03 | 0.90 ± 0.04 |
| 24 | Psychotria asiatica | 3.55 ± 0.24 | 3.73 ± 0.15 | 7.28 ± 0.39 |
| 25 | Lagerstroemia indica | 5.42 ± 0.17 | 12.0 ± 0.07 | 17.4 ± 0.24 |
| 26 | Nandina domestica | 4.25 ± 0.20 | 7.72 ± 0.39 | 12.0 ± 0.59 |
| 27 | Alpinia hainanensis | 0.78 ± 0.02 | 2.00 ± 0.09 | 2.78 ± 0.11 |
| 28 | Gordonia axillaris | 7.88 ± 0.44 | 16.7 ± 0.64 | 24.6 ± 1.08 |
| 29 | Rhodomyrtus tomentosa | 2.71 ± 0.07 | 4.07 ± 0.13 | 6.78 ± 0.20 |
| 30 | Breynia fruticosa | 1.22 ± 0.04 | 1.83 ± 0.07 | 3.05 ± 0.11 |
| 31 | Eurya chinensis | 3.42 ± 0.05 | 3.85 ± 0.06 | 7.27 ± 0.11 |
| 32 | Duranta erecta | 0.43 ± 0.02 | 1.80 ± 0.02 | 2.23 ± 0.04 |
| 33 | Melastoma sanguineum | 9.68 ± 0.10 | 13.6 ± 0.39 | 23.3 ± 0.49 |
| 34 | Eurya nitida | 6.27 ± 0.36 | 28.8 ± 0.60 | 35.0 ± 0.96 |
| 35 | Pyracantha fortuneana | 1.31 ± 0.04 | 2.03 ± 0.07 | 3.34 ± 0.11 |
| 36 | Caryota mitis | 3.87 ± 0.14 | 17.5 ± 0.71 | 21.4 ± 0.85 |
| 37 | Viburnum fordiae | 5.60 ± 0.44 | 10.6 ± 0.20 | 16.2 ± 0.64 |
| 38 | Xanthium sibiricum | 0.20 ± 0.01 | 0.45 ± 0.02 | 0.65 ± 0.03 |
| 39 | Celtis sinesis | 0.42 ± 0.02 | 0.65 ± 0.03 | 1.07 ± 0.05 |
| 40 | Solanum torvum | 0.48 ± 0.01 | 0.49 ± 0.04 | 0.97 ± 0.05 |
| 41 | Melia azedarach | 0.76 ± 0.03 | 1.44 ± 0.05 | 2.20 ± 0.08 |
| 42 | Symplocos paniculata | 0.57 ± 0.03 | 1.38 ± 0.01 | 1.95 ± 0.04 |
| 43 | Solanum americanum | 0.16 ± 0.01 | 0.47 ± 0.01 | 0.63 ± 0.02 |
| 44 | Ardisia crenata | 0.85 ± 0.03 | 2.57 ± 0.13 | 3.42 ± 0.16 |
| 45 | Cinnamomum camphora | 0.92 ± 0.04 | 2.28 ± 0.09 | 3.20 ± 0.13 |
| 46 | Lagerstroemia indica | 4.08 ± 0.02 | 8.01 ± 0.28 | 12.1 ± 0.30 |
| 47 | Parthenocissus dalzielii | 3.93 ± 0.27 | 11.8 ± 0.63 | 15.8 ± 0.90 |
| 48 | Loropetalum chinense | 2.43 ± 0.12 | 5.08 ± 0.31 | 7.51 ± 0.43 |
| 49 | Rosa laevigata | 7.45 ± 0.28 | 7.34 ± 0.21 | 14.8 ± 0.49 |
| 50 | Viburnum sempervirens | 4.62 ± 0.28 | 13.9 ± 0.12 | 18.5 ± 0.40 |
| 51 | Diospyros kaki | 0.15 ± 0.01 | 0.38 ± 0.02 | 0.53 ± 0.03 |
| 52 | Vernici afordii | 2.98 ± 0.15 | 9.24 ± 0.04 | 12.2 ± 0.19 |
| 53 | Swida austrosinensis | 2.09 ± 0.16 | 4.81 ± 0.24 | 6.90 ± 0.40 |
| 54 | Hibiscus sabdariffa | 0.60 ± 0.01 | 1.45 ± 0.05 | 2.05 ± 0.06 |
| 55 | Rhus chinensis | 4.74 ± 0.42 | 12.4 ± 1.07 | 17.2 ± 1.49 |
| 56 | Aralia armata | 0.24 ± 0.01 | 0.71 ± 0.01 | 0.95 ± 0.02 |
2.3. Correlation between antioxidant capacities and total phenolic content

3. Experimental
3.1. Chemicals and wild fruits
3.2. Sample preparation
3.3. Ferric-reducing antioxidant power (FRAP) assay
3.4. Trolox equivalent antioxidant capacity (TEAC) assay
3.5. Determination of total phenolic content
3.6. Statistical analysis
4. Conclusions
Acknowledgements
- Samples Availability: The wild fruit samples are available from the authors.
References and Notes
- Aruoma, O.I. Free radicals, oxidative stress, and antioxidants in human health and disease. J. Am. Oil Chem. Soc. 1998, 75, 199–212. [Google Scholar] [CrossRef]
- Hu, F.B. Plant-based foods and prevention of cardiovascular disease: An overview. Am. J. Clin. Nutr. 2003, 78, 544–551. [Google Scholar]
- Riboli, E.; Norat, T. Epidemiologic evidence of the protective effect of fruit and vegetables on cancer risk. Am. J. Clin. Nutr. 2003, 78, 559–569. [Google Scholar]
- Botterweck, A.A.M.; Verhagen, H.; Goldbohm, R.A.; Kleinjans, J.; Van den Brandt, P.A. Intake of butylated hydroxyanisole and butylated hydroxytoluene and stomach cancer risk: Results from analyses in the Netherlands cohort study. Food Chem. Toxicol. 2000, 38, 599–605. [Google Scholar] [CrossRef]
- Block, G.; Patterson, B.; Subar, A. Fruit, vegetables, and cancer prevention: A review of the epidemiological evidence. Nutr. Cancer 1992, 18, 1–29. [Google Scholar] [CrossRef]
- Cohen, J.H.; Kristal, A.R.; Stanford, J.L. Fruit and vegetable intakes and prostate cancer risk. J. Natl. Cancer Inst. 2000, 92, 61–68. [Google Scholar] [CrossRef]
- Feskanich, D.; Ziegler, R.G.; Michaud, D.S.; Giovannucci, E.L.; Speizer, F.E.; Willett, W.C.; Colditz, G.A. Prospective study of fruit and vegetable consumption and risk of lung cancer among men and women. J. Natl. Cancer Inst. 2000, 92, 1812–1823. [Google Scholar] [CrossRef]
- Lunet, N.; Lacerda-Vieira, A.; Barros, H. Fruit and vegetables consumption and gastric cancer: A systematic review and meta analysis of cohort studies. Nutr. Cancer 2005, 53, 1–10. [Google Scholar] [CrossRef]
- Michels, K.B.; Giovannucci, E.; Chan, A.T.; Singhania, R.; Fuchs, C.S.; Willett, W.C. Fruit and vegetable consumption and colorectal adenomas in the nurses’ health study. Cancer Res. 2006, 66, 3942–3953. [Google Scholar]
- Bartosz, G. Oxidative stress in plants. Acta Physiol. Plant 1997, 19, 47–64. [Google Scholar] [CrossRef]
- Leja, M.; Mareczek, A.; Ben, J. Antioxidant properties of two apple cultivars during long-term storage. Food Chem. 2003, 80, 303–307. [Google Scholar] [CrossRef]
- Eberhardt, M.V.; Lee, C.Y.; Liu, R.H. Antioxidant activity of fresh apples. Nature 2000, 405, 903–904. [Google Scholar]
- Trichopoulou, A.; Costacou, T.; Bamia, C.; Trichopoulos, D. Adherence to a Mediterranean diet and survival in a Greek population. New Engl. J. Med. 2003, 348, 2599–2608. [Google Scholar] [CrossRef]
- Stangeland, T.; Remberg, S.F.; Lye, K.A. Total antioxidant activity in 35 Ugandan fruits and vegetables. Food Chem. 2009, 113, 85–91. [Google Scholar] [CrossRef]
- Ghasemzadeh, A.; Jaafar, H.Z.E.; Rahmat, A. Antioxidant activities, total phenolics and flavonoids content in two varieties of Malaysia young ginger (Zingiber officinale Roscoe). Molecules 2010, 15, 4324–4333. [Google Scholar] [CrossRef]
- Ling, L.T.; Radhakrishnan, A.K.; Subramaniam, T.; Cheng, H.M.; Palanisamy, U.D. Assessment of antioxidant capacity and cytotoxicity of selected Malaysian plants. Molecules 2010, 15, 2139–2151. [Google Scholar] [CrossRef]
- Tavares, L.; Carrilho, D.; Tyagi, M.; Barata, D.; Serra, A.T.; Duarte, C.M.M.; Duarte, R.O.; Feliciano, R.P.; Bronze, M.R.; Chicau, P.; Espirito-Santo, M.D.; Ferreira, R.B.; dos Santos, C.N. Antioxidant capacity of Macaronesian traditional medicinal plants. Molecules 2010, 15, 2576–2592. [Google Scholar] [CrossRef]
- Osman, H.; Rahim, A.A.; Isa, N.M.; Bakhir, N.M. Antioxidant activity and phenolic content of Paederia foetida and Syzygium aqueum. Molecules 2009, 14, 970–978. [Google Scholar] [CrossRef]
- Meng, L.H.; Lozano, Y.F.; Gaydou, E.M.; Li, B. Antioxidant activities of polyphenols extracted from Perilla frutescens varieties. Molecules 2009, 14, 133–140. [Google Scholar]
- Li, H.B.; Wong, C.C.; Cheng, K.W.; Chen, F. Antioxidant properties in vitro and total phenolic contents in methanol extracts from medicinal plants. LWT-Food Sci. Technol. 2008, 41, 385–390. [Google Scholar] [CrossRef]
- Cai, Y.Z.; Luo, Q.; Sun, M.; Corke, H. Antioxidant activity and phenolic compounds of 112 traditional Chinese medicinal plants associated with anticancer. Life Sci. 2004, 74, 2157–2184. [Google Scholar] [CrossRef]
- Li, H.B.; Cheng, K.W.; Wong, C.C.; Fan, K.W.; Chen, F.; Jiang, Y. Evaluation of antioxidant capacity and total phenolic content of different fractions of selected microalgae. Food Chem. 2007, 102, 771–776. [Google Scholar] [CrossRef]
- Lako, J.; Trenerry, V.C.; Wahlqvist, M.; Wattanapenpaiboon, N.; Sotheeswaran, S.; Premier, R. Phytochemical flavonols, carotenoids and the antioxidant properties of a wide selection of Fijian fruit, vegetables and other readily available foods. Food Chem. 2007, 101, 1727–1741. [Google Scholar] [CrossRef]
- Kahkonen, M.P.; Hopia, A.I.; Heinonen, M. Berry phenolics and their antioxidant activity. J. Agri. Food Chem. 2001, 49, 4076–4082. [Google Scholar] [CrossRef]
- Robards, K.; Prenzler, P.D.; Tucker, G.; Swatsitang, P.; Glover, W. Phenolic compounds and their roles in oxidative process in fruits. Food Chem. 1999, 66, 401–436. [Google Scholar] [CrossRef]
- Lamien-Meda, A.; Lamien, C.E.; Compaore, M.M.Y.; Meda, R.N.T.; Kiendrebeogo, M.; Zeba, B.; Millogo, J.F.; Nacoulma, O.G. Polyphenol content and antioxidant activity of fourteen wild edible fruits from Burkina Faso. Molecules 2008, 13, 581–594. [Google Scholar] [CrossRef]
- Ikram, E.H.K.; Eng, K.H.; Jalil, A.M.M.; Ismail, A.; Idris, S.; Azlan, A.; Nazri, H.S.M.; Diton, N.A.M.; Mokhtar, R.A.M. Antioxidant capacity and total phenolic content of Malaysian underutilized fruits. J. Food Compos. Anal. 2009, 22, 388–393. [Google Scholar] [CrossRef]
- Ndhlala, A.R.; Mupure, C.H.; Chitindingu, K.; Benhura, M.A.N.; Muchuweti, M. Antioxidant potentials and degrees of polymerization of six wild fruits. Sci. Res. Essays 2006, 1, 87–92. [Google Scholar]
- Egea, I.; Sanchez-Bel, P.; Romojaro, F.; Pretel, M.T. Six edible wild fruits as potential antioxidant additives or nutritional supplements. Plant Foods Hum. Nutr. 2010, 65, 121–129. [Google Scholar] [CrossRef]
- Li, L.; Chen, C.Y.O.; Chun, H.K.; Cho, S.M.; Park, K.M.; Lee-Kim, Y.C.; Blumberg, J.B.; Russell, R.M.; Yeum, K.J. A fluorometric assay to determine antioxidant activity of both hydrophilic and lipophilic components in plant foods. J. Nutr. Biochem. 2009, 20, 219–226. [Google Scholar] [CrossRef]
- Benzie, I.F.F.; Strain, J.J. The ferric reducing ability of plasma (FRAP) as a measure of “antioxidant power”: The FRAP assay. Anal. Biochem. 1996, 239, 70–76. [Google Scholar]
- Wong, S.P.; Leong, L.P.; Koh, J.H.W. Antioxidant activities of aqueous extracts of selected plants. Food Chem. 2006, 99, 775–783. [Google Scholar] [CrossRef]
- Re, R.; Pellegrini, N.; Proteggente, A.; Pannala, A.; Yang, M.; Rice-Evans, C. Antioxidant activity applying an improved ABTS radical cation decolorization assay. Free Radic. Biol. Med. 1999, 26, 1231–1237. [Google Scholar] [CrossRef]
- Badami, S.; Moorkoth, S.; Rai, S.R.; Kannan, E.; Bhojraj, S. Antioxidant activity of Caesalpinia sappan heartwood. Biol. Pharm. Bull. 2003, 26, 1534–1537. [Google Scholar] [CrossRef]
- Murcia, M.A.; Martinez-Tome, M.; Jimenez, A.M.; Vera, A.M.; Honrubia, M.; Parras, P. Antioxidant activity of edible fungi (truffles and mushrooms): Losses during industrial processing. J. Food Prot. 2002, 65, 1614–1622. [Google Scholar]
- Rufino, M.S.M.; Alves, R.E.; Brito, E.S.; Perez-Jimenez, J.; Saura-Calixto, F.; Mancini-Filho, J. Bioactive compounds and antioxidant capacities of 18 non-traditional tropical fruits from Brazil. Food Chem. 2010, 121, 996–1002. [Google Scholar] [CrossRef]
- Singleton, V.L.; Rossi, J.A. Colorimetry of total phenolics with phosphomolybdic-phosphotungstic acid reagents. Am. J. Enol. Vitic. 1965, 16, 144–158. [Google Scholar]
- Medina-Remon, A.; Barrionuevo-Gonzalez, A.; Zamora-Ros, R.; Andres-Lacueva, C.; Estruch, R.; Martínez-Gonzalez, M.A.; Diez-Espino, J.; Lamuela-Raventos, R.M. Rapid Folin–Ciocalteu method using microtiter 96-well plate cartridges for solid phase extraction to assess urinary total phenolic compounds, as a biomarker of total polyphenols intake. Anal. Chim. Acta 2009, 634, 54–60. [Google Scholar] [CrossRef]
- Singleton, V.L.; Orthofer, R.; Lamuela-Raventos, R.M. Analysis of total phenols and other oxidation substrates and antioxidants by means of Folin–Ciocalteu reagent. Oxid. Antioxid. Pt A 1999, 299, 152–178. [Google Scholar] [CrossRef]
- Roura, E.; Andres-Lacueva, C.; Estruch, R.; Lamuela-Raventos, R.M. Total polyphenol intake estimated by a modified Folin–Ciocalteu assay of urine. Clin. Chem. 2006, 52, 749–752. [Google Scholar] [CrossRef]
- Chun, O.K.; Kim, D.O. Consideration on equivalent chemicals in total phenolic assay of chlorogenic acid-rich plums. Food Res. Int. 2004, 37, 337–342. [Google Scholar] [CrossRef]
- Benzie, I.F.F.; Szeto, Y.T. Total antioxidant capacity of teas by the ferric reducing/antioxidant power assay. J. Agric. Food Chem. 1999, 47, 633–636. [Google Scholar] [CrossRef]
© 2010 by the authors; licensee MDPI, Basel, Switzerland. This article is an open access article distributed under the terms and conditions of the Creative Commons Attribution license (http://creativecommons.org/licenses/by/3.0/).
Share and Cite
Fu, L.; Xu, B.-T.; Xu, X.-R.; Qin, X.-S.; Gan, R.-Y.; Li, H.-B. Antioxidant Capacities and Total Phenolic Contents of 56 Wild Fruits from South China. Molecules 2010, 15, 8602-8617. https://doi.org/10.3390/molecules15128602
Fu L, Xu B-T, Xu X-R, Qin X-S, Gan R-Y, Li H-B. Antioxidant Capacities and Total Phenolic Contents of 56 Wild Fruits from South China. Molecules. 2010; 15(12):8602-8617. https://doi.org/10.3390/molecules15128602
Chicago/Turabian StyleFu, Li, Bo-Tao Xu, Xiang-Rong Xu, Xin-Sheng Qin, Ren-You Gan, and Hua-Bin Li. 2010. "Antioxidant Capacities and Total Phenolic Contents of 56 Wild Fruits from South China" Molecules 15, no. 12: 8602-8617. https://doi.org/10.3390/molecules15128602