Article

Investigation of Web-Based Eye-Tracking System Performance under Different Lighting Conditions for Neuromarketing

Department of Marketing and Advertising, Ostim Technical University, 06374 Ankara, Turkey
J. Theor. Appl. Electron. Commer. Res. 2023, 18(4), 2092-2106; https://doi.org/10.3390/jtaer18040105
Submission received: 6 September 2023 / Revised: 8 November 2023 / Accepted: 10 November 2023 / Published: 16 November 2023
(This article belongs to the Collection The New Era of Digital Marketing)

Abstract

:
The increasing popularity of neuromarketing has led to the emergence of various measurement methods, such as webcam-based eye-tracking technology. Webcam-based eye-tracking technology is noteworthy not only for its use in laboratories but also for its ability to be applied to participants online in their natural environments through a link. However, the complexity of e-commerce interfaces necessitates high performance in eye-tracking methods. This complexity and the applicability of webcam-based eye-tracking technology in various environments have raised research questions about how its performance changes depending on the type and location of lighting. To answer these questions, experiments were conducted with 30 users in two different experimental environments illuminated by artificial and natural methods, with the lighting from the left, right, and front. Participants were asked to focus on targets located in specially prepared graphics for the experiment. In the heatmaps obtained in the eye-tracking tests, the distance and angular difference between the focal point and the target point were measured using the polar coordinate system. The findings indicate that measurements taken with lighting coming from the center were more efficient in both natural and artificial lighting types and measurements taken under natural lighting performed 24% better than artificial ones. Web camera-based eye-tracking technology is a promising method. However, detailed statistical analyses have demonstrated that for complex interfaces like e-commerce, the position and type of lighting are crucial parameters.

1. Introduction

Visual stimuli constitute the primary source of information from the environment and occupy a broader cognitive space in the brain compared to other sensory inputs [1,2,3,4,5,6]. As a reflection of the intricate workings of the mind, the processing and interpretation of visual data have become significant factors in various aspects today. In this context, visual perception has become a focal point both academically and commercially [7]. Eye tracking is an experimental research method that has emerged at the intersection of psychology, neuroscience, and marketing with the aim of better understanding human behaviors. It involves tracking and recording a user’s eye movements [8]. This technology, which allows the measurement of visual attention [9], enables the examination of where, when, for how long, and in what order a user focuses, as well as the intensity and distribution of this focus [10]. Eye-tracking technology is increasingly being used for purposes such as understanding responses to visual stimuli, evaluating advertising effectiveness, optimizing product designs, understanding consumer behaviors, making marketing strategies more effective and personalized [11], and ensuring customer satisfaction [12] (p. 64), and its usage has been on the rise [13,14]. These studies, which are a critical tool for the analysis of visual attention, can be conducted both in laboratory settings and in natural scenarios [15]. With the increasing interest in eye-tracking technology and its expanding range of applications, the devices and techniques used in this field have also evolved. Eye-tracking technology has evolved over time, offering various options ranging from non-user-friendly contact lenses [16,17,18,19] to wearable devices and video-based methods [20,21,22,23,24,25]. During this process, the cost of eye-tracking technologies has decreased, making these technologies more accessible. Webcam-based eye-tracking technology, in particular, has gained attention due to its low cost, lack of additional hardware requirements, absence of physical contacts, and its ability to be applied anywhere through a simple link. The ability to apply this method anywhere allows participants to take part in the experiment from various positions with natural and artificial lighting sources with the light coming from different directions (from the right, left, and center). When evaluated in conjunction with the information density and complexity of e-commerce interfaces, this situation has raised questions about how the direction and type of lighting affect webcam-based eye-tracking performance. The research was conducted with the aim of improving the performance of this method, collecting more qualitative data, and contributing to the expert knowledge in the field. To date, there have been no comprehensive studies related to lighting on web camera-based eye-tracking methods. It is believed that this study will make a significant contribution to the processes of data collection, experiment setup, and interpretation of heatmaps in future research.

2. Literature Review

The sense of vision serves as a primary conduit for a plethora of information derived from the surrounding environment. One-quarter of the brain’s volume is allocated to visual image processing and its integration. Visual image processing occupies a broader area in the brain compared to other senses, indicating the significance of the sense of vision [1,2,3,4,5,6]. Comprehending the fundamental physiological structure of the eye and the process through which vision is formed is essential for eye-tracking studies [26,27].
The process of image formation begins with the arrival of light signals reflected from objects to the eye. Within the brain, there exist millions of neurons that transform these luminous signals into encoded electrochemical signals. This group of neurons, also known as photoreceptors, constitutes the retina. Continuous movements of the eyeballs allow the light inputs from the object of interest to fall onto this region [4] (p. 13). Contrary to popular belief, eye movements are not smooth. The process of vision involves two distinct eye movements known as saccades and fixations [15]. Saccades are rapid eye movements lasting approximately 20–40 milliseconds (occurring at an average rate of three to four times per second) and are recognized as the swiftest motions within the human body. Fixations, on the other hand, occur following these rapid eye movements, during which the eyes remain relatively stable (approximately 200–500 milliseconds) and focused on the object of interest [28,29,30,31]. Due to the inability of the eye to process the target image with high quality in a single fixation, it necessitates frequent movements. Consequently, most fixations are relatively short, and this duration can vary depending on factors such as the nature of the visual stimulus, the purpose and complexity of the task, the individual capabilities of the observer, and the focal point of attention [32]. During fixations, although perception may appear static, the eye is actually engaged in continuous movements, including tremors, drifts, and microsaccades [33] (pp. 3–13). However, saccades and fixations are the most frequently discussed eye movements, particularly capturing the attention of user experience (UX) researchers in e-commerce and marketing research [31] (p. 12).
Eye tracking is an experimental method wherein the eye movements and gaze position of a user are tracked and recorded over a specific period and task duration, enabling the measurement of visual attention [9]. This method is frequently employed in areas where the focus and distribution of visual attention are crucial [14,27,34]. This method allows for the investigation of where, when, for how long, and in what sequence a user directs his focus, thus making it a versatile research technique across various disciplines [9]. From fundamental studies of perception and memory [34,35,36] to game strategy development [37,38], from marketing and advertising [7] to industrial engineering [39], and from driving behaviors [40] to the professional development of educators [41], eye-tracking studies find application in almost every facet of life. Eye tracking, a tool for the analysis of visual attention, is garnering increasing attention in the relevant literature [9,27,42,43].
The growing interest and significance of eye tracking have been reflected in the variety of devices and techniques developed. The eye-tracking methodology originated with attempts to monitor the pupil externally and evolved into its present form through the development of after images, attachment devices, optical devices, remote devices, electro-oculographic devices, and portable eye-tracking techniques throughout history [20] (pp. 14–28).
Many early-stage eye-tracking techniques employed devices such as contact lenses [16] and electrodes [44], which necessitated physical intervention, making them impractical and discomforting for the user. Later, wearable eye-tracking devices that were less intrusive were developed, but these devices did not achieve the desired practical impact either [18,19]. In contrast, video-based eye-tracking techniques that are more suitable for daily use and do not cause discomfort to the user have begun to be developed [22,23].
Jacob and Karn [45] pointed out that despite the promising advancements in eye-tracking research, the utilization of such technologies had yet to proliferate to its potential level. They attributed this to the limitations related to eye-tracking hardware and software, as well as a lack of knowledge in interpreting the acquired data. In addition to these factors, the nature of the calibration process, requiring meticulous work and the shortage of competent experts in interpreting the acquired data [46] (p. 5), as well as factors like the cost of laboratory equipment and hardware, can be attributed to the limited proliferation of eye-tracking technology to the desired extent [47,48]. Nevertheless, the high-cost hardware and software in eye-tracking technology are gradually being replaced by more affordable alternatives [49]. The development of open-source software for data analysis [50], the production of wearable eye-tracking devices [51], the utilization of web cameras for eye-tracking [21,22,24,48], and the creation of eye-tracking software driven by artificial intelligence technology [52] are among the efforts aimed at making research in this field more accessible and widespread.
Eye tracking, based on the assumption of a direct relationship between where an individual looks and what they are cognitively attending to [31,43,53], can be conducted both in laboratory settings and in users’ natural environments. During the data collection process, users can be instructed to observe a variety of predetermined stimuli, which can be either static or dynamic, living or non-living [15]. Eye-tracking hardware can be categorized into two main groups: desktop-based devices and mobile devices. Desktop-based devices, which are mounted in a fixed location, record users’ eye movements from a stationary and relatively distant position, requiring users to sit in front of a screen. Mobile devices, as the name implies, allow users movement and capture images using wearable eye-tracking devices [25]. Eye-tracking technologies can measure various variables, including the position, number, and duration of fixations, the sequence and speed of saccades, pupil diameter, blink frequency, and many other factors [10].
While traditional marketing methods aim to decipher consumers’ approaches towards specific products and develop suitable sales strategies, they may not fully reflect consumers’ attitudes at the moment of purchase. Misunderstanding or misinterpreting these attitudes could lead to adverse outcomes for businesses, thus leading to an increasing focus on neuromarketing tools [54]. Neuromarketing has introduced a novel area where both cognitive and emotional aspects of consumer behavior can be studied together [8]. Research in this field has shown that individuals might not always express their preferences and intentions clearly, and they might not always be aware of the underlying reasons for their choices. This phenomenon is a crucial factor for both researchers in the field and relevant businesses to understand how the consumer’s brain responds to specific stimuli [55].
The number and variety of commercial stimuli that consumers are exposed to in daily life are increasing. Visual advertisements are among the marketing stimuli that businesses most commonly resort to in order to closely monitor their target consumer groups. From the consumer’s perspective, individuals engage in an information search process throughout their purchasing journey to fulfil various desires and needs, and visual search is the most effective tool in this process [56]. The field of marketing, as both a philosophy and an organizational strategy, centers on achieving customer satisfaction and conducting the most suitable purchasing actions by focusing on these information-searching behaviors [12] (p. 64). As a result, with the increasing significance and scope of visual marketing, the growing utilization of eye-tracking technology in commercial settings has also become an expected progression. It is known that numerous companies such as PepsiCo, Pfizer, P&G, and Unilever have employed this technology to formulate sales strategies in both America and Europe [7]. These developments are further supported by the reduction in the costs associated with eye-tracking tools and research.
With the increasing prevalence of e-commerce, consumers’ shopping experiences have diverged from their experiences in physical stores [13]. There exist numerous studies in the literature that compare physical and virtual stores [57,58,59]. In physical stores, the store atmosphere influences consumer behaviors [60,61,62]. In e-commerce and digital marketing processes, many significant variables used in the store atmosphere become obsolete. Factors that affect the atmosphere like scent, lighting, and ventilation cannot be controlled in the e-commerce process. This aspect sets e-commerce apart from physical stores.
Due to its inherent nature, e-commerce is unable to convey elements such as the scent, taste, and texture of a product to consumers within the current technological infrastructure [63] and, therefore, cannot address consumers’ sensory characteristics. In e-commerce, the most crucial and fundamental variable is the power of visual presentation. These reasons highlight the significance of eye-tracking in the field of e-commerce.

3. Research Hypothesis

The research questions were developed based on three main justifications. The first of these justifications is web camera-based eye tracking as an emerging and promising research method in the field of neuromarketing. During and after the COVID-19 pandemic, the shift of communication to the online realm has led to an increase in video calls. Subsequently, the concepts of remote and freelance work have gained popularity [64]. These changes spurred improvements in webcam hardware on computers, prompting competition among computer and hardware manufacturers. Consequently, the webcam hardware used by users on their computers has advanced, making webcam-based eye-tracking methods feasible. While the performance of eye-tracking devices is high, their costs remain elevated, too. When evaluated from a cost-performance standpoint, webcam-based eye tracking stands out for its cost-effectiveness. Webcam-based eye-tracking tests can be conducted without the need for any additional hardware [65]. These tests can be administered online through the distribution of a link, similar to online surveys, or conducted in a laboratory environment like traditional methods.
One significant domain where eye-tracking studies are conducted is the user interface (UI) and user experience (UX) design. E-commerce businesses need to enhance their interfaces in response to evolving customer behaviors and technologies [66]. The product boxes of the world’s top five most visited e-commerce and shopping platforms [67] are given in Figure 1.
Upon examining the product boxes, it is observed that there are objects with distances ranging from 5 px to 20 px. The closely positioned objects found in e-commerce interfaces emphasize the greater significance of eye-tracking calibration accuracy. Thus, within the realm of e-commerce, a sharper calibration is required compared to other marketing materials. For instance, in a full-screen eye-tracking test of a package, slight calibration deviations of 5–20 px would not significantly impact the focus on the logo, weight, or product name. However, in e-commerce interfaces, this situation holds great importance, which is the second justification for the research questions.
In addition to the increasing importance of webcam-based eye-tracking and the complexity of e-commerce interfaces, the final justification for the research questions is that the webcam-based eye-tracking technology operates through the analysis of images. As commonly known, light serves as the fundamental constituent of these images. Given the meticulousness required by calibration in e-commerce, the study aims to ascertain whether the nature of the light source, whether natural or artificial, and the arrangement of lighting have an impact on the accuracy of eye-tracking. In light of these considerations, the following research questions have been devised:
Research Question 1 (RQ1): How does the choice of lighting of the research environment (natural or artificial light) impact the performance (the amount and angle of focus displacement) of eye-tracking systems?
Research Question 2 (RQ2): How does the choice of lighting direction (light coming from the left, center, and right sides) impact the performance (the amount and angle of focus displacement) of eye-tracking systems?

4. Materials and Methods

4.1. Procedure

Prior to the experiment, participants were informed about the eye-tracking method. A presentation was given to all participants regarding the calibration processes. Participants were informed that they would not experience any physical contact and their images would not be recorded by the camera; only data related to where they were looking on the screen would be collected. Both experimental environments were introduced to the participants before the experiment. Tests were conducted in each experimental environment with the lighting coming from the right, front, and left. Consequently, participants underwent three eye-tracking tests in the experimental environment with artificial light sources and three tests in the experimental environment with natural light sources. No distracting visual elements were present in the experimental environment, and the experimental setting was maintained in silence. The GazeRecorder software, which specializes in eye tracking and statistical analysis, was utilized in the experiment [65]. The reason for selecting this tool is its widespread use in scientific eye-tracking studies [65,68,69,70,71,72,73].

4.2. Collecting Data

The sample was formed using a simple random sampling method, consisting of 30 participants who do not use glasses or contact lenses and have an equal distribution of males and females. The age range of the participants varied from 18 to 27 years, with a mean age of 20.1. The research was conducted in November 2022 at the neuromarketing laboratory of a foundation university located in the capital city of Turkey. The data obtained during the study were stored in the cloud environment using the GazeRecorder infrastructure.

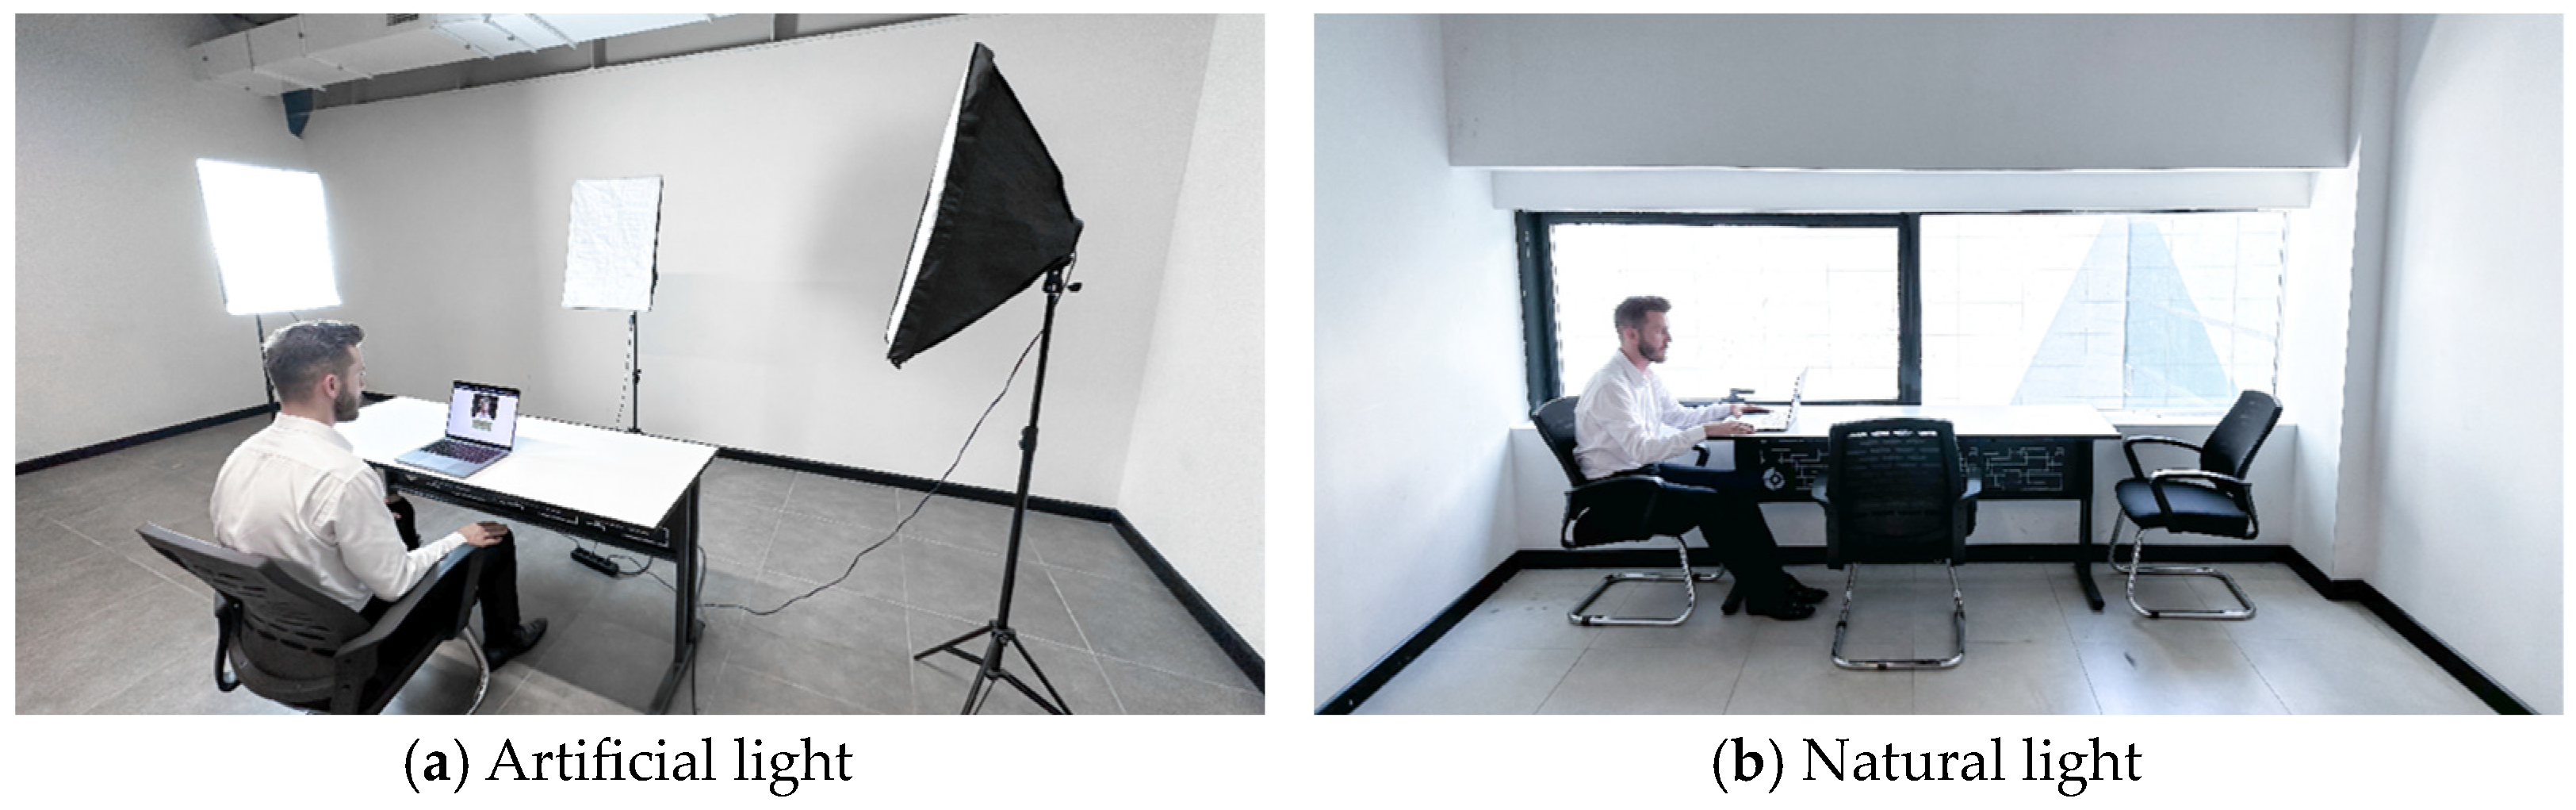
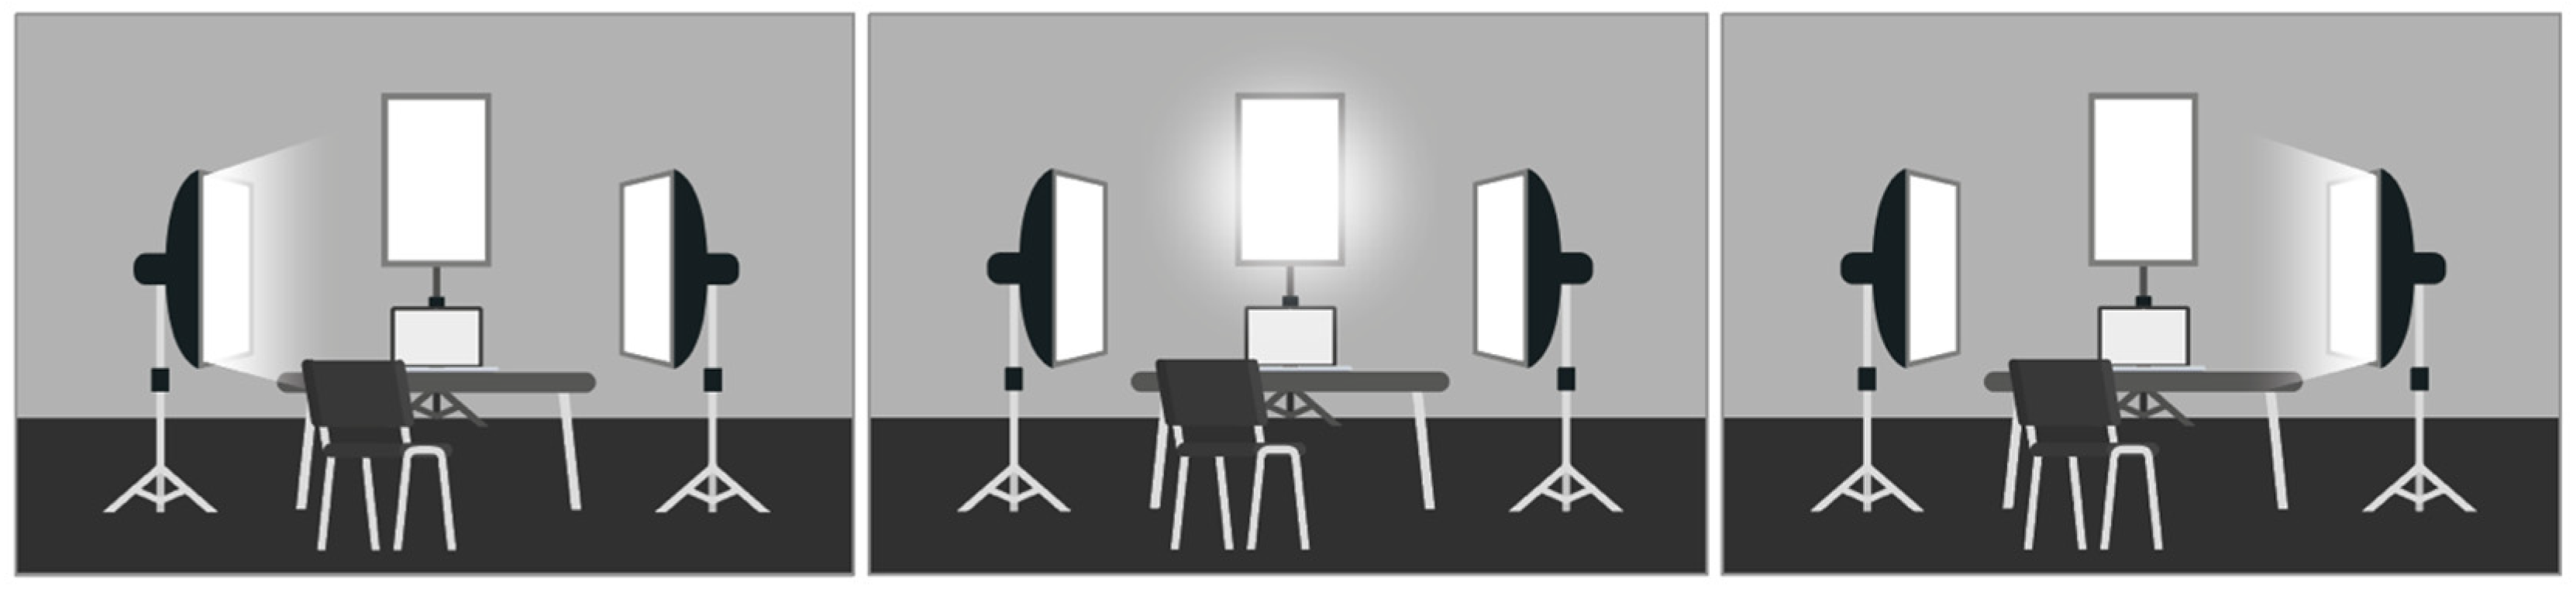
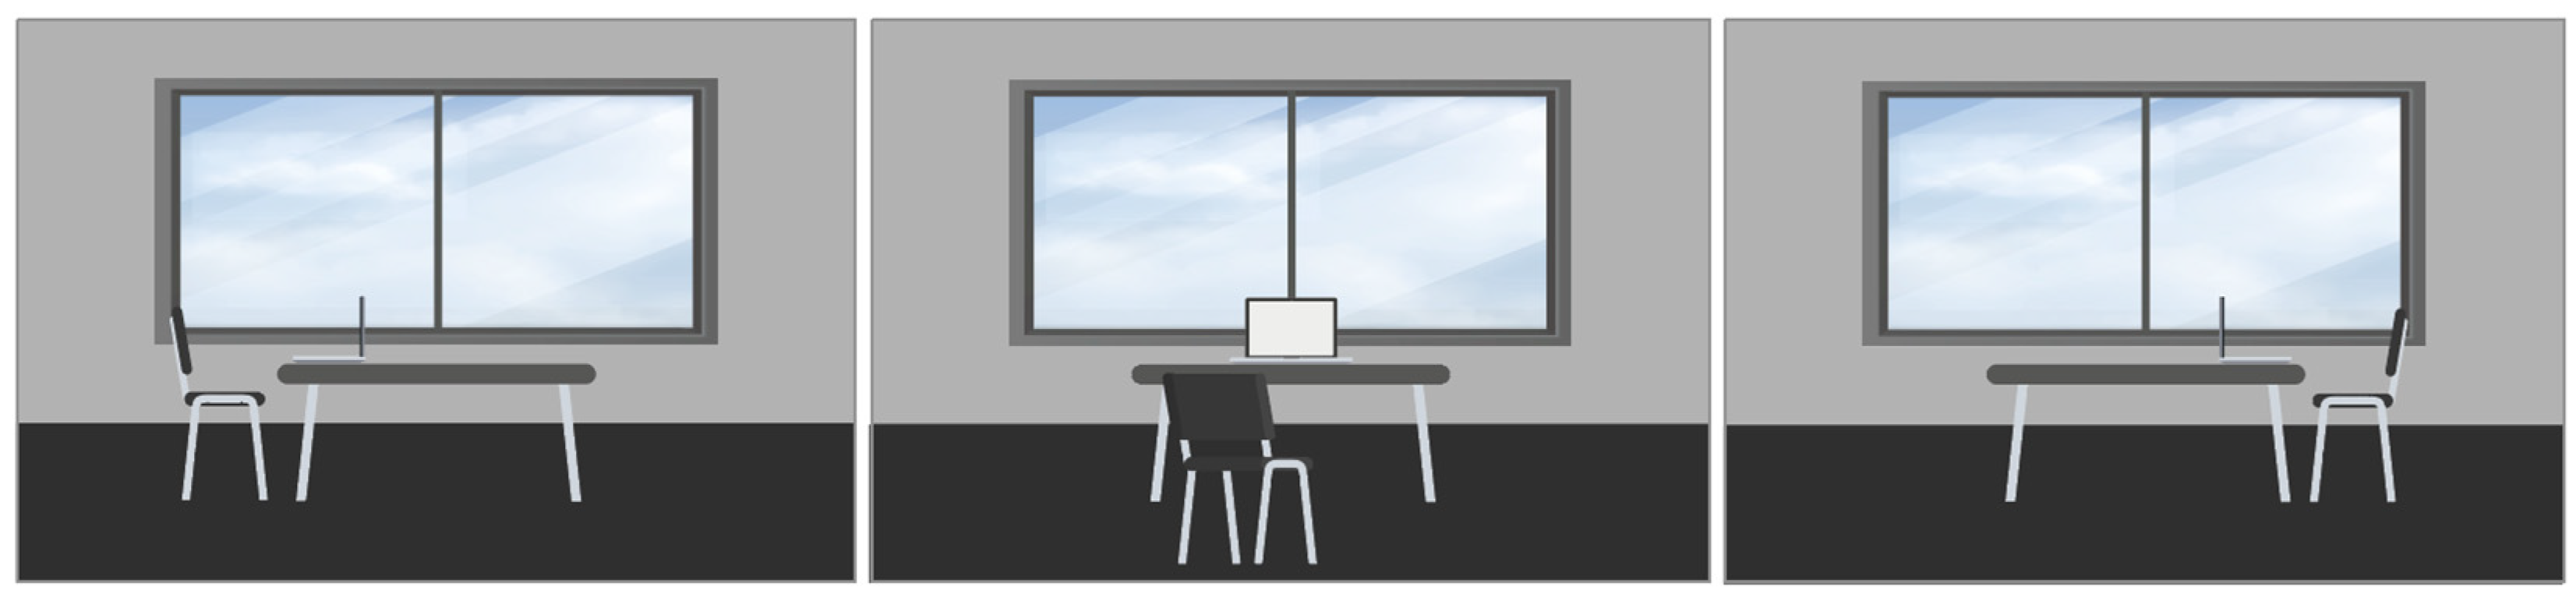
4.3. Experimental Environment and Materials

The laptop computer used during the research was the Apple Macbook M1 Pro 14” 2021. This laptop features a built-in Liquid Retina XDR Display with a resolution of 3024 × 1964 pixels. The integrated “Facetime HD Camera” on the computer boasts a resolution of 1920 × 1080 pixels (1080p) and can capture video at a rate of 30 frames per second (fps). The first experimental environment was a controlled environment with artificial lighting and no other light sources. The laboratory settings were purposefully designed to replicate the characteristics of a dark room. Three softboxes were used, each positioned at the same distance, height, and angle from the table, and remained stationary throughout the experiment. Softboxes are equipment designed to evenly distribute artificial light, containing various reflective materials within. Each softbox is equipped with an AC 220V motor speed control circuit that allows for controlling the light level. The light level was maintained at the highest setting in all three softboxes. Inside each softbox, there are four E27-type sockets. Four compact fluorescent lamps (CFL), 23 W, 50 Hz, 160 mA, 1600 lumens, and white (865 K) were installed in each of these sockets for each softbox. In total, 12 bulbs with identical specifications were used across the three softboxes.
The experiments were conducted in two different environments, as illustrated in Figure 2. In Figure 2a, the depicted photograph represents a dark room devoid of any windows through which natural light could penetrate. In environment (a), the tests were conducted exclusively with the use of softboxes for lighting. Figure 2b, on the other hand, features an environment with only a single window as a source of natural light, and apart from that, it remains unlit by artificial lighting.

4.4. Experimental Design

As depicted in Figure 3, during the eye-tracking tests conducted with artificial lighting, each participant underwent three separate tests with the lighting coming from the right, front, and left consecutively. Heating is a crucial factor to consider when using UV light sources. The time elapsed after the light source is turned on is essential for the stability of the light source [74].
Compact fluorescent lamps typically do not produce their optimum light output until one or two minutes after they are turned on [75]. A 1 h warming period is crucial, especially for fluorescent lamps that exhibit unstable electrical and light behavior, especially during the first 30 min of warming [76]. Based on the literature, the lights in the softboxes were left open for 1 h before the start of the experiments to stabilize and homogenize the light performance of the bulbs (Figure 4). This stage of the experiment is referred to as artificial light tests. During the artificial light tests, the computer and the participant remained stationary, and the tests were repeated. Each test lasted for one minute.
As seen in Figure 5, during the natural light tests, the computer and the participant changed their seating arrangement to receive natural light from the left, center, and right sides. The camera’s angle to the window was kept constant throughout the experiment. Maintaining a constant level of sunlight is an impossible task. However, during the experiment, efforts were made to keep the experimental environment stable, and the tests were conducted on sunny and clear days between 09:00 and 13:00 to minimize variations due to weather conditions.
The program conducts various checks before starting data collection to ensure that the experiment can collect data under the same standards. These conditions include adjusting a clear view of the face, ensuring the amount of light in the room, and ensuring that there is no strong light behind the participants so that appropriate seating distance and position can be adjusted [73]. If these conditions cannot be met, the experiment does not begin. Similarly, if these conditions cannot be maintained during the experiment, the experiment automatically terminates and is considered unsuccessful.
The calibration screens for the research are shown in Figure 6. The initial calibration is performed with the red target point against a gray background, as seen in Figure 6a. The red point moves in accordance with the flow of the yellow arrow in the visual. During this process, participants track the red point with their eyes. In the initial process of calibration, the screen is scanned at 17 different points, including the spaces in between. The second calibration of the test is conducted with a white background, using the red target point depicted in Figure 6b. The red point moves in accordance with the flow of yellow arrows in the visual, repeatedly traversing from the center to the left edge, right edge, top, and bottom. During this process, participants move their heads in response to the movement of the red target. Head movements are used to complete the calibration by scanning five different points on the screen and the space between them. In the second and third phases of calibrations, as shown in Figure 6c,d, participants were once again asked to follow the moving red dots with their eyes, similar to the first calibration. The second and third calibrations involve scanning five points each and are completed more quickly than the first calibration. The reason for using three different background colors (white, gray, and black) in the calibration is to calibrate the reflections in the eye. The reflections from the screen can cause the pupil to appear brighter or darker. The software performs eye tracking by looking for a bright or dark elliptical shape on the image, which is why the calibration process is structured in this way [78].
One of the outputs of eye-tracking studies is a heatmap, which illustrates how a group of participants examine a visual element. As seen in Figure 7, a heatmap consists of cold and warm colors. Warm colors represent the areas of highest interest and attention, while cold colors represent the areas of least interest and attention [52].
In the study, participants were instructed to look at a black target located inside a circle in graphics specially designed for the study. These targets were individually presented to participants in squares at the four corners and in the center of the screen. In the analysis, the differences in both spatial and angular aspects between the black dot the participants were instructed to look at and the point with the longest dwell time (the point participants focused on the most) in the heatmaps were determined. The arithmetic mean of the data obtained from tests conducted with three different lighting conditions, using natural and artificial light from three different angles, was calculated. This allowed the determination of the average shift in distance and angle for all measurement types. Consequently, the type of light and the direction with the least calibration errors were identified.

5. Results

Within the scope of the research, five visuals were tested with twenty participants in two different experimental environments, using three different positions of lighting. Accordingly, a total of 900 (5 × 2 × 3 × 30) visuals were subjected to testing. The data of a participant for the heatmaps are shared in Figure 8 as a sample. The black dot inside the circle represents the actual point participants looked at, while the heatmaps represent the areas focused on in the measurement results.
Heatmaps are created using two different variables for data visualization: blur and scale. The blur level is kept at its lowest, and the scale variable is used to identify the first reddening point. This point represents the location where participants focused for the longest duration as a result of the analysis. The distance between the intended focal point (black dot) and the point where participants focused for the longest duration in the analysis was measured. In addition to measuring the distance, data on the direction of the shift in the polar coordinate system were also obtained. As known, the polar coordinate system is a two-dimensional coordinate system used to describe the locations of points. In this system, points are determined by their distances from a central point called the “pole” and an angle measured clockwise from the pole. As shown in Figure 9, the findings were explained with an example output. In the polar coordinate system given, the point participants were instructed to focus on is considered the pole, and there was a deviation of 65 px at an angle of 194.96° in the eye-tracking tests. The degree of focal shift was calculated using the angular values of the focal shift vectors. When calculating the angular value of the deviation vectors, a conversion from the polar system to the coordinate system was performed.
The research findings were analyzed based on the position and type of the lighting, average values were calculated, and the mixed data (data of natural and artificial illumination) were evaluated in the tables below.
When artificial lighting is evaluated, it can be observed in Table 1 that center lighting had a lesser displacement distance compared to left and right lighting consecutively. Concerning the angle of displacement, in artificial lighting, center lighting differed from the left and right lighting. While left and right illuminations exhibited similar angles of displacement in a similar direction, center illumination had an average displacement angle of 85.64°.
When natural lighting is evaluated, it can be observed in Table 2 that center lighting had a lesser displacement distance compared to left and right illumination consecutively, mirroring the pattern observed with artificial lighting. Concerning the angle of displacement, no significant correlation was found among center, left, and right lighting. All displacement angles were shifting independently in different directions.
The calculated average focal displacement angle, obtained by taking the angular values of the focal displacement vectors’ result, revealed a difference of 44.13 degrees between natural and artificial lighting. When analyzing all data regardless of the position and type of lighting, an average focal displacement angle of 150.36 degrees was reached. This value was particularly significant for studies where lighting is not controlled (Table 3).
Table 4 presents the displacement distances based on focal points for different lighting types. The table examines the displacement distances for natural and artificial lighting, regardless of the position. Different degrees of displacement were observed in the corners and center points of the screen based on the lighting type. However, no significant similarity was found between the two lighting types and focal points. When examining the average displacement distance, it was found that measurements taken with natural lighting were 24% more efficient than those taken with artificial lighting.
One of the key features of webcam-based tests is that they can be conducted online. In cases where eye-tracking tests are conducted online, the type and position of lighting cannot be controlled, making mixed results of significant importance. Therefore, Table 5 was created using data from all lighting types and positions. In measurements conducted in an area of 2016 × 2016 px, a focal displacement distance of 137.99 px was determined. This indicates that the focus experienced a displacement of approximately 6.84%, specifically in online webcam-based research.

6. Discussion

The research concluded that in web camera-based eye-tracking studies, the type and location of lighting are of high importance in the context of e-commerce interfaces. The findings indicate that even the lowest level of displacement, which was 17.42 pixels in the study, can lead to misinterpretations due to the information density and complexity of e-commerce interfaces. For example, in heatmaps, it might be observed that users are focusing on the product name, but in reality, participants may be looking at the number of comments. Regarding RQ1, differences were observed in eye-tracking findings between artificial and natural lighting conditions. When evaluated in terms of displacement, considering all positions of lighting, it was determined that natural lighting outperformed artificial lighting. It is believed that this is due to natural lighting having a more homogeneous distribution compared to artificial lighting. Regarding RQ2, significant differences were observed in eye-tracking findings based on the direction of lighting. Based on the findings and analyses, regardless of the type of lighting, it was observed that when illumination was provided from the center, the displacement decreased. It was concluded that web camera-based eye-tracking tests conducted with central illumination yielded higher efficiency compared to other lighting directions. It is recommended that all eye-tracking research using web camera-based eye-tracking technology, especially in the field of e-commerce interfaces, should be conducted with natural lighting from the center to achieve high success. With today’s web camera-based eye-tracking technology, it is possible to conduct basic-level tests. However, for tests with high information density and closely located elements, it is essential to consider displacement amounts and angles for accurate results. Otherwise, it has been found that the analyses conducted may not achieve high-performance results when collecting data on a complex visual element. Web camera-based eye tracking is a promising technology. The research has identified and demonstrated through detailed statistical analyses that the position and type of lighting are highly important parameters. This article acknowledges various limitations that need to be noted. Firstly, the research was limited to participants who do not wear glasses and use contact lenses. Additionally, the specifications of the equipment used in the created laboratory environment, such as the camera, softbox, and CFL, constitute another limitation of the study. Lastly, as the final limitation of the study, the lighting was conducted from the right, center, and left, without including other angles. The researchers are recommended to continue the research by expanding its scope. Due to the use of artificial lighting with various color temperatures by users, new studies should investigate how color temperature affects web camera-based eye-tracking measurements. Additionally, repeating the experiment with increased angles of lighting, which was one of the limitations of the research, could contribute to making the study more comprehensive.

Funding

This research received no external funding.

Institutional Review Board Statement

Not applicable.

Informed Consent Statement

Informed consent was obtained from all subjects involved in the study.

Data Availability Statement

The data presented in this study are available on request from the corresponding author. The data are not publicly available due to privacy.

Acknowledgments

This work was supported by the Commission of Scientific Research Projects in Ostim Technical University. Project Number: 202216.

Conflicts of Interest

The author declares no conflict of interest.

References

  1. Schifferstein, H.N.J. The perceived importance of sensory modalities in product usage: A study of self-reports. Acta Psychol. 2006, 121, 41–64. [Google Scholar] [CrossRef] [PubMed]
  2. Hultén, B.; Broweus, N.; van Dijk, M. What Is Sensory Marketing? Palgrave Macmillan: London, UK, 2009; pp. 1–23. [Google Scholar]
  3. Wei-Lun, C.; Hsieh-Liang, L. The impact of color traits on corporate branding. Afr. J. Bus. Manag. 2010, 4, 3344–3355. [Google Scholar]
  4. Zurawicki, L. Neuromarketing: Exploring the Brain of the Consumer; Springer Science & Business Media: Berlin/Heidelberg, Germany, 2010; pp. 12–13. [Google Scholar]
  5. Krishna, A. An integrative review of sensory marketing: Engaging the senses to affect perception, judgment and behavior. J. Consum. Psychol. 2012, 22, 332–351. [Google Scholar] [CrossRef]
  6. Mounica, M.S.; Manvita, M.; Jyotsna, C.; Amudha, J. Low Cost Eye Gaze Tracker Using Web Camera. In Proceedings of the 2019 3rd International Conference on Computing Methodologies and Communication (ICCMC), Erode, India, 27–29 March 2019; IEEE: Piscataway, NJ, USA, 2019; pp. 79–85. [Google Scholar]
  7. Wedel, M.; Pieters, R. Eye tracking for visual marketing. Found. Trends Mark. 2008, 1, 231–320. [Google Scholar] [CrossRef]
  8. Morin, C. Neuromarketing: The new science of consumer behavior. Society 2011, 48, 131–135. [Google Scholar] [CrossRef]
  9. Kiefer, P.; Giannopoulos, I.; Raubal, M.; Duchowski, A. Eye tracking for spatial research: Cognition, computation, challenges. Spat. Cogn. Comput. 2017, 17, 1–19. [Google Scholar] [CrossRef]
  10. Smilek, D.; Carriere, J.S.A.; Cheyne, J.A. Out of mind, out of sight: Eye blinking as indicator and embodiment of mind wandering. Psychol. Sci. 2010, 21, 786–789. [Google Scholar] [CrossRef] [PubMed]
  11. Li, C. The placebo effect in web-based personalization. Telemat. Inform. 2019, 44, 101267. [Google Scholar] [CrossRef]
  12. Brugarolas, M.; Martínez-Carrasco, L. The sense of sight. In Sensory and Aroma Marketing; Sendra, E., Carbonell-Barrachina, Á.A., Eds.; Wageningen Academic Publishers: Gelderland, The Netherlands, 2017; pp. 61–92. [Google Scholar]
  13. Kauppinen-Räisänen, H. Strategic use of colour in brand packaging. Packag. Technol. Sci. 2014, 27, 663–676. [Google Scholar] [CrossRef]
  14. Gómez-Carmona, D.; Cruces-Montes, S.; Marín-Dueñas, P.P.; Serrano-Domínguez, C.; Paramio, A.; García, A.Z. Do you see it clearly? The effect of packaging and label format on Google Ads. J. Theor. Appl. Electron. Commer. Res. 2021, 16, 1648–1666. [Google Scholar] [CrossRef]
  15. King, A.J.; Bol, N.; Cummins, R.G.; John, K.K. Improving visual behavior research in communication science: An overview, review, and reporting recommendations for using eye-tracking methods. Commun. Methods Meas. 2019, 13, 149–177. [Google Scholar] [CrossRef]
  16. Robinson, D.A. A method of measuring eye movement using a scleral search coil in a magnetic field. IEEE. Trans. Biomed. Eng. 1963, 10, 137–145. [Google Scholar] [PubMed]
  17. Kaufman, A.E.; Bandopadhay, A.; Shaviv, B.D. An Eye Tracking Computer User Interface. In Proceedings of the 1993 IEEE Research Properties in Virtual Reality Symposium, San Jose, CA, USA, 25–26 October 1993; IEEE: Piscataway, NJ, USA, 1993; pp. 120–121. [Google Scholar]
  18. Babcock, J.S.; Pelz, J.B. Building a Lightweight Eyetracking Headgear. In Proceedings of the 2004 Symposium on Eye Tracking Research & Applications, San Antonio, TX, USA, 22–24 March 2004; Association for Computing Machinery: New York, NY, USA, 2004; pp. 109–114. [Google Scholar]
  19. Takemura, K.; Takahashi, K.; Takamatsu, J.; Ogasawara, T. Estimating 3-D point-of-regard in a real environment using a head-mounted eye-tracking system. IEEE Trans. Hum. Mach. Syst. 2014, 44, 531–536. [Google Scholar] [CrossRef]
  20. Wade, N.; Tatler, B.W. The Moving Tablet of the Eye: The Origins of Modern Eye Movement Research; Oxford University Press: Oxford, UK, 2005; pp. 14–28. [Google Scholar]
  21. Valenti, R.; Sebe, N.; Gevers, T. What are you looking at? Improving visual gaze estimation by saliency. Int. J. Comput. Vis. 2012, 98, 324–334. [Google Scholar] [CrossRef]
  22. Lin, Y.T.; Lin, R.Y.; Lin, Y.C.; Lee, G.C. Real-time eye-gaze estimation using a low-resolution webcam. Multimed. Tools Appl. 2013, 65, 543–568. [Google Scholar] [CrossRef]
  23. Cheung, Y.M.; Peng, Q. Eye gaze tracking with a web camera in a desktop environment. IEEE Trans. Hum. Mach. Syst. 2015, 45, 419–430. [Google Scholar] [CrossRef]
  24. Meng, C.; Zhao, X. Webcam-based eye movement analysis using CNN. IEEE Access 2017, 5, 19581–19587. [Google Scholar] [CrossRef]
  25. Meißner, M.; Oll, J. The promise of eye-tracking methodology in organizational research: A taxonomy, review, and future avenues. Organ. Res. Methods 2019, 22, 590–617. [Google Scholar] [CrossRef]
  26. Hansen, D.W.; Pece, A.E. Eye tracking in the wild. Comput. Vis. Image Underst. 2005, 98, 155–181. [Google Scholar] [CrossRef]
  27. Carter, B.T.; Luke, S.G. Best practices in eye tracking research. Int. J. Psychophysiol. 2020, 155, 49–62. [Google Scholar] [CrossRef]
  28. Wedel, M.; Pieters, R. A review of eye-tracking research in marketing. In Review of Marketing Research; Malhotra, N.K., Ed.; Emerald Group Publishing Limited: Bingley, UK, 2008; Volume 4, pp. 123–147. [Google Scholar]
  29. Bojko, A. Eye Tracking in User Experience Testing: How to Make the Most of It. In Proceedings of the UPA 2005 Conference, Montreal, QC, Canada, 27 June–1 July 2005. [Google Scholar]
  30. Singh, H.; Singh, J. Human eye tracking and related issues: A review. Int. J. Sci. Res. 2012, 2, 1–9. [Google Scholar]
  31. Bojko, A. Eye Tracking the User Experience: A Practical Guide to Research; Rosenfeld Media: Brooklyn, NY, USA, 2013; pp. 12–13. [Google Scholar]
  32. Rayner, K. The 35th Sir Frederick Bartlett Lecture: Eye movements and attention in reading, scene perception, and visual search. Q. J. Exp. Psychol. 2009, 62, 1457–1506. [Google Scholar] [CrossRef] [PubMed]
  33. Duchowski, A.T. Visual attention. In Eye Tracking Methodology, 3rd ed.; Springer: Cham, Switzerland, 2017; pp. 3–13. [Google Scholar]
  34. Mormann, M.; Griffiths, T.; Janiszewski, C.; Russo, J.E.; Aribarg, A.; Ashby, N.J.S.; Bagchi, R.; Bhatia, S.; Kovacheva, A.; Meissner, M.; et al. Time to pay attention to attention: Using attention-based process traces to better understand consumer decision-making. Mark. Lett. 2020, 31, 381–392. [Google Scholar] [CrossRef]
  35. Allopenna, P.D.; Magnuson, J.S.; Tanenhaus, M.K. Tracking the time course of spoken word recognition using eye movements: Evidence for continuous mapping models. J. Mem. Lang. 1998, 38, 419–439. [Google Scholar] [CrossRef]
  36. Chua, H.F.; Boland, J.E.; Nisbett, R.E. Cultural variation in eye movements during scene perception. Proc. Natl. Acad. Sci. USA 2005, 102, 12629–12633. [Google Scholar] [CrossRef] [PubMed]
  37. Polonio, L.; Di Guida, S.; Coricelli, G. Strategic sophistication and attention in games: An eye-tracking study. Games Econ Behav. 2015, 94, 80–96. [Google Scholar] [CrossRef]
  38. Majaranta, P.; Räihä, K.-J.; Hyrskykari, A.; Špakov, O. Eye movements and human-computer interaction. In Eye Movement Research: An Introduction to Its Scientific Foundations and Applications; Klein, C., Ettinger, U., Eds.; Springer International Publishing: Cham, Switzerland, 2019; pp. 971–1015. [Google Scholar]
  39. Chapman, P.; Underwood, G.; Roberts, K. Visual search patterns in trained and untrained novice drivers. Transp. Res. F Traffic Psychol. 2002, 5, 157–167. [Google Scholar] [CrossRef]
  40. Nakayasu, H.; Miyoshi, T.; Aoki, H.; Kondo, N.; Patterson, P. Analysis of driver perceptions and behavior when driving in an unfamiliar traffic regulation. J. Adv. Comput. Intell. Intell. Inform. 2011, 15, 1038–1048. [Google Scholar] [CrossRef]
  41. Beach, P.; McConnel, J. Eye tracking methodology for studying teacher learning: A review of the research. Int. J. Res. Method Educ. 2019, 42, 485–501. [Google Scholar] [CrossRef]
  42. Solnais, C.; Andreu-Perez, J.; Sánchez-Fernández, J.; Andréu-Abela, J. The contribution of neuroscience to consumer research: A conceptual framework and empirical review. J. Econ. Psychol. 2013, 36, 68–81. [Google Scholar] [CrossRef]
  43. Hoffman, J.E. Visual attention and eye movements. In Attention; Pashler, H., Ed.; Psychology Press: London, UK, 2016; pp. 119–153. [Google Scholar]
  44. Li, Z.; Guo, P.; Song, C. A Review of Main Eye Movement Tracking Methods. J. Phys. Conf. Ser. 2021, 1802, 1–13. [Google Scholar] [CrossRef]
  45. Jacob, R.J.; Karn, K.S. Commentary on section 4. Eye tracking in human-computer interaction and usability research: Ready to deliver the promises. In The Mind’s Eye: Cognitive and Applied Aspects of Eye Movement Research; Hyönä, J., Radach, R., Deubel, H., Eds.; Elsevier: Amsterdam, The Netherlands, 2003; pp. 573–607. [Google Scholar]
  46. Holmqvist, K.; Andersson, R. Eye tracking: A Comprehensive Guide to Methods, Paradigms and Measures, 2nd ed.; Oxford University Press: Charleston, SC, USA, 2017; pp. 5–7. [Google Scholar]
  47. Funke, G.; Greenlee, E.; Carter, M.; Dukes, A.; Brown, R.; Menke, L. Which Eye Tracker Is Right for Your Research? Performance Evaluation of Several Cost Variant Eye Trackers. In Proceedings of the Human Factors and Ergonomics Society Annual Meeting, Washington, DC, USA, 19–23 September 2016; SAGE Publications: Los Angeles, CA, USA, 2016; pp. 1240–1244. [Google Scholar]
  48. Semmelmann, K.; Weigelt, S. Online webcam-based eye tracking in cognitive science: A first look. Behav. Res. Methods 2018, 50, 451–465. [Google Scholar] [CrossRef]
  49. Dalmaijer, E.S. Is the low-cost EyeTribe eye tracker any good for research? PeerJ Prepr. 2014, 4, 1–35. [Google Scholar]
  50. Dalmaijer, E.S.; Mathôt, S.; Van der Stigchel, S. PyGaze: An open-source, cross-platform toolbox for minimal-effort programming of eyetracking experiments. Behav. Res. Methods 2014, 46, 913–921. [Google Scholar] [CrossRef] [PubMed]
  51. Bulling, A.; Gellersen, H. Toward mobile eye-based human-computer interaction. IEEE Pervasive Comput. 2010, 9, 8–12. [Google Scholar] [CrossRef]
  52. Yüksel, D. Göz izleme tekniği ile bir siyasal pazarlama iletişimi araştırması: Türkiye Cumhuriyeti 2023 Cumhurbaşkanlığı Seçimi billboardlarının analizi. İşletme Araştırmaları Derg. 2023, 15, 2113–2125. [Google Scholar]
  53. Just, M.A.; Carpenter, P.A. A theory of reading: From eye fixations to comprehension. Psychol. Rev. 1980, 87, 329–354. [Google Scholar] [CrossRef]
  54. Aldayel, M.; Ykhlef, M.; Al-Nafjan, A. Deep learning for EEG based preference classification in neuromarketing. Appl. Sci. 2020, 10, 1525. [Google Scholar] [CrossRef]
  55. Hammou, K.; Galib, M.H.; Melloul, J. The contributions of neuromarketing in marketing research. J. Manag. Res. 2013, 5, 20–23. [Google Scholar]
  56. Yüksel, D. Marka yönetiminde renk seçimi: Renk kümeleme modeli. Bus. Econ. Res. J. 2023, 14, 433–444. [Google Scholar] [CrossRef]
  57. Hsiao, M.-H. Shopping mode choice: Physical store shopping versus e-shopping. Transp. Res. E Logist. Transp. 2009, 45, 86–95. [Google Scholar] [CrossRef]
  58. Xi, G.; Zhen, F.; Cao, X.; Xu, F. The interaction between e-shopping and store shopping: Empirical evidence from Nanjing, China. Transp. Lett. 2018, 12, 157–165. [Google Scholar] [CrossRef]
  59. Colaço, R.; de Abreu e Silva, J. Exploring the interactions between online shopping, in-store shopping, and weekly travel behavior using a 7-day shopping survey in Lisbon, Portugal. Transp. Res. Rec. 2021, 2675, 379–390. [Google Scholar] [CrossRef]
  60. Spence, C.; Puccinelli, N.M.; Grewal, D.; Roggeveen, A.L. Store atmospherics: A multisensory perspective. Psychol Mark. 2014, 31, 472–488. [Google Scholar] [CrossRef]
  61. Baker, J.; Grewal, D.; Parasuraman, A. The influence of store environment on quality inferences and store image. J. Acad. Mark. Sci. 1994, 22, 328–339. [Google Scholar] [CrossRef]
  62. Manganari, E.E.; Siomkos, G.J.; Vrechopoulos, A.P. Store atmosphere in web retailing. Eur. J. Mark. 2009, 43, 1140–1153. [Google Scholar] [CrossRef]
  63. Demangeot, C.; Broderick, A.J. Conceptualising consumer behaviour in online shopping environments. Int. J. Retail Distrib. Manag. 2017, 35, 878–894. [Google Scholar] [CrossRef]
  64. Wiederhold, B.K. Connecting through technology during the coronavirus disease 2019 pandemic: Avoiding “Zoom Fatigue”. Cyberpsychol. Behav. Soc. Netw. 2020, 23, 437–438. [Google Scholar] [CrossRef]
  65. Nichifor, E.; Lixăndroiu, R.C.; Chițu, I.B.; Brătucu, G.; Sumedrea, S.; Maican, C.I.; Tecău, A.S. Eye tracking and an a/b split test for social media marketing optimisation: The connection between the user profile and ad creative components. J. Theor. Appl. Electron. Commer. Res. 2021, 16, 2319–2340. [Google Scholar] [CrossRef]
  66. Najjar, L.J. Advances in E-commerce User Interface Design. Human Interface and the Management of Information: Information and Interaction Design. In Proceedings of the Symposium on Human Interface, Las Vegas, NV, USA, 21–26 July 2013; Springer: Berlin/Heidelberg, Germany, 2011; pp. 292–300. [Google Scholar]
  67. Top Websites Ranking. Available online: https://www.similarweb.com/top-websites/e-commerce-and-shopping/ (accessed on 20 June 2023).
  68. Abdrabou, Y.; Karypidou, E.; Alt, F.; Hassib, M. Investigating User Behaviour Towards Fake News on Social Media Using Gaze and Mouse Movements. In Proceedings of the Usable Security Mini Conference, Copenhagen, Denmark, 16–17 October 2023. [Google Scholar]
  69. Kumar, J.A.; Ibrahim, N.; McEvoy, D.; Sehsu, J. Anthropomorphised learning contents: Investigating learning outcomes, epistemic emotions and gaze behaviour. Educ. Inf. Technol. 2023, 28, 7877–7897. [Google Scholar] [CrossRef]
  70. Adams, A.L. UX resources. Public Serv. Q. 2023, 19, 38–45. [Google Scholar] [CrossRef]
  71. Othman, Y.; Khalaf, M.; Ragab, A.; Salaheldin, A.; Ayman, R.; Sharaf, N. Eye-To-Eye: Towards Visualizing Eye Gaze Data. In Proceedings of the 2020 24th International Conference Information Visualisation, Melbourne, Australia, 7–11 September 2020; pp. 729–733. [Google Scholar]
  72. Giraldo-Romero, Y.I.; Pérez-de-los-Cobos-Agüero, C.; Muñoz-Leiva, F.; Higueras-Castillo, E.; Liébana-Cabanillas, F. Influence of regulatory fit theory on persuasion from google ads: An eye tracking study. J. Theor. Appl. Electron. Commer. Res. 2021, 16, 1165–1185. [Google Scholar] [CrossRef]
  73. Yüksel, D.; Tolon, M. Nöro Logo Marka Yönetimi Bakış Açısıyla Logo Oranlarının Göz Izleme Tekniğiyle Incelenmesi; Detay Yayıncılık: Ankara, Türkiye, 2023; pp. 65–66. [Google Scholar]
  74. McDermott, S.L.; Walsh, J.E.; Howard, R.G. A comparison of the emission characteristics of UV-LEDs and fluorescent lamps for polymerisation applications. Opt. Laser Technol. 2008, 40, 487–493. [Google Scholar] [CrossRef]
  75. Mielczarski, W.; Michalik, G.; Lawrence, W.B.; Gabryjelski, Z. Side Effects of Energy Saving Lamps. In Proceedings of the 8th International Conference on Harmonics and Quality of Power, Athens, Greece, 14–16 October 1998; pp. 1200–1205. [Google Scholar]
  76. Topalis, F.V. Efficiency of energy saving lamps and harmonic distortion in distribution systems. IEEE Trans. Power Deliv. 1993, 8, 2038–2042. [Google Scholar] [CrossRef]
  77. FAQ—Comparision of LED and CFL Light Warm up Times. Available online: http://www.ledbenchmark.com/faq/CFL-LED-warm-up-time.html (accessed on 25 July 2023).
  78. Dark and Bright Pupil Tracking. Available online: https://connect.tobii.com/s/article/What-is-dark-and-bright-pupil-tracking?language=en_US (accessed on 20 June 2023).
Figure 1. Product boxes of the top five most visited e-commerce and shopping platforms in the world.
Jtaer 18 00105 g001
Figure 2. Experimental environments.
Jtaer 18 00105 g002
Figure 3. Experimental process of artificial lighting.
Jtaer 18 00105 g003
Figure 4. CFLs warm-up time [77].
Jtaer 18 00105 g004
Figure 5. Experimental process of natural lighting.
Jtaer 18 00105 g005
Figure 6. The calibration process of webcam-based eye-tracking method.
Jtaer 18 00105 g006
Figure 7. Heatmap color scale.
Jtaer 18 00105 g007
Figure 8. A heatmap sample of a participant showing the intended focal point and the actual point of focus.
Jtaer 18 00105 g008
Figure 9. Sample data on spatial and angular measurement on the polar coordinate system.
Jtaer 18 00105 g009
Table 1. Data on the displacement distance and angle at focal points according to the artificial lighting position.
Artificial Lighting
From Left
Artificial Lighting
From Center
Artificial Lighting
From Right
Focal PointsDisplacement Distance of Focal Point (px)Angels of Displacement (°)Displacement Distance of Focal Point (px)Angels of Displacement (°)Displacement Distance of Focal Point (px)Angels of Displacement (°)
Center65.4180.63118.0292.6818.24138.75
Top-left105.1211.14162.17113.5400.67218.77
Top-right130.41128.7641.06154.14236.1561.08
Bottom-left116.77208.86139.66359.84208.6780.74
Bottom-right395.02161.5681.691.16134.84182.04
Mean Scores162.54177.29108.5085.64199.71151.64
Table 2. Data on the displacement distance and angle at focal points according to the natural lighting position.
Natural Lighting
From Left
Natural Lighting
From Center
Natural Lighting
From Right
Focal PointsDisplacement Distance of Focal Point (px)Angels of Displacement (°)Displacement Distance of Focal Point (px)Angels of Displacement (°)Displacement Distance of Focal Point (px)Angels of Displacement (°)
Center139.0235.19127.16228.22134.7881.48
Top-left31.0367.3617.42300.42182.3440.58
Top-right89.0723.7769.56318.38133.12228.22
Bottom-left129.7207.8851.05359.0996.427.11
Bottom-right314.84168.63105.02209.24165.28229.94
Mean Scores140.73145.9674.04242.72142.3932.00
Table 3. Focal displacement angles for artificial, natural, and mixed lighting types.
The Type of LightingAverage Focal Displacement Angle (°)
Natural Lighting186.18
Artificial Lighting142.05
Mixed Lighting150.36
Table 4. Displacement distances for artificial and natural lighting types from focal points.
Focal PointsArtificial Lighting Displacement Distance of Focal Point (px)Natural Lighting Displacement Distance of Focal Point (px)
Center67.22133.65
Top-left222.6576.93
Top-right135.8797.25
Bottom-left155.0392.39
Bottom-right203.82195.05
Mean Score (px)156.92119.05
Table 5. Displacement distances for all types of light and positions from focal points.
Focal PointsDisplacement Distance of Focal Point (px)
Center100.44
Top-left149.79
Top-right116.56
Bottom-left123.71
Bottom-right199.43
Mean Score (px)137.99
Disclaimer/Publisher’s Note: The statements, opinions and data contained in all publications are solely those of the individual author(s) and contributor(s) and not of MDPI and/or the editor(s). MDPI and/or the editor(s) disclaim responsibility for any injury to people or property resulting from any ideas, methods, instructions or products referred to in the content.

