1. Introduction
The global COVID-19 crisis, beginning in early 2020, accelerated interest in the digital transformation process (DT). The epidemic forced the world to dramatically change multiple behaviors; digital resilience (DR), together with economic and social resilience, became key concerns. Rothrock [
1] approached the DT of the companies in terms of cyber threats and Kohn [
2] examined DT from the perspective of organization security.
Even though this process started years earlier, DT had not yet gained traction as a critical challenge. Reis et al. [
3], with a systematic analysis of the literature, showed that businesses must reconsider their strategies to deal with digital reality. In addition, they highlighted the role of higher education to identify new areas and opportunities of DT. The multidisciplinary implications of DT are reflected in the stages of the process: digitization, digitalization, and digital transformation [
4].
The adoption of digital infrastructure and applications is just the beginning; finding skilled human resources to exploit these facilities is the middle stage. However, the final and most important step to fulfill DT is structural transformation [
5,
6]. The mindset of managers and consumers and the behavior of the business environment play a key role in DT [
7,
8,
9,
10]; specialists have developed a framework of DT adoption [
11].
Human resources play a key role in both DT and DR; this mindset and the behavioral matrix are built into higher education organization. Furthermore, managerial, entrepreneurial skills, organization culture, and strategic development are topics studied in many Higher Education Institutions (HEIs). From this perspective, we acknowledge the important role of higher education in the regional development and in DR; we therefore propose regional models of DR using the quadruple helix theory.
The 4Helix model offers a collaborative framework that involves the most important stakeholders of the socio-economic development (economy, education, society and government). Cooperation between these essential components can create the needed synergy for a fast-forward DT and sustainable development in accordance with modern challenges. The model was developed for innovation and stated the role of the four participants on the benefit of this complex process. DT is highly accepted, with the innovation being entirely dependent on the new digital tools (e-learning, e-commerce, e-governance, e-health, e-banking, e-administration, artificial intelligence, internet of things, block chain, twin tool, etc.), but it is also a very complex process. The stakeholders of the 4Helix model have the main roles in DT. All the actors are contributing to the co-creation of the knowledge, ideas and solutions; the approach is more integrated and holistic. Encouraging the end-users’ participation increases the impact and relevance of the solutions, which are created to solve society’s needs. Together, they can better use the resources (financial and human resources) by leveraging the strengths and expertise of each. Involving government and civil society actors can lead to more transparent and accountable decision-making processes focused on the global benefit of the society and the regional cohesion. Overall, a 4Helix model has an integrative approach of a complex process and offers the most efficient and effective perspective to co-generate solutions with a greater impact on society and the economy.
We appreciate that a regional study meant to measure the contribution of the HEIs to DR and innovation transfer to economy is needed to address the upcoming challenges and to efficiently use the resources. Based on the findings, the policy makers will know the level of the regional DR, the potential of HEIs in promoting and transferring the knowledge and innovation to the economy, and the geostrategic elements (neighbors) that could act as facilitators or barriers. Moreover, the proposed model highlights the importance of the dynamic measurement, giving a picture of the regional trends and significant information to design public policies to stimulate, accelerate or support the DR. The model can be replicated for other socio-economic factors, offering consistent and valuable insights for scientists and professionals.
2. Literature Review
DR is considered a factor of corporate performance improvement [
12] as well as education delivery enhancement [
13]. Digital transformation deeply impacts people and organizations. The risks, opportunities and accompanying digital infrastructure (hard and soft) should be better understood, and the human resources involved should be better prepared [
14].
Human capital has a significant role in the digital economy and contributes significantly to economic growth and well-being [
15]. DR post-crisis has a critical role in business resilience, behavioral changes related to supply and demand [
16], employee expectations relating to remote work [
12], business communications [
17], health issues [
18] and students’ performance [
19], to name but a few of the elements involved.
Starting from the triple helix model [
20,
21,
22] that explains the relations between university, industry and government, and the roles of a knowledge-driven economy and innovation, a quadruple helix growth model was developed by adding civil society [
23]. A quadruple helix model was used by Yun and Liu [
24] for open innovation (integration of internal and external idea).
Carayannis and Campbell [
25] present the triple helix (3Helix), quadruple helix (4Helix) and quintuple helix (5Helix) as frameworks for knowledge transfer, innovation and as a trans-disciplinary approach. Miller, McAdam, and McAdam [
26] analyzed the literature and the evolution from 3Helix to 4Helix models.
The 4Helix model was used to explain regional innovation by Hasche, Höglund and Linton [
27], Roman et al. [
28] and Kimatu [
29]. Using a 4Helix model, the importance of funding for renewable energy technology was explained [
30] along with the digitalization of SMEs [
31]. In business, especially, SMEs, growth and digital transformation are dependent on qualified labor with adequate digital skills, according to Gogorishvili [
32]. In this context, a sustainable smart city could be developed and managed using the synergy of all stakeholders and adequate digital transformation [
33].
Higher education must adapt continuously to fresh challenges and socio-economic transformation [
34]. The HEIs are the core of this innovation, knowledge production and transfer. HEIs are the main centers of generating innovation and 4.0 industry, expanding the research and development (R&D) role to that of technology-creator and supplier. University 4.0 [
35] reflects the new role and expectations toward the HEIs responsible for DT and DR. The recent technologies demand an innovative environment and highly skilled personnel.
HEIs are also responsible for problem solving, orienting businesses toward digitalization and providing adequate teaching programs, according to the criteria of DT. Using appropriate digital tools, they can contribute significantly to digital innovation and transformation [
36]. HEIs are considered the leading drivers in the digital economy, knowledge production and innovation; their role is best analyzed using 3Helix, 4Helix and 5Helix frameworks [
37].
Weller and Anderson [
38] show the digital resilience of higher education and evaluate the HEIs’ adaptation to the challenges and the needs. Their conclusion is quite simple: a resilient organization entails strength and weakness identification and adoption of the proper responses [
38]. There are studies about the resilience of the students to the digital transformation, and they are part of the HEIs’ digital resilience [
39]. The barriers to digital education were revealed; HEIs must consider the infrastructure (hard and soft) and skills they possess.
The recent digital transformation of HEIs are wide and deep, the challenges are multiple; they are pushed to do it faster than others to regain the leading position and to offer more digitally oriented learning [
40].
Innovation depends on technology, human capital, and information; HEIs are integrating these elements while serving as accelerators of technological management on a 4Helix model [
41]. The 4Helix model is used by Aggarwal and Sindakis [
42] to determine the regional influence of innovation as does Steenkamp [
43], for Industry 4.0.
Eco-innovation and smart specialization in Italy were analyzed by Dileo and Pini [
44], using a 4Helix model to evaluate the contribution of the HEIs and government and to identify the differences at the regional level. Their findings show the importance of cooperation and geographical factors. Lew and Park [
45] explored the N-Helix model for regional innovation and the evolution of the literature, concluding that the models evolved but still explained regional innovation systems. The study by Nordberg [
46] argues that the non-university regions can also exploit innovative growth and that the alteration of 4Helix can facilitate it.
Regional innovation systems are explored by other studies using 4Helix models [
47,
48,
49,
50]. The synergy of knowledge transfer highlighted the regional patterns of European countries [
51] and demonstrated the learning processes in regional innovation [
52]. Two essential research directions appeared: the 4Helix models in regional innovation systems and the DR in the HEIs or higher education systems, as leading organizations of DT, innovation, knowledge transfer, etc.
Based on the previous studies about the regional role of HEIs, knowledge transfer and learning processes [
46,
51,
52] and the innovation studies [
47,
48,
49,
50] that used the 4Helix model, we appreciate that a 4Helix model is the best way to measure the DR led by HEIs. Another argument was the compatibility between the 4Helix framework (economy, society, education, government) and the sustainable development indexes (digital economy performance, regional and individual wealth, social digital use, social digital connectivity) we considered essential in measuring the DT. The identified gaps in the literature we are addressing are the regional patterns of HEIs contribution to DR and innovation transfer to the business environment. The research hypotheses are:
H1. There are spatial 4Helix models that generate regional digital resilience in Romania; and.
H2. HEIs adopt the new normal digital education.
3. Research Methodology
Our methodology approach considers that the spatial 4Helix models generate regional digital resilience as a positive externality of the HEIs’ internal adoption of the ‘new normal’ digital education. Based on the rich literature findings, we forecast HEI digital education adoption only if its output is regional-resilient. The result is a 4Helix model classification using the digital resilience of regions (NUTS2) from the perspective of universities’ spatial distribution at the county level (NUTS3).
To address the objective of the present study and identify the 4Helix models characterized by the contribution of higher education to regional digital resilience, we used three levels of methodology:
MI—Mapping the spatial distribution of universities at the county level in Romania. The objective is to evaluate the spatial distribution of the universities across Romania and obtain an Exploratory Spatial Data Analysis (ESDA) representation.
MII—Calculating the dynamic and static digital resilience of regional labor markets in the context of the 4Helix theory. Its objective is to evaluate and generate an index of the static and dynamic digital resilience in the regional labor market in Romania.
MIII—Identifying and profiling the 4Helix spatial models of digital resilience of regions from the perspective of Romanian university distribution. The aim is to identify and create the regional integrated 4Helix models for Romania and answer the research questions. The 4Helix models of regional digital resilience from the perspective of the HEIs contribution will be generated by overlaying maps of static and dynamic resilience dimensions using the university distribution map.
3.1. MI—The Methodology for Mapping the Spatial Distribution of HEIs at the County Level in Romania
The present study used the techniques of spatial analysis or the “Choropleth map” through classification in Jenks’ natural breaks of software, namely Arc GIS 10.2.3. Within the family of ESDA, the Choropleth maps (percentile, box, cartogram, hinge) are basic instruments to generate synthetic images using data geo-visualization [
53]. Widely used in GIS packages, Jenks natural breaks are forms of variance-minimization classification. The intervals are usually unequal, and they are selected at separate values, where substantial changes in value occur. They can be significantly affected by the number of classes selected and tend to have unusual class limits. The method applied dates to Jenks [
54] and Caspall [
55], who follow Fisher [
56] and were updated by De Smith, Goodchild and Longley [
57].
A prominent issue in spatial analysis is the classification scheme chosen to assign on a map the values from a continuous field to the polygons that represent the regions. Univariate classification schemes used in GIS are based on Harvey’s [
58] theory of classification in a spatial context, Mitchell [
59] and Longley et al. [
60]. In this context, classification is a basic ordering procedure, which is important both as an objective and as a method.
The Jenks natural breaks algorithm follows 4 steps:
- (a)
Step 1—An attribute “x” is used for classification and the needed number of breaks “k”;
- (b)
Step 2—A set of k-1 random or uniform values are generated in the interval (min {x}, max {x}). These are used as initial class boundaries;
- (c)
Step 3—Mean values are calculated for each initial class and the sum of the squares of the deviations. The sum of squared deviations (STSd) is recorded;
- (d)
Step 4—The iterative process is performed until the STSd falls below a limit, when the variation inside the classes is minimized and that between them is maximized. The optimization could demand several repetitions before the process is finalized.
The Jenks optimization process, also known as the “goodness of the variance fit” (GVF), is achieved when GVF is maximized, per De Smith, Goodchild and Longley [
57].
where GVF represents the variance fit description with values between 0 (perfect mismatch) and 1 (perfect fit).
SDBC—sum of squared deviation between classes—to be maximized
SDAM—sum of squared deviation array mean—to be minimized
SDCM = SDAM − SDBC; sum of square deviation from the class means.
The specific characteristic of this algorithm is given by the optimization of the intervals established for the clustering by statistical methods, which is based on reducing the variance within the class and maximizing the difference between the classes [
61]. The visual result of this method is represented by the graphics of the statistical information from the socio-economic field, which are vectored spatially.
The number of universities surveyed was the synthetic indicator for mapping the spatial distribution at the county level in Romania (
Table 1). Data were extracted from the Territorial Observatory of MDRAP portal [
62], Indicator V_SCL_UAT_412 SCL101C INS—TEMPO 2019 Domain: 4. Infrastructure and social services, Subdomain: 4.1. Education, Indicator 4.1.2. Number of public/private universities.
3.2. MII—Methodology for Calculating the Dynamic and Static Digital Resilience of Regional Labor Markets in the Context of the 4Helix Theory
This methodological level aims to evaluate and calculate the static and dynamic digital resilience in regional labor markets in Romania.
The model for analyzing the dynamics of business sectors from the perspective of resilience to disruptive factors (ESDA analyses) uses multi-criteria spatial analysis, incorporating multi-weighted entropic and dynamic factors.
Multi-criteria spatial analysis is the determination of indexes for multi-dimensional measurement using the method for multi-criteria decision making (MCDM). In this analysis, indexes that reflect different dimensions such as economic, social, technical, environmental, political data, etc. are represented in independent maps called layers. These maps can be overlaid, the result being enriched with new useful information for the decision maker or other consumers, according to Rikalovic et al. [
63].
Zhang et al. [
64] propose the method of summing up the indexes with multi-weighted resilience criteria by using, in addition to the weights of the informational entropy, a time series that describes the factors that influence the resilience of economic sectors at the county level.
3.2.1. The Conceptual Framework of the Assessment of Dynamic and Static Digital Resilience at the Level of Regional Labor Markets in the Context of 4Helix
To create the conceptual framework of the study in the context of 4Helix theory, we linked the components of the system with dimensions of dynamic digital resilience (see
Table 2).
The resilience of regional labor markets is heterogeneous and variable over time. In this study, we propose the measure of total dynamic resilience for each labor market at the regional level in Romania between 2008 and 2021 as a synthesis of four characteristics/dimensions.
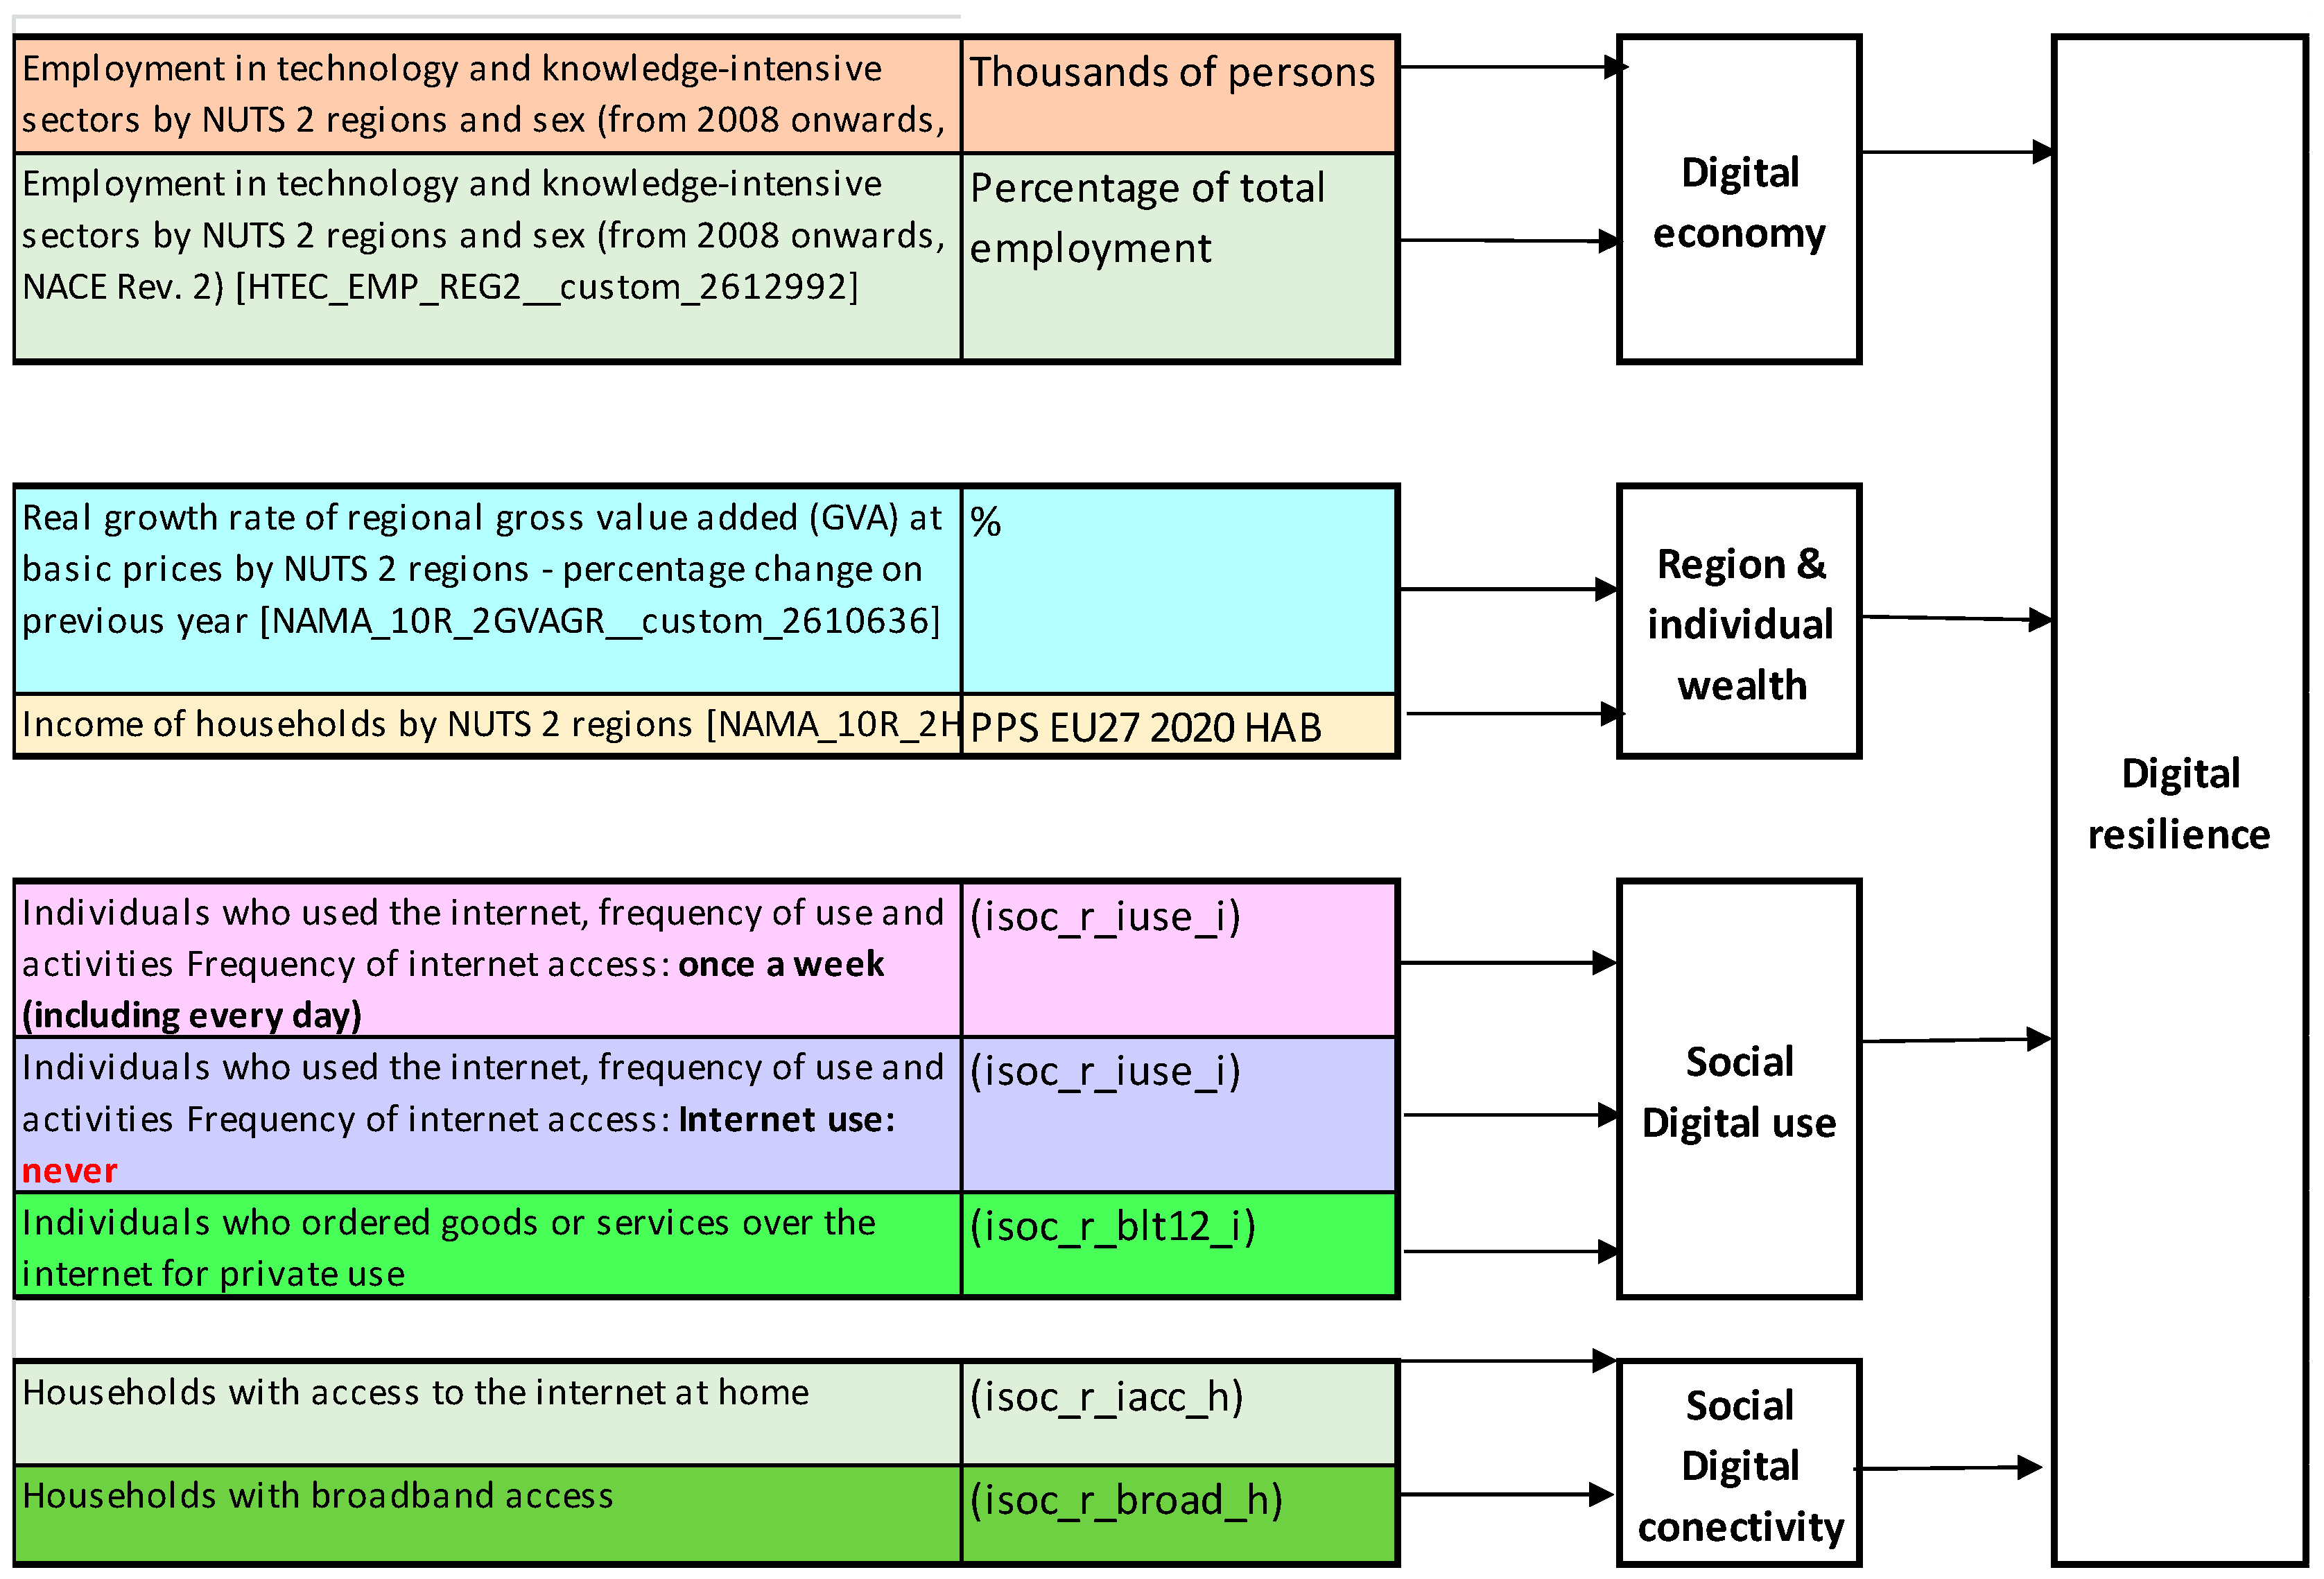
The Digital Dynamic Resilience Index (DDR) is using the following sub-indexes:
S1—Digital Economy Performance;
S2—Regional and Individual Wealth;
S3—Social Digital Use;
S4—Social Digital Connectivity.
Figure 1 presents the conceptual blocks and the variables used.
3.2.2. Methodology for Computing Dynamic and Static Digital Resilience of Regional Labor Markets
- (a)
Employment in technology and knowledge-intensive sectors (HTC) as main measure of digital economy at regional level
The data source is Eurostat. The model used data for:
i—Romanian regions, numbered from 1 to 8;
m—number of options—42, respectively, the county numbers, NUTS 3;
k frontier = 1/ln m;
number of sectors: 1 sector HTC;
j—number of criteria 9:
- ○
Desirable criteria 8, positive and large values are desirable; they are standardized with the formula:
- ○
Undesirable criteria 1, negative and small values are undesirable; they are standardized with the formula:
In this study, we adapt the methodology developed by Zang et al. [
64] for the assessment of the resilience of cities in the case of the assessment of the resilience of regional labor markets at the level of the region (8 NUTS2 regions). The determination of the weights is calculated objectively by statistical modeling and not subjectively, based on Delphi methods, as determined by experts. The novelty of the method is represented by the inclusion of time series weights alongside the weights determined by the entropy method. Time series weights capture the dynamic effects of time on the indicators used as criteria.
The evaluation of the weights of informational entropy for each criterion of the resilience of the economic sector eliminates the informational overlaps between the indicators and reflects the informational value of the indices. According to Zang et al. [
64], these weights—W
jt—are calculated in four steps:
W
jt represents the calculation of the weight of the indicator j in year t, the weights under the 2nd-order indexes, respectively, j under the 2nd-order indexes are represented in Equation (6).
where q is the number of under-indexes of 1st order.
The inclusion of dynamic aspects in the modeling is achieved by calculating the growth rate for each criterion expressed by the specific indicator, during the analyzed period 2008–2021. The national growth rate for the entire period is broken down at the annual and county level. Thus, the greater the weight of Wt, the greater the contribution of the criterion/factor in the resilience of the regional labor market. The same logic is applied if the level of the sector weights is lower; i.e., the lower the weight, the smaller the contribution of the factor in explaining the resilience of the regional labor market.
grot: the growth rate of criterion/factor j in alternative i in year t;
Gro: the national growth rate throughout the period 2008–2021;
Con
t: the contribution of the growth rate of criterion j on alternative i (county) in year t.
W
t represents the rate of the time series
The determination of the total weights W
j results from combining the weights of the informational entropy and the weights of the time series, according to Equation (9):
As a result of the pre-processing of the data, the Normalized Performance Decision Matrix is built. The indicators in
Table 1 are standardized by applying the formulas for desirable and undesirable processes. The calculation of the indices of the static resilience factors/criteria of the analyzed dimensions is carried out by weighting the Normalized Performance Decision Matrix with the W
ij weights:
The model to determine the resilience (of the 1st order) of the activity sector at the level of the region is calculated with Equation (14). This index is calculated by the method of summing the indices—multi-weighted of the factors/criteria of resilience of the economic sectors, as follows:
where q = 1–4, and q is the number of sub-indexes of first order
3.2.3. Description of the Indicators Used in the Methodology for Calculating Dynamic and Static Digital Resilience of Regional Labor Markets in the Context of the 4Helix Theory
To develop the model, we considered variables that can influence or provide information about the static and dynamic DR and the role of the HEIs in this process.
Table 3 presents the variables considered, which are included in the model as factors of influence and the time series available (2008 and 2021).
Table 4 presents a few more variables initially considered for the model but which were excluded because of lack of information and minimal relevance for the study.
Details about the data used in the model for the main indicators are presented in
Table 3 and
Table 4. The data used are from Eurostat, and the missing data management is presented in
Table A1,
Table A2,
Table A3,
Table A4 and
Table A5 in
Appendix A. The missing data were replaced with the estimated values obtained using linear regression.
3.3. MIII—The Methodology for Identifying and Profiling the 4Helix Spatial Models of Digital Resilience of Regions from the Perspective of Evaluating the Spatial Distribution of Universities—Romania
The 4Helix models for characterizing the digital resilience of regions from the perspective of evaluating the spatial distribution of universities were obtained by overlaying maps of static and dynamic resilience dimensions with the map of university distribution. In the case of simultaneous representation of disjoint characteristics of the same quantitative variable, we apply the same method used in [
65].
4. Results
4.1. Map of Universities’ Spatial Distribution in Romania
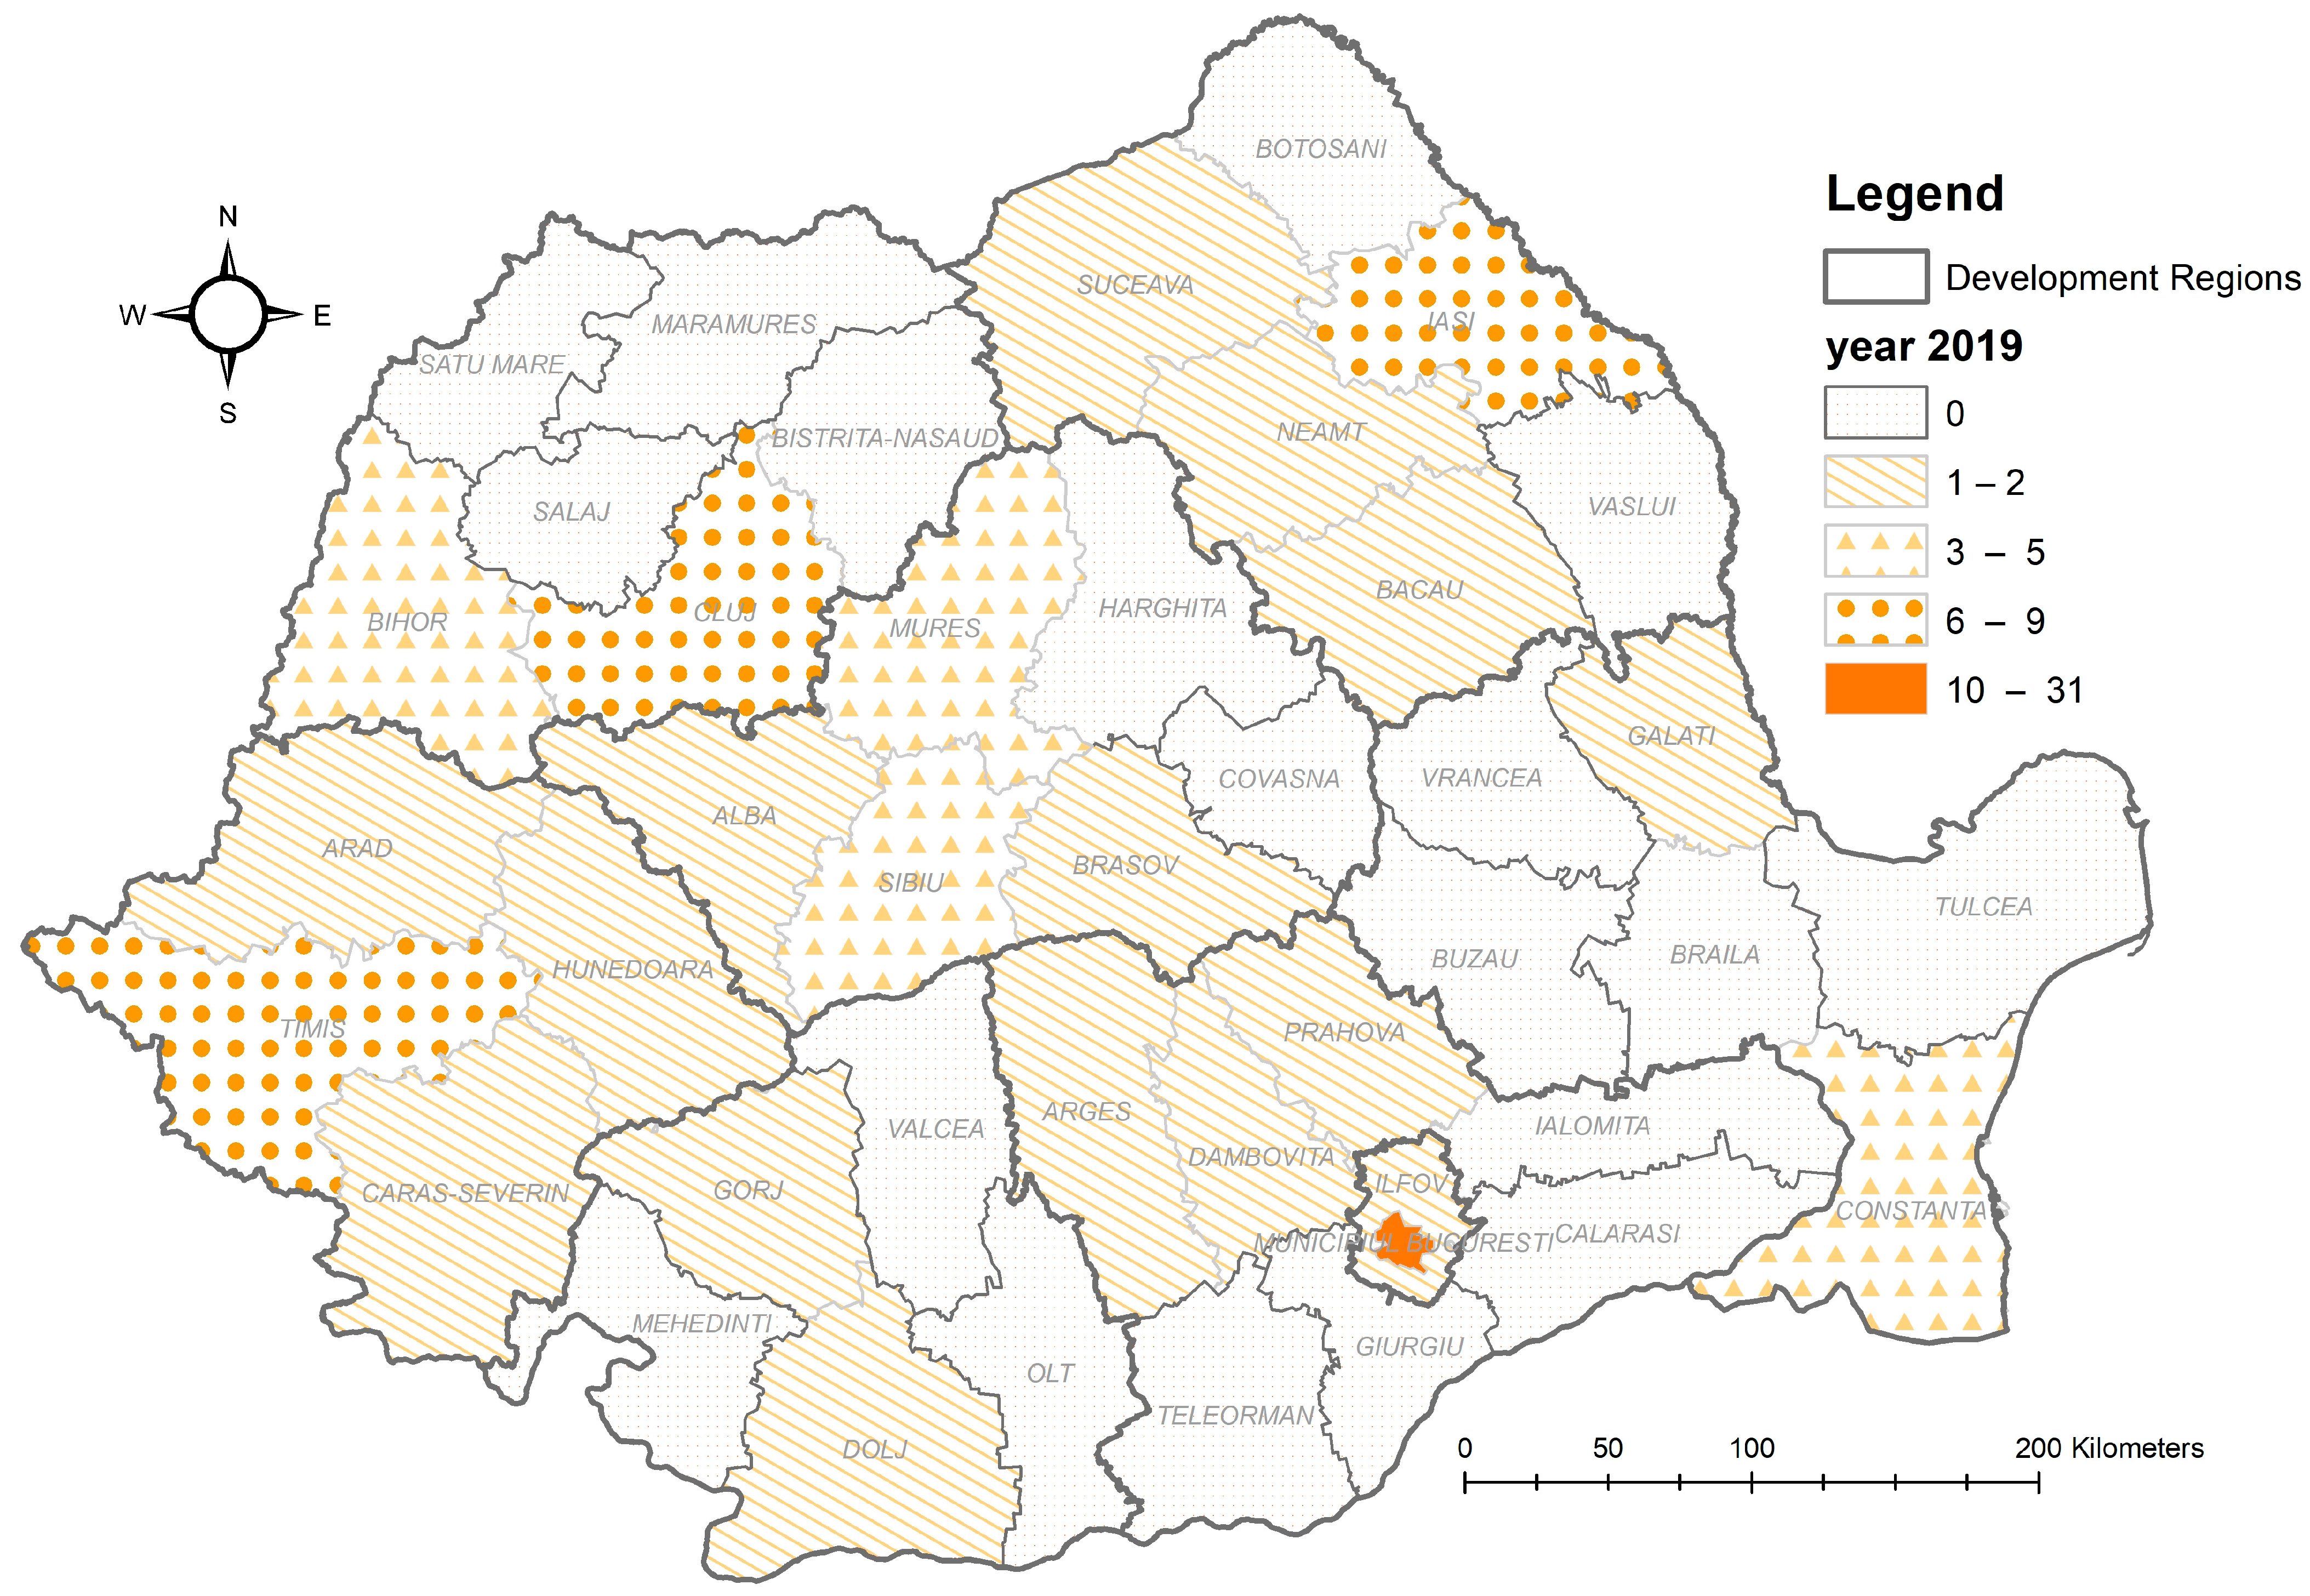
We identified five classes to optimize the spatial distribution of the higher education institutions (HEIs) at the county level in Romania, which are presented in
Figure 2.
There is a non-uniform distribution of HEIs at the NUTS3 level, the highest concentration being in Bucharest and Iasi, Cluj and Timis, which are the next three academic agglomerations. We should mention the presence of research institutes in these academic centers, which is known as the traditional location of the old universities. The gap between Bucharest and the next level is that of three times more universities in the country capital, which is explained by the history of education system development and the explosive demography and economy. Constanta, Bihor, Mures and Sibiu are on the third level (3–5 universities) mainly determined by the past high economic development. The first signal in regional distribution of HEIs in Romania is the concentration of the counties with 0 to 2 universities in the south and east disrupted by 3 poles of 26 compared with the central and west regions with 5 poles of 15. This non-uniform distribution can be addressed using the e-learning facilities [
66,
67] that were used during the COVID-19 pandemic, and it has to be kept and extended in the future as a stage of DT implementation.
Table 5 presents the distribution of the HEIs at the NURS2 level (development regions), giving a regional perspective. The West and Bucharest Ilfov regions do not have counties without HEIs, and they are considered as having total coverage compared with Sud—Muntenia, Sud Vest—Oltenia, Sud Est and Nord Vest with low coverage.
4.2. Analysis of 4Helix Spatial Models of Digital Resilience of Regions from the Perspective of Evaluating the Spatial Distribution of Universities—Romania
For a synthetic representation, we assigned ranks for indexes S1, S2, S3 and S4 and ranked them from the most important with 1st place to the least important with the nth place, using a step of 1. For equal values, we assigned an equal rank.
4.2.1. The 4Helix Effect in Business Use of Digital Opportunities
The sub-indexes of DDR Index S1—Digital Economy Performance is calculated using the employment in knowledge-intensive sectors and the share in total employment in these sectors. We consider them measurable indicators of “smart” jobs creation; they are strongly related to the DT.
Table 6 presents the results and interpretation of static and dynamic DR with effect on the economy.
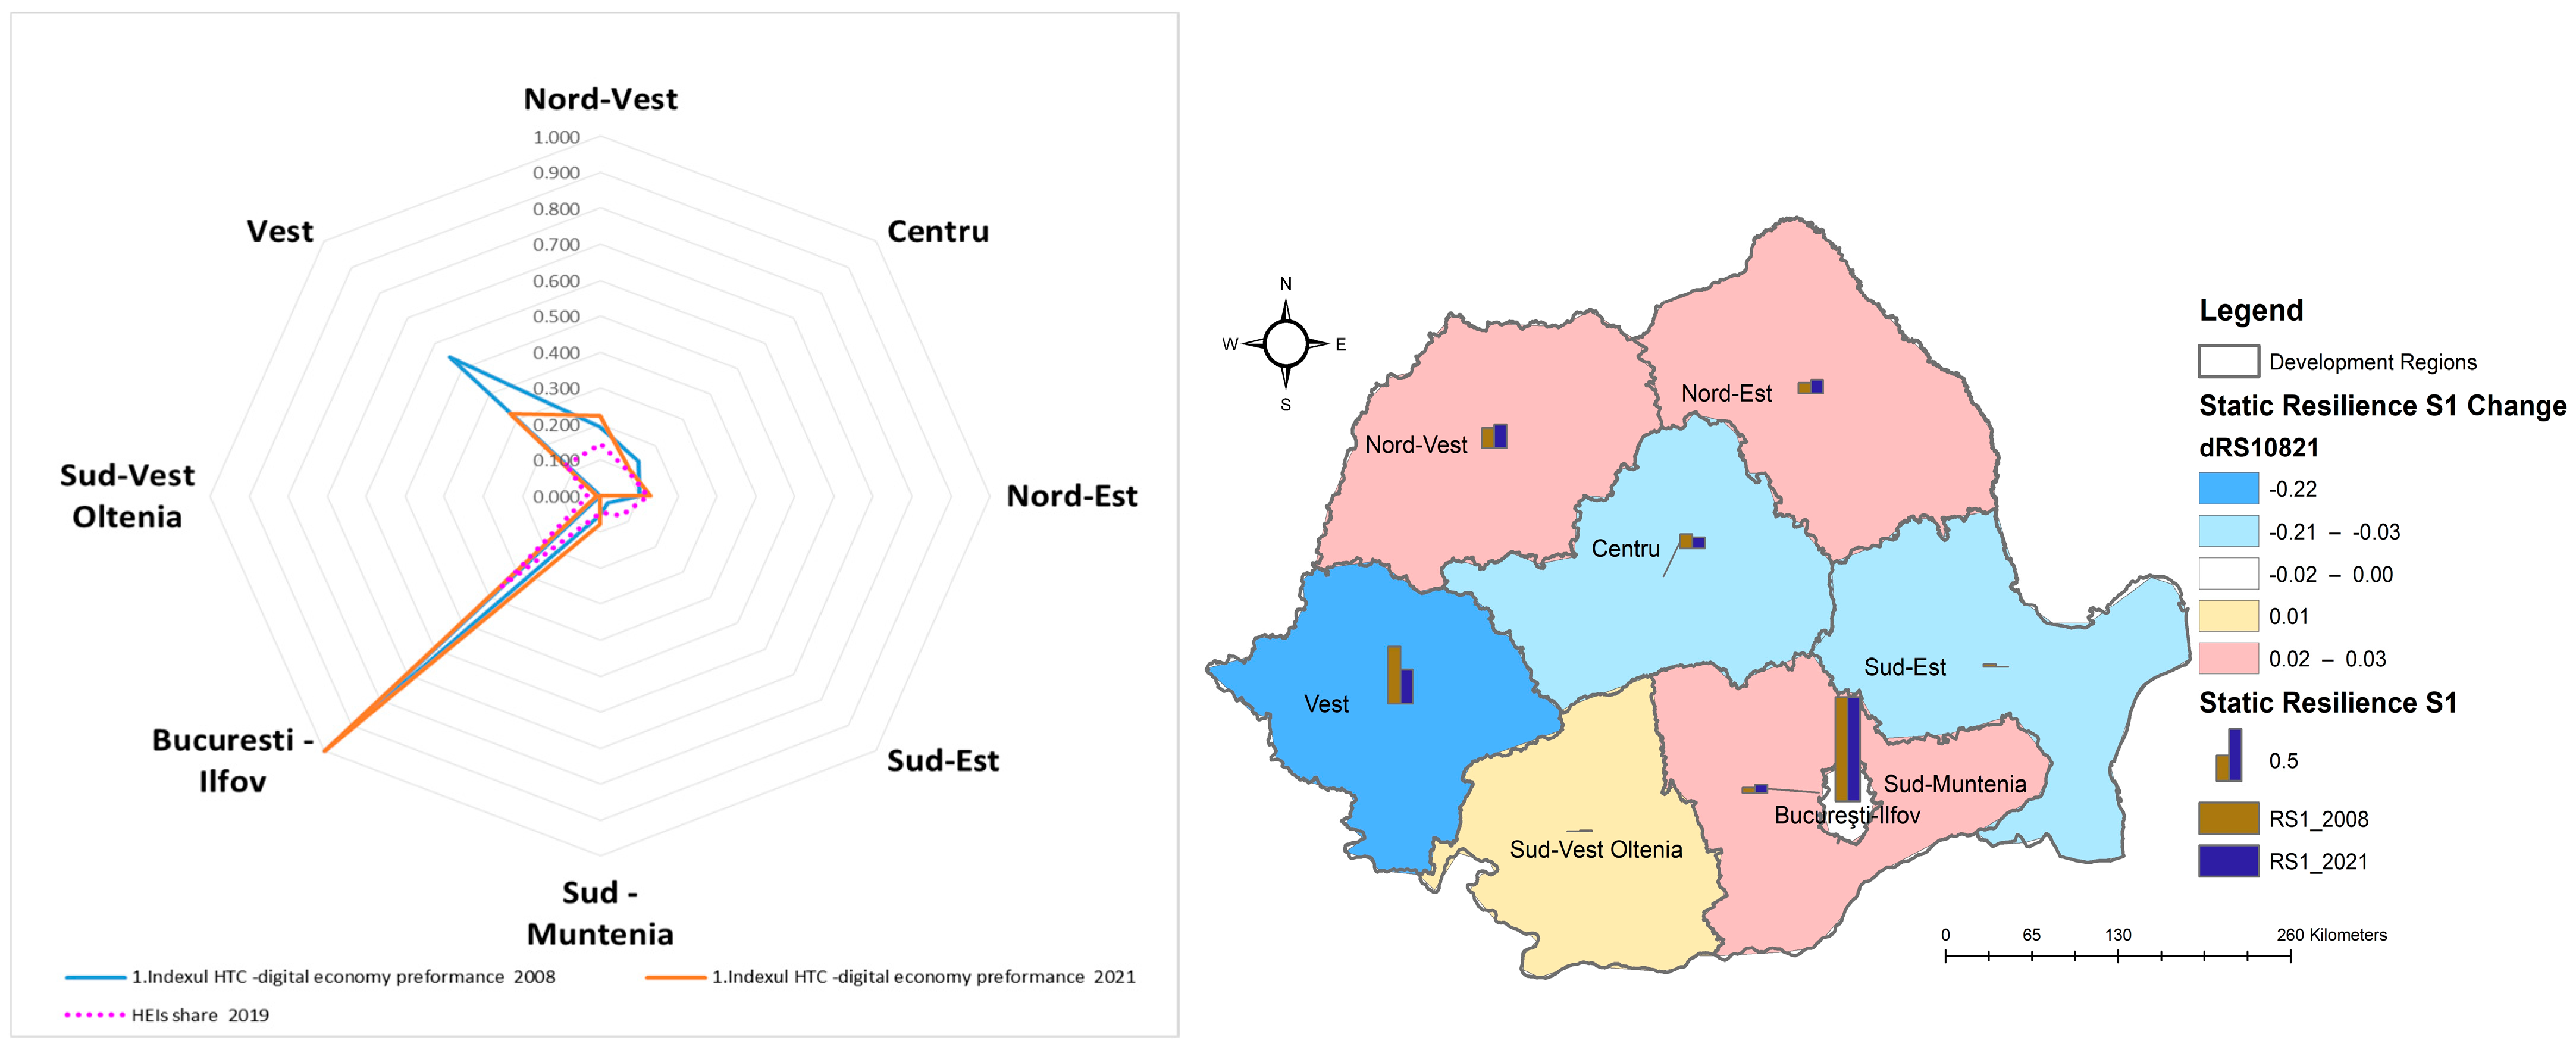
In
Figure 3, the comparative results for 2008 and 2021 are presented along with the forecast for the next 15 years. We can conclude that not all the regions exhibit positive effects of static and dynamic DR. On the contrary, some of them have developed economies and a consistent presence of knowledge-intensive sectors, as with Bucharest–Ilfov, which is at the top, compared to the other regions, but there is a tendency toward saturation or constriction. This can be a signal of a dysfunctional model: one that does not capture the gains to the real economy and to neighboring regions.
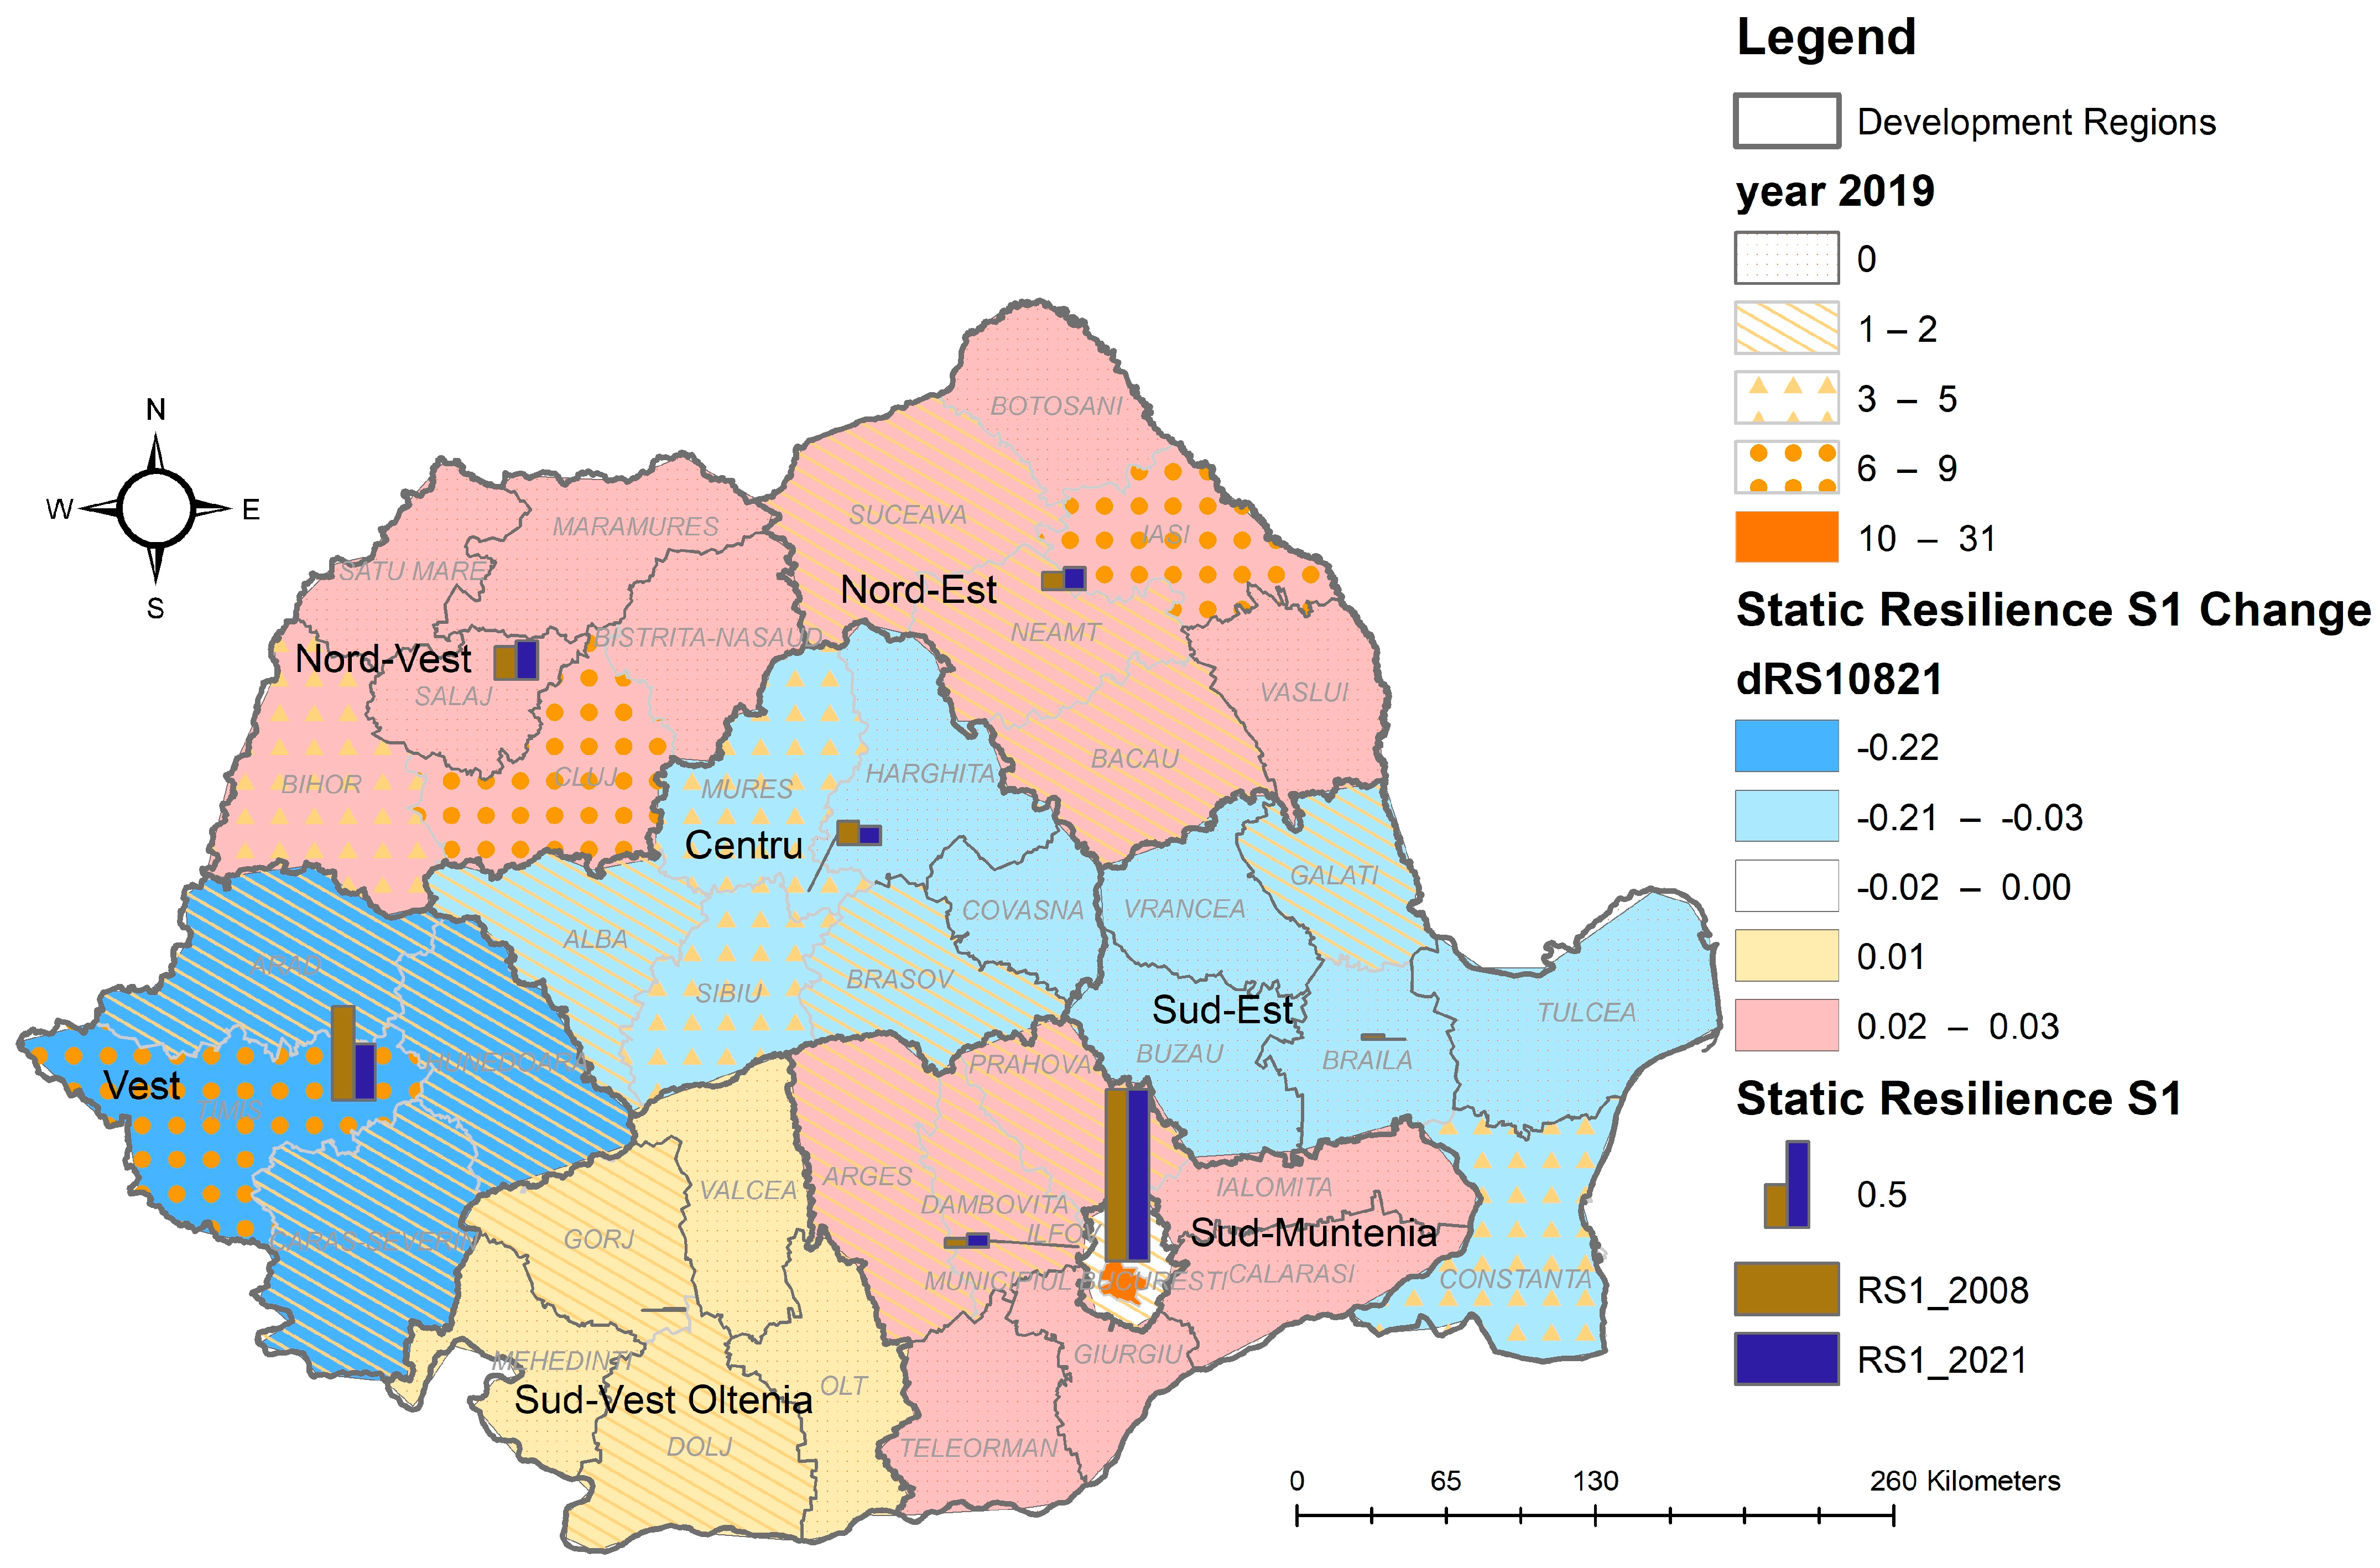
Figure 4 overlaps the distribution of the HEIs at the NURS2 level (
Figure 2) and the S1—Digital Economy Performance. The best results are recorded in Bucuresti—Ilfov and the Vest regions, showing the transfer to the economy of the DT. The Nord—Est and Nord—Vest and Sud—Muntenia regions, in terms of economic performance, have the best results. We appreciate that a positive change, even small, creates the prerequisite of a good externality from HEIs to business. Surprisingly, the Vest has the worst economic performance. This may be explained by the effect of the bordering Western economies. Bucuresti—Ilfov shows a slight decrease, and neighboring Sud—Muntenia is growing. This can be explained by the demand for resources by Bucuresti—Ilfov in the past, a stage of saturation, and the externalization process. The Sud—Est performance is low from both perspectives, which is probably due to lower potential and competing neighbors. The Constanta harbor does not seem to act as engine for DT performance even if transport is a knowledge-intensive sector [
68].
Our findings for S1—Digital Economy Performance are supported by the studies that highlighted the need for a digital economy [
9,
10,
11,
69,
70]. One of the most important concerns of the scientists was the reflection of the digital economy toward the performance of the companies, their finding confirming that a strong relation exists between them, and the acceleration of DT is contributing to the company’s performance no matter the domain [
71,
72,
73,
74,
75,
76,
77,
78,
79,
80]. We can appreciate that a first finding of our study reconfirms the importance of DT in DE, and our added value is that the DE performance is not similar across the regions in accordance with facilitator or blocking factors.
4.2.2. The 4Helix Effect on Poverty/Wealth Increase
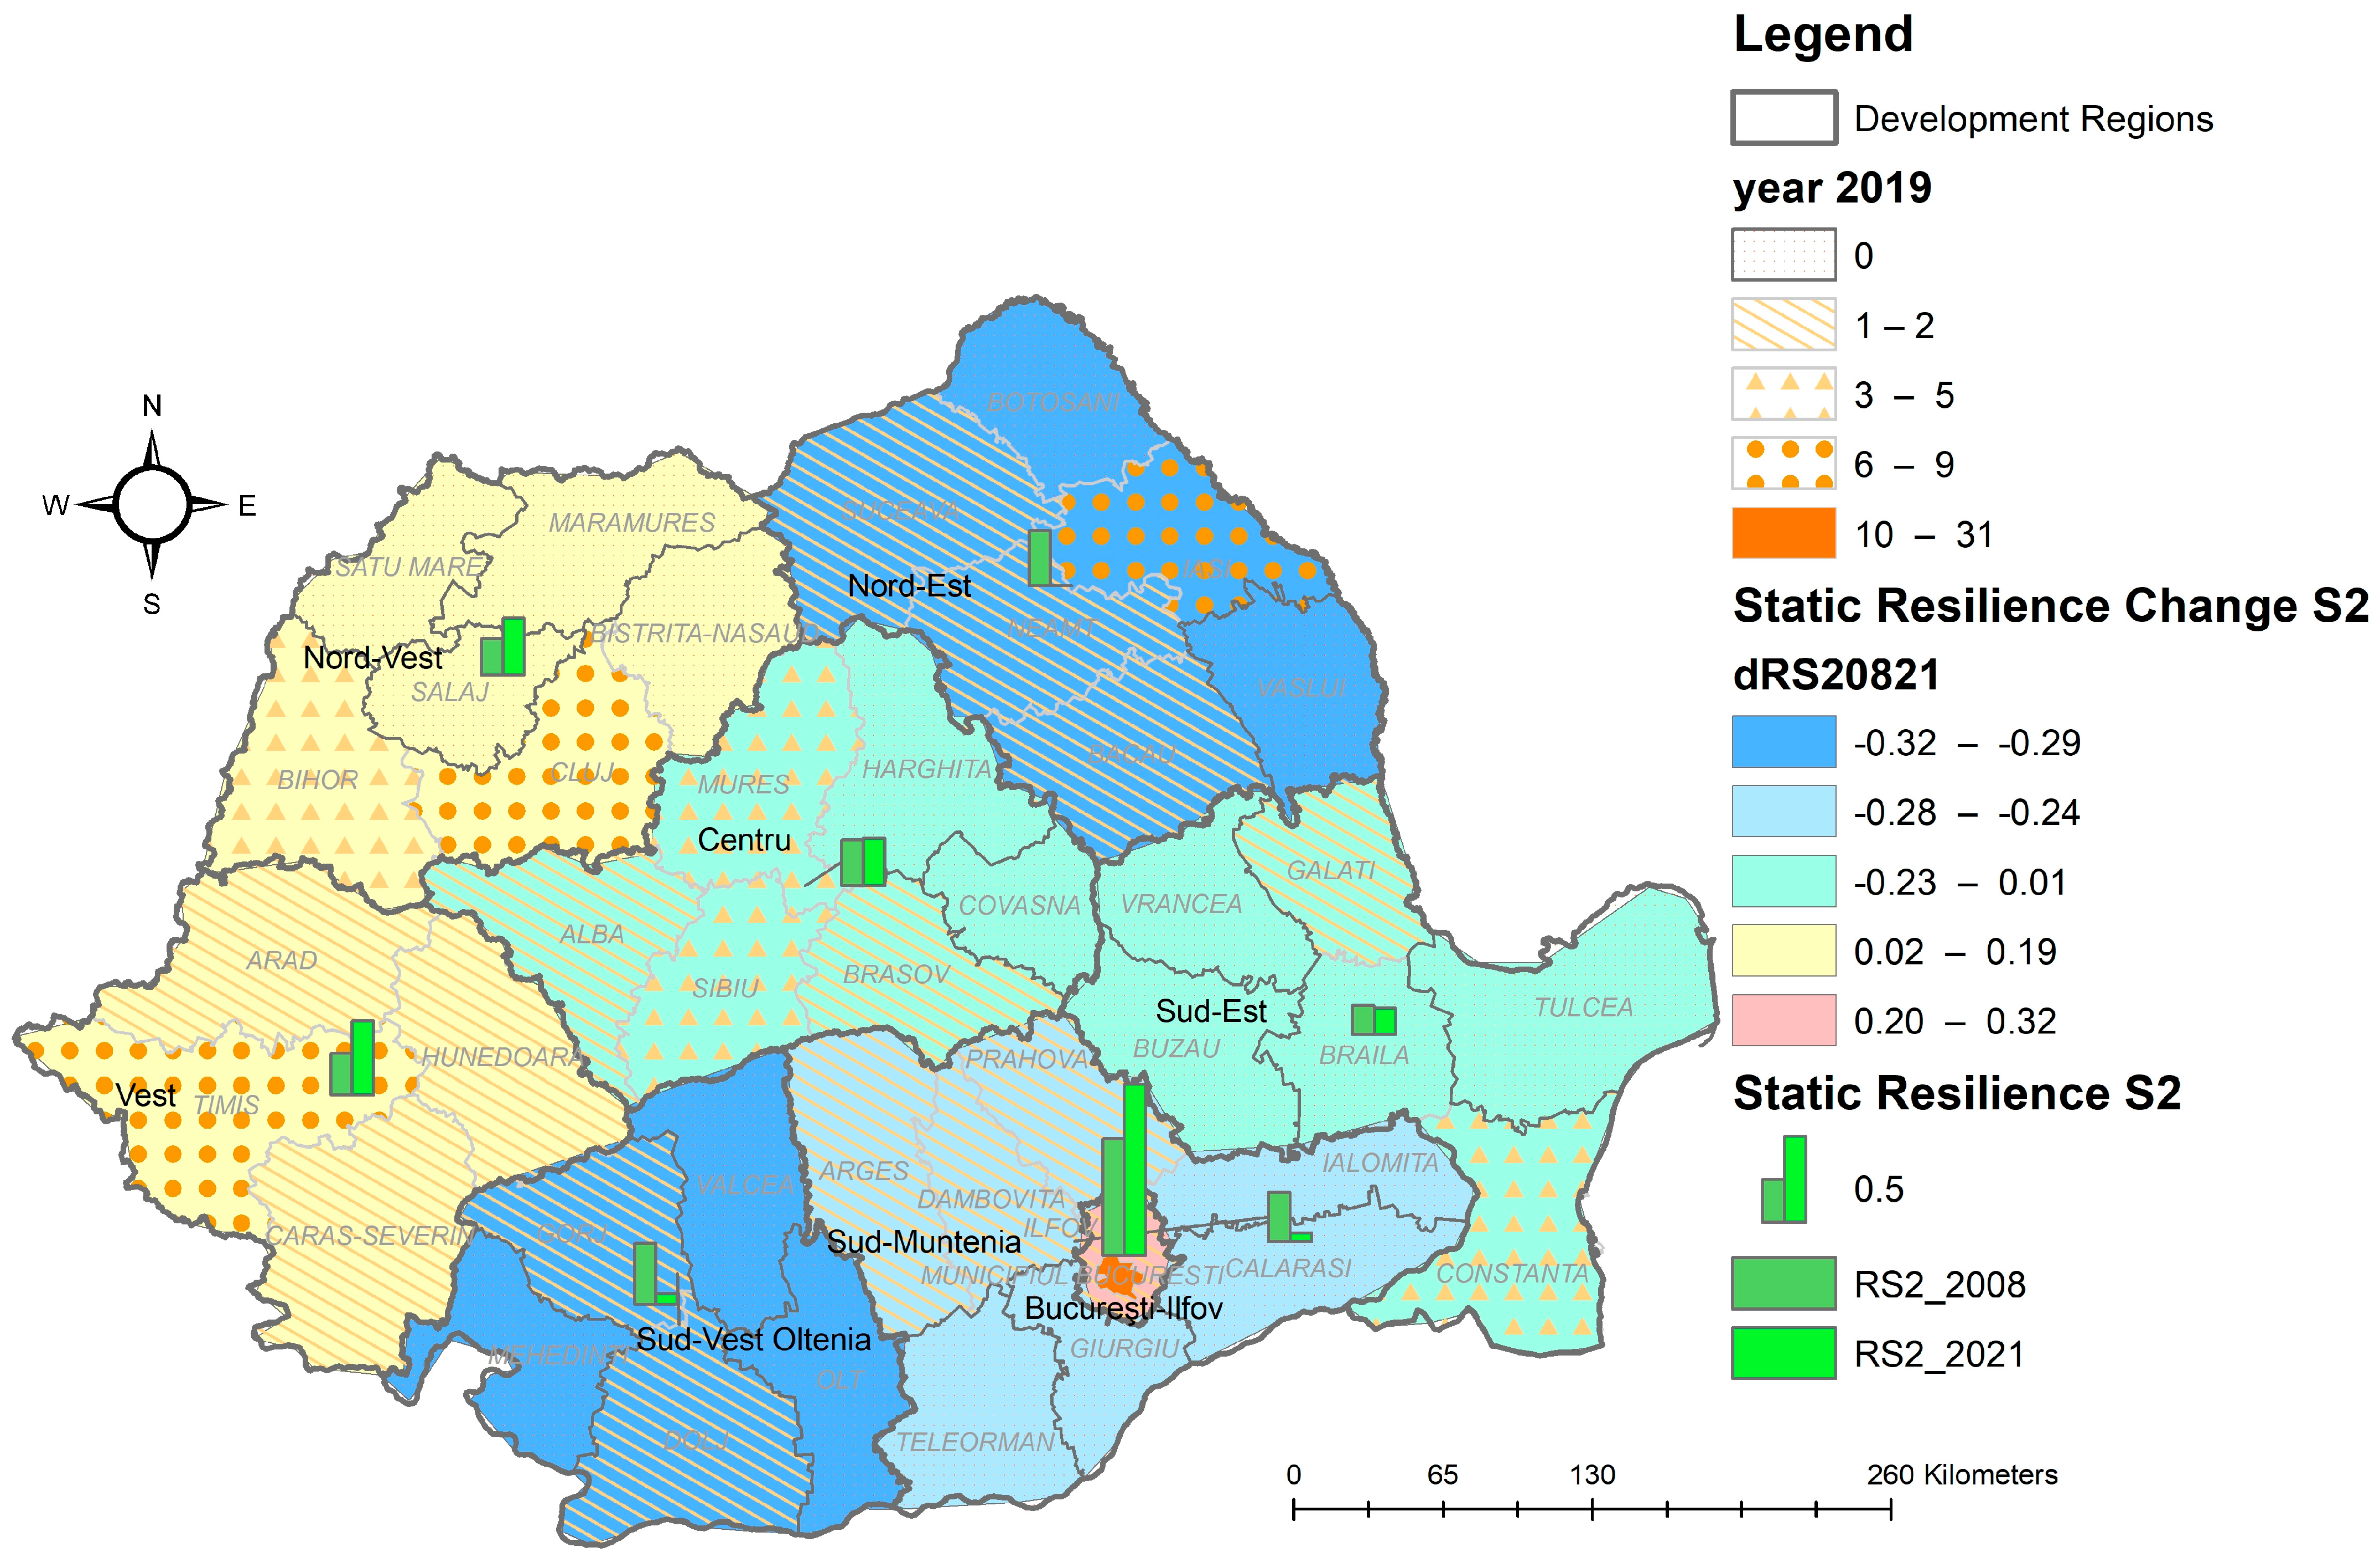
The second sub-index of DDR is S2—Regional and Individual Wealth, which is determined with the real growth rate of regional gross added value and income of households at the NUTS2 level.
Table 7 and
Figure 5 present the results.
Figure 6 represents regional and individual wealth at NUTS 2, which overlapped on the HEIs regional distribution. The best result is in—Bucuresti - Ilfov, and the trend is positive, but we cannot assign it entirely to DT, as it covers all the sectors, which are more or less digitalized. The second place belongs to the Vest and Nord-Vest regions, where prosperity is related to the higher economic development due to the connection with developed economies on the adjoining Western border. The Centru region has strong economic development, which is reflected in regional and individual wealth, but recent growth is low, and a stagnation or regression is possible. The Sud -Est region has similar economic behavior, which is probably sustained by Constanta harbor. The Sud Vest—Oltenia, Sud—Muntenia and Nord Est regions all registered a significant drop in economic development, which is higher than that of the Sud—Est region; all four regions suffered because of under-development and competition from stronger neighboring economies.
Regional and individual wealth is reflected in inequalities in education, lifestyle, health accessibility and rural–urban disparities or disparities between regions. The findings of the studies on inequalities and disparities show that there are plenty of factors that require action, and the main concern is to stimulate the economic growth in order to generate higher income and to create economic cohesion [
81,
82,
83,
84,
85,
86,
87,
88]. In our opinion, similar with those of [
12,
13,
14,
15,
23,
29,
30,
32], DT and existence of HEIs are increasing the potential of gaining regional and individual wealth.
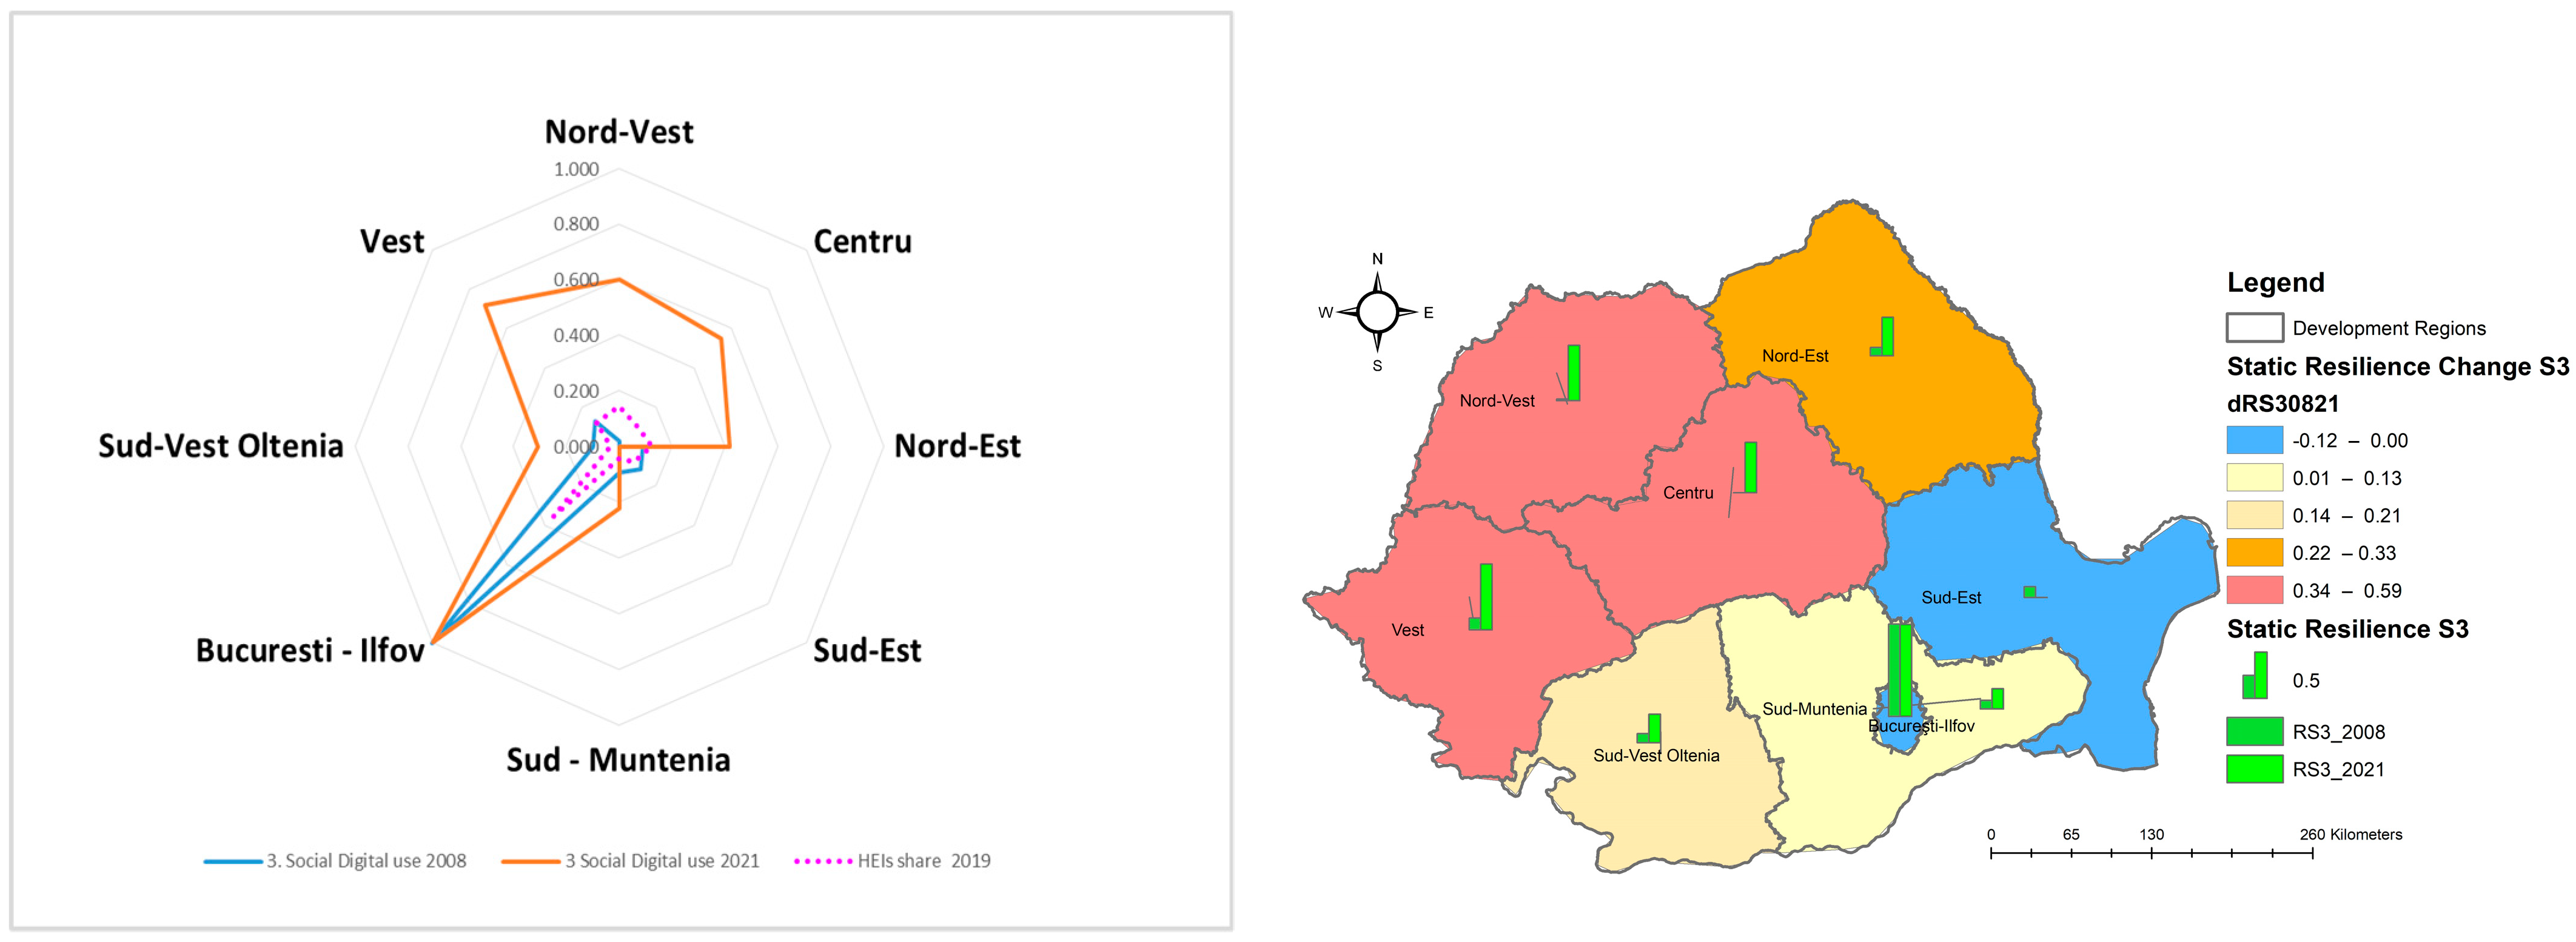
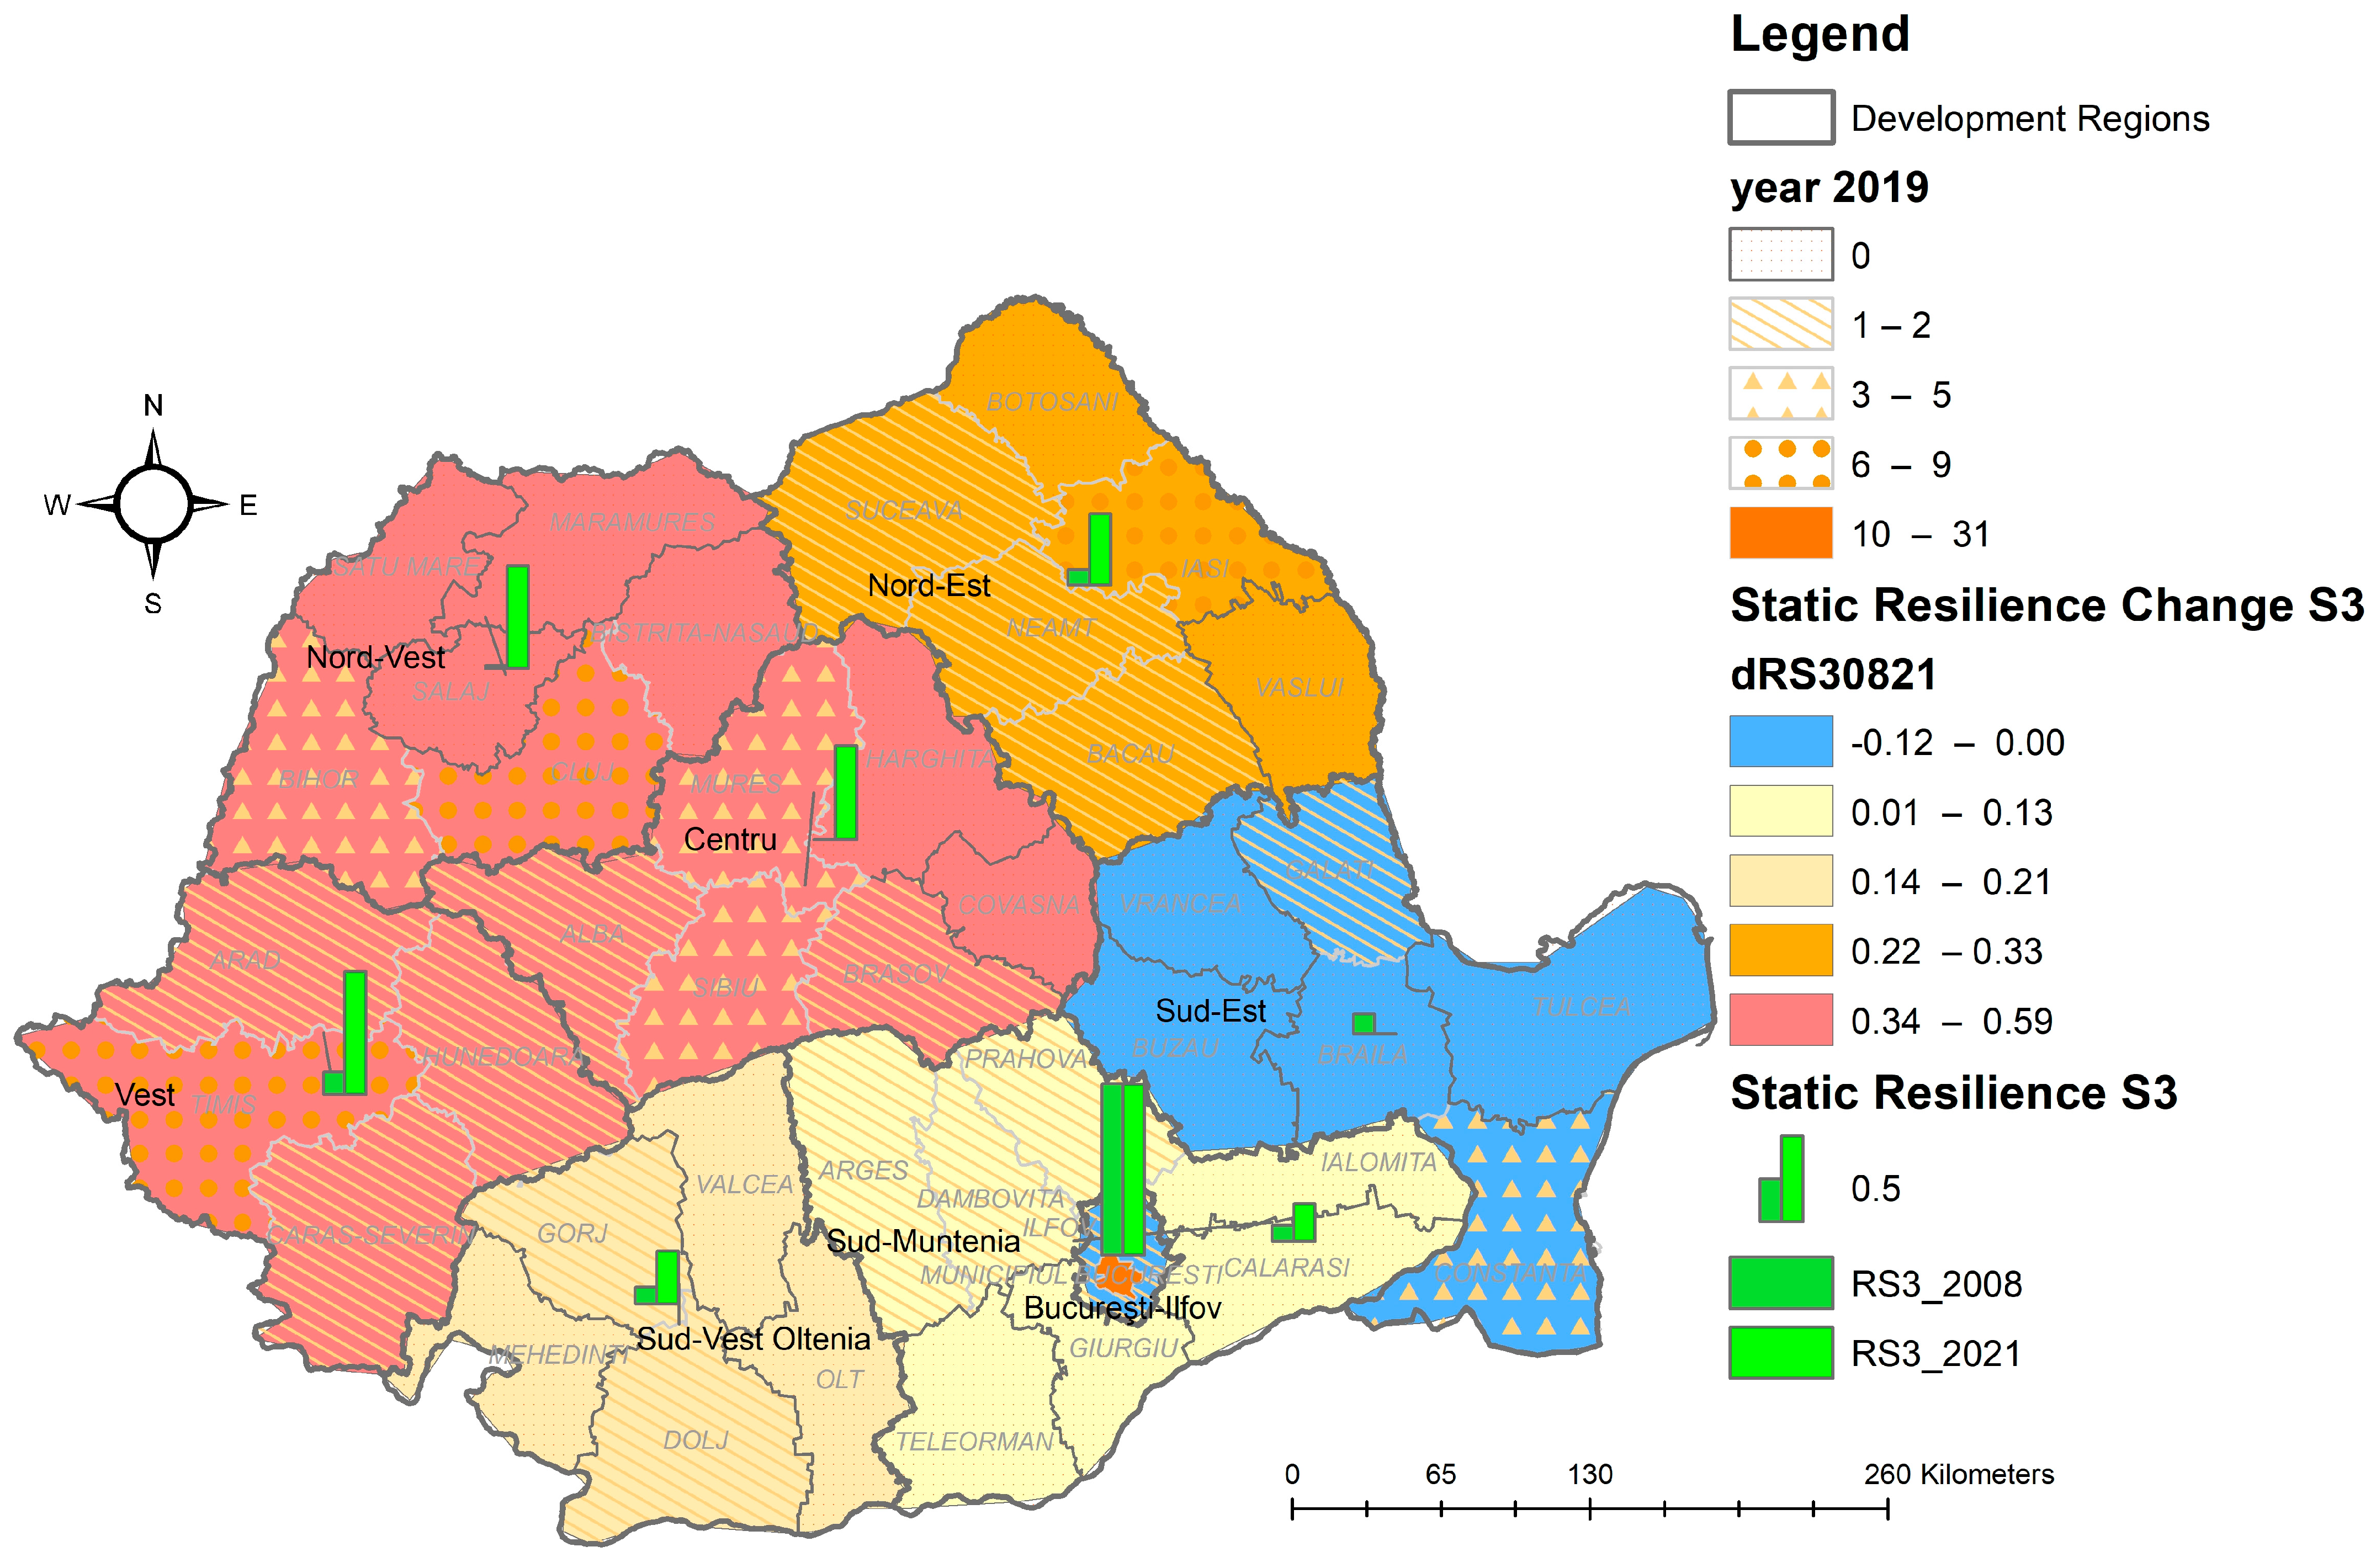
4.2.3. The 4Helix Effect on Digital Skills Use—Mainly for Consumption (E-Commerce)
The sub-indexes of DDR S3—Social Digital Use are measured based on the usage of internet (frequency) and e-commerce activity reflected in ordering goods or services for private use. The results are presented in
Table 8 and
Figure 7. The difference between 2008 and 2021 reflects the explosion of social digital use, especially in the north of the county. Unfortunately, the south has had less explosive development, and it has even had regression.
Figure 8 presents the overlapping of the social digital use on the HEIs regional distribution. The static resilience change for S3 is extremely high for the Vest, Nord-Vest and Centru regions and can be explained by the general economic development reflected in regional and individual wealth. With a relatively modern lifestyle, the individuals from the Vest and Nord-Vest regions are more connected to Western digital behavior. The results for the Nord—Est region show it is more connected to technology and knowledge-intensive sectors. The Centru region benefits from regional economic developments. The Sud est—Oltenia and Sud—Munetnia regions show positive change, but it is much smaller than that of other the counties. Unexpectedly, the Bucuresti—Ilfov and Sud—Est regions show negative change between 2008 and 2021. We can explain the change Bucuresti—Ilfov as being due to saturation, as it had several times higher social digital use in 2008 than other regions, but considering the COVID-19 effect, we expected a significant increase in digital use there.
Social digital use is considered one of the most important elements in measuring the digitalization even if it is measured as private–personal activity, but the digital knowledge developed could be used and transferred to the learning–teaching or economic activities [
2,
3,
4,
5,
6,
7,
16,
17,
18,
19]. The evaluation of social digital use and the impact on the education, well-being, companies’ performance, etc. shows correlations and synergies to be used for the benefit of individuals or organizations [
89,
90,
91,
92,
93,
94,
95,
96,
97,
98]. This comes to confirm the fact that the presence of HEIs and the social digital use by the young generation has a significant contribution to the DT.
It has to be mentioned that there is also a dark side of the social digital use [
99,
100,
101,
102] reflected in philological effects on the users, which is an aspect that is not considered by our study. Considering that we evaluate the social digital use in relation with the HISs, we presume that more educated persons will be taught about the risks and how to prevent or diminish them.
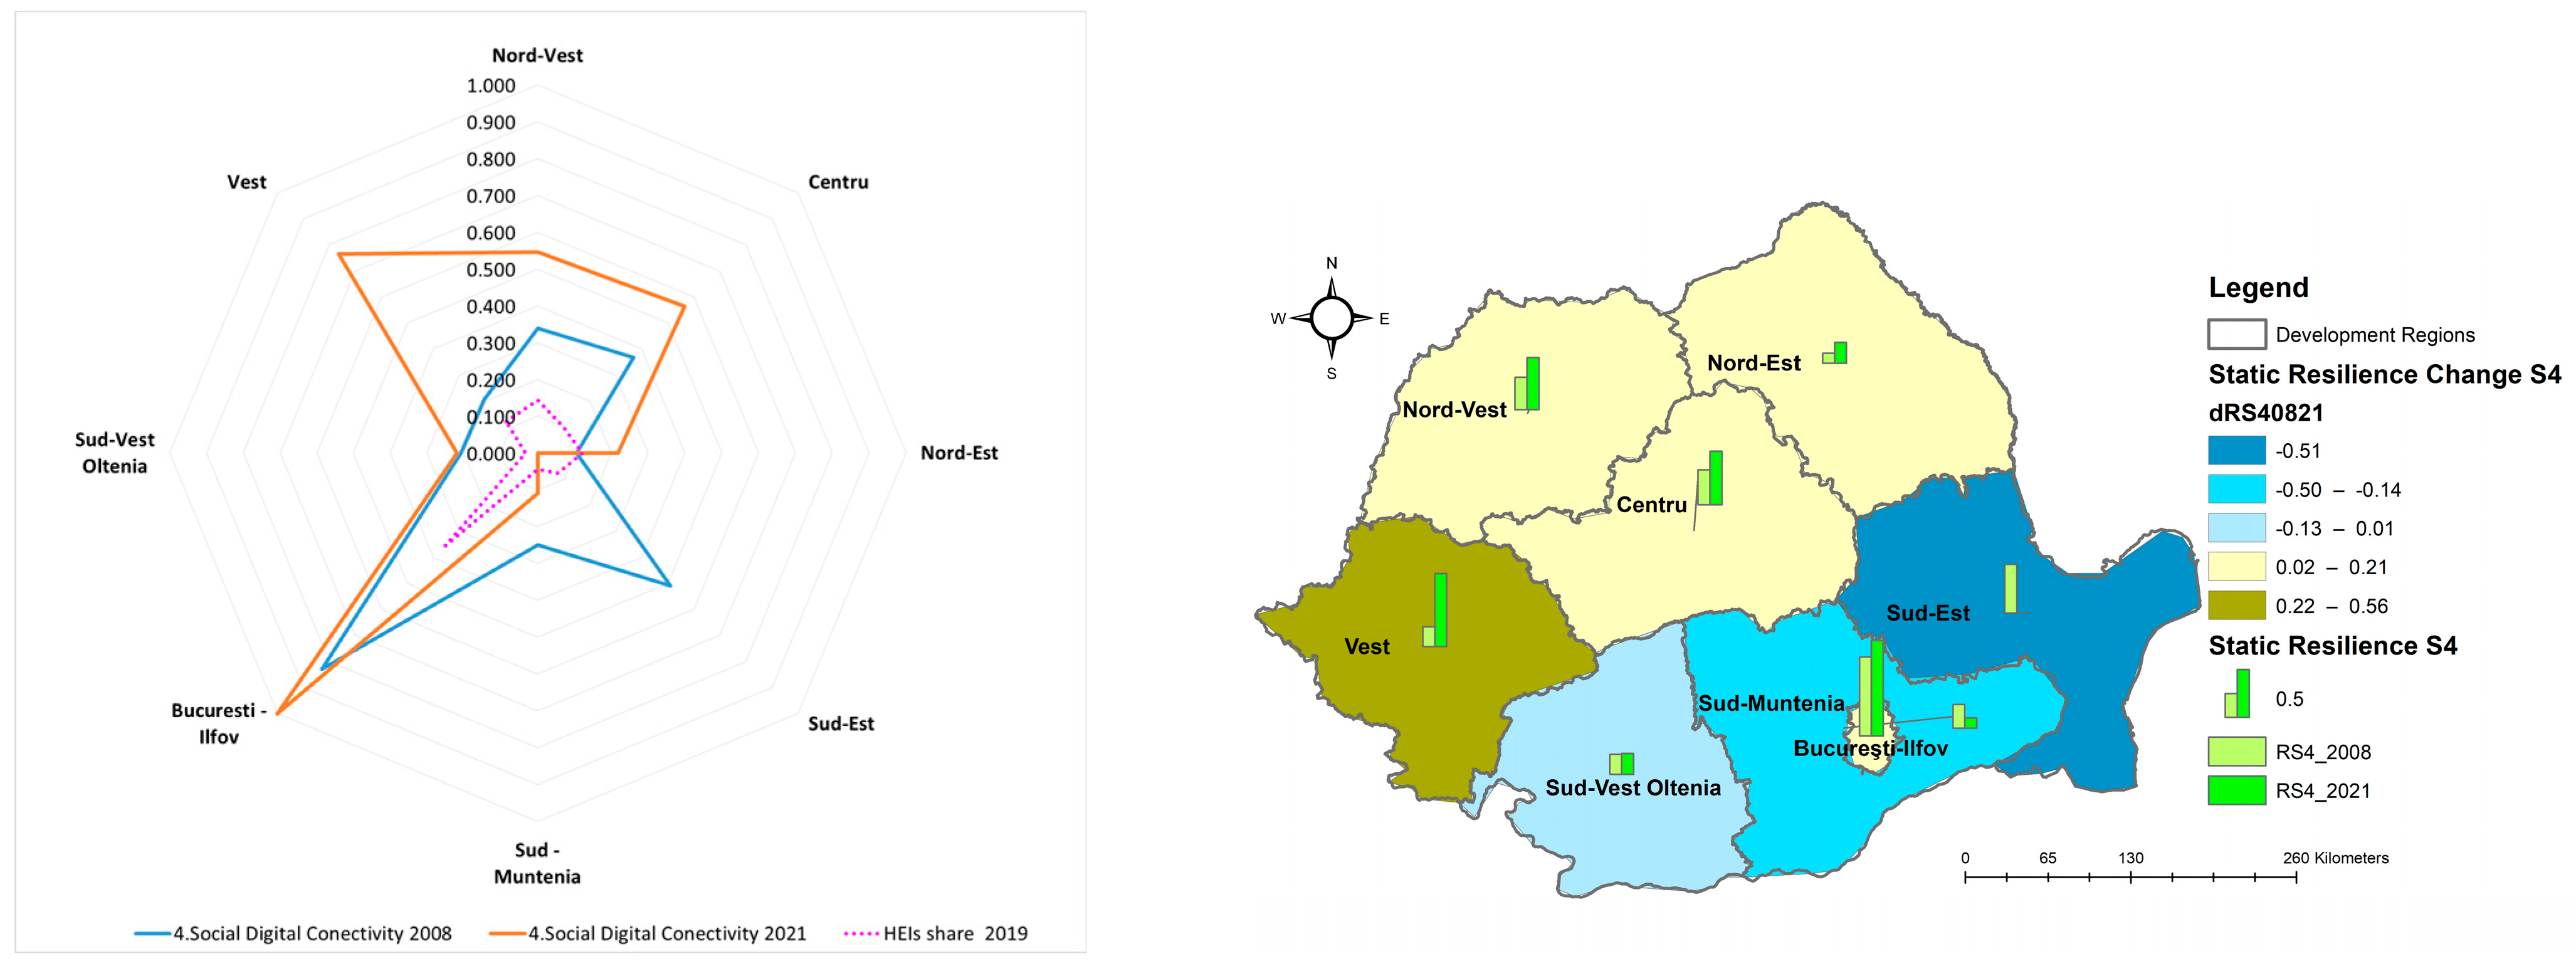
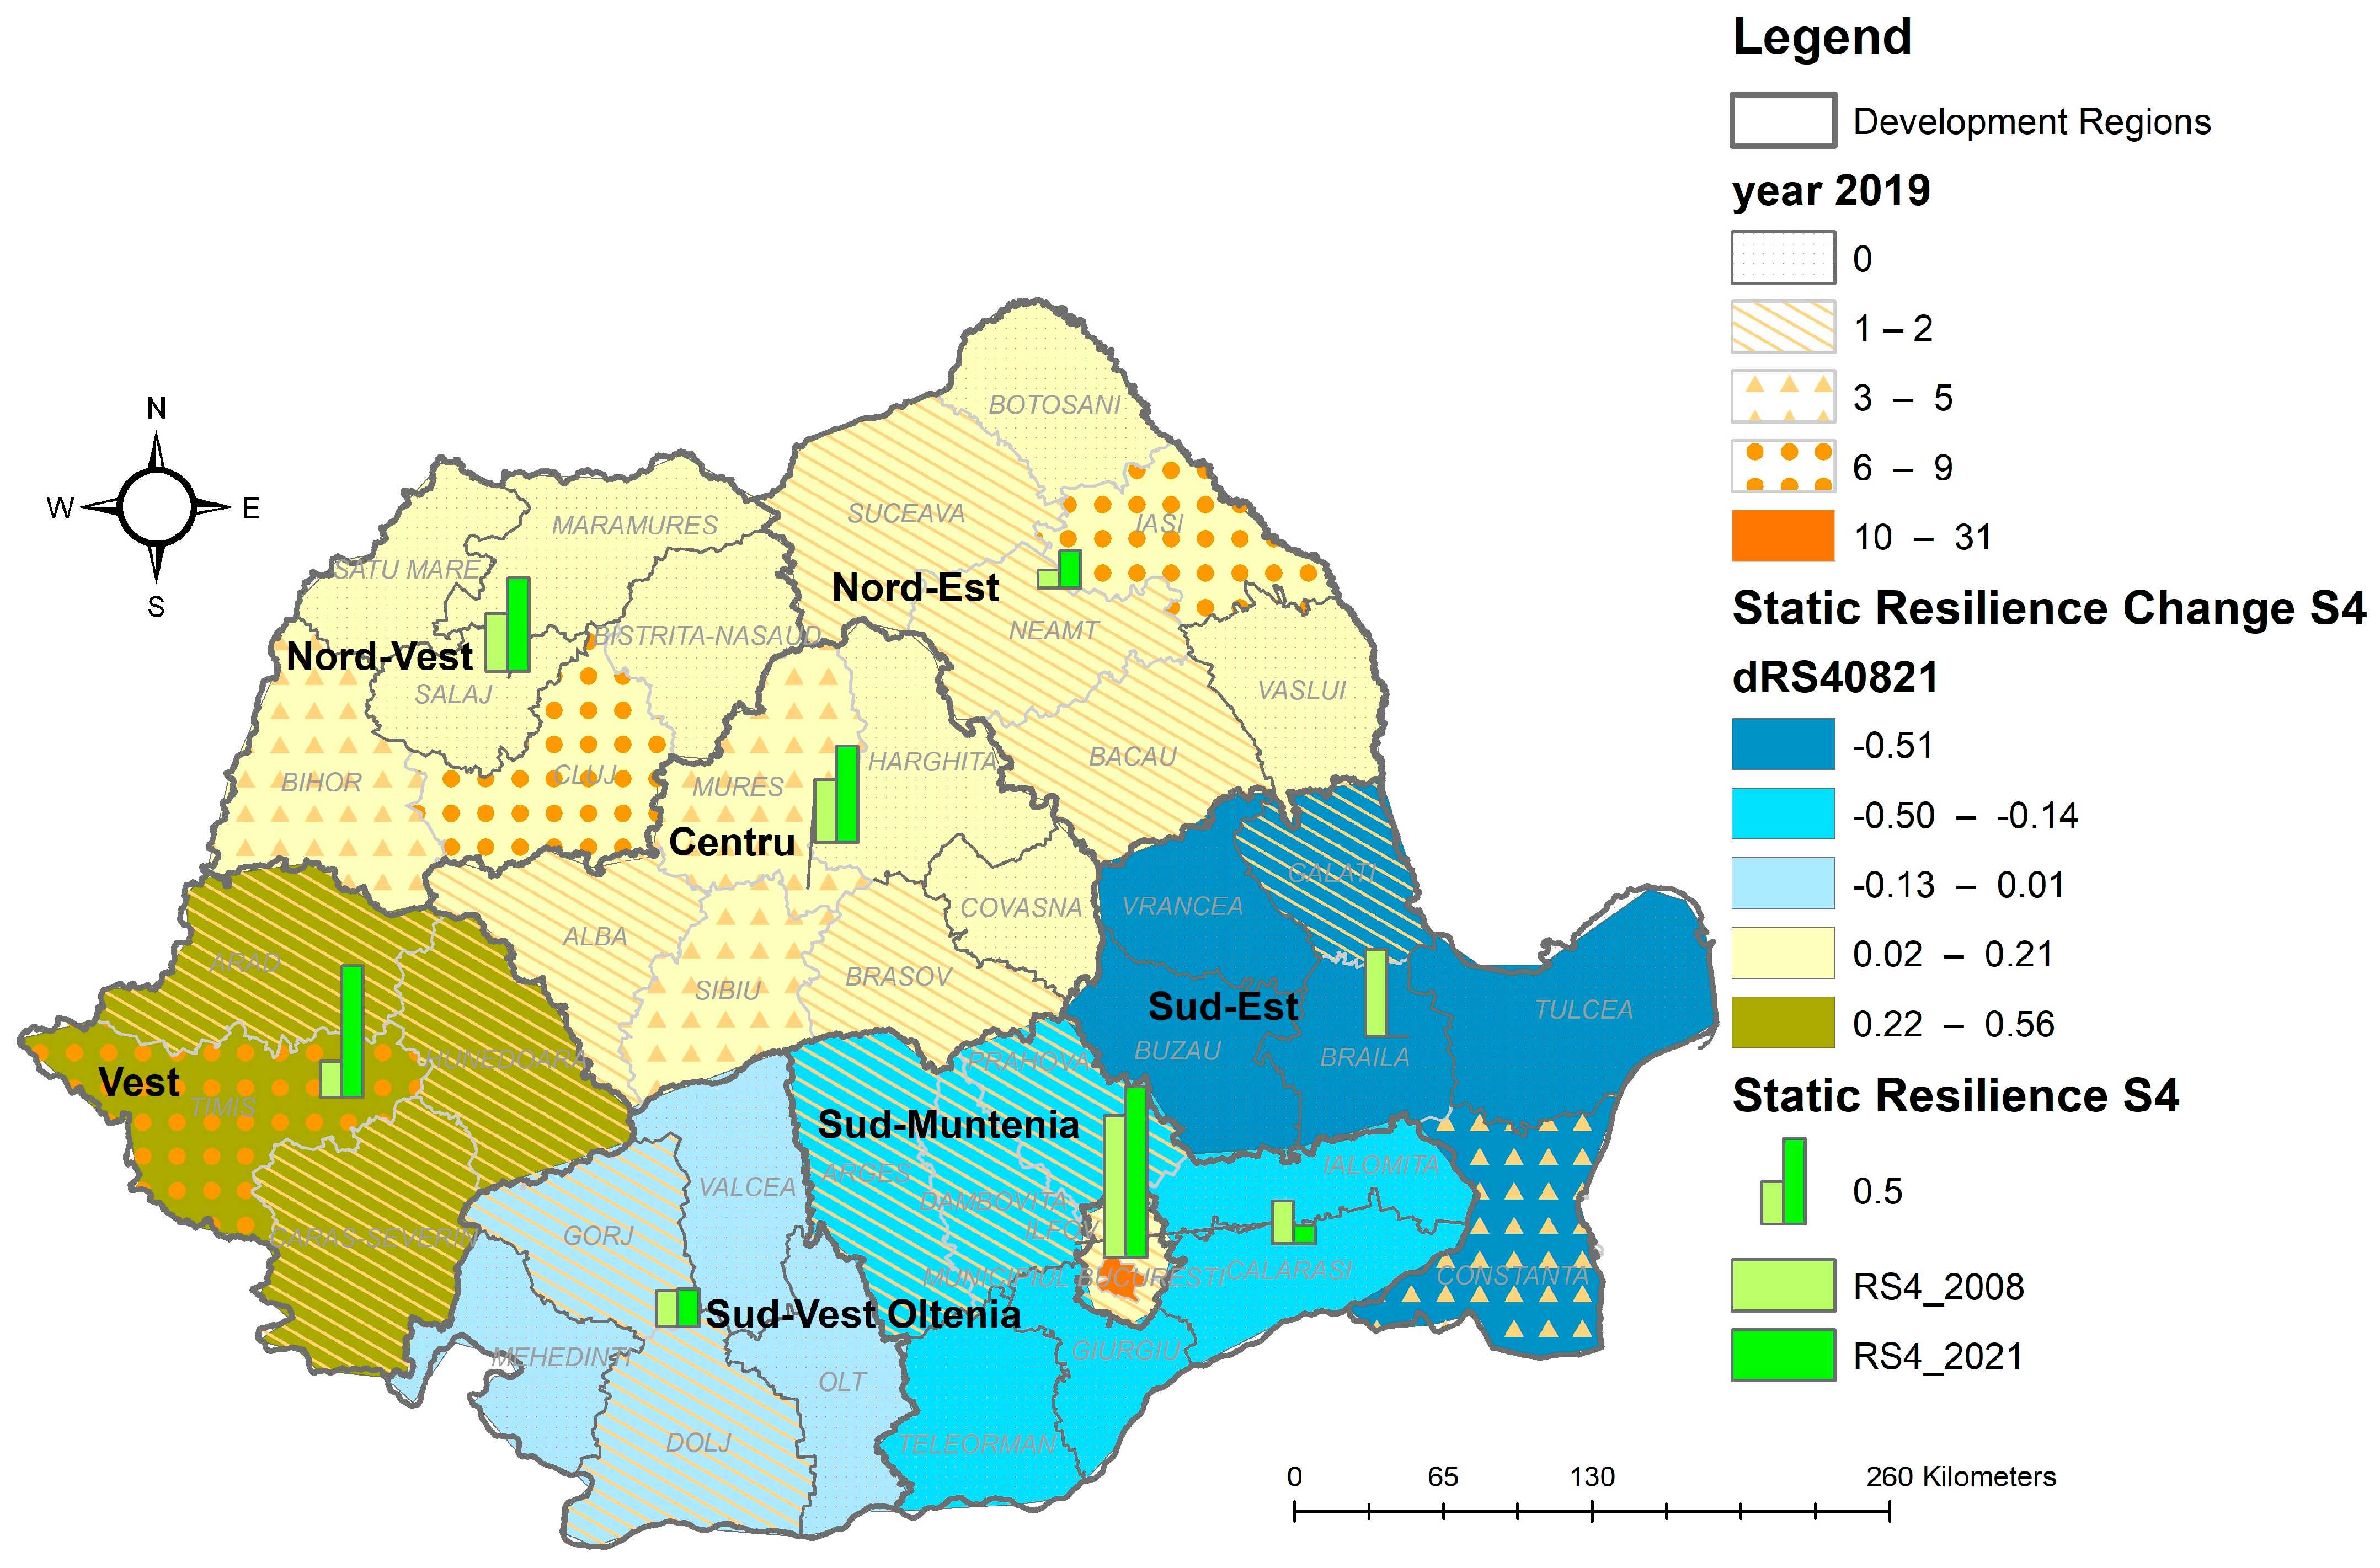
4.2.4. The 4Helix Effect on Basic Digital Infrastructure Access
The last sub-index of DDR S4—Social Digital Connectivity is calculated with two indicator households with internet and broadband access. The results are presented in
Table 9 and
Figure 9.
In
Figure 10, we present sub-index S4—Social Digital Use and the distribution of HEIs. The West region has the highest change with a positive effect, reaching a level close to that of—Bucuresti - Ilfov, with a smaller positive change similar to the Nord-Vest, Nord-Est and Centru regions. The result may be attributable to social digital use; the difference is that this time, the Vest is behind the Nord-Est. The Sud Vest—Oltenia, Sud—Muntenia and Sud-Est regions experienced a very small increase to a remarkably high reduction. The Sud-Est region had very unpredictable behavior, which can be partially explained by connectivity restrictions because of the eastern border and the Black Sea neighborhood.
Connectivity is also one of the measurement indexes of digitalization, as it creates the facility for high-level usage. Different aspects of connectivity were analyzed by the specialists and it can be appreciated that a good connectivity facilitates the social and professional digital use, but the DT is not stimulated by itself, since lower connectivity can act as a barrier [
8,
9,
10,
11,
103,
104,
105,
106,
107,
108,
109,
110,
111,
112,
113,
114,
115].
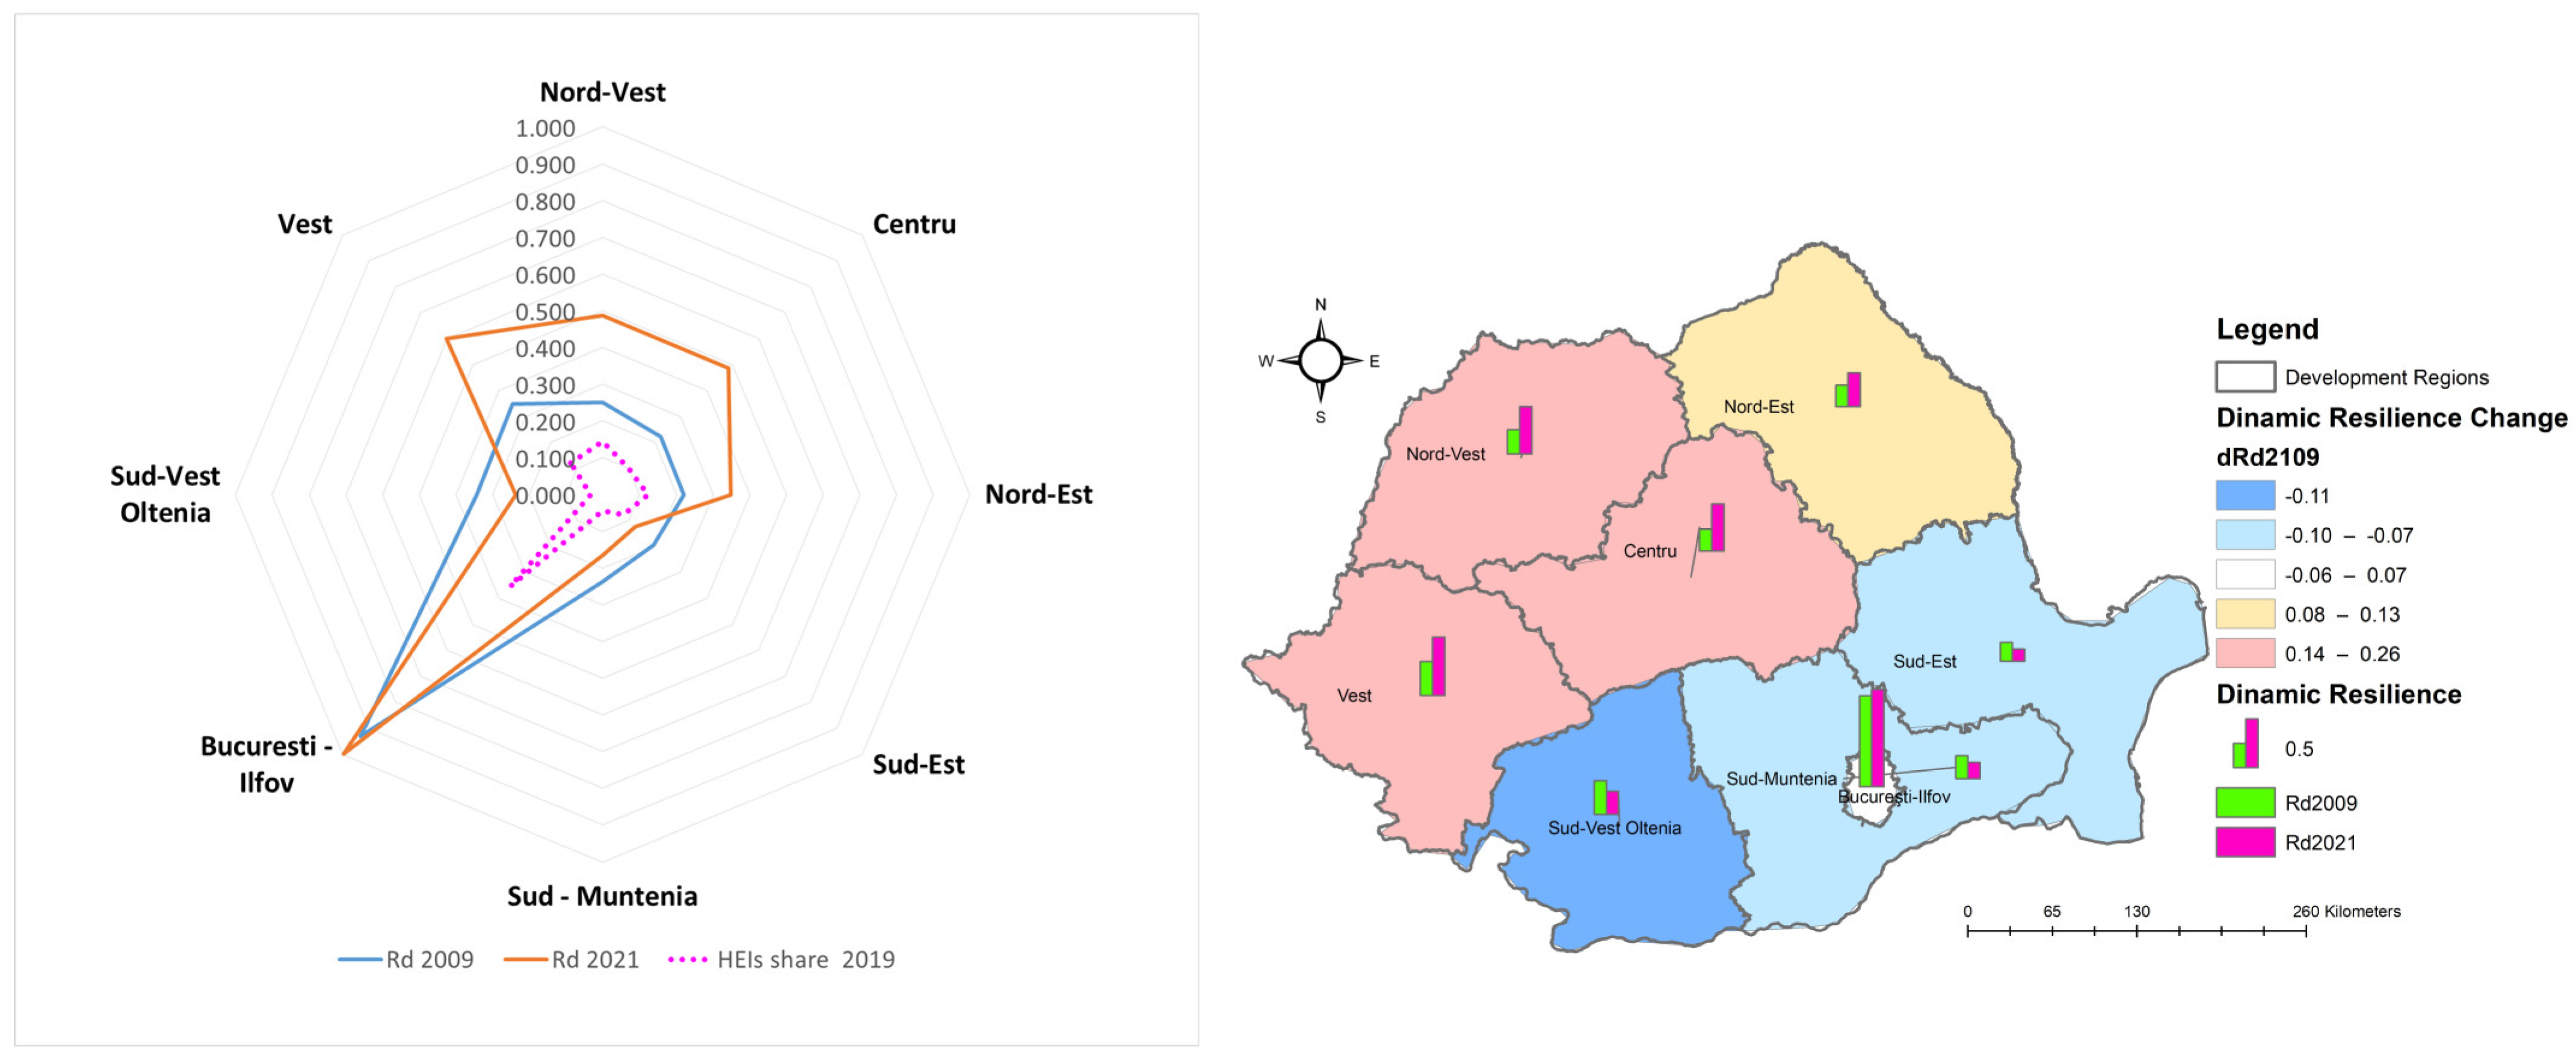
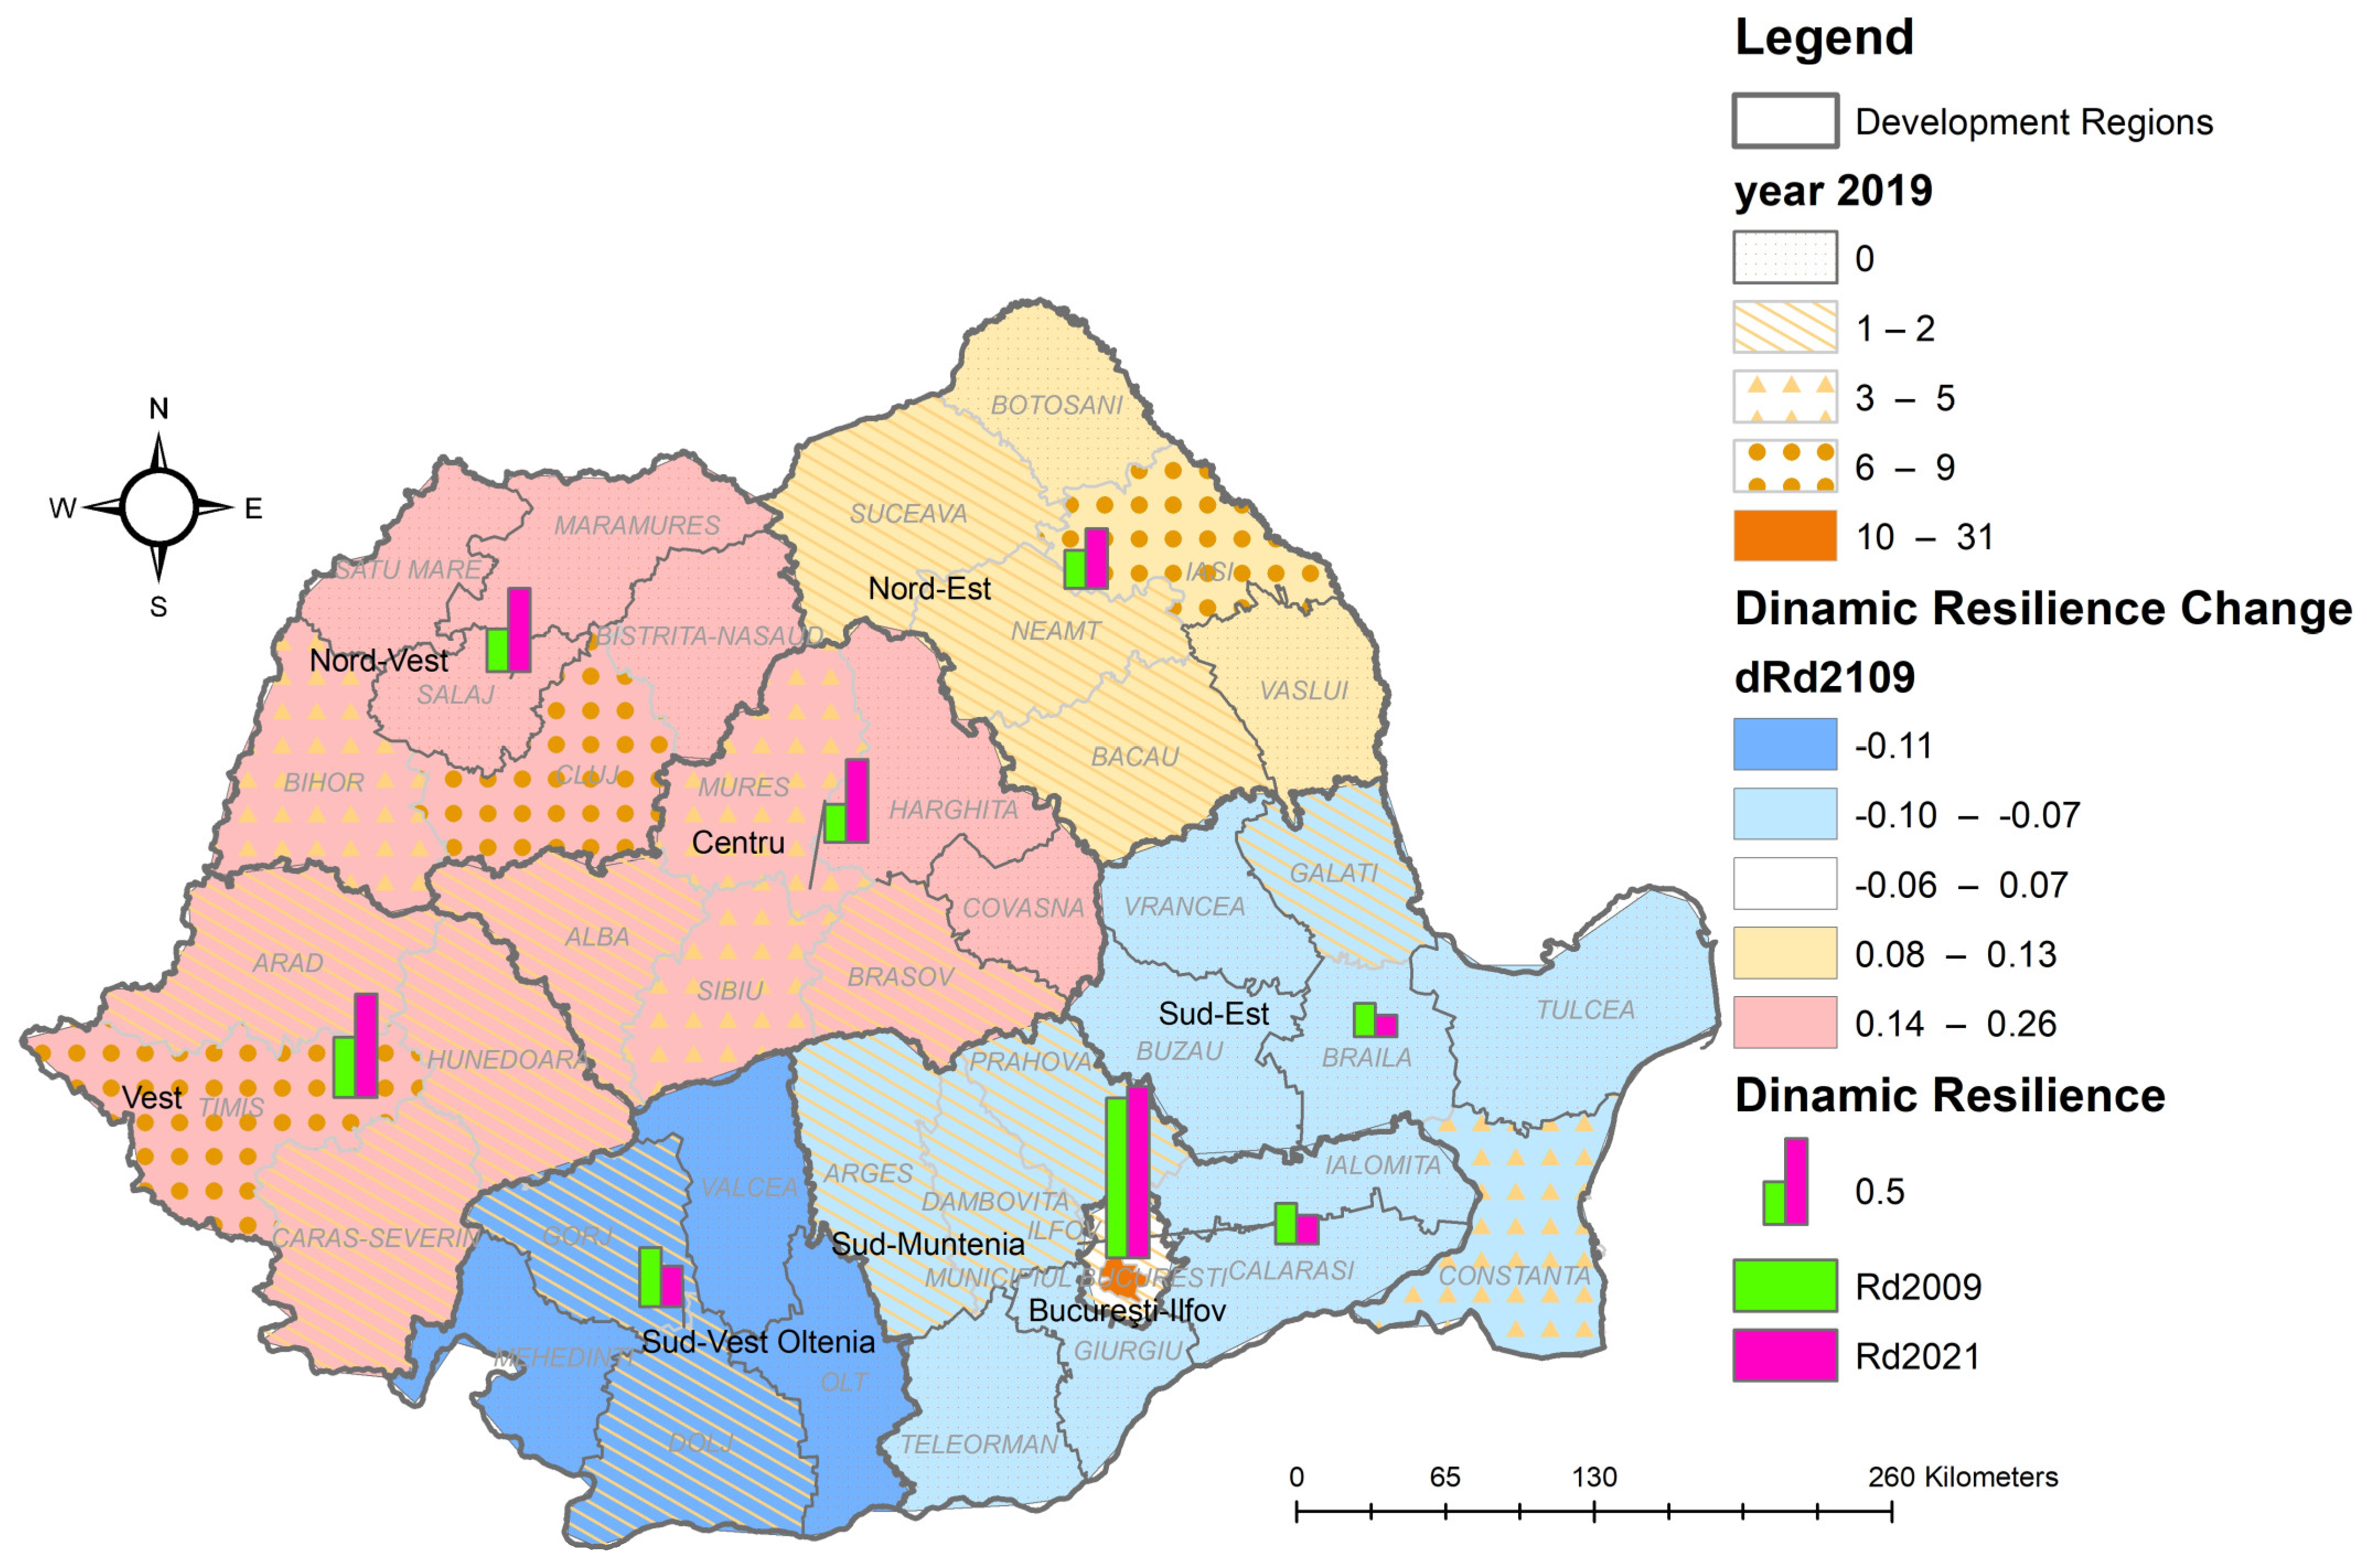
4.2.5. The 4Helix Effect on Regional Digital Resilience
Using the sub-indexes of DDR (S1–S4), we calculate static and dynamic digital resilience as an expression of a cumulative effect. The aggregated results are presented in
Table 10 and
Figure 11.
The aggregated results for the DDR Index show the level of DT for 2009/2008 and 2021/2020 and the change (
Figure 12). The highest level is in Bucuresti—Ilfov with a small positive change effect. It is justified by the high concentration of the HEIs covering all the domains. The rest of the regions are divided into two main categories: North and South. The North includes the Vest, Nord-Vest, Centru and Nord—Est regions; the last one has a smaller positive change effect. Except for the Centru region, the other regions benefit from the second level of HEIs agglomeration in one county led by Timisoara, Cluj-Napoca and Iasi academic centers, which have significant tradition, potential and remarkable results. The Centru region has a favorable DDR Index based on the existence of two counties with three to five HEIs, a new one, and the neighborhood effect of the non-university regions, according to Nordberg [
46].
The South covers the Sud vest—Oltenia, Sud—Muntenia and Sud—Est regions. They had a lower DDR Index for 2009 except for Sud Vest Oltenia, which had a level closer to the North regions, but they had a negative change effect. They do not have a significant number of HEIs except in the Sud-Est region, which included the Constanta County (3–5 universities). Constanta is a strong economic center because of its harbor and it has more universities, but the majority of the economic growth is specialized in civil and military maritime activity, and the findings externalize less to the business environment. The Sud vest—Oltenia and Sud—Muntenia regions have the lowest number of HEIs; Craiova, Pitesti, Resita, Targoviste, Ploiesti cannot act as strong academic centers.
A second reason is the neighborhood, and here we have two negative effects, i.e., the influence of the resources in Bucuresti –Ilfov and their proximity to less-developed regions. The border effect is negative because of fewer business opportunities across the Danube River and the Black Sea. They have a huge unexplored potential in transport tourism and harbor activities [
68]. The negative effects of Bucuresti—Ilfov are seen in the human resources attraction in the HEIs, the economy and the concentration of business opportunities. The expected perspective is a saturation phenomenon in Bucuresti –Ilfov and a positive outcome.
Digital resilience becomes a very important subject after the COVID-19 pandemic, which was a crucial period in developing digitalization and increasing usage. This very accelerated process of DT, the resilience of the organizations and their capability to adopt the new digital tools, to increase the personnel skills, to adjust their process, products or services, in other words to change the business concept, is an enormous challenge to face [
18,
19,
39,
40,
46,
47,
48,
49,
50,
51,
52,
64,
116,
117,
118,
119,
120]. The leading requirement of HEIs is to be on the front line of changing and to offer the teaching support for this transformation, which is confirmed by our study at least for part of the regions.
5. Discussion
We start with the main research question: Are spatial 4Helix models driven by Romanian universities generating regional digital resilience? Our findings suggest a positive answer. Considering the results presented, we calculate normalized ranks for DT and DT change and propose 4Helix models of HEI effects on regional DR.
Table 11 presents the synthesis of digital resilience ranks.
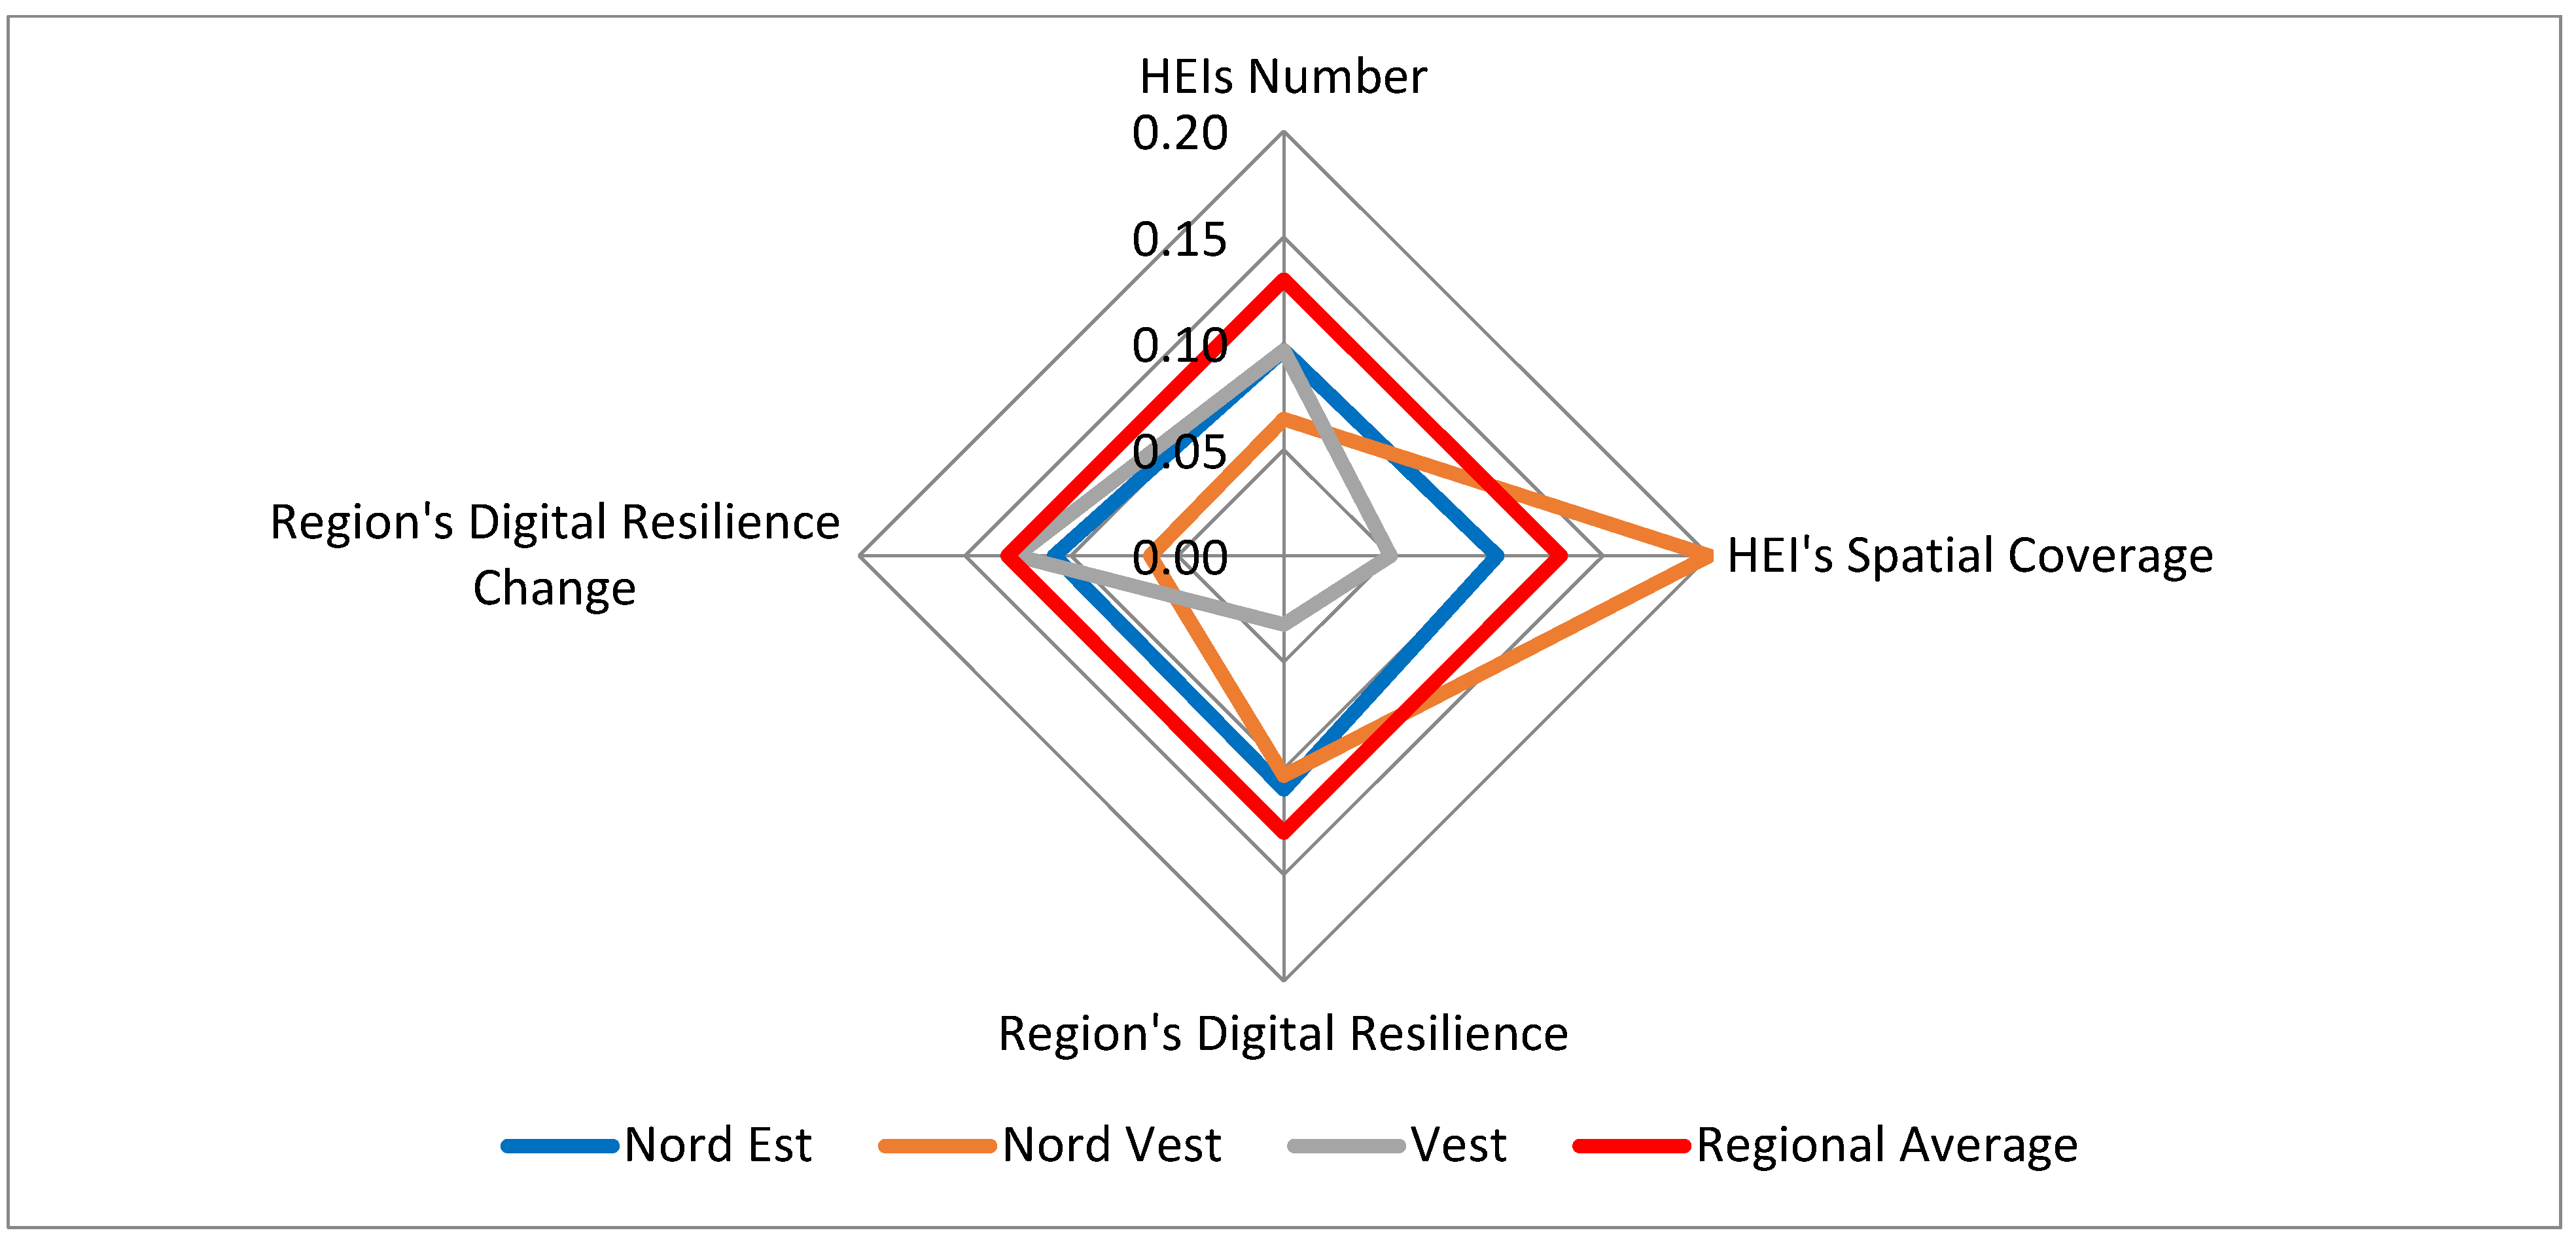
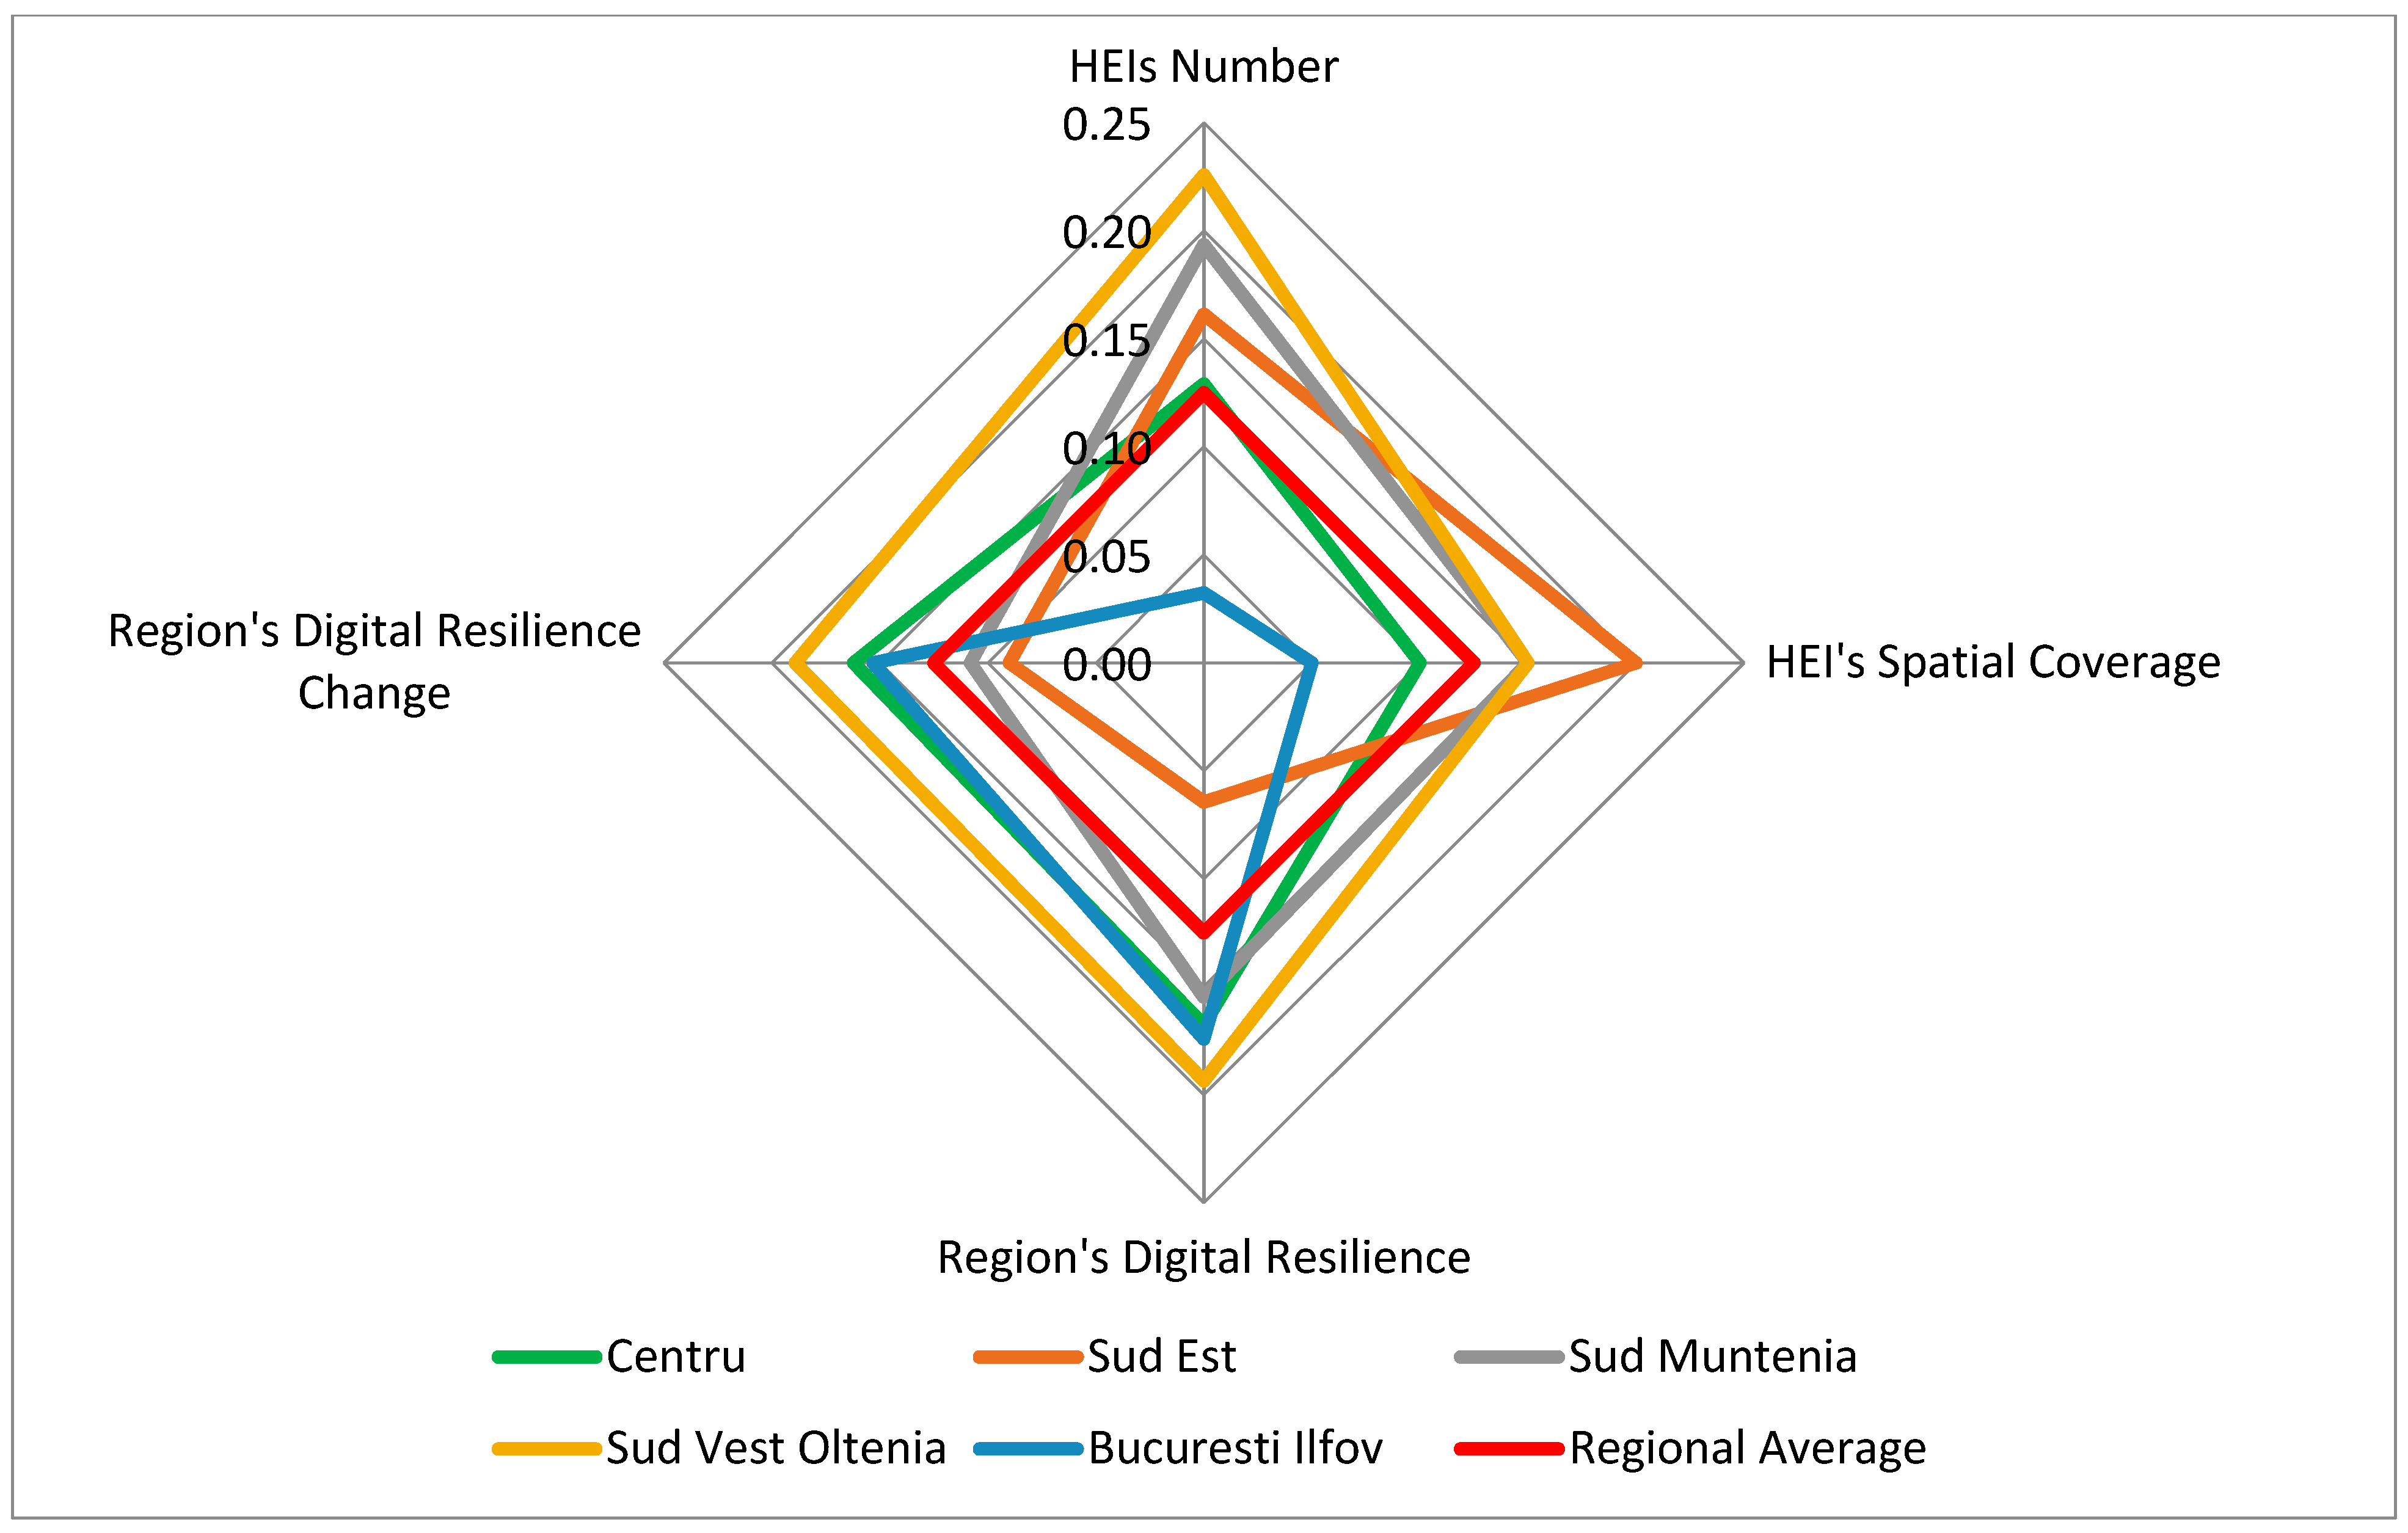
Our analyses reveal relative inter-regional DR for the eight studied regions of Romania. We identify three main classes of the digital resilience models of 4Helix by region: functional, partially functional, and non-functional. The interconnection between the studied items (digital resilience, change of digital resilience, spatial coverage, and number of HEIs) defines the regional models in Romania.
The radar chart indicates the relative positions between the regions’ DT and DT change effect on the DR of the regions and HEIs number and spatial coverage indexes in relation to each region as well as in relation to the regional average. The lesson learned is clear: The lower the index on the scale, the better the performance on the measured dimension.
The Nord—Est and Nord—Vest regions have the best models, where the HEIs are generating the DR. The Vest has a partially functional model with HEIs that temporarily generate DT (see
Figure 13).
The Nord—Est region has a spatial 4Helix model driven by HEIs that generate regional DT in Romania; the University AI Cuza from Iasi provides the leading HEIs among the academic centers. The model is balanced; all ranks are lower than average. It has a high DR and regional DR change that confirm a dynamic transfer from HEIs within the economy.
The second-best model is in the Nord—Vest region, as we expected. The low spatial coverage is substituted by a high digital change effect. Babes Bolay University of Cluj Napoca has considerable influence; because of its high internationalization and networking with universities and businesses from the West, a remarkably high positive change effect is generated. If we look closely at HEI distribution, they belong to the western side of the region, while the eastern part is less covered.
The Vest region model was expected to be among the best; unfortunately, it is a functional 4Helix from the perspective of the DR performance, but it is a non-functional and non-sustainable model based on driven change in DT. The HEIs are generating temporarily DT and the change of DT is slightly average, which indicates a low transfer to the business environment and consumption base behavior. Timisoara is a powerful academic center, but in our opinion, it exports this effect to neighboring regions and stronger Western economies capable of attracting substantial resources.
The models for the rest of the regions are presented in
Figure 14.
The Centru region also has a non-functional model because the HEI coverage is the only dimension lower than average. This means that the HEIs are not strong enough to generate DR, either static or dynamic. However, we expect the influence of the northern regions to drive eventually a positive change. Our expectation is based on the DDR Index, which had a significant increase in 2021 compared to 2009.
The South-East region had a good regional DR and DR change, but they are not a result of the HEIs activity. The South-East region has no HEI spatial coverage or regional digital infrastructure. Relatively better performance in resilience (level and dynamics) compared to the other regions was found, but the universities here are disconnected from the business environment and society. There are no positive externalities. As we mentioned before, the absence of the university is not a determinant factor of a low regional DR [
46]. This region has the attributes of a functional model, but there are unidentified blocking factors.
The model of the Sud—Muntenia region is totally non-functional; the small number of HEIs and low coverage is reflected in low DT and a timid positive change. The influence of neighbors is not applicable here, at least for the moment. The expectation is of the region emerging a transfer from the Bucharest–Ilfov region after its saturation.
The classic non-functional model is in Sud –Est region; all ranks are above average, meaning a non-existent HEIs presence and DR. This model confirms the lack of local resources, absence of attraction force and vulnerability of resources export. In our opinion, this is the most risky model, with a high potential to drive the region into poverty unless specific public policies are implemented.
The model of the Bucuresti—Ilfov region is a second example of the disconnection between HEIs and the business environment. This model has the best HEI concentration and coverage but without effect in DT or DR change. We explain this by the specificity of significant economic development, which is higher than that of the other regions, the concentration of multiple resources and a saturation phenomenon. This region looks like it has reached the limits of growth, and the overspill process is nearly started. This will be first for the benefit of the Sud—Muntenia region and then the Sud –Est and Sud Vest—Oltenia regions.
6. Conclusions
The hypothesis of our research addresses the HEIs’ internal and external impact in generating regional DR as follows:
H1—We confirmed spatial 4Helix models that generate regional digital resilience in Romania and identified three types of models: two functional, one partially functional and five non-functional. The discussions focused on the spatiality and the local context of the identified models. They represent robust results for setting regional public policies, regional development strategies and measures to address the reported potential blocking factors, malfunctions, dysfunctions, etc.
H2—We partially confirmed that HEIs adopt the new normal digital education. The results confirmed that HEIs generate the regional DR and DR change, but the existence of many non-functional models means, in our opinion, that HEIs adopt the digital education model far too slowly. The temporary effect identified in Timișoara University Center indicates that given the effects of COVID-19, digital education was only an ad hoc solution. Beyond the evident opportunities and advantages, the bulk of Romanian HEIs did not adopt digital education as the ‘new normal’. Powerful inertia factors were the most worrying deficiencies of these universities; they failed to establish a new mindset and behavior of human capital among the academics, students, and graduates and not least across the region, including business and other stakeholders. Another relevant conclusion, especially in the context of building Smart Specialization Strategies for Sustainable and Inclusive Growth (S4+) concerning regional integration, is the HEIs transformation for DR. This implies the following:
- (a)
A huge demand for promoting digital education opportunities and advantages across the regions;
- (b)
A demand for a transition from the university autonomy toward more regional partnerships to set up a functional 4Helix model—evidently a ‘Win–Win’ model.
The originality of the present research is the measurement methodology of regional DDR and overlapping with the spatial distribution of the HEIs in Romania. This spatial approach gives a comprehensive picture of the analyzed topic. The synthesis represented in
Figure 12 reflects more than the calculated index and HEI distribution; it gives a broader view of the role of neighbors in the case of the Romania’s multiple border issues, highlighting the discrepancies between the EU and non-EU nations. The Danube River and Black Sea are largely unexploited resources with great potential, acting as blocking factors instead of economic engines. Another spatial side effect highlighted by our study is the role of the Carpathian Mountains in slowing development.
The approach brings together the two directions identified in the literature review as main topics, i.e., the 4Helix models in regional innovation systems and the DR in the HEIs or higher education systems as leading organizations of DT, innovation, knowledge transfer, etc. Our study addresses them together as two sides of the same coin, and it fills the gap with a methodology/4Helix models of HEIs generating regional DR.
The presence of universities is correlated with social digital skills and the ownership of individuals’ soft skills. The digital business performance indicates a partial ‘Industry 4.0′ specialization in the HEIs and the strength to generate DR. Business performance indicates different HEIs specialization profiles. A limit of the study is the uniform approach of the HEIs no matter their specialization. A deep analysis with a more detailed distribution and regional coverage of digital and high-tech HEIs probably will offer more information to regional and national stakeholders. This limitation is a further research indicator.
Connectivity is correlated with wealth; digital infrastructure is expensive, and the DT and DR are strongly dependent on it. As we saw in the South-East region, with a totally non-functional model, regional DT and a negative change can keep or drive the region into poverty. Romania is an exception of connectivity having a good digital infrastructure (household and broadband access); in general, special attention must be paid to the rural and/or disadvantaged areas.
Finally, the HEIs are generating regional DR. To be resilient means to identify your strengths and weakness and to find the best digital solution to adjust for future challenges. To increase their strength and the power to generate regional DR, the HEIs must improve in three dimensions: digital infrastructure of all teaching–learning stakeholders, highly digital skilled human resources, and digital teaching programs.
The paradox of the present study emerges from the spatial effect discharged by the DT; in other words, the “physical” presence of HEIs is not important if there are other triggers of regional DR. On the contrary, HEIs with high internal DR can act, for their region, as generators of resources, economic development, wealth, business performance, etc.
The key to building digitally resilient regions is to create widely functional 4Helix models driven by HEIs that embrace digital education. The vital new role of HEIs is to promote pioneering behavior of human capital alongside the needed innovation, knowledge production and intellectual transfer.
6.1. Theoretical Implications/Contributions
First of all, this study reconfirms the capability of the 4Helix model to be used for the evaluation of complex processes such as innovation DT or DR, and it opens a window for these types of models to be considered for other processes. The 4Helix model has become, in our opinion, one of the most powerful tools to analyze complex modern phenomena, and more than this, it can be the golden brick for the collaborative framework culture and co-creation.
Secondly, the combination of the 4Helix model with the spatial–temporal model using ArcGIS tools creates a regional perspective offering insights about the efficient and effective usage of resources on one hand and the overtime dynamics on the other hand.
Thirdly, this kind of interplay perspective, proposed by us, offers synthetic pictures of the analyzed process or phenomenon that enable them to be easily understood and implemented by the end-users, maximizing the effect of the implementation.
6.2. Managerial Implications/Contributions
From the perspective of the political management, the importance of the universities, as leading institutions in DT and knowledge transfer, has to be stated and evaluated through public policies and strategies to accelerate the DT tools adoption. Understanding the potential of socio-economic growth driven by the HEIs and research should shift the behavior of policy makers from declaring education the national priority to implementing programs and projects, enforcing it as the priority. Creating the legal framework for digital education and the facilities to be accessible in all regions, especially in those uncovered by the HEIs presence, is a prerequisite for DT.
At the institutional level of HEIs, there are three major implications: (1) adopting the DT as soon as possible; (2) connecting with international HEIs and building joint digital programs; and (3) integrating in the R&D network to be on the technological front line. The HEIs management should consider the digital infrastructure (hard and soft), digital programs, performance digital education tools and most importantly the digital skills of the teaching staff. Creating an organizational culture for performance and developing the aspiration for education for the future, the HEIs management will gather all the needed factors for the DR implementation.
6.3. Practical Implications/Contributions
The main role of HEIs is to teach and train the labor force, especially the younger generation on various specializations. The spread of the digital applications (AI, IoT, block chain, e-commerce, e-banking, e-governance, etc.) in all socio-economic sectors requires specific digital skills for all graduates no matter their domain or education level. One concern is to transfer the digital knowledge to the students or trainees.
The DT is impacting the business models as well. Managers will be interested, once they understand the need of DR, in adopting the digital tools and employing highly skilled personnel. Shifting to the modern challenges, in our case DR, offers a sustainable development for the companies. The business environment is the beneficiary of the HEIs.
6.4. Social Implications/Contributions
One sub-index considered in the model is S2—Regional and Individual Wealth, which measures the impact of education in economic development and the reflection in regional and individual wealth. A better educated population has an increased chance of finding employment. Higher education raises the potential of being employed, and a wage increase benefits individual wealth. Regional wealth is based on the individuals, and it stimulates the economy as well the education.
We can appreciate that education is adding value to the HR launched on the labor market. Once entered in the companies, the HR is generating economic growth and adding value for the employer, producing in return wage increases that transform individual wealth. Summarizing the individual wealth, we are evaluating the regional wealth and the public authorities’ wealth is generated in tandem (local taxes). The individual and local public administration will raise their expectations from the HEIs forcing them to constantly update. This synergic mechanism is reflected in the findings of study.
The value and originality of the regional DR 4Helix model comes from the theoretical contribution to science with a dynamic regional integrated model, the capacity to be replicated for other complex socio-economic factors, the clear and synthetized information and insights offered, and the accessible presentation of the results that are easy to read and used by scientists, professionals and policy makers.


 ,
, 


