Article

Research on Influencing Factors of Service Interactive Experience of Digital Gas Station—The Case from China

1
School of Design and Art, Henan University of Technology, Zhengzhou 450001, China
2
Department of Smart Experience Design, Kookmin University, Seoul 02707, Korea
*
Author to whom correspondence should be addressed.
J. Theor. Appl. Electron. Commer. Res. 2021, 16(6), 2151-2169; https://doi.org/10.3390/jtaer16060120
Submission received: 31 July 2021 / Revised: 25 August 2021 / Accepted: 26 August 2021 / Published: 31 August 2021
(This article belongs to the Collection The New Era of Digital Marketing)

Abstract

:
A series of digital marketing transformations have been carried out at Chinese gas stations. From the perspective of user experience, the article discovers the problems in the digital service system of gas stations. Through semi-structured interviews, we collect consumers’ actual usage of digital equipment and service systems. The research adopts grounded theory to encode qualitative data. The behavioral state and psychological needs of consumers in the driving situation are analyzed. The study clarifies the influence of consumer behavior status, service context process, key task difficulty, and service information visualization on service experience. The discovery of service problems in turn help to further optimize the digital service system. The constructed SITE model clarifies the key factors of user experience in the gas station scenario. The research findings can provide a theoretical reference and practical guidance for gas station business owners, managers, and designers.

1. Introduction

As fuel profits decline, traditional fuel retailers actively seek digital marketing methods to expand their business and increase profits. Previous studies have shown that digitalization is an effective way to improve performance and competitiveness [1,2]. In China, e-commerce giant Alibaba Group launched a series of unmanned retail, including TAOCAFE, Fresh Hema, and Ali Smart Gas Station. Digitization is the deep integration of digital technology and business. Digital marketing solves the problem of operational efficiency and profit [3]. At the same time, digital technology has also brought changes and challenges to service methods [4]. The user experience of digital service systems has attracted more attention and has become one of the important research directions in digital marketing service design.
China has 280 million fuel-powered vehicles and more than 100,000 gas stations. The after-car service market is vast [5]. China’s “super-large scale” advantage provides a rich context for digital innovation [6]. China’s digital platforms and ecosystems are rapidly emerging, growing, and dying [7]. Many new digital devices have been introduced in China’s gas stations to achieve digital transformation. However, the business process has not changed. The utilization rate of smart kiosks is not high. The user stickiness is poor, and the user experience is unfavorable. Compared with other consumption scenarios, gas stations are unique. The notable difference is that customers are mostly drive-in drive-out in a short timeframe, and the service receiver is a combination of consumers and cars. Due to the differences in application fields, usage scenarios, and service objects, the user experience influencing factors will also be different. If we directly study the user experience of drive-in customers based on the existing user experience influencing factors and structured questionnaires, then not only is it unscientific, but it may not be suitable. Therefore, this paper focuses on the impact of the characteristics of the service design on the experience of customers. This research is necessary at both practical application and theoretical levels.
This article explores the influencing factors of user experience at gas stations from the perspective of digital service interaction scenarios. This article uses field surveys and semi-structured interviews to collect data. Grounded theory is used for coding and analysis. The influencing factors are summarized into four dimensions: scenario flow, information flow, task flow, and emotion flow. The SITE matrix model proposed in this research can be seen from visible/invisible, service provider/receiver, two-way comparisons to understand the supply and demand relationship of the service experience more comprehensively. It is expected to provide a theoretical reference and practical guidance for gas station managers, designers, and operators to take effective measures to improve user experience and optimize digital services in offline gas station operations.

2. Literature Review

Digital technology has universally changed the service models of businesses and the behavior of consumers. The following is an overview of related research in these two aspects from the two-way perspective of service providers and service receivers.

2.1. Related Research on Digital Marketing Reshaping Services

Digital marketing has changed business. On the one hand, it refers to the reshaping of the entire organization as an intangible innovation method. On the other hand, it refers to the fact that digital technology, as a tangible touchpoint, has changed the business service model.
From the first aspect, many scholars have studied enhancing the mechanical logic of digital innovation to improve business performance. Digitization allows digital technology to penetrate the core of the organization’s products, services, and operations, fundamentally changing the paradigm of products and services. Several researchers addressed the problem of how digital innovation, technologies, strategies, and systems can change business models [8,9,10,11,12]. Some scholars also believe that digitization has given birth to a modular system constructed by equipment, networks, services, and content. This new architecture can produce new products or provide new services [8]. Bharadwaj proposed that digital technology changes business strategies, bringing new services and business processes [13]. Nambisan noted that the process of digitization emphasizes the dynamic interaction process of design logic, contextual blending, and continuous iteration [14]. Current research indicates that digital technology as an innovative method has changed the business model and provided new service methods and business processes. In addition to theoretical research focusing on the innovative practice of digitalization in various fields, numerous scholars have also done many case studies. Digitalization reshapes services in retail, education, transportation, communications, healthcare, law, and public services [15]. Business models and customer behavior are changed by smart technology. Artificial Intelligence (AI) customer service and potential customer predictive analysis make sales more efficient [1]. Information technology can improve the adaptability of sales, thereby enhancing sales performance [16]. Empirical evidence appears to confirm the notion that digitization expands service methods and improves service efficiency [17,18].
From the second aspect, digital facilities change service interactions. Digital technology reshapes the service delivery process by changing the way information and resources are delivered. Zeithaml proposed that technical characteristics have an impact on service quality [19]. Patricio et al. pointed out that technology-driven human-computer interaction interfaces are often more efficient, convenient, and easy to access. The human–computer interaction interfaces can better meet customers individual needs and win customer trust [20]. Ahearne and Rapp compared AI, human employees, and customers, through different interaction methods to create value and service innovation within service interactions [21]. Service interaction and service touchpoints have always been hotspots of research along with technological changes. Service providers have changed from humans to systems to robots. Service encounters have also changed from face-to-face interaction, remote voice interaction, online interaction, and self-service interaction to robot interaction. Shostack put forward the service encounter theory and pointed out that the interaction between the customer and the service system determines service satisfaction [22]. The key to service success is the quality of service interaction [23]. The service encounter concretizes the relationship between the service provider and the customer [24]. It is generally agreed that service experience is the key factor of service satisfaction. Service providers can increase service satisfaction by introducing new technologies and paying attention to the consumer experience.

2.2. Relevant Research on Consumer Attitudes towards Digital Technology (Products, Systems, and Services)

Research on the antecedent variables of consumer acceptance of new technologies involves a wide range and abstraction, which has always been a difficult point in research. Many literature studies are based on factors such as subjective cognition, perceived usefulness, and ease of use, perceived cost, perceived risk, subjective norms to study the factors affecting consumer acceptance of technology. Parasuraman proposed “Technical Readiness (TR)” to establish the relationship between attitude, intention, and behavior [25]. Furthermore, the theory of planned behavior (TPB) [26] established that behavior is affected by attitude, subjective norms, and perceived behavioral control. There is no doubt that the most widely used theoretical model is the Technology Acceptance Model (TAM) [27]. It establishes the impact of perceived usability and perceived ease of use on technology acceptance. A large number of scholars have done many extended types of research based on the technology acceptance model. Combining the characteristics of services to establish a customer acceptance model in the context of intelligent services, Wirtz proposed a service robot acceptance model (sRAM) [28]; Gursoy proposed the AIDUA model to verify consumer acceptance and willingness to use the service [29]. From these studies, it can be found that the research objects have gradually expanded from products to systems to services. The dimension of key variables has also expanded from usability evaluation to a more comprehensive user experience.
Consumers’ acceptance of technology determines their willingness to continue using it. Usability is concerned with the user’s ability to complete tasks. User experience (UX) emphasizes the experience of consumers interacting with the service. The ISO 9241-210 standard defines UX as “the subjective feelings and reactions of users when they use or expect to use products, systems or services” [30]. From the user experience models put forward by many studies, it can be found that in addition to the recognized attributes of usability and efficiency, scholars have proposed many cognitive and emotional elements. Goh and Karimi [31] proposed an interactive mobile technology acceptance based on user experience by combining the cognitive, emotional, aesthetic, and symbolic constructs in the UX and Technology Acceptance Model (TAM) literature. Model. The HEART model [32] proposes happiness and engagement. The CUE model [33] includes technical feature perception, non-technical feature perception, and emotional response. The process of user experience formation is the result of the interaction of users, scenes, and systems [34].
It can be seen from the preceding that although there are many research results on factors affecting user experience. There are differences in application fields and usage scenarios. Many early research focused on the product or system interface, whilst the user behavior and interactive touchpoints were rarely explored. There is no spatial displacement of user behavior and no switching of touchpoints. In a real offline service scenario, digital touchpoints, physical touchpoints, and manual touchpoints coexist, and the spatial scenario and service function area can be quickly switched. The results of previous studies cannot interpret the influencing factors of the consumer experience in the driving state. In terms of research methods, most of the existing studies are quantitative research methods that put forward research models and hypotheses at first, then based on structured questionnaires, use multiple regression statistical methods, such as structural equations, to verify. As quantitative research proposes research variables and models in advance, it cannot fully predict consumers’ true thoughts. We believe that it is necessary to do exploratory and qualitative research because we can observe the linkage reaction of different touchpoints in real situations, the actual behavioral process of consumers, and the underlying psychological motivations. If the research is for exploratory, then methods based on a priori and previous hypotheses are considered inapplicable [35]. Therefore, the field interview method required by grounded theory is more appropriate. Thus, this research can be a useful supplement to existing quantitative research. Secondly, compared with the previous research, which only investigated the target users from a single perspective. This article uses a two-way survey of service providers and receivers. The gap between the expected service effect of gas station service providers and the actual experience of consumers is explored. The research focuses on the experience elements in the perspective of service interaction at gas stations to discover some new driving factors and provide suggestions for improving the user experience of gas stations.

3. Methodology

3.1. Research Context

Our research objects are smart gas stations. According to the design concept of “Ali Smart Gas Station” [36], after the car enters the gas station, it will be recognized from the license plate information, Taobao ID, petrol models. After the parking is completed, the robotic arm completes a series of refueling work, the system processes automatic payment.
There are many gas stations in China undergoing digital transformation. The digital kiosk is representative of measures being undertaken in the digital transformation of China’s gas stations. The newly introduced kiosk is equipped with digital technology functions such as digital LCD interactive touch screen, voice interaction, face recognition, and non-inductive payment. However, observations have found that the number of workers at China’s smart gas stations that have introduced digital tools and equipment has not decreased, and they are still busy. It turns out that the actual usage rate of kiosks is not high. This phenomenon is worth exploring. In interviews with gas station managers, it was found that they are concerned about the kiosk’s new functions, multi-function, intelligent technology, and advertising placement. It ignores how to make consumers willing to use kiosks, including for self-refueling. The user experience is unsatisfactory. In addition, it is different from what many researchers put forward, “offload Labor to Shoppers,” to save costs [37]. The gas station manager said, “After installing new equipment and systems, the number of staff has been reduced by half. However, there are problems with operations. Consumers will encounter obstacles in operating the new tanker screens, and there will be congestion and queues. We must re-arrange the staffs that are on duty to help refuel.” Notably, consumers still choose interaction modes at Chinese gas stations between face-to-face manual service, self-service, and intelligent service. Therefore, discovering the reasons why consumers are unwilling to use kiosk is also one of the research goals. The service system of the digital smart gas station includes many offline and online contacts. The process of entering the gas station to refuel requires completing key tasks of identification, refueling, and payment. The common service interaction mode of Chinese gas stations is the coexistence of face-to-face manual service, self-service, and intelligent service.
As shown in Table 1 below, the digital management systems used by the six gas stations surveyed were provided by two different software service providers. The functions are the same; while they do not have robotic refueling arms, the installed technology includes license plate recognition, face recognition, voice interaction, intelligent recommendation, no-stop automatic payment lane with Electronic Toll Collection (ETC), and QR code mobile payment. However, despite all the installed digital capability, the refueling method chosen by consumers is still manual refueling. According to the survey, three well-known Chinese refueling equipment manufacturers have completed the research and technical testing of the robotic arm. However, gas station business owners are not willing to purchase at this stage. We have not found a gas station that uses a robotic arm.

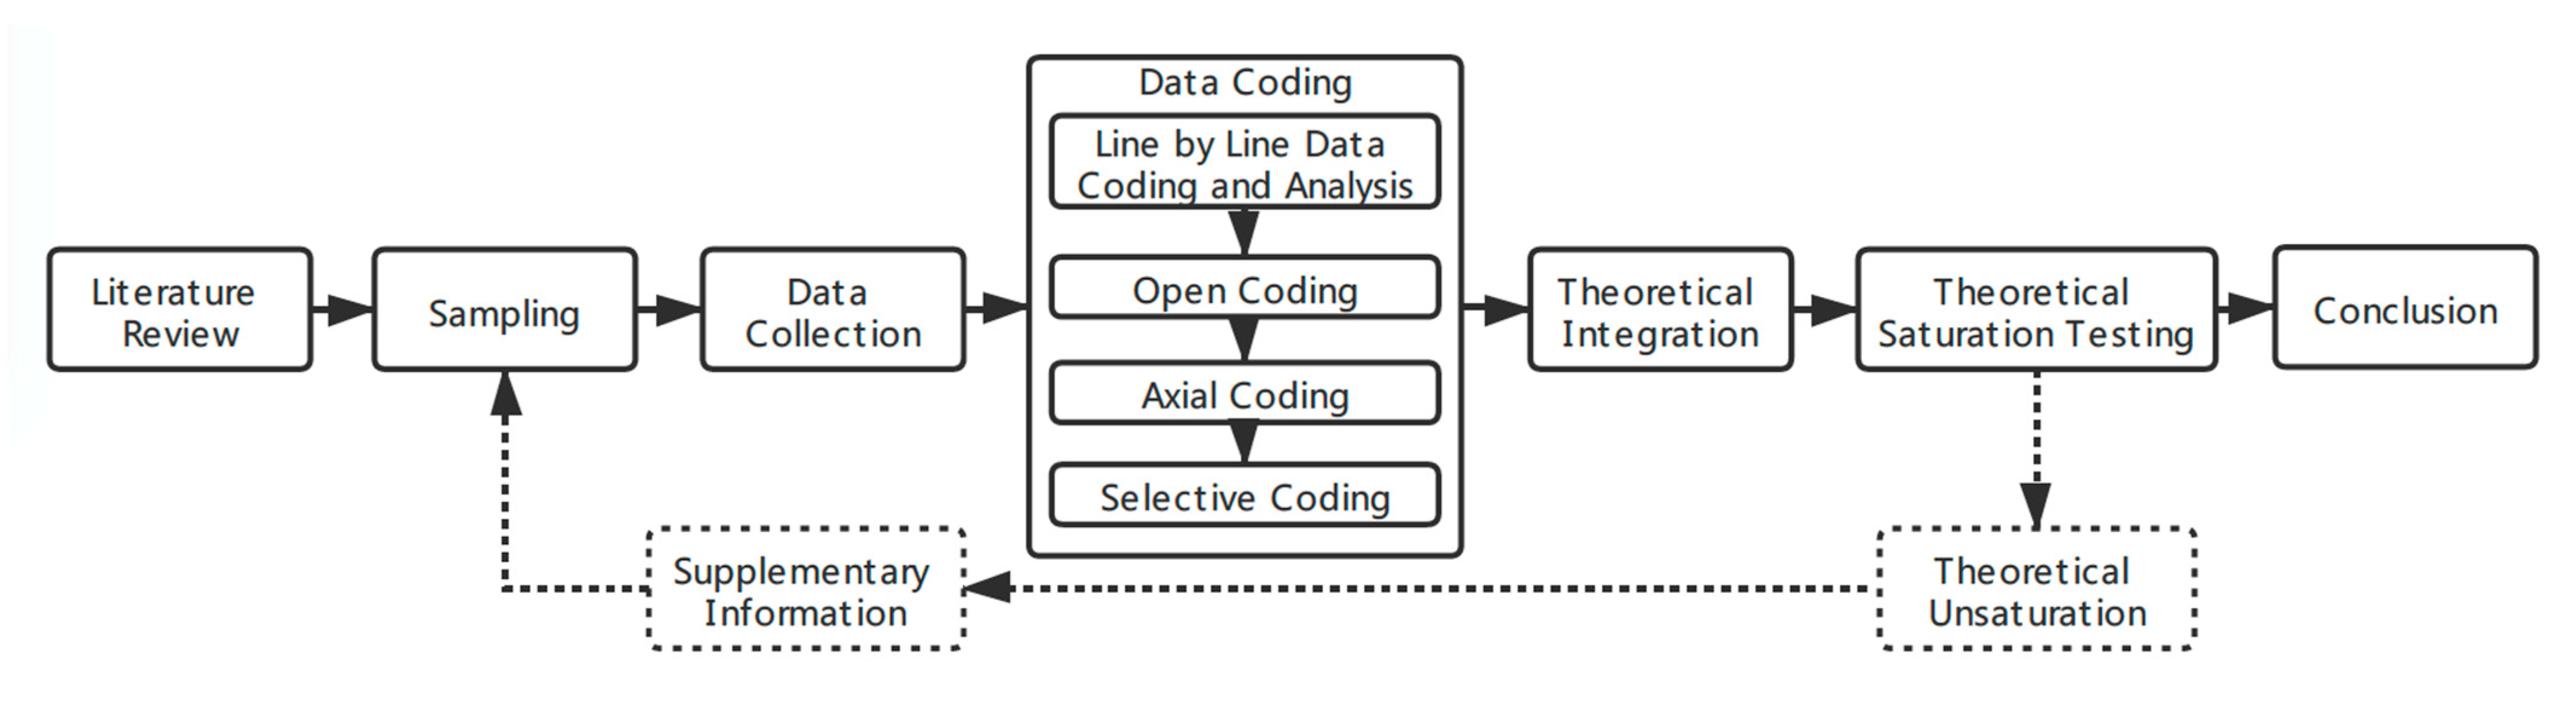
3.2. Grounded Theory and Research Process

Sociologists Barney Glaser and Anselm Strauss proposed the “Grounded Theory” in 1967. Grounded theory collects qualitative materials in specific situations, and based on continuous comparison of original materials, refines concepts, summarizes categories, establishes connections, and then generates and develops theories [38]. The main reasons why this paper adopts the grounded theory research methods are as follows: First, this research is based upon a specific research situation, and grounded theory is a method of constructing a theory from the bottom up [38]. Grounded theory is a qualitative research method. The collection and analysis of its data are carried out simultaneously and continuously compared. The main advantage of grounded theory is that it cannot be interfered with by pre-determined theoretical models, allowing the final theoretical results to “naturally emerge” in the process of research [39]. Second, some of the antecedent variables and structural models involved in this article are not yet clearly known a priori. Therefore, hypothesis testing cannot be used directly. Gas stations have special service procedures and scenarios, and we cannot put forward research hypotheses, variables, and models before the investigation. Although we have studied a lot of comparative research in the preliminary literature review. However, it is still impossible to choose a particular theoretical model for confirmatory research. Therefore, this research adopts the exploratory research technique based on grounded theory. Third, the demographic attributes of gas station consumers are quite different. We cannot all predict the true thoughts and potential needs of consumers. Hence the use of grounded theory to reveal consumer preferences and needs is required. The textual information collected through interviews is rich, informative, and in-depth. Research methods based on grounded theory can discover hidden deep-seated factors and connections through the surface phenomena of things. Therefore, based on the above reasons, this paper chooses grounded theoretical research methods.
The research process is shown in Figure 1. Following the grounded theory research process, raw data is obtained first-hand through semi-structured consumer interviews, systematically analyzed, and summarized through three programs: open coding, axial coding, and selective coding. The coding takes place in sequence and is then tested for theoretical saturation. If it is found that there are no new concepts that can affect the core category, it can be considered that the theoretical model has reached saturation. If not, continue sampling to supplement information until the theoretical saturation is reached.

3.3. Recruitment and Participants

The sampling method in this paper is purposive sampling. Respondents are selected according to the degree of fit with the research focus [40]. This sampling method enables grounded theory researchers to find available people who have experienced the process or phenomenon to be studied [41]. The empirical survey first starts with purposive sampling and selects the interviewees according to the degree of fit with the research focus [40]. First, locate gas stations with digital operations. It considers the differences in income and living habits that may exist in different cities and regions. Therefore, this study selected three cities in the eastern, central, and western regions of China (HZ, ZZ, XA). Two smart gas stations in different areas were selected in each city. We conducted preliminary interviews with the operators of these six gas stations to understand the digital service facilities and their functions. These six gas stations (A–F) are the same brand as one of the Chinese oil retail giants. As shown in Table 2, these six gas stations are all medium-sized and consistent in terms of environmental visual images are implemented in accordance with the brand identity manual. The service facilities are similar except for the difference in the shape of the refueling tanker. There are two software service providers and three hardware suppliers. As mentioned above, the system functions provided by different service providers are the same. Stations A and F have an AI lane guidance system and a AI behavior recognition system. The AI lane guidance system can identify user information and payment habits in the system. And this system has the function of guiding to designated parking spaces. The behavior recognition system equipped with an artificial intelligence module can identify abnormal behaviors of consumers and employees, and then perform early warning and recording. Since the survey found that these two functions did not interfere with the survey results, the survey data of these two sites were retained. In addition, the survey found that the so-called voice interaction function does not achieve real interaction, only the voice guidance, which guides the operation steps with voice. This functional difference did not affect the results of the study.
After determining the gas station, we recruited interview hosts nearby according to the city where the gas station is located. They are graduate students from the local university. On the same working day, three groups of investigators randomly selected interviewees at the gas station. Full-time drivers, such as taxis, were avoided based on license plate information. In total, 30 people were interviewed. The number of interview samples is determined by the principle of theoretical saturation, and the analysis process starts with collecting a small amount of data under the initial target sample [40]. The interview data of 24 interviewees were finally selected. It includes 12 men and 12 women. The age distribution in the sample is 21–30 years old (25%), 31–40 years old (33.3%), 41–50 years old (29.2%), and 51–60 years old (12.5%), demonstrating that middle-aged and young people are a prime sample source. For the basic information of the interviewees, see Table 5 in Part 4. The gift after completing the interview was a bottle of energy drink or a fuel additive. The result of the selection was that nineteen persons chose fuel additives, and five persons chose beverages.

3.4. Interview Questions

Researchers should have a deep understanding of the problem when entering the research site, but they should not have preconceived notions [42]. Interviewers were recruited through personal recommendations. The interviews were all face-to-face, and the duration of a single interview varied from 5 to 15 min. We produced an interview guide to ensure consistency between different interviewers. Before the formal interview, the interviewer obtained the recording permission from the interviewee. The logic flow of the interview questions is shown in Table 3.
The interview questions mainly come from three research questions, but the detailed questions are based on the sensitivity of the interviewer to the interviewee’s answer. The iterative nature of grounded theory requires researchers to move between data and emerging theory categories. Therefore, the interviewer can modify the interview questions based on the answers or request follow-up questions to clarify the respondent’s answers [43]. After obtaining permission from the interviewees, each interview was recorded and then transcribed into text using iFLYTEK’s speech recognition software, then the content of the interview text was summarized. Finally, 24 valid texts were obtained, forming more than 70,000 words of original data. For grounded analysis, 75% of the samples (18 copies) were randomly selected. The remaining 25% of samples (6 copies) were used for grounded theoretical saturation test analysis.

4. Data Analysis and Results

4.1. Data Analysis

Grounded theory is often described as an inductive data collection process [44]. The research follows the three core steps of procedural grounded theory: open coding, axial coding, and selective coding.

4.1.1. Open Coding

Open coding is the first stage in grounded theory research methods. After repeated reading of the original data, keywords are identified word by word as tags, and then all the tagged sentences are analyzed and compared repeatedly. The process identifies highly abstract generalizations and groups items that reflect similar phenomena into one category to form concepts. In the first stage of open coding, after layer-by-layer conceptualization and abstraction, classification, and induction, 273 basic themes were obtained, corresponding to 31 categories. Table 4 shows the selected results from the process of open coding in the first four columns. Since the coding process involves many original interview records in Chinese, only a selected portion of the coding results is listed.

4.1.2. Axial Coding

The second stage involves main axis coding to summarize the concept and content of the categorization, and discover the connection between the separate categories identified in the open coding process. It also re-establishes the logical relationship between the concepts to group outputs from the open coding. This process of analyzing and clustering the attribution of the 31 initial categories revealed eight underlying concepts.

4.1.3. Selective Coding

The third stage of selective coding is to integrate and construct the core concepts from the discovered concept dimensions under axial coding by combing for internal logic and systematic connections between the concepts. This research explores the internal connections between the eight concepts generated in the axial coding to produce a total of four core concepts. As shown in Table 4, they are respectively A “Scenario Flow” (A1~A2), B “Information Flow” (B1~B2), C “Task Flow” (C1~C2), and D “Emotion Flow” (D1~D2).

4.1.4. Theoretical Saturation Test and Reliability Test
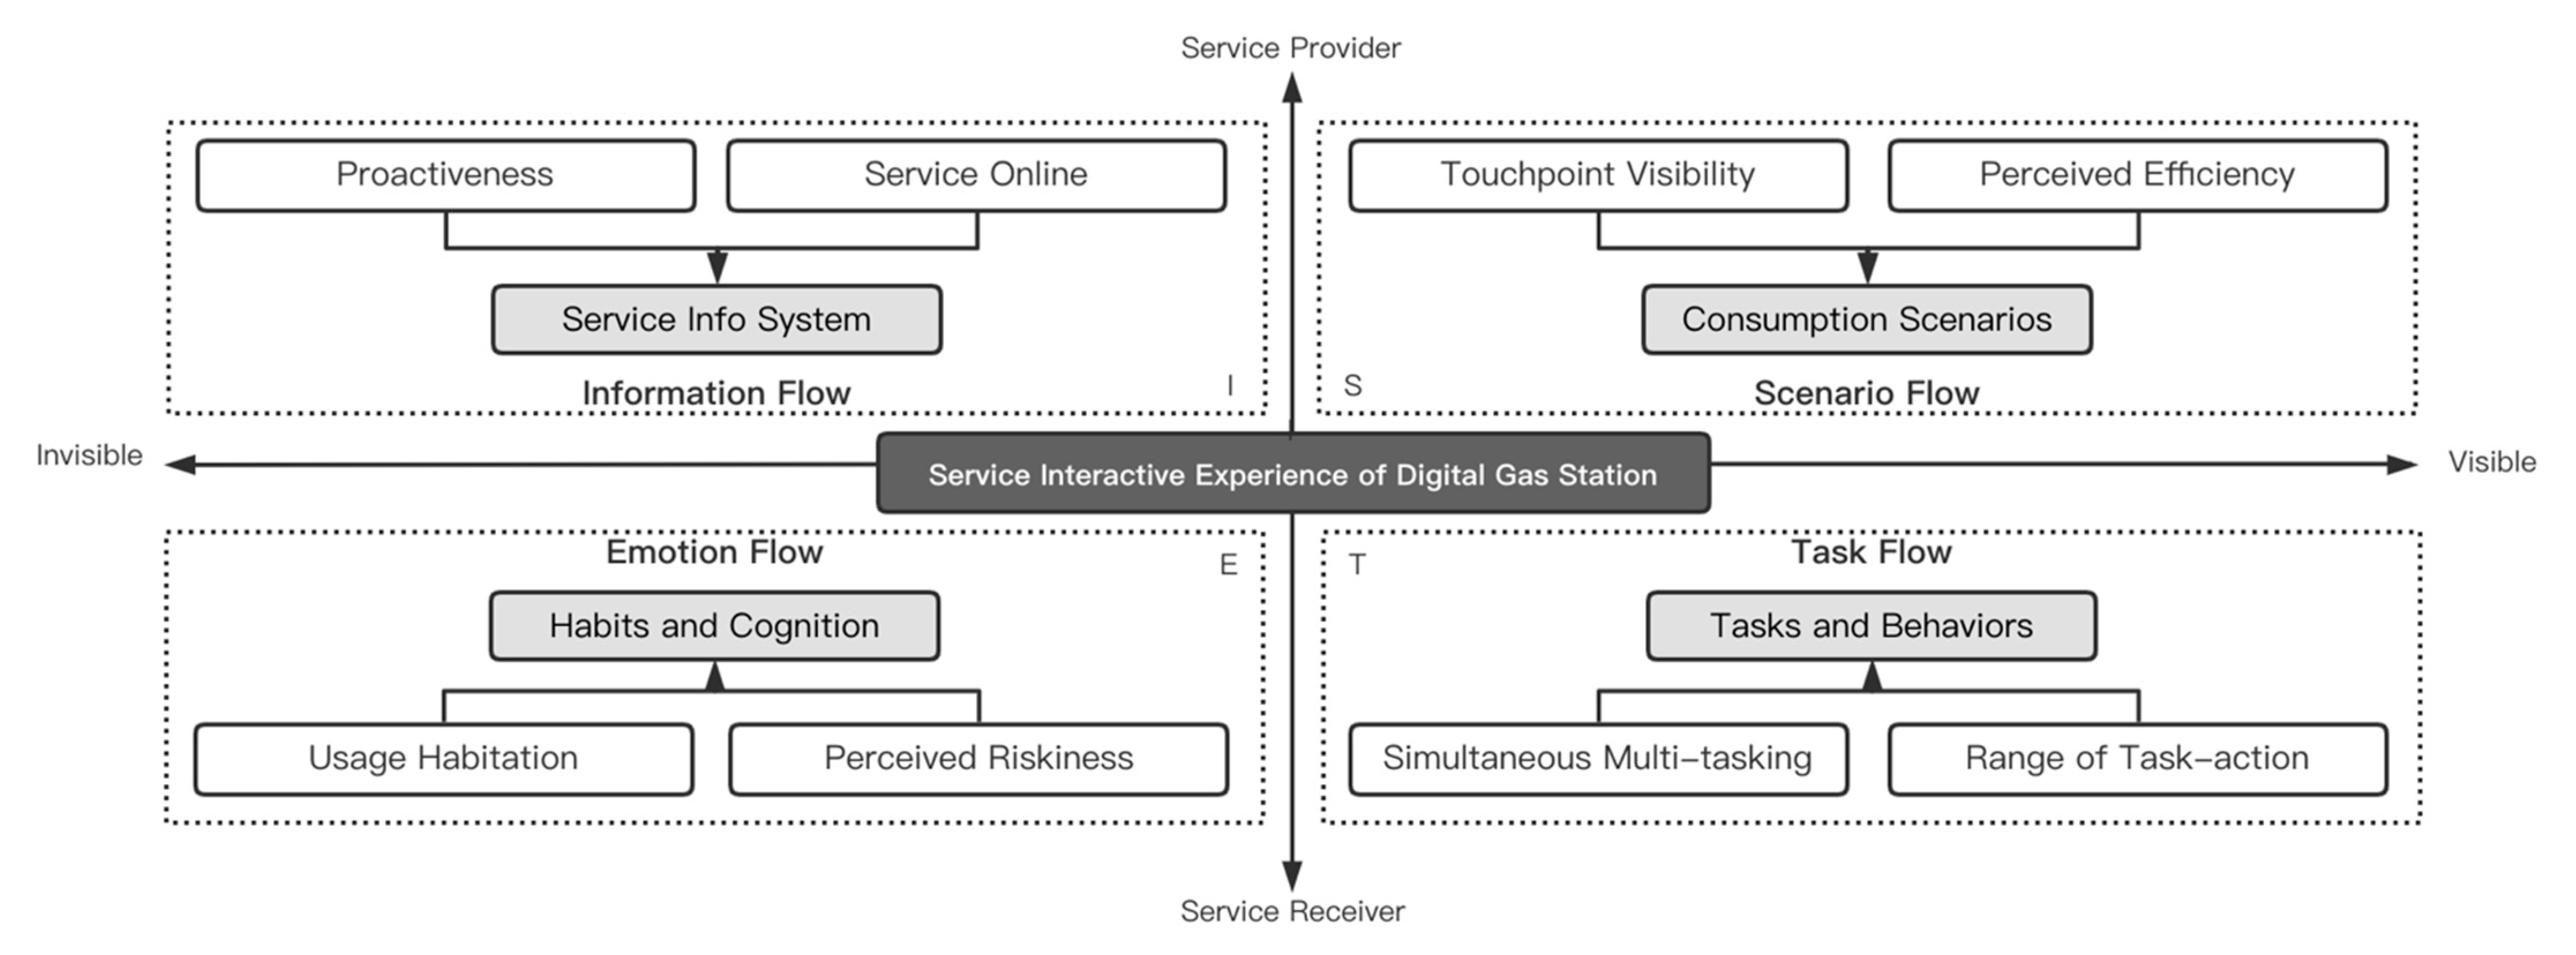
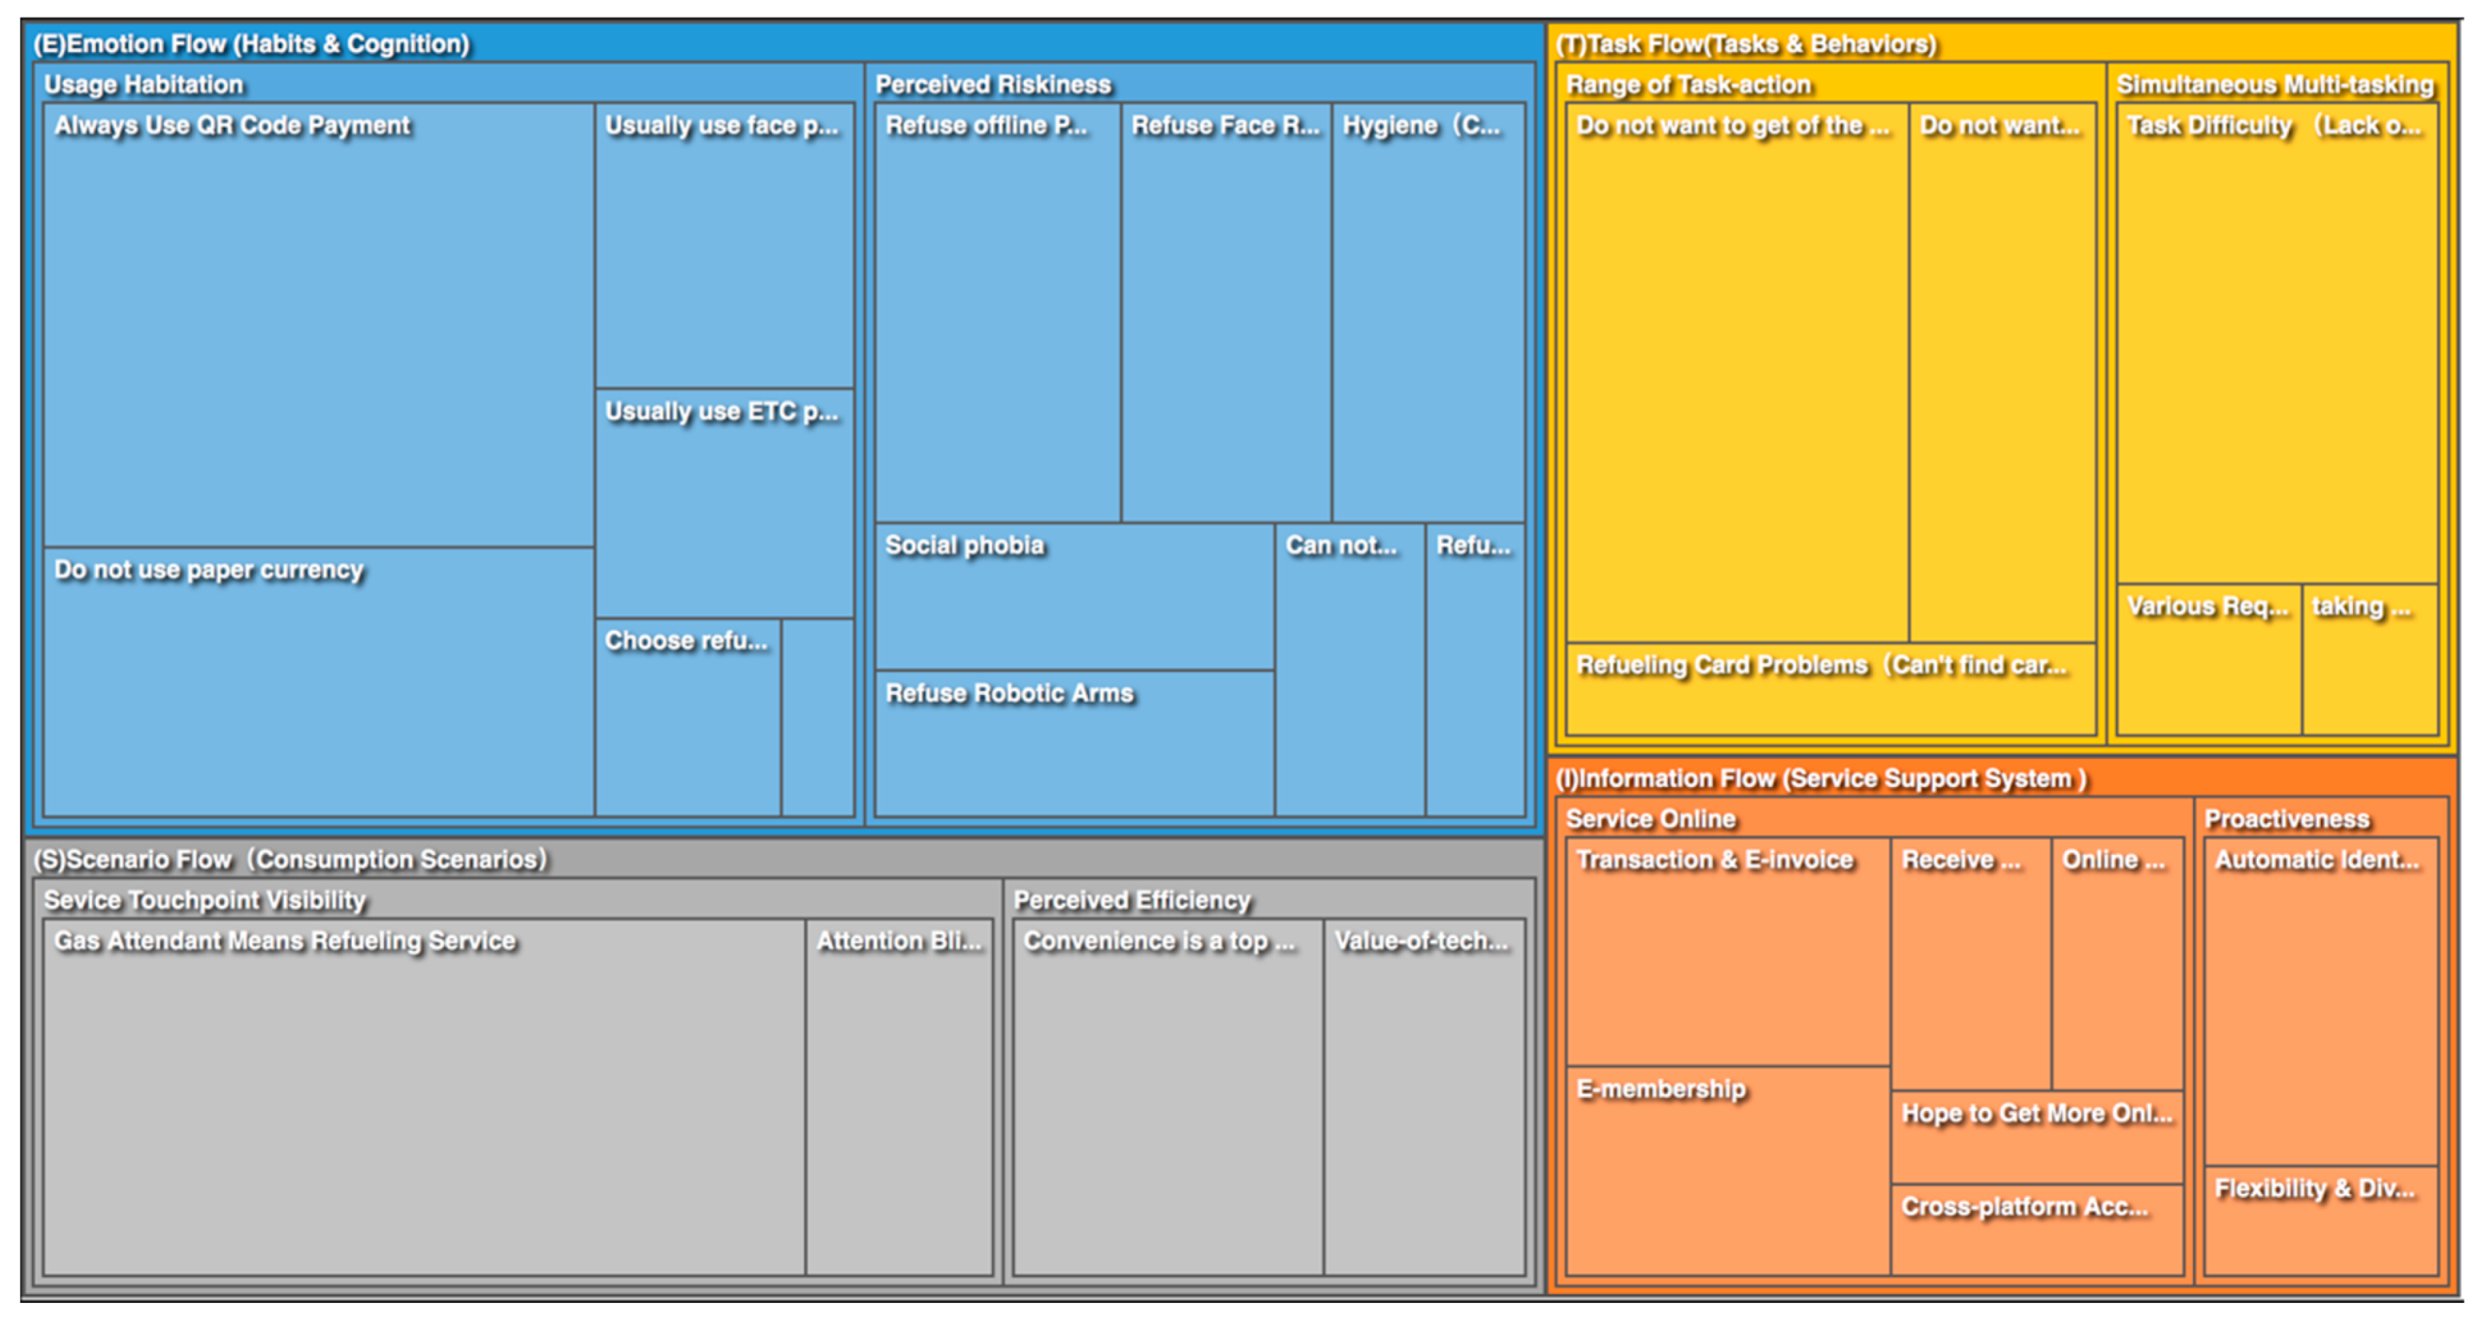
This study uses NVivo12.0 software to encode the collected raw data. To ensure reliability, two graduate students were invited to independently analyze and code eighteen interview records, and then conduct a comprehensive analysis of the coding result to get the final coding result. Finally, six interview records were used to perform a theoretical saturation test.
The theoretical saturation test is a critical step in judging whether sample collection can be terminated in the process of grounded theory research. Theoretical saturation means that when new initial concepts and categories are not precipitated in the collected sample data, saturation has been reached within the sample. To improve the reliability and validity of the research, six interview data were reserved for the second round of extracting analysis codes and testing for theoretical saturation. Through the open coding and main axis coding process of the original interview data of these six interviewees, no new category or theme was discovered. Therefore, the encoding result is theoretically saturated, and there was no need to continue sampling.
The reliability test mainly calculates the coding consistency of the relationship between the concept and the category. The method of calculating coding consistency is the number of mutually agreed responses as a fraction of the total number of responses. The specific process is as follows: the coding group responsible for analyzing the original data assigns the coding concepts to another group of researchers in the research team and then classifies them. All 31 concepts fall into 8 categories. There are 25 mutually agreed concepts between the two groups, and the coding consistency reaches 0.81. The result shows that the coding result has high reliability. The team reached the consensus that a coding consistency of 0.81 was sufficient. The model is summarized based on rich interview data with good sample representativeness. Therefore, the constructed user experience influencing factor model (SITE model) is theoretically saturated. The SITE model is shown in Figure 2.

4.2. Result

As shown in Table 5, the interviewee completed two key tasks and chose the interaction method. The choices of interviewees were as follows: refueling task: face-to-face encounter, 23 persons; self-service, 1 person. Payment task: QR code payment, 13 persons; ETC payment, 5 persons; card payment, 4 persons; cash payment, 2 persons. Combined with the coded data shown in Table 4, the research questions in Table 3, including the reasons for consumer behavior, are answered.
Key Task 1: Refueling. Twenty-three people choose manual service. Half of the interviewees think “Convenience is a top priority” and “Efficiency & Simplicity & Directness” (a3). Approx. 75% of respondents chose “Do not want to get out of the car”; while 71% of respondents think “Refueling Task Difficulty” and “Lack of Operational Skills and experience” (c1); 38% of respondents believe that efficient service is extremely important and “Do not want to wait” (c5); 46% of the respondents, in the end, are dissatisfied, with a distrust of refueling staffs’ manual services. The respondents explain that they “Refuse offline Promote Sales” (d7); 83% believed that the presence of staff means “Gas Attendant means service” (a1). Hence respondents chose manual refilling by staff for reasons of convenience. Furthermore, 25% of respondents “Cannot accept the unmanned service” (d10). This result means that whether unmanned services can be adapted in China needs to be further studied and verified.
Key Task 2: Payment. As shown in Table 5 above, 54% of respondents use QR code payment; 21% of respondents use ETC payment; 17% of respondents use card payment; 8% of respondents use cash payment. However, the interview also uncovered that the installation rate of ETC was very high, accounting for 88% of the interviewees. However, seven interviewees made it clear that they “Usually use ETC payment except here” (d4); at the same time, four of them “Refuse Automatic Payment” (d13).
Figure 3 below is the result of the visualization chart exported by NVivo. The chart shows the frequency of agreement between respondents on the four selective coding results from the grounded analysis (see Table 4). In Figure 3, the relative degree of agreement between the four results is given by the relative size of the areas shaded. Gas attendant means refueling service: 83%; Do not want to get out of the car 75%; Do not use paper currency: 75%; Refueling task difficulty: 71%; Always use QR code payment: 67%; Convenience is a top priority: 50%.

5. Discussion

According to the classification dimensions of the SITE model, the discussion will be carried out from four perspectives: (S) Scenario flow: the consumption scenarios of the service front-stage; (I) Information flow: the information system of the service support back-stage; (T) Task flow: the customers’ behavior in completing key tasks; (E) Emotion flow: consumer cognition and habits.

5.1. (S) Scenario Flow: The Visibility of Service Touchpoints Impact on Service Experience

The results of this study indicate that the impact of service touchpoint visualization on the service experience. The survey found that 83% of people think “Gas Attendant Means Refueling Service” (a1). When asked why they chose manual services, the respondent’s answer is “Why not?” “(HZ-A-01; ZZ-D-16); “There are staffs present” (HZ-A-03; HZ-B-05; XA-F-24); “Why do you have to do it yourself?” (ZZ-D-13); “The service at this gas station is very good; they will not let me refuel by myself” (HZ-B-08). Respondents bind service and good service to the staff. Gas station workers have become visual symbols of perceived service.
Another example is that Gas Station-C does not mark ETC lane markings on the ground. The consumers interviewed stated that they “have been using ETC payment but do not know that this gas station can be used” (ZZ-C-12, ZZ-D-14). The visualization of service functions is important and could be improved.
The survey also found that the kiosk settings do not match the user’s usage process and habits. Consumers want to stay in the car and wait to pay with their mobile phones, “Do Not Want to Get out of (b1) the car” and “do not want to refuel themselves.” Since the kiosk is not on the trajectory of consumer behavior, it has caused a low usage rate. Many interviewees said, “I knew it was newly renovated but did not pay attention to the new fuel dispenser” (XA-E-19); “I know this is a smart gas station, but I do not know how smart the kiosk is” (XA-E-21); “I noticed that there is a new large LCD screen, but I have not used it” (HZ-B-06); “There is no need to get out of the car and look at the tanker” (ZZ-D-13); No one will get out of the car to do facial recognition” (HZ-B-06); “I do not know if the kiosk has a facial recognition function” (HZ-A-4; ZZ-C-12; ZZ-D-14; XA -E-17). These results show that the intelligence and multi-function of kiosks have no chance of being perceived by consumers. Therefore, the fast-moving consumption scenarios of gas stations require visualization of service contacts. In addition, they avoid the blind spot of attention in the service process setting. When consumers are driving at a gas station, scenes are switched, and service touchpoints appear multiple times in various forms. The location should also be in line with consumer behavior to avoid blind spots. The settings of the Kiosk do not match the user’s usage process and user habits. Consumers want to stay in the car and wait to pay with their mobile phones. The information machines of “unwilling to get out of the car” and “unwilling to refuel” are not in the movement line of the consumption process, which creates a blind spot for attention, and therefore, the utilization rate is low. Our findings may be beneficial in adjusting service strategies. The visualization of the service system needs to shift from the interface to the environmental space; it needs to conform to the perceptible principle of information, and it also needs to match the consumers’ behavior status, action trajectory, and task flow.
This result shows that the visibility of information affects the perception of service in contrast with Nielsen’s usability principle [45]. “Visibility of system status”. Good inspiration is generated for the optimization of the service system. The difference is that the information is transformed from a two-dimensional interface to a three-dimensional service space. The triggering, process, and feedback of service tasks can all generate new service touchpoints and interactions. It will be a good opportunity for service design.
The data also showed that 33% of the interviewees expected the robotic arm with no gender difference. Four of the eight persons are female; four are male. They believe that the standardized operation of a high-tech robot arm can bring a better service experience. “The robotic arm is cool” (HZ-A-02; ZZ-D-13; XA-E-17; XA-F-22; XA-F-23); “There will be no sales promotion” (HZ-B-06; ZZ-C-09); “No need to be polite to socialize” (XA-E-17). Of course, there are also opposing voices. 17% of the interviewees refused the service of the robotic arm. They believe that “the speed and flexibility of the robotic arm are not as good as that of humans” (ZZ-C10); “The robot is certainly not reliable” (ZZ-D-16); “If the reaction speed is slow or something goes wrong, it will make me more anxious” (XA-E-18). Previous studies have shown that customers are dissatisfied with the responsiveness of service robots, but with low priority. The reliability of smart services is the top priority [46]. This result is reflective. AI service or human service, which one has the higher perceived efficiency? Hot-blooded service or cold-blooded service, which is more popular among the younger generation? The experience of using robotic arms and artificial intelligence services requires further research.

5.2. (I) Information Flow: System Proactiveness and Online Service Impact on Service Experience

Research data shows that online services based on smartphones provide a sense of convenience to consumers. Approx. 50% of the interviewees put forward, “Convenience is a top priority.” When asked about the performance of convenience, 38% preferred Automatic Identification and Feedback and 13% preferred Flexibility Diversification Payment Methods. It can be said that the digital service system allows consumers to perceive convenience; 42% of respondents use “E-membership”; 29% of respondents need the “Transaction & E-invoice”; 21% of respondents always use “Online top-up”; 13% of respondents get online reminder to come to the gas station; 17% of the respondents “Hope to Get More Online to Offline Services” (buying fast food, picking up delivery, and so on). The smartphone can complete many service tasks. Technology brings changes in service methods. Our data are consistent with more studies that mobiles are useful in the reconfiguration of retail and integration to the service activities [47]. Digital devices and smartphones in the retail environment have had a profound impact on retailers and consumers [48]. Our research data also shows that online services (E-membership, online recharge, promotion reminders) and cross-platform data transmission (online invoices, consumption records) are commonly used. In addition, 17% of consumers hope to get more online services (online grocery shopping, express delivery) at gas stations. Smart devices can more easily provide services with fewer physical space constraints. The online-to-offline (O2O) model brings diversified services. These are all in line with consumers’ demand for diversified and personalized options.
Psychologist Csikszentmihalyi proposed the concept of “Flow”, pointing out that users prefer unconsciousness [49]. For example, driving is a continuation of habitual actions. During the five minutes of parking at the gas station, the changing needs of consumer roles and tasks increase cognitive load. Meanwhile, consumers must maintain their driving posture and habitually inform the staff to complete tasks on their behalf. It is indeed possible to reduce the burden of thinking through good digital design and automation. 42% of the interviewees also raised support for the “Proactiveness” (B1) of services, such as automated identification and feedback. To sum up, our findings provide an opportunity to automate services with the need for low-cognitive frictional interaction methods. Future research is needed to focus on how to provide proactiveness of services for low friction interaction.

5.3. (T) Task Flow: Task Difficulty and Operational Complexity Impact on Service Experience

Gas station service is a functional service. Functional services emphasize the completion of basic tasks that are not optional or achieve customer goals. They are result-oriented and practical [50]. The functional attributes of gas stations determine that consumers must control the vehicle and complete multiple tasks simultaneously. Completing the refueling task is the primary task of service providers and receivers. The research results also show that the willingness of Chinese gas station consumers to self-service is extremely low, with only 4% opting for self-service. Our research found that staff is indispensable in Chinese gas stations, given their current configuration. 25% of the interviewee “cannot accept the unmanned service,” 58% of the interviewees considered themselves “Lack of Operational Skills and experience,” and interviewee XA-E-19 thinks, “I have tried self-service refueling. I need to scan the code or insert a card, select the oil number, operate the refueling gun. However, the sequence of actions is not clear, and the operation process is not clear. I need to do it at the same time. Pay attention to the car, the fuel gun, and the screen; I do not know where to focus, I feel very stressed.” Therefore, we believe that the difficulty of the task and the multi-tasking required have a negative impact on the service experience. Therefore, our research supports the TPB model [26]. “Perceived behavioral control (PBC)” affects the intention to use, thereby influencing the choice of behavior.
However, compared with the previous studies, due to industry differences and task difficulty differences, our findings are different. Zeithaml et al. found that the role of service personnel in human–computer interaction service contact is limited, and only when customers are in trouble will they ask the service personnel for help [19]. The variability in results should be attributed to differences in task difficulty and industry. Our findings agree with the view that services that require stronger human–computer interaction or human touch will hardly be replaced by AI, at least in the short term [51]. At McDonald’s, the touch-screen kiosk ordering system replaces frontline workers [52]. The success of McDonald’s digital ordering system was implemented after the realization of self-service. However, Chinese gas stations have not experienced the self-service stage and have not cultivated the habit and ability of self-service. It is the primary reason why consumers still choose human services at this stage.
This part of the research data strongly supports the TAM model [27]; The user’s behavior status can be used as an antecedent variable to affect the acceptance attitude. At gas stations, consumers’ in-vehicle status processes multiple tasks, the range of actions to complete the tasks, and the synchronization of multiple tasks can all be used as antecedent variables that affect perceived ease of use. In this study, we found that the choice of consumers’ service interaction methods is driven by consumers’ estimation of the convenience and difficulty of processes and tasks. 75% of the interviewees unanimously proposed “Do Not Want to Get out of the car “(c4). The special service scenarios of gas stations require efficient circulation of vehicles. Chinese gas stations are usually extremely busy. The particularity of service scenarios at gas stations requires efficient completion of refueling and payment, together with smooth traffic flow. Therefore, in such a situation consumers prefer not to get out of the car, so that they can control the mobility of the car at any time. This situation also explains why the main appeal of consumers is “Do Not Want to Get out of the car.” Thus, the design of intelligent service systems for gas stations must first solve the problem of matching the service process and user behavior. It is indeed difficult to complete the refueling task, the payment task, and the driving task simultaneously. Interviewees indicated that they “need to operate the car” (HZ-B-06); “It feels more reliable to hold the steering wheel” (XA-F-21); “I do not even want to untie the seat belt (XA-E-17; ZZ) -D-14); “Cannot leave the car” (XA-F-21); “There are children/pets in the car” (XA-F-21; XA-F-23). The process of user experience formation is the combined result of the interaction of the user, the context, and the system [34]. In the gas station context, both car and driver are classified as service receivers. Therefore, for each customer served, the service range needs to be expanded and designed to meet both the needs of the car and the driver. Therefore, numerous design opportunities can be created from the context, system, and user [34]. Secomandi and Snelders proposed a service design to identify and coordinate new service processes by exploring customer activities [24]. The design of decentralizing key tasks in time and space to make the process more linear, with fewer simultaneous tasks, will further study.

5.4. (E) Emotion Flow: Habituation and Cognition Impact on Service Experience

It can be seen from the choice of payment method that consumer behavior of individuals follows their behavioral habits. 67% of respondents are accustomed to using mobile phones to scan QR codes for payment. Scanning payment has become very common in China. People will subconsciously think they need to scan and pay via mobile phones wherever QR codes appear in unmanned retail stores [53]. Digital payment has become the social norm. Digital infrastructure is a “social technology system” [54]. In addition to technology, it is more important to be embedded in the social context. More and more non-contact interactions are expanding from online to offline through voice assistants, facial recognition, or mobile phone applications. China has become a society without paper money. The social scenario of a digital existence is cashless, cardless, with online transactions of all types, and contactless payments have led to the design opportunity for “untact” services [55]. Such contactless services can meet many consumer needs. Given this, gas stations should embrace opportunities to provide services in this manner.
Approx. 25% of respondents said that part of the reason they were unwilling to refuel themselves was “Hygiene (a6).” They “do not want to touch the fuel pump” (HZ-B-06, XA-E-20) and “do not want to touch things outside” (HZ-A-04, HZ-B-06, ZZ-D-13, XA- F-22) “I am worried about getting gasoline” (ZZ-D-13), “Cannot bear the smell of gasoline” (HZ-A-01). We also paid attention to masks, even though COVID-19 currently has minimal impact on China’s service industry. However, gas station staff always wear masks and keep a safe distance from consumers to avoid contact. What is interesting is that masks are not only to prevent viruses. When two female consumers were asked why they were wearing masks, they said, “I do not have makeup” (XA-E-19) and “Social fear, I do not want others to see me” (ZZ-D-14).
Furthermore, through on-site observations, we questioned the necessity of adding face recognition to kiosks. We think it is more appropriate to use vehicle identification at gas stations. At the same time, 29% of the interviewees rejected face recognition because of security. Approx. 33% of the interviewees usually use a smartphone to pay with face but have not used face recognition at kiosks at gas stations. Interviewees (XA-E-19, ZZ-D-14) said that they always use mobile phone to pay with face, but never use face recognition in public places. However, the survey found that 75% of the interviewees have activated the mobile phone face recognition function, a total of 18 people. Eight of them expressed their unwillingness to use face payment “Usually Use Face Payment except Here (a2)” on kiosks, including one person born in the 60 s (XA-E-17); two people born in the 70 s (ZZ-C-12; XA-F-21); three people born in the 80 s (HZ-A-04; ZZ-D-14; ZZ-D-15); and two people born in the 90 s (HZ-B-06; XA-E-19). Interviewees indicated that this attitude toward new technologies was based on media coverage. (ZZ-C-10; XA-E-18). After all, digital transformation is a gradual process. However, the impact of technology on service innovation is gradual or radical [56]. Although many scholars have raised concerns about the security of personal biometric information, many nascent platforms and systems in China have grown rapidly in the context of an institutional void [7]. In any case, China’s active application of new technologies promotes the practice and development of service innovation.

6. Conclusions and Recommendations

This article collects data through semi-structured interviews and uses grounded theory research methods to code qualitative data. The influencing factors of digital service interactive experiences at gas stations are analyzed. The constructed theoretical model interprets the driving factors of digital service user experience from four dimensions. (1) Offline scenario flow. Perceived efficiency remains the primary criterion. To accommodate driving customers’ service information must be redundant. Facility functions must be “Affordance” [57]. That is, they must be visible to the user. The blind spot of attention shows that the design of intelligent service systems must first solve the problem of matching service touchpoints and user behaviors. (2) Online information flow. The mobile phone online service function is very widely available. Proactive implementation of further services on this platform needs to be promoted. (3) Task flow. The functional attributes of gas stations determine that consumers must control the vehicle and complete multiple tasks simultaneously. Consumers’ choice of service interaction modes is determined by evaluating task difficulty, convenience, and process. The service system should reduce the load of processing tasks to match the service scenario and optimize the service processing simultaneously. The coordination of tasks and actions is a challenge. The use of intelligent facilities to decompose the difficulty of tasks and reduce the complexity of operation steps is one aspect for consideration. Another creative direction is reducing the aggregation of tasks within the same space and time. (4) Emotional flow. It was found that consumers’ demand for “untact” [55] services is high, whether in terms of information security or hygiene. Also, the universality of QR code payment in China offers further opportunities. Smartphone-linked services are even more needed. Above all, the SITE model not only categorizes the four dimensions of service experience but also clarifies the key factors of gas station service experience, which has important theoretical and practical guiding significance for the realization of intelligent services in the future.
The theoretical contributions are as follows: First, the work has provided new research perspectives and objects. These include using service design and experience design principles to study digital service interactions. Second, applying the abovementioned research perspectives and objects in the context of gas station digital design and consumer interactions. Consumers’ behavior in driving conditions is an area requiring further research to optimize gas station digital design. This study also further improves the application fields of user experience research. Third, the use of novel data collection and analysis methods. Data are collected by both observation and semi-structured interviews of consumers and gas station managers. Comparison of information from gas station business owners and consumers facilitated the identification of key issues. Finally, grounded theory was used for the inductive analysis of on-field interview data.
Our findings are of value to practice. First, the research results clarify the impact of task difficulty, service process, and behavior status on consumers’ service experience. Second, it is clarified that “usability” [45] is not only applicable to product systems but also applicable to service systems. Third, it is believed that service touchpoints must be visible, avoid visual blind spots, and fit consumer behavior trends. The “affordance” [57] of service touchpoints needs to be emphasized. Findings reflect a need for the optimization of service processes and an increase in the availability of service touchpoints that are within the visible range of consumer behaviors. Furthermore, the cognitive load and task load for consumers need to be reduced. Key tasks should be discretely designed on both time and space axes. In all, these findings provide data to support the optimization of digital transformation strategies.
Our study had several limitations. First, the hotly discussed electric charging pile transformation of gas stations is not within the scope of this study. The purpose of our research is to investigate and analyze the current digital transformation and the application of tablet kiosks from the perspective of service interaction. Second, because field interviews were chosen, the interview time is limited and varies in length because it is a busy environment. Interview lengths varied between 5 min and 20 min. Nevertheless, the difference in the amount of information extracted was not significant, with 19 and 23 nodes recorded, respectively. In all the data, the least nodes recorded were 14 nodes, and the most were 30 nodes. Hence the length of the interview was not positively correlated with the amount of node information. Additionally, because we determined the number of samples required based on information saturation, the final sample size used is not large. Third, our study subjects were in China’s three capital cities in the east and west. Therefore, it is unknown to what extent our results apply to other groups and regions within China or other countries. However, this study is exploratory. Future research could expand the sample size and include new locations. Formulation of a more general and universal research model for quantitative research and verification would be valuable. Quantitative research should aim to operationally define the variable categories involved in the model and use large-scale questionnaire surveys to test the exact relationship between the variable categories in the model. Finally, a strategy for improving the in-vehicle user experience is proposed.

Author Contributions

Conceptualization, F.L. and Y.P.; methodology, F.L.; software, F.L.; validation, F.L.; formal analysis, F.L.; investigation, F.L.; data curation, F.L.; writing—original draft preparation, F.L.; writing—review and editing, F.L.; visualization, F.L.; supervision, Y.P. Both authors have read and agreed to the published version of the manuscript.

Funding

This research was funded by the Cultivation Programme for Young Backbone Teachers in Henan University of Technology.

Institutional Review Board Statement

This study was approved by the Institutional Review Board (IRB) at the Henan University of Technology.

Informed Consent Statement

Informed consent was obtained from all participants involved in the study.

Data Availability Statement

All data generated or analyzed during this study are included in this article. The raw data are available from the corresponding author upon reasonable request.

Acknowledgments

The authors would like to thank all the participants in this study for their time and willingness to share their experiences and feelings.

Conflicts of Interest

The authors declare no conflict of interest concerning the research, authorship, and publication of this article.

References

  1. Davenport, T.; Guha, A.; Grewal, D.; Bressgott, T. How Artificial Intelligence Will Change the Future of Marketing. J. Acad. Mark. Sci. 2020, 48, 24–42. [Google Scholar] [CrossRef] [Green Version]
  2. Becker, W.; Schmid, O.; Botzkowski, T. Role of CDOs in the Digital Transformation of SMEs and LSEs. An Empirical Analysis. In Proceedings of the 51st Hawaii International Conference on System Sciences, Honolulu, HI, USA, 3–6 January 2018; pp. 4534–4545. [Google Scholar] [CrossRef] [Green Version]
  3. Parida, V.; Sjödin, D.; Reim, W. Reviewing Literature on Digitalization, Business Model Innovation, and Sustainable Industry: Past Achievements and Future Promises. Sustainability 2019, 11, 391. [Google Scholar] [CrossRef] [Green Version]
  4. OECD. The Digitalisation of Science. Technology and Innovation; OECD: Paris, France, 2020; p. 29. [Google Scholar]
  5. Bosi Data Research Center. China Gas Station Market Monitoring and Investment Prospect Research Report; Bosi Data Research Center: Beijing, China, 2017; pp. 37–42. [Google Scholar]
  6. The Research Group of Development Research Center of the State Council. Make Full Use of the Super-Large-Scale Effect and Promote China’s Economy from ‘Super-Large’ to ‘Super-Efficient’; The Research Group of Development Research Center of the State Council: Beijing, China, 2020. [CrossRef]
  7. Yang, L.; Jiang, W. Digital Innovation Management: Theoretical Framework and Future Research. J. Manag. World 2020, 7, 198–218. [Google Scholar] [CrossRef]
  8. Yoo, Y.; Henfridsson, O.; Lyytinen, K. The New Organizing Logic of Digital Innovation: An Agenda for Information Systems Research. Inf. Syst. Res. 2010, 21, 724–735. [Google Scholar] [CrossRef]
  9. Yoo, Y.; Boland, R.J.; Lyytinen, K.; Majchrzak, A. Organizing for Innovation in the Digitized World. Organ. Sci. 2012, 23, 1398–1408. [Google Scholar] [CrossRef]
  10. Tilson, D.; Lyytinen, K.; Sørensen, C. Digital Infrastructures: The Missing IS Research Agenda. Inf. Syst. Res. 2010, 21, 748–759. [Google Scholar] [CrossRef]
  11. Henfridsson, O.; Bygstad, B. The Generative Mechanisms of Digital Infrastructure Evolution. MIS Q. 2013, 37, 907–931. [Google Scholar] [CrossRef]
  12. Boudreau, K.J. Let a Thousand Flowers Bloom? An Early Look at Large Numbers of Software “Apps” Developers and Patterns of Innovation. SSRN J. 2011, 23, 1409–1427. [Google Scholar] [CrossRef]
  13. Bharadwaj, A.; El Sawy, O.A.; Pavlou, P.A.; Venkatraman, N. Digital Business Strategy: Toward a Next Generation of Insights. MIS Q. 2013, 37, 471–482. [Google Scholar] [CrossRef]
  14. Nambisan, S.; Lyytinen, K.; Majchrzak, A.; Song, M. Digital Innovation Management: Reinventing Innovation Management Research in a Digital World. MIS Q. 2017, 41, 223–238. [Google Scholar] [CrossRef]
  15. Bundy, A. Preparing for the Future of Artificial Intelligence. AI Soc. 2017, 32, 285–287. [Google Scholar] [CrossRef] [Green Version]
  16. Ahearne, M.; Jones, E.; Rapp, A.; Mathieu, J. High Touch through High Tech: The Impact of Salesperson Technology Usage on Sales Performance via Mediating Mechanisms. Manag. Sci. 2008, 54, 671–685. [Google Scholar] [CrossRef]
  17. Abrell, T.; Pihlajamaa, M.; Kanto, L.; vom Brocke, J.; Uebernickel, F. The Role of Users and Customers in Digital Innovation: Insights from B2B Manufacturing Firms. Inf. Manag. 2016, 53, 324–335. [Google Scholar] [CrossRef]
  18. Rafaeli, A.; Altman, D.; Gremler, D.D.; Huang, M.-H.; Grewal, D.; Iyer, B.; Parasuraman, A.; de Ruyter, K. The Future of Frontline Research: Invited Commentaries. J. Serv. Res. 2017, 20, 91–99. [Google Scholar] [CrossRef]
  19. Zeithaml, V.A.; Parasuraman, A.; Malhotra, A. Service Quality Delivery through Web Sites: A Critical Review of Extant Knowledge. J. Acad. Mark. Sci. 2002, 30, 362–375. [Google Scholar] [CrossRef] [Green Version]
  20. Patrício, L.; Fisk, R.P.; Falcão e Cunha, J. Designing Multi-Interface Service Experiences: The Service Experience Blueprint. J. Serv. Res. 2008, 10, 318–334. [Google Scholar] [CrossRef]
  21. Ahearne, M.; Rapp, A. The Role of Technology at the Interface between Salespeople and Consumers. J. Pers. Sell. Sales Manag. 2010, 30, 111–120. [Google Scholar] [CrossRef]
  22. Shostack, G.L. Planning the Service Encounter; Lexington Books: Lexington, KY, USA, 1985. [Google Scholar]
  23. Saco, R.M.; Goncalves, A.P. Service Design: An Appraisal. Des. Manag. Rev. 2010, 19, 10–19. [Google Scholar] [CrossRef]
  24. Secomandi, F.; Snelders, D. The Object of Service Design. Des. Issues 2011, 27, 15. [Google Scholar] [CrossRef]
  25. Parasuraman, A. Technology Readiness Index (Tri): A Multiple-Item Scale to Measure Readiness to Embrace New Technologies. J. Serv. Res. 2000, 2, 307–320. [Google Scholar] [CrossRef]
  26. Ajzen, I. The theory of planned behavior. Organ. Behav. Hum. Decis. Process. 1991, 50, 179–211. [Google Scholar] [CrossRef]
  27. Davis, F. Perceived Usefulness, Perceived Ease of Use, and User Acceptance of Information Technology. MIS Q. 1989, 13, 319. [Google Scholar] [CrossRef] [Green Version]
  28. Wirtz, J.; Patterson, P.G.; Kunz, W.H.; Gruber, T.; Lu, V.N.; Paluch, S.; Martins, A. Brave New World: Service Robots in the Frontline. JOSM 2018, 29, 907–931. [Google Scholar] [CrossRef] [Green Version]
  29. Gursoy, D.; Chi, O.H.; Lu, L.; Nunkoo, R. Consumers Acceptance of Artificially Intelligent (AI) Device Use in Service Delivery. Int. J. Inf. Manag. 2019, 49, 157–169. [Google Scholar] [CrossRef]
  30. ISO 9241-210. Ergonomics of Human-System Interaction—Part 210: Human-Centered Design for Interactive Systems; ISO: Geneva, Switzerland, 2008. [Google Scholar]
  31. Goh, J.C.-L.; Karimi, F. Towards the development of a ‘user-experience’ technology adoption model for the interactive mobile technology. In International Conference on HCI in Business; Springer International Publishing: Cham, Switzerland, 2014; Volume 8527, pp. 620–630. [Google Scholar] [CrossRef]
  32. Rodden, K.; Hutchinson, H.; Fu, X. Measuring the User Experience on a Large Scale: User-Centered Metrics for Web Applications; Association for Computing Machinery: New York, NY, USA, 2006. [Google Scholar]
  33. Thüring, M.; Mahlke, S. Usability, Aesthetics and Emotions in Human–Technology Interaction. Int. J. Psychol. 2007, 42, 253–264. [Google Scholar] [CrossRef]
  34. Hassenzahl, M.; Tractinsky, N. User Experience—A Research Agenda. Behav. Inf. Technol. 2006, 25, 91–97. [Google Scholar] [CrossRef]
  35. Jennings, G.; Kensbock, S.; Junek, O.; Radel, K.; Kachel, U. Lived Experiences of Early Career Researchers: Learning About and Doing Grounded Theory. J. Hosp. Tour. Manag. 2010, 17, 21–33. [Google Scholar] [CrossRef] [Green Version]
  36. Znjchina. Ali Will Build the First Smart Gas Station in Hangzhou. 2017. Available online: http://www.znjchina.com/yj/13217.html (accessed on 18 April 2021).
  37. Inman, J.J.; Nikolova, H. Shopper-Facing Retail Technology: A Retailer Adoption Decision Framework Incorporating Shopper Attitudes and Privacy Concerns. J. Retail. 2017, 93, 7–28. [Google Scholar] [CrossRef]
  38. Charmaz, K. Constructing Grounded Theory, 2nd ed.; SAGE Publications Ltd.: Thousand Oaks, CA, USA, 2014. [Google Scholar]
  39. Corbin, J.; Strauss, A. Basics of Qualitative Research: Techniques and Procedures for Developing Grounded Theory, 4th ed.; SAGE Publications: Thousand Oaks, CA, USA, 2014. [Google Scholar]
  40. Kathy, C.C. Constructing Grounded Theory: A Practical Guide Through Qualitative Analysis; SAGE: London, UK, 2006. [Google Scholar]
  41. Morse, J.M. Sampling in Grounded Theory. In The SAGE Handbook of Grounded Theory; SAGE Publications: Thousand Oaks, CA, USA, 2007. [Google Scholar]
  42. Weed, M. Research Quality Considerations for Grounded Theory Research in Sport & Exercise Psychology. Psychol. Sport Exerc. 2009, 10, 502–510. [Google Scholar]
  43. Lawrence, J.; Tar, U. The Use of Grounded Theory Technique as a Practical Tool for Qualitative Data Collection and Analysis. Electron. J. Bus. Res. Methods 2013, 11, 13. [Google Scholar]
  44. Morse, J. Situating grounded theory within qualitative inquiry. In Using Grounded Theory in Nursing; Schreiber, R., Stern, P.N., Eds.; Springer: New York, NY, USA, 2001; pp. 1–16. [Google Scholar]
  45. Nielsen, J. 10 Usability Heuristics for User Interface Design. 1994. Available online: https://www.nngroup.com/articles/ten-usability-heuristics/ (accessed on 20 August 2021).
  46. Chiang, A.-H.; Trimi, S. Impacts of Service Robots on Service Quality. Serv. Bus. 2020, 14, 439–459. [Google Scholar] [CrossRef]
  47. Fuentes, C.; Bäckström, K.; Svingstedt, A. Smartphones and the Reconfiguration of Retailscapes: Stores, Shopping, and Digitalization. J. Retail. Consum. Serv. 2017, 39, 270–278. [Google Scholar] [CrossRef]
  48. Hagberg, J.; Sundstrom, M.; Egels-Zandén, N. The Digitalization of Retailing: An Exploratory Framework. Int. J. Retail. Distrib. Manag. 2016, 44, 694–712. [Google Scholar] [CrossRef]
  49. Mihaly, C. Beyond Boredom and Anxiety; Jossey-Bass Publishers: San Francisco, CA, USA, 1975. [Google Scholar]
  50. Dhar, R.; Wertenbroch, K. Consumer Choice between Hedonic and Utilitarian Goods. J. Mark. Res. 2000, 37, 60–71. [Google Scholar] [CrossRef]
  51. Giebelhausen, M.; Robinson, S.G.; Sirianni, N.J.; Brady, M.K. Touch Versus Tech: When Technology Functions as a Barrier or a Benefit to Service Encounters. J. Mark. 2014, 78, 113–124. [Google Scholar] [CrossRef]
  52. Hollis, J. Fast Food Workers Are Becoming Obsolete; Business Insider: New York, NY, USA, 2016. [Google Scholar]
  53. Zou, J.; Bao, Y. The Analysis on User Experience of Unmanned Retail Stores from the Perspective of Affordance. Zhuangshi 2019, 10, 112–115. [Google Scholar] [CrossRef]
  54. Constantinides, P.; Henfridsson, O.; Parker, G.G. Introduction—Platforms and Infrastructures in the Digital Age. Inf. Syst. Res. 2018, 29, 381–400. [Google Scholar] [CrossRef] [Green Version]
  55. Lee, S.M.; Lee, D. “Untact”: A New Customer Service Strategy in the Digital Age. Serv. Bus. 2020, 14, 1–22. [Google Scholar] [CrossRef]
  56. Ordanini, A.; Parasuraman, A. Service Innovation Viewed Through a Service-Dominant Logic Lens: A Conceptual Framework and Empirical Analysis. J. Serv. Res. 2011, 14, 3–23. [Google Scholar] [CrossRef]
  57. James, J.G. The Ecological Approach to Visual Perception; Houghton Mifflin Company: Boston, UK, 1979. [Google Scholar]
Figure 1. Research Process.
Jtaer 16 00120 g001
Figure 2. The SITE model of influencing factors of service interactive experience of digital gas stations.
Jtaer 16 00120 g002
Figure 3. Hierarchical chart generated by NVivo: Nodes compared by the number of coding references.
Jtaer 16 00120 g003
Table 1. These are tools for completing key tasks in different service interaction modes.
Service Interactive ModeKey Task
Task RecognitionRefuelingPayment
Face-To-Face InteractionLanguageStaff Manual RefuelingRefueling Card\Cash\QR Code Payment
Self-Service InteractionKeypadConsumers Manual RefuelingRefueling Card\QR Code Payment
Intelligent Service InteractionLicense Plate Recognition\
Face-Recognition\
Voice Interaction
Robot Arm RefuelingETC\
Face Recognition\
License Plate Recognition Payment
Table 2. Basic functional information of six interviewed gas stations.
FunctionHZ-AHZ-BZZ-CZZ-DXA-EXA-F
Mobile Payment
ETC Payment
Face Recognition
Voice Guidance
Wechat Official Accounts
Recommendation in Kiosk
AI Behavior Recognition
AI Lane Guidance
Table 3. The examples of interview questions developed based on research questions.
Research QuestionsInterview Questions
1Interviewee behavior
(Choice of service interactive: face-to-face/self-service)
1.1.
How did you complete the refueling mission? Self-service or staff operation?
1.2.
How do you complete the payment task? What payment method did you choose? (Cash/gas card/mobile payment/ETC/face recognition)
2Interviewee’s psychological perception (What are their underlying reasons for Using this way?)
2.1.
Why choose this method?
2.2.
Why not choose that method?
2.3.
Are there any special reasons why you use/not use tablet kiosk?
3Interviewee’s attitude towards intelligent services.
3.1.
Can you accept the refueling of the robotic arm?
3.2.
Can you accept automatic payments? What do you think of senseless payment?
3.3.
Can you accept unmanned service at gas stations?
Table 4. Overview of grounded theory coding analysis.
Open CodingRef No.Files
(ppl)
Probability
(%)
Axial CodingProbability (%)Selective Coding
Gas Attendant Means Refueling Servicea12083%A1
Service Touchpoint Visibility
88% *A
Scenario Flow
(S):
Consumption Scenarios
Attention Blindness
(Not Noticed ETC Lane, Led Information Screen, Tablet Fuel Dispenser)
a2625%
Convenience is a Top Priority
(Efficiency & Simplicity & Directness)
a31250%A2
Perceived Efficiency
63% *
Value-of-tech
(Expect the High-tech Sense Robot Arm)
a4833%
Automatic Identification and Feedbackb1938%B1
Proactiveness
42%B
Information Flow
(I):
Service Support System
Flexibility Diversification Payment Methodsb2313%
E-membershipb31042%B2
Service Online
71% *
Transaction and E-invoiceb4729%
Online Top-upb5521%
Receive Notice from Official Accountb6521%
Hope to Get More Online Servicesb7417%
Cross-platform Access to Informationb8417%
Refueling Task Difficulty
(Lack of Operational Skills; Too Much Stress and Attention For Self-fueling)
c11771%C1
Simultaneous Multi-tasking
75% *C
Task Flow
(T):
Tasks & Behaviors
Taking Care of the Car While Refueling
(Baby/Pets in the Car…)
c2313%
Various Requirements
(Convenience Store, Toilet…)
c3313%
Do Not Want to Get out of the car
(Self-service refueling requires getting off/on)
c41875%C2
Range of Task-action
88% *
Do Not Want to Wait
(Queuing for fuel requires multiple start/stop)
c5938%
Refueling Card Problems
(Can’t find card, wrong PIN, forgotten PIN, insufficient balance)
c6521%
Do Not Use Paper Currencyd11875%D1
Usage Habituation
92% *D
Emotion Flow
(E):
Habits and Cognition
Always Use QR Code Paymentd21667%
Usually Use Face Payment Except Hered3833%
Usually Use ETC Payment Except Hered4729%
Choose Refueling Card Paymentd5313%
Only Use Cash at Gas Stationd628%
Refuse Offline Promote Salesd71146%D2
Perceived Riskiness
88% *
Refuse Face Recognitiond8729%
Hygiened9729%
Can Not Accept the Unmanned Serviced10625%
Social Phobiad11417%
Refuse Robotic Armsd12417%
Refuse Automatic Paymentd13417%
Note: The open coding serial numbers are arranged from high to low according to frequency; * means that the probability of attention is more than half.
Table 5. Interview information and results.
ParticipantRegionCodeGenderAge RangePayment MethodService EncounterETC
Has Been
Installed
Mobile
Has Activated
Face-Recognition
1EastHZ-A-01Male41–50 years oldETC PaymentFace-to-face Service
2EastHZ-A-02Female31–40 years oldMobile PaymentFace-to-face Service
3EastHZ-A-03Male41–50 years oldCard PaymentSelf-service
4EastHZ-A-04Male31–40 years oldMobile PaymentFace-to-face Service
5EastHZ-B-05Female21–30 years oldMobile PaymentFace-to-face Service
6EastHZ-B-06Male21–30 years oldMobile PaymentFace-to-face Service
7EastHZ-B-07Female21–30 years oldMobile PaymentFace-to-face Service
8EastHZ-B-08Male31–40 years oldMobile PaymentFace-to-face Service
9CentralZZ-C-09Male41–50 years oldMobile PaymentFace-to-face Service
10CentralZZ-C-10Female51–60 years oldCard PaymentFace-to-face Service
11CentralZZ-C-11Female21–30 years oldMobile PaymentFace-to-face Service
12CentralZZ-C-12Female41–50 years oldMobile PaymentFace-to-face Service
13CentralZZ-D-13Male31–40 years oldMobile PaymentFace-to-face Service
14CentralZZ-D-14Female31–40 years oldCash PaymentFace-to-face Service
15CentralZZ-D-15Male31–40 years oldETC PaymentFace-to-face Service
16CentralZZ-D-16Female41–50 years oldETC PaymentFace-to-face Service
17WestXA-E-17Male51–60 years oldCash PaymentFace-to-face Service
18WestXA-E-18Male51–60 years oldCard PaymentFace-to-face Service
19WestXA-E-19Female21–30 years oldMobile PaymentFace-to-face Service
20WestXA-E-20Male41–50 years oldCard PaymentFace-to-face Service
21WestXA-F-21Male41–50 years oldMobile PaymentFace-to-face Service
22WestXA-F-22Female31–40 years oldETC PaymentFace-to-face Service
23WestXA-F-23Female21–30 years oldETC PaymentFace-to-face Service
24WestXA-F-24Female31–40 years oldMobile PaymentFace-to-face Service
Publisher’s Note: MDPI stays neutral with regard to jurisdictional claims in published maps and institutional affiliations.

