Article

How Does Mobile Page Speed Shape in-between Touchpoints in the Customer Journey? A Research Regarding the Most Trusted Retailers in Romania

by
Eliza Nichifor
*,
Radu Constantin Lixăndroiu
,
Ioana Bianca Chițu
,
Gabriel Brătucu
and
Adrian Trifan
Faculty of Economic Sciences and Business Administration, Transilvania University of Braşov, Colina Universității Street no. 1, Building A, 500068 Braşov, Romania
*
Author to whom correspondence should be addressed.
J. Theor. Appl. Electron. Commer. Res. 2021, 16(5), 1369-1389; https://doi.org/10.3390/jtaer16050077
Submission received: 19 March 2021 / Revised: 11 April 2021 / Accepted: 15 April 2021 / Published: 19 April 2021

Abstract

:
In the digital age, retailers face umpteen challenges, finding it increasingly difficult to fulfil the customer requirements. Studying the most trusted online stores in Romania, the authors aimed to identify the opportunities and the challenges for retailers in the connected consumer’ journey, analyzing the page load speed of the in-between touchpoints in the pre-check-out phase on smartphones. In this regard, comparative analysis and content analysis were performed, taking into consideration eight performance indicators, namely, first content paint, first input delay, largest contentful paint, cumulative layout shift, performance score, speed index, time to interactive, and total blocking time. Three platforms were used to run the tests, the generated data allowing the identification of the necessary enhancements to ensure a continuous consumer journey. The study revealed that the selected in-between touchpoints need major improvements to provide a satisfying consumer experience on a smartphone. The scientific contribution of this article consists of presenting 14 opportunities designed for retailers. By implementing them, for every 0.1 s saved, the conversion rate can increase by 8% due to emotional mitigation with technological performance improvements. The page speed shapes the customer journey, the retailers gaining the users’ trust by avoiding a long waiting time between the touchpoints.

1. Introduction

The digital age’s connected consumer easily switches the real world with the virtual world, accessing mixed touchpoints in the interaction with retailers, consumer journeys becoming progressively compounded and generating the distortion of traditional marketing funnels. The increased number of channels and touchpoints is putting pressure on retailers [1,2,3] and the ‘word of retailing’ is in a continuous change due to customer-interfacing retail technologies [4].
The junction point between Information and Communications Technology and the Internet on mobile devices accelerates the evolution and provides consumers with the occasion to access the desired products and services, becoming more and more difficult to reach and fill with satisfaction the potential customer. This bouncing type of consumer is currently the heart of the digital world. Citing the fact that the public is conquered by digital informers and digital shoppers [5], their decisions shape the marketing funnels, the consumer journeys, and the complex buying behaviors, these representing real challenges for retailers. At the same time, the increasing availability of smartphones and high-speed Internet drove their growingly use to make purchases [6,7,8]. The new generation of electronic commerce, mobile commerce [9], has become a mega-trend, with regular growth in the number of consumers [10,11,12,13].
To survive in a highly competitive market, retailers are concerned with creating a strong customer journey experience and understanding the role of customer experiences at each stage of this journey [14,15,16,17]. The customer journey received less attention from specialists until a few years ago [18] and includes several stages, like creating desire, searching for information, evaluation of alternatives, obtaining satisfaction, and sharing experience [19] at all touchpoints from firms and customers [18].
Starting from Lemon’s cite of creating and delivering a positive experience [15], the authors of this paper tried to analyze the experience of the connected consumer on smartphones during the purchase journey. To achieve this goal, the model of total consumer experience, developed by Chatzopoulos [20], was taken into consideration. It includes two key concepts, namely, touchpoints and in-between touchpoints. Touchpoints are verbal or non-verbal incidents an individual perceives and consciously relates to a given firm or brand [1] but also, they are considered well-defined time points when consumers interact with a company or an asset of it [20,21]. On the other hand, the in-between touchpoint is defined as the period between two touchpoints [20].
The model involves the introduction of the in-between touchpoints as the period between two touchpoints that includes the non-touchpoints in the process of total consumer experience. This theory was chosen to be developed because it says that the occurrence of issues from one touchpoint to another can change and influence consumer opinion and satisfaction. The consumer experience can be challenging if the retailers’ assets do not respond or adapt to consumer requirements. Based on this concept, this paper aims to analyze the page load speed on smartphones of the in-between touchpoints in the pre-checkout phase, considering all the performance indicators for loading, interactivity, and visual stability [22]. So, with this research, it is desired to add value to the proposed model [20] and to identify the challenges and the opportunities to develop mobile commerce in Romania. The contribution of the paper in the literature is to extend the theory of total consumer experience with its periods, by introducing the page load speed on smartphones as a non-touchpoint, deliberating it as an asset of the retailer. To understand how the connected consumer reacts to the technological performance of the online store pages, two types of analysis were performed. The first one is an indirect method, a content analysis, based on secondary data, followed by a comparative analysis used to rank the online stores. The study highlighted the cases of the most experienced and certified retailers in Romania, according to Trusted.ro, who sell services and products on the Internet. Derived from the study’s objectives, the online stores’ technological performance was tested to identify how they operate.
The results qualified the analyzed cases and favored the creation of a list of challenges and opportunities. The results show a lack of performance, demonstrating that the retailers do not meet the needs of users in the pre-checkout phase. The slow page load speed on smartphones ruins the consumer’s journey because it is not in their attention, registering a low rating value to online stores, which requires major improvements in both 3G and 4G networks.
To achieve the intended purpose, the paper is structured into six sections. After the introduction and the review of the scientific literature, the research methodology was introduced, followed by the presentation of the results of the study, the final part being allocated to the discussions and conclusions.

2. Literature Review

The present incorporates Experience Economy as the central aspect of the management philosophy to encourage competitiveness on the market [23]. Retailers are concerned with providing the most memorable experience to consumers [24]. They need to approach the total consumer shopping experience to achieve the goal of gaining their trust through an evolutionary relationship, provoking sensory, emotional, and rational reactions. An authentic experience is influenced by touchpoints (points of interaction between the consumer and the retailer), context (available resources), and qualities (consumer responses and reactions to the interaction with the retailer) [25]. It certainly depends on the time spent completing a purchase on an app, a long time leading to a negative consumer perceived experience [26]. Therefore, the shopping journey is marked by four periods: initiation, touchpoints, in-between touchpoints, and finalization. The riskiest of them is represented by the in-between touchpoints period because, in its course, the interaction between them is missing, the consumer’s behavior being difficult to directly influence. At this stage, the resources provided play a particularly important role in how they can be adapted and meet the demanding requirements of consumers [20]. In this context, more and more retailers are moving towards mobile commerce, the commercial activity that is performed on a mobile phone or a tablet [27], even if some SMEs may consider this step risky [28], due to concerns about optimizing the conversion rate [29] and consumer retention to achieve increased sales and reduced costs [30]. On the other hand, from the consumers’ perspective, the transition from e-commerce to m-commerce is favored by technical progress, respectively by the increasingly advanced and accessible technology but also by the value perceived by them [31]. Although promising, e-commerce is only a small part of the global e-commerce market today [32]. It depends on the development of technologies [33] and consumer trust in such transactions [34].
The literature draws attention to consumer behavior and decisions that can be influenced by a myriad of factors such as perceived ease of use, perceived usefulness, value-added and service functionality [35,36], behavioral intention, as a result for ‘perceived usefulness, perceived enjoyment, and privacy and security’ [37], the screen size of smartphones [26], but also impulsivity and positive impact on improving the satisfying experience [30]. For example, a study that, in trying to understand the factors that influence m-commerce adoption in India, took into account variables such as perceived transaction risk, cost, compatibility of use, ease of use, perceived usefulness, intent to use, and actual use, reached to the conclusion that all factors less cost have a positive influence on the intention to use m-commerce [8]. However, specialized studies note the need to evaluate m-commerce applications [38]. A study of Chinese consumers showed that website quality significantly influences the utility perceived by the consumer for m-commerce apparel. The characteristics of the website must meet the needs of consumers, to facilitate the search, the perceived usefulness and the ease of use of an m-commerce site, resulting in a positive consumer attitude [39]. A successful m-commerce application must take into account ‘usability, native look and feel, high-resolution graphics, predictable and easy navigation, and trustworthiness that the application reflects’ [40] (p. 3).
Extra seconds needed to load pages on mobile devices can cost retailers a lot, but a performing loading speed can also have a positive impact on performance indicators related to business revenue [41] (p. 15), only for those who are aware of the sensitivity of users to the loading time, especially in the pre-checkout phase. Consumers want their needs to be met as soon as possible, so minimizing the duration of consumers’ journey and the emotional mitigation during it are necessary actions [20]. The conversion rate drops dramatically if the speed between the time the users leave the product page and the time the product is added to the cart is not as expected [42]. One second delay can affect mobile conversions by up to 20% [43] and people who have a negative mobile experience are 62% less likely to make a purchase in the future, no matter how attractive or data-driven their marketing campaigns are [44]. Retailers have begun to embrace the perspective that the purchasing decision-making process can be isolatedly approached from the pre-acquisition phase’s viewpoint. Considering the extended impact of technological performance on the consumer’s journey, they initiate the technological capabilities adjustment to the needs of the connected consumer, who buys with a smartphone [45].

3. Materials and Methods

Starting from the concepts presented in the introduction, the authors perpetuate the m-commerce growth by improving the consumer experience from the perspective of the page load speed of the in-between touchpoints on smartphones. In this way, the theory of total consumer experience [20] is extended and the page load speed is introduced as a factor that influences the customer journey. According to Tueanrat [46], technological disruption is a theme related to it, divided into two sub-themes, namely, innovative touchpoints and technology adoption The authors used these concepts and they analyzed the perceived utility and the perceived ease of use [47], with qualitative marketing research, based on both secondary and primary data. A secondary dataset was used to select retailers and two primary data sets were used for two different types of analysis. To ‘provide a collective insight’ and to ‘generate reliable findings due to the structured and consistent procedures’ [48,49], a content analysis was performed based on real field data. In this way, crucial moments during the customer journey and potential opportunities were identified. The second analysis was performed using laboratory data, to try to compare the selected online stores, using the hierarchy by the method of diameters [50].

3.1. Research Objectives and Hypotheses

The research aims to extract information about the technological performance of the online stores’ pages on smartphones of the most trusted retailers in Romania. To achieve this purpose, the authors set the following objectives: (1) the analysis of certified online stores in Romania from the perspective of the site load speed on smartphones, (2) testing the touchpoints’ pages load speed to measure the loading time of the in-between touchpoints, (3) taking the Core Web Vitals assessment to test technological performance, (4) comparing the performance of selected online stores by the diameter method, (5) naming the recurring challenges identified among the retailers studied, and (6) promoting opportunities to mitigate the challenges identified at point (5).
The hypotheses were formulated in synchrony with the research objectives, these being described by the following statements:
  • The online stores with a poor rating for site speed loading on mobile do not show any change regarding the speed performance in the last month.
  • In most cases, the loading speed of the in-between touchpoints’ pages increases as the user approaches the checkout.
  • Most online stores successfully pass the Vitalis Web assessment.
  • The research will highlight a sufficient number of opportunities that retailers can take advantage of to develop m-commerce and improve the consumer experience in terms of loading speed.

3.2. Methodology

In the first stage, the information published by the National Program for the Certification of Online Stores in Romania [51] was taken into consideration. At the date of the study, according to the platform, 207 electronic stores categorized according to 16 fields of activity were registered with the Trusted.ro trademark. In the second stage, the authors considered the date on which the activity was started to select one online store from each category that had the longest experience on the Romanian market. After listing the 16 entities to be introduced in the study, the presence of the shopping cart on the site was analyzed, through which was the possibility of direct purchase of products or services. In situations where the oldest retailer did not present the possibility to add the desired product to the cart, the choice of the next one from the same category that met this condition was taken. Finally, a list of 16 online stores was obtained who presented a certification on consumer trust, with significant experience of selling products or services via the Internet on the Romanian market and who integrated a shopping cart as a tool for purchasing on the site.
A content analysis was elaborated, based on real field data, whose structure was created based on the parameters related to the two platforms used to generate the primary data detailed below. Subsequently, a comparative analysis of the efficiency of the sites was performed using the diameter method. It was based on laboratory data, used in the ranking of the 16 selected retailers.

3.2.1. Page Speed Insights (PSI)

PSI reports a page’s performance on both mobile and desktop devices, giving more suggestions on how the page can be improved. The test generates two types of page data, real-world field data and lab data. Both types of data were used to conduct complete research without the limit of real-world field data that includes a small number of metrics.

Real-World Field Data

The role of using this type of data in research is to generate the values for the performance score of mobile pages, but also the ones for First Content Paint (FCP), First Input Delay (FID), Largest Contentful Paint (LCP), and Cumulative Layout Shift (CLS), in field conditions, generated with real-world data that reflect the user experience.
Performance score. The value that shows the performance of the site is displayed at the beginning of the report. It has values between 0 and 100, any value above 90 is considered a good score, 50–90 is a score that needs improvement, and below 50 is considered a poor score.
FCP is the user-centered value, included in the research for the analysis of perceived loading speed, with a particularly important role in analyzing the consumer experience because this variable measures the time from the beginning of page loading to the moment when a part of the page content is displayed on the screen, marking the first point in the page load history. A fast FCP shows that the users understand that something is going to happen, assuring them of the page’s functionality.
FID is a user-centered value, included in the research because of its ability to measure responsiveness, as it quantifies the experience users have when trying to interact with unresponsive pages.
So, this variable complements the site’s ability to ‘paint’ the pixels with the importance of how responsive the site is when users interact with those pixels. FID contributes to measuring the first impression about the interactivity and responsiveness of the site. The FID value of fewer than 100 milliseconds helps ensure the users that the page is useful.
LCP, a user-centric value, has a special role in research because it complements the FCP by measuring the perceived loading speed when the main content of the page has been loaded. Displaying LCP content in the first 2.5 s of loading ensures a good user experience, its speed assuring the user that the page is useful.
The CLS variable was introduced in the content analysis because it measures the visual stability and provides the verdict of the analyzed page in terms of the frequency of unexpected changes in appearance. A CLS less than 0.1 assures the user that the page is delightful and visually stable.
The platform integrates these variables in the Web Core Vitals assessment, the Google initiative that aims to generate and analyze opportunities for key quality signals for an excellent user experience. Site owners are advised to measure vital elements. Data are distributed by the product in three categories describing the experiences considered good, the ones that need to be improved or poor, depending on the thresholds based on the analysis of the Chrome User Experience (CrUX) dataset, which provides user experience values for how the real world is experiencing popular destinations on the web. Values are marked with green, orange, and red bars and represent an aggregate view of all page loads in the previous collection period of 28 days. Above the distribution bars, PSI reports the 75th percentile for all values, so that developers can identify unpleasant user experiences.
For these reasons, the evaluation was considered useful by the authors, the PSI test generating values for each variable mentioned and explained above by copying and pasting the online store’s link of each retailer in the platform to identify the main challenges and opportunities that they face.

Lab Data

To complete the list of metrics presented in the case of real-world field data, the laboratory data set of the PSI test was used. Their role in the research is represented by their establishment as a basis in the comparative analysis performed by the diameter method. In addition to the different approaches to FCP, LCP, and CLS, laboratory data also includes Speed Index (SI), Time to Interactive (TTI), and Total Blocking Time (TBT).
SI is one of the six components of the performance section of the Lighthouse report. This indicator measures how quickly the content is visually displayed while the page is loading. The speed index is generated using Lighthouse which uses the Speedline Node.js module, calculating the visual progression between frames using the structural similarity index. The performance of a site is rendered by the loading time in the three intervals 0–4.3 s (SI score between 75–100) representing a fast rating (green), 4.4–5.8 s (SI score between 50–74) moderate rating (orange), and over 5.8 s (SI score between 0–49) slow rating (red).
TTI, like SI, is a metric included in the Performance section of the Lighthouse report, its measurement being imperative because some sites choose to optimize visibility at the expense of interactivity. In other words, the loaded page may seem ready to use because the content is visible, but when the user wants to interact with it, nothing happens. TTI thus measures the time it takes for a page to be fully loaded. The interpretation of this score is performed according to the specified intervals. Between 0–3.8 s, the site loads quickly (green), between 3.9–7.3 s, the site receives a moderate rating (orange), and over 7.3, the site loads slowly (red).
TBT joins the other metrics in the Performance section and according to web.dev is a lab metric, measuring the responsiveness of the task, as it helps quantify the severity of how a page is noninteractive before it becomes reliably interactive. In other words, TBT measures the time between FCP and TTI. A low TTB helps ensure the use of the page. The intervals in which the metric falls are represented by the values 0–300 milliseconds (fast, green), 300–600 milliseconds (moderate, orange), and over 600 milliseconds (slow, red).
Metrics were used in the comparative analysis to rank online stores using the diameter method. For the hierarchy of variants, the method takes into account the degree of homogeneity of the variant concerning all criteria. To avoid the compensations, two functions are defined based on which the hierarchy of variants will be made: an appreciation function and a diameter function. Thus, a variant is all the more homogeneous, the smaller its diameter and the better the appreciation.
The algorithm of the method is as follows:
Step 1.
Define the appreciation function: A : V R
A ( V i ) = j = 1 n ( m l o c ( V i , C j ) ) p j , i = 1 , 2 , , m   ,
where P = ( p 1 , p 2 , , p n ) represents the vector of weights (subjective, objective, or aggregate), and l o c ( V i , C j ) = k , that is, the value of the variant V i   for criterion j it occupies the place k in the hierarchy of the m values associated with criterion j.
Step 2.
Define the diameter function: D : V N
D ( V i ) = m a x j   ( l o c   ( V i , C j ) ) m i n j   ( l o c   ( V i , C j ) ) ,   i = 1 , 2 , , m , j = 1 , 2 , , n
Step 3.
Calculate the aggregate function: A   &   D : V R
A   &   D ( V i ) = A ( V i ) + ( m D ( V i ) ) 2 , i = 1 , 2 , , m
Step 4.
The hierarchy of variants is given by the decreasing values of the A&D function.

3.2.2. Mobile Site Speed Test (MSST)

Under the auspices of the Think with Google program, the MSST platform [52] was used in the study to generate information about the loading speed of touchpoints pages in the 3G and 4G networks.
Based on the CrUX dataset and using Lighthouse technology, the platform uses real-world user-generated data to evaluate the speed of mobile pages and generate personalized recommendations to enhance the user experience on mobile devices. The purpose of integrating the MSST platform into the research is to use its capacity in determining retailers to initiate collaboration with the technical team to implement the optimization plan. Using the links of the online stores, a report was generated for the 3G and 4G networks on the pages corresponding to each touchpoint to analyze the loading time evaluated by the expected seconds until the content display, the rating, and the monthly trend.
The loading speed generated in the report places the site in one of three categories of rating good (0–2.5 s), needs improvement (2.5–4 s), and poor (over 4 s), defined by LCP and the site pages in the same categories, but framed in different time intervals, being defined by FCP, good (0–1 s), needs improvement (1–2.5 s), and poor (over 2.5 s).
The monthly trend is calculated taking into account whether in the current month the LCP is faster, slower, or unchanged. Since the data source is the same (CrUX) being updated monthly, the variable is constantly updated.
All data generated by the reports were entered in the content analysis, focused on the pre-checkout process, analyzing the home pages, the pages of the first product displayed on the site, and the shopping cart page. Two variables were introduced to highlight the results after evaluating the loading speed. One of them is represented by the distance from the time of purchase, coded from 3 for the farthest touchpoint to 1, for the nearest and the other is the impact rate on the purchase, set as 10% for the home page, 30% for the product page, and 60% for the shopping cart page.
The content analysis was performed by interpreting the results horizontally and vertically, to obtain the set of information necessary for the discussion and conclusions sections of this paper.

4. Results

Following through the research, the results induced notable opportunities for m-commerce growth in Romania. The analysis assessed data about the page load speed, the rating for each touchpoint, the perceived loading speed, as well as visual stability. The data interpretation engendered continuing controversy about the satisfying experience for connected consumers, carefully presented in the Discussion section.

4.1. Content Analysis with Real-World Field Data

4.1.1. Mobile Site Speed Test (MSST)

Running the MSST, a set of data was centralized in the content analysis in a classified way and according to the predominant networks in Romania, the 3G and 4G.
Loading speed. Testing the touchpoints’ load speed, the MSST was running to account for how long a user has to wait for the content to load. Depending on the number of seconds recorded, is acknowledged the usefulness of the page and perceived the straightforward modus operandi.
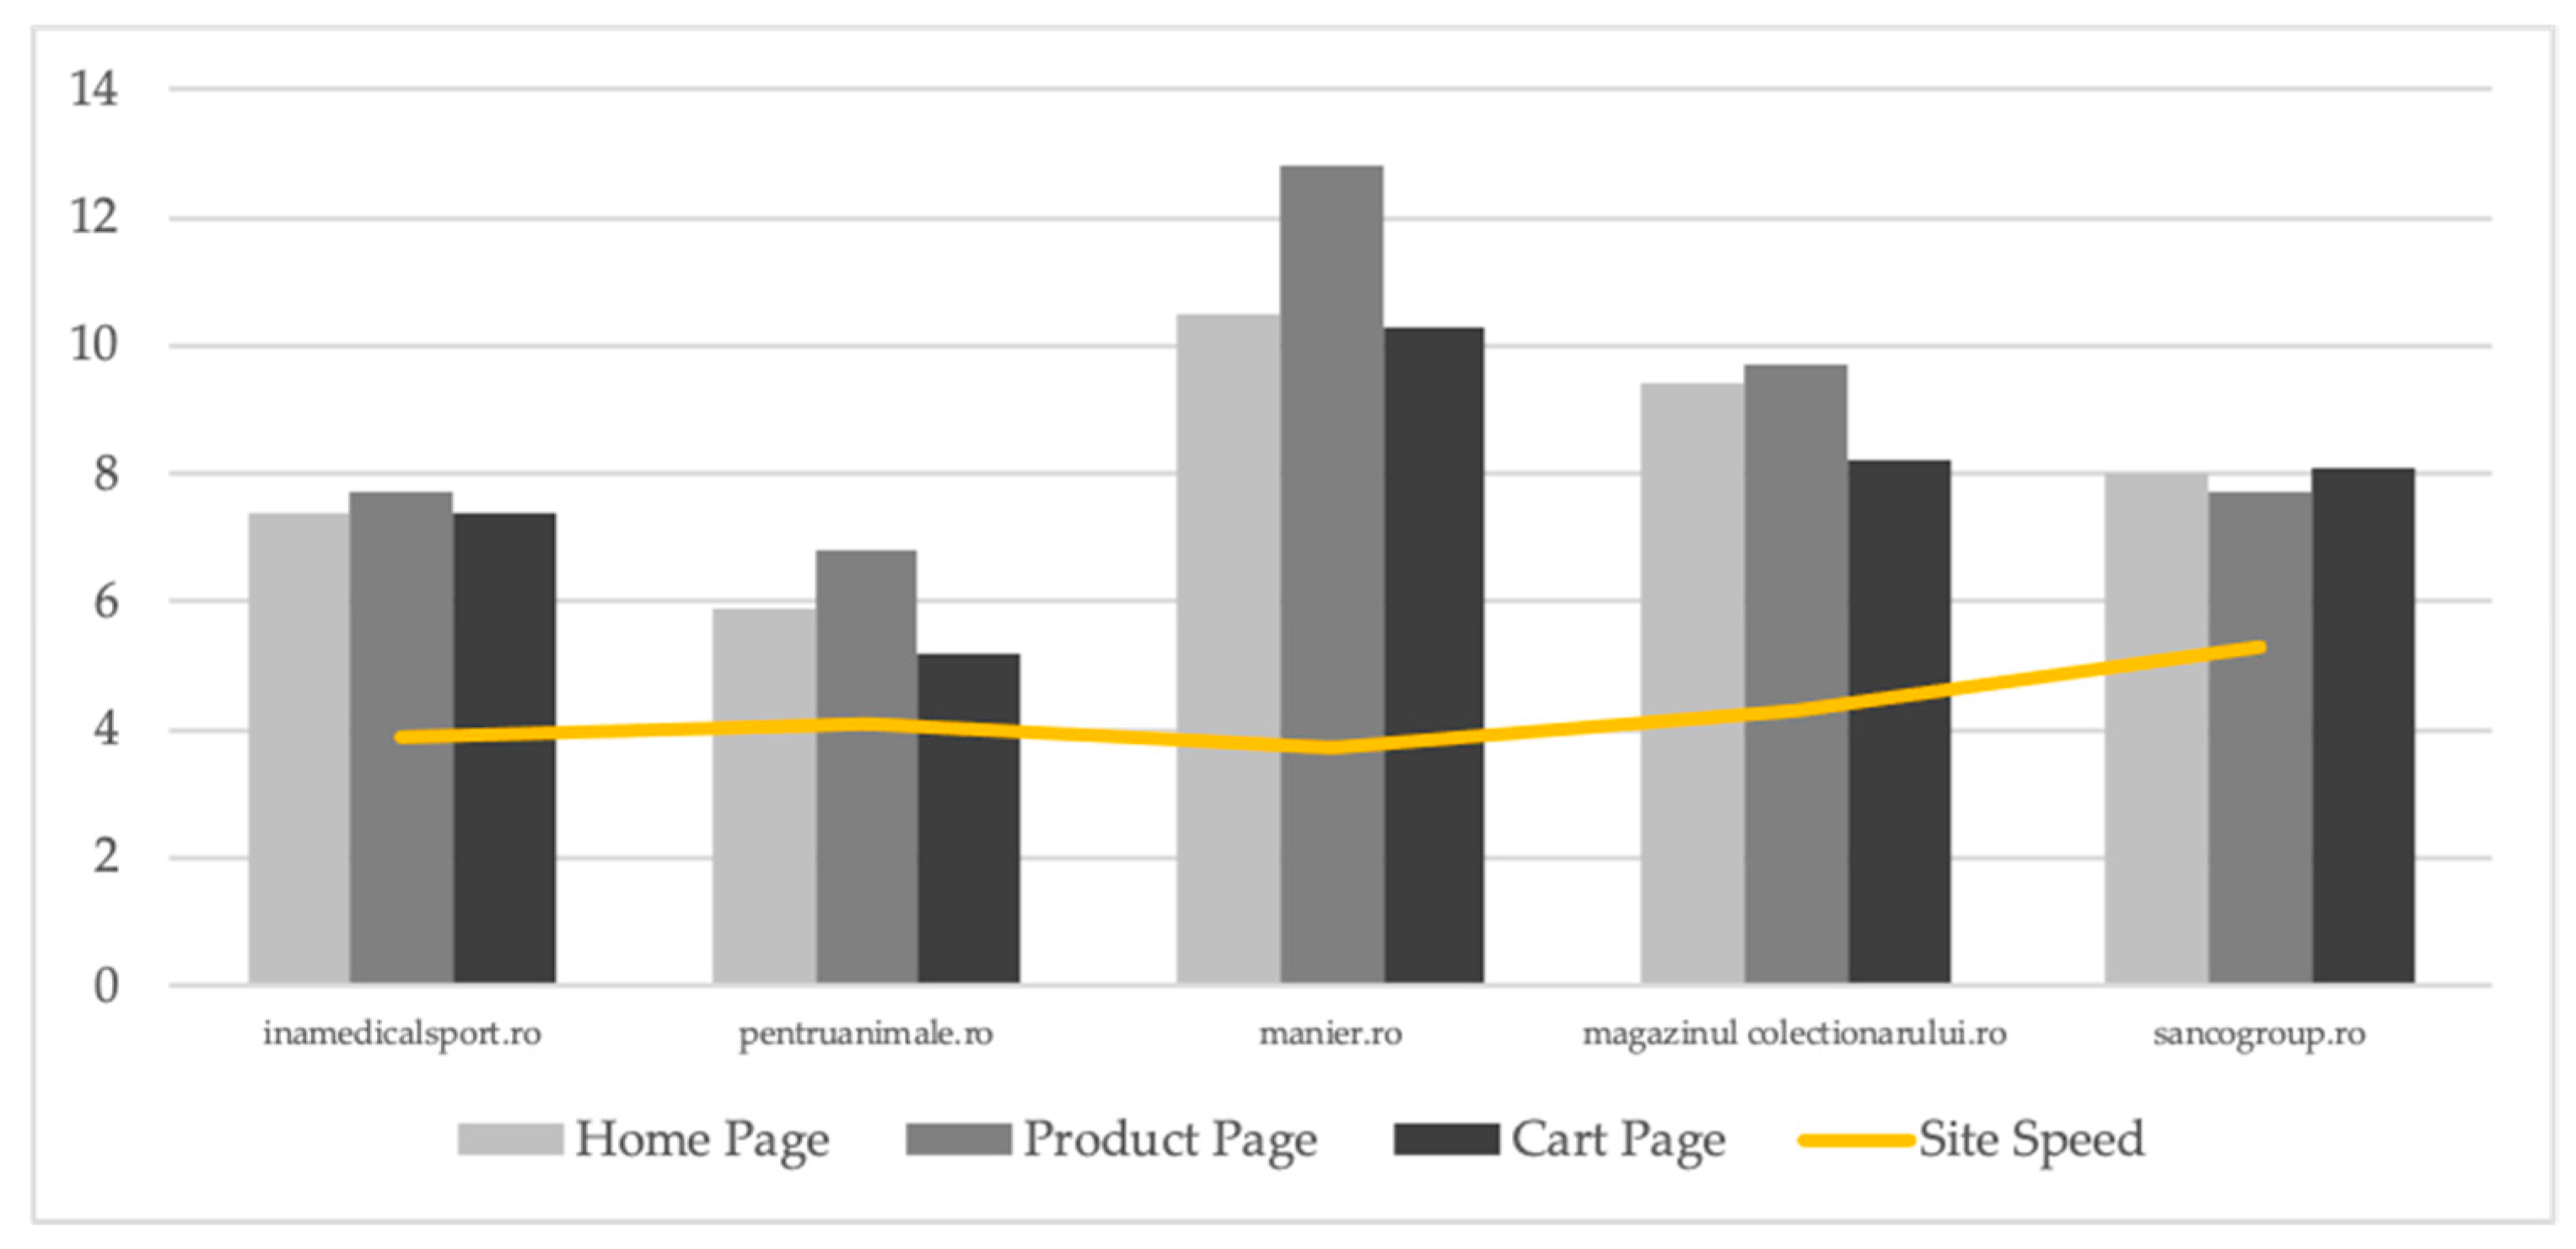
In the 3G network, the uppermost situations are represented by the online stores that show a fluctuating loading speed from one touchpoint to another. Specifically, the waiting time becomes longer as the users leave the home page and land on the product page and it shortens as they are moving forward from the product page to the shopping cart. Even if the loading time lessens as the users draw near the checkout, the load speed of the shopping cart page is slower than the average load site speed in all situations (Figure 1). The slightest difference between the value of the average site load speed and the value of the shopping cart load speed is showcased by the pentruanimale.ro, where the average site load speed is 4.1 s, the shopping cart recording 5.2 s.
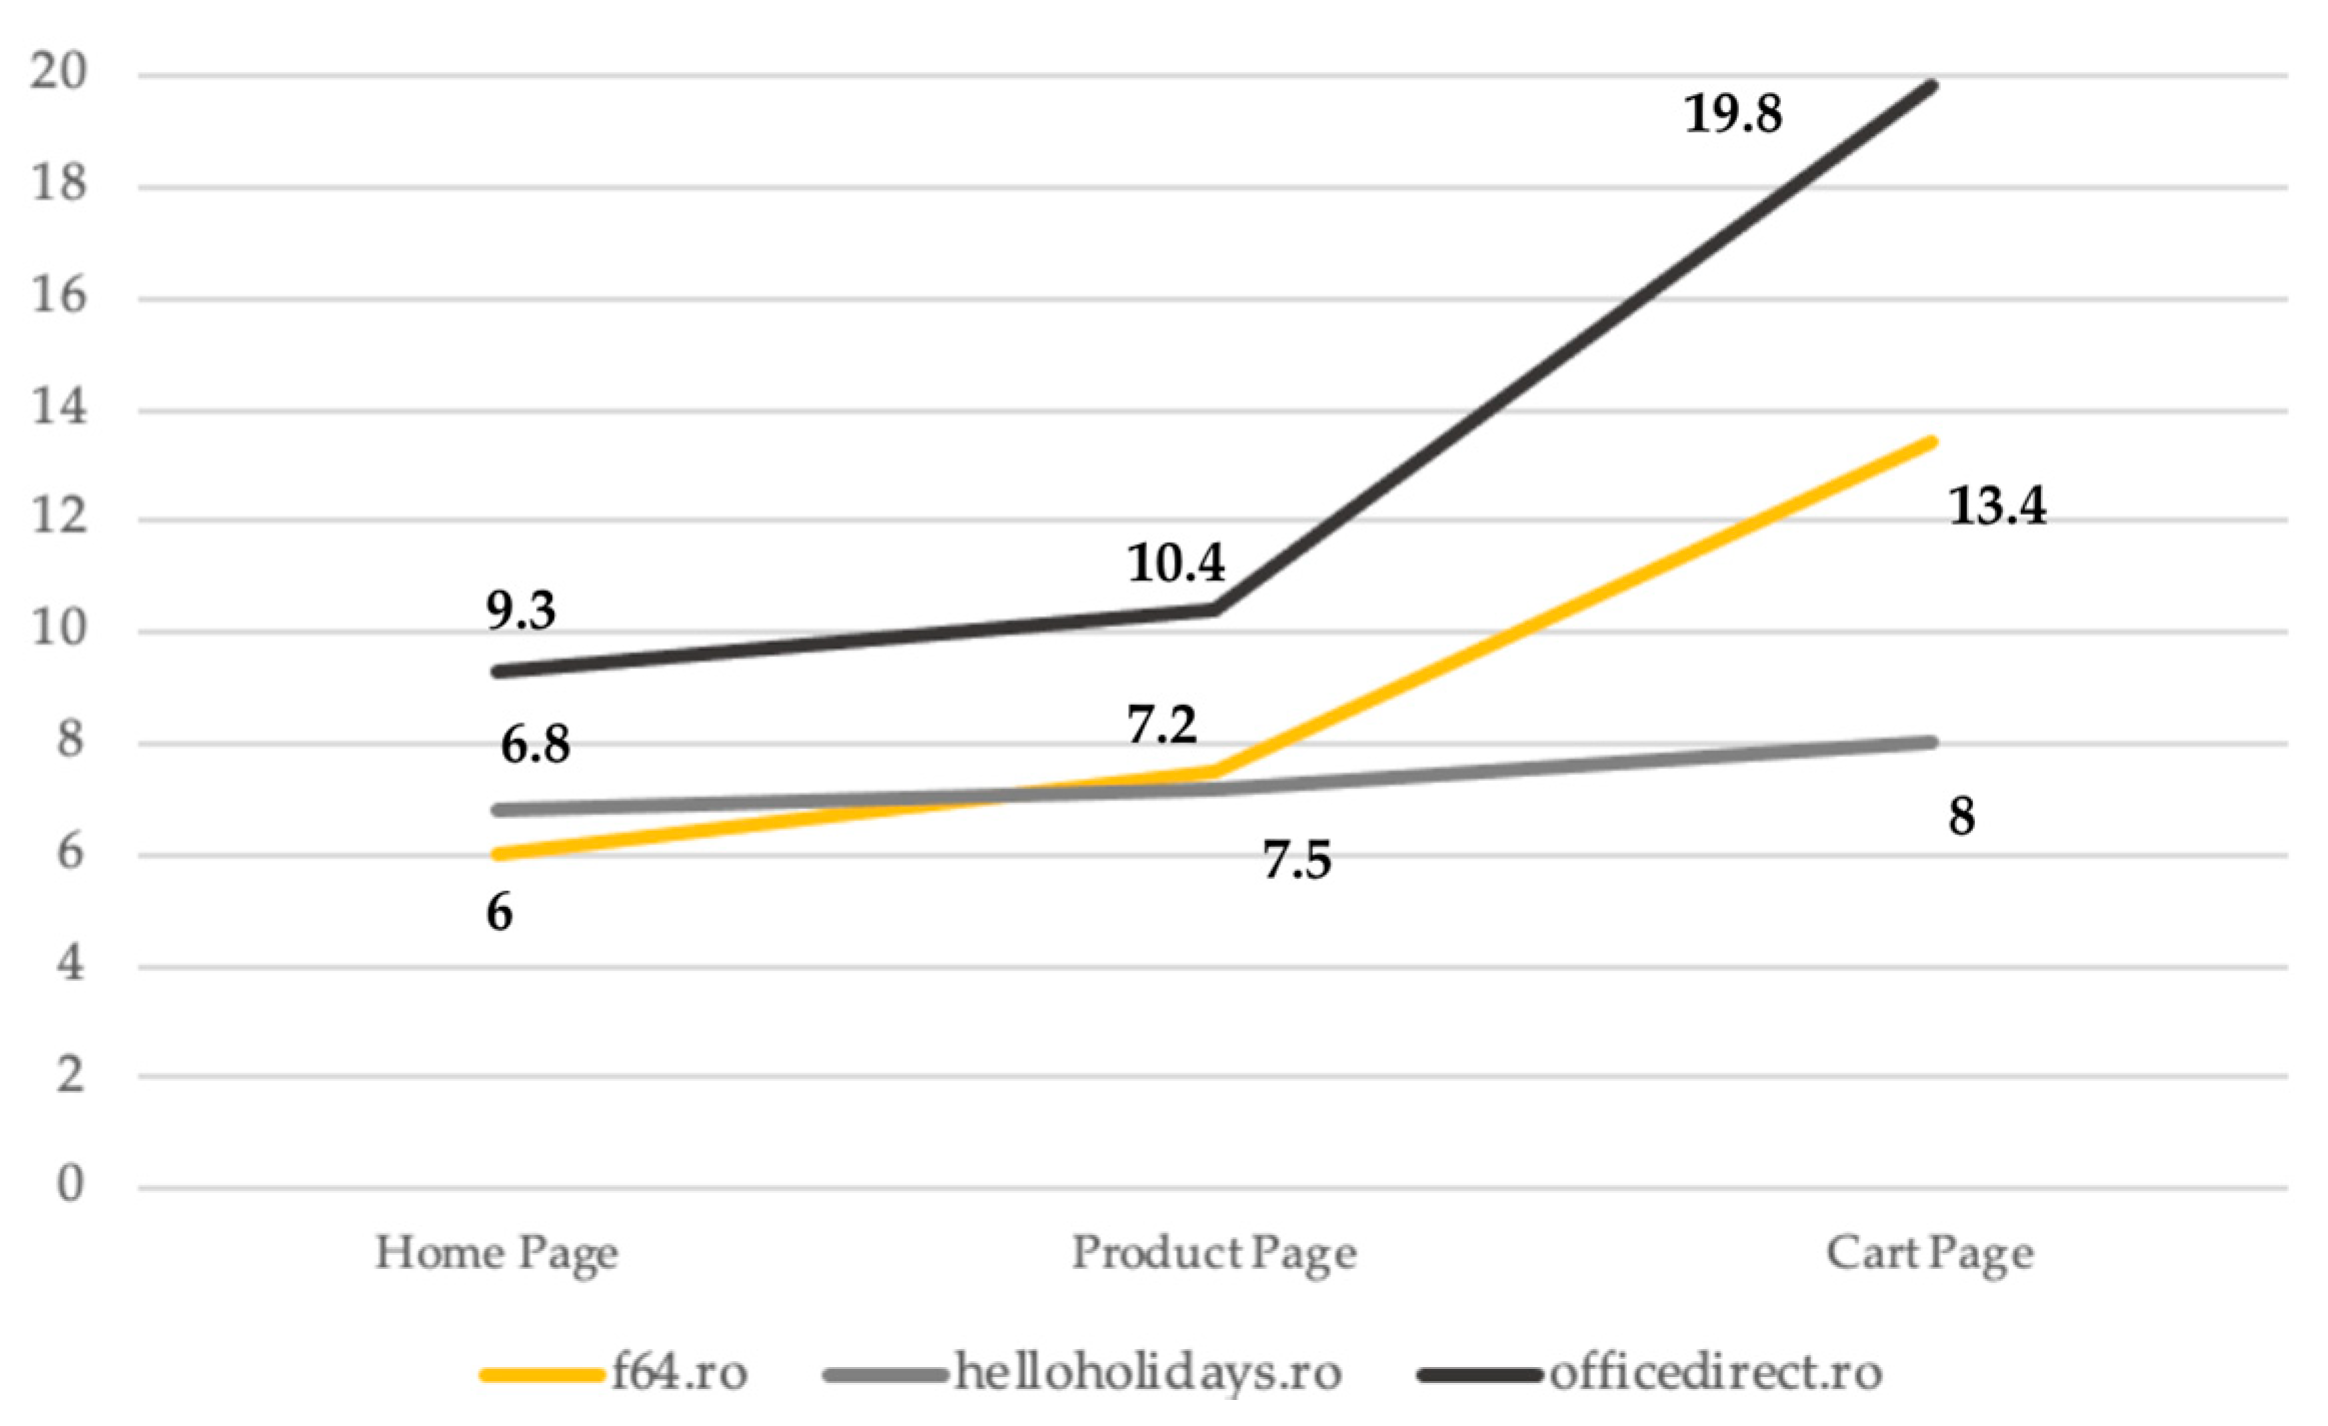
Three out of 16 retailers expose the increment of the number of seconds as the consumer draws near the checkout and the shopping cart page is the one that loads the slowest. Two of them, f64.ro and officedirect.ro, presents substantial increases (Figure 2).
Regarding the stability of the loading speed during the customer journey, only three retailers masterly managed to maintain a similar page load speed when users added the products to the cart. In this manner, the marosbike.ro, buy4baby.ro and heliumking.ro do not negatively influence the user experience, providing a constant virtual search medium during the purchase journey. This veracity does not evoke a special perception of users about the performance of the sites, but unforcedly it does not provoke a misperception about a certain deficiency of ease of use or other barriers in the journey. Thus, their experience is not affected and if there is already a purchase decision, the conversion rate does not decrease and the users will fluidly journey to the checkout. The same cannot be conveyed, however, for three retailers that show the increased loading speeds’ values as the distance between the touchpoints shortens and the impact rate becomes increasingly significant. The users that experience blockades during the loading process change their perception of ease of use, especially when they access the shopping cart touchpoint and it loads slow. In case they wanted to make a purchase, this does not happen anymore, the conversion rate is reduced by 20% for each delayed second. Only two exposed a decreasing loading speed during the journey, but none of them presented an optimal value for the 3G network (less than 2.5 s).
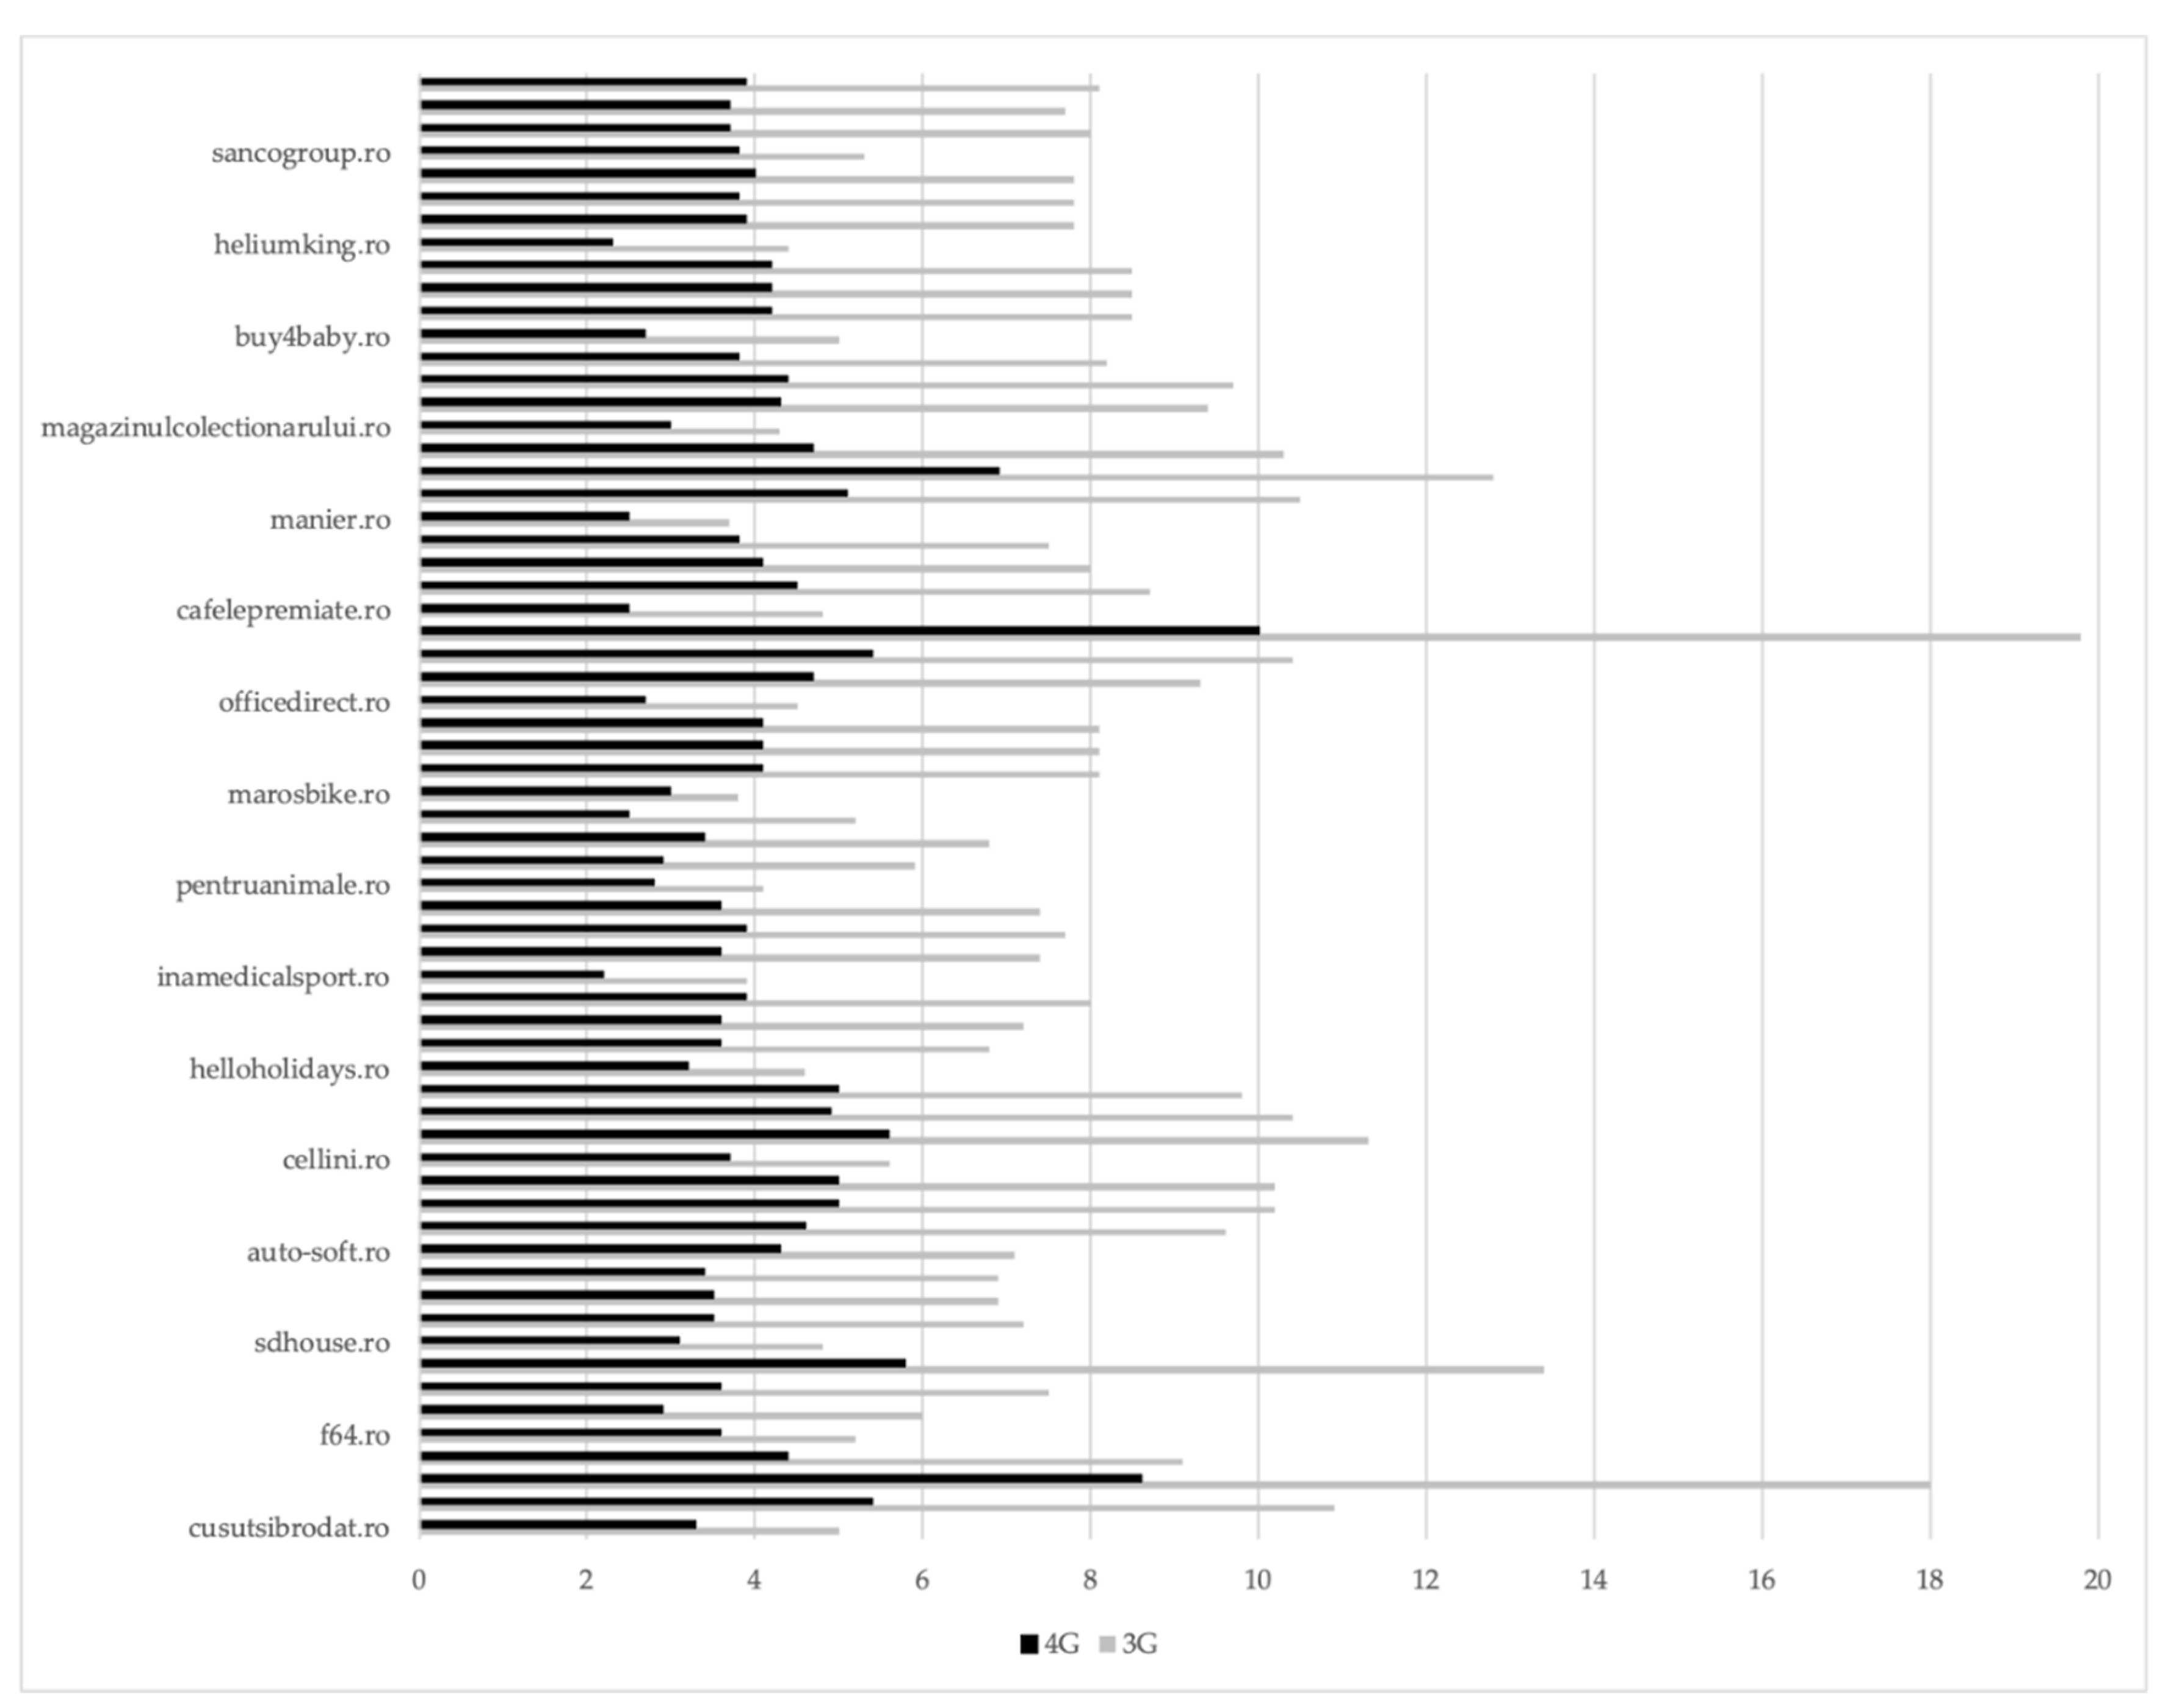
Improvements were observed in the 4G network (Appendix A). The variance for each retailer is displayed in Figure 3 and the most enlightening is for the officedirect.ro that indicates a decreased cart’s loading speed by 9 s. Even so, having a loading time of 10 s for the cart page in this network, the retailer encounters problems in terms of user experience. Being four times slower than the recommended speed, most likely the potential buyer will give up the desired purchase if it lands on the shopping cart page and he has to wait so long to load and display the content on the screen. In the same situation is cusutsibrodat.ro, which decreased the loading speed of the product page by 9.4 s, the user reaching the content in 8.6 s. In this case, the user may not even reach the shopping cart page, because his experience is affected by the interaction with the information about the product, being determined to give up his buying journey. If, for other reasons, it continues to search, the retailer’s site is at risk of being perceived as less useful and difficult to use.
Additionally, the 4G network presents a page load speed that increases as the consumer approaches the checkout. Compared to the 3G network, the situation is changed in the case of helloholidays.ro, which in the 4G network, maintains the speed for the home page and the product page at 3.6 s, increasing the speed of the shopping cart to 3.9 s. On the other hand, officedirect.ro shows a very big difference when switching from the product page (5.4 s) to the shopping cart (10 s), even if this time the values are lower. The generated effect on users is negative. Within this network some retailers have a changing loading speed, oscillating between increases and decreases in loading time. Seven of them present a changing speed generated by the increment of the number of seconds when switching from the home page to the product page, followed by a decrease of the shopping cart page’s load speed.
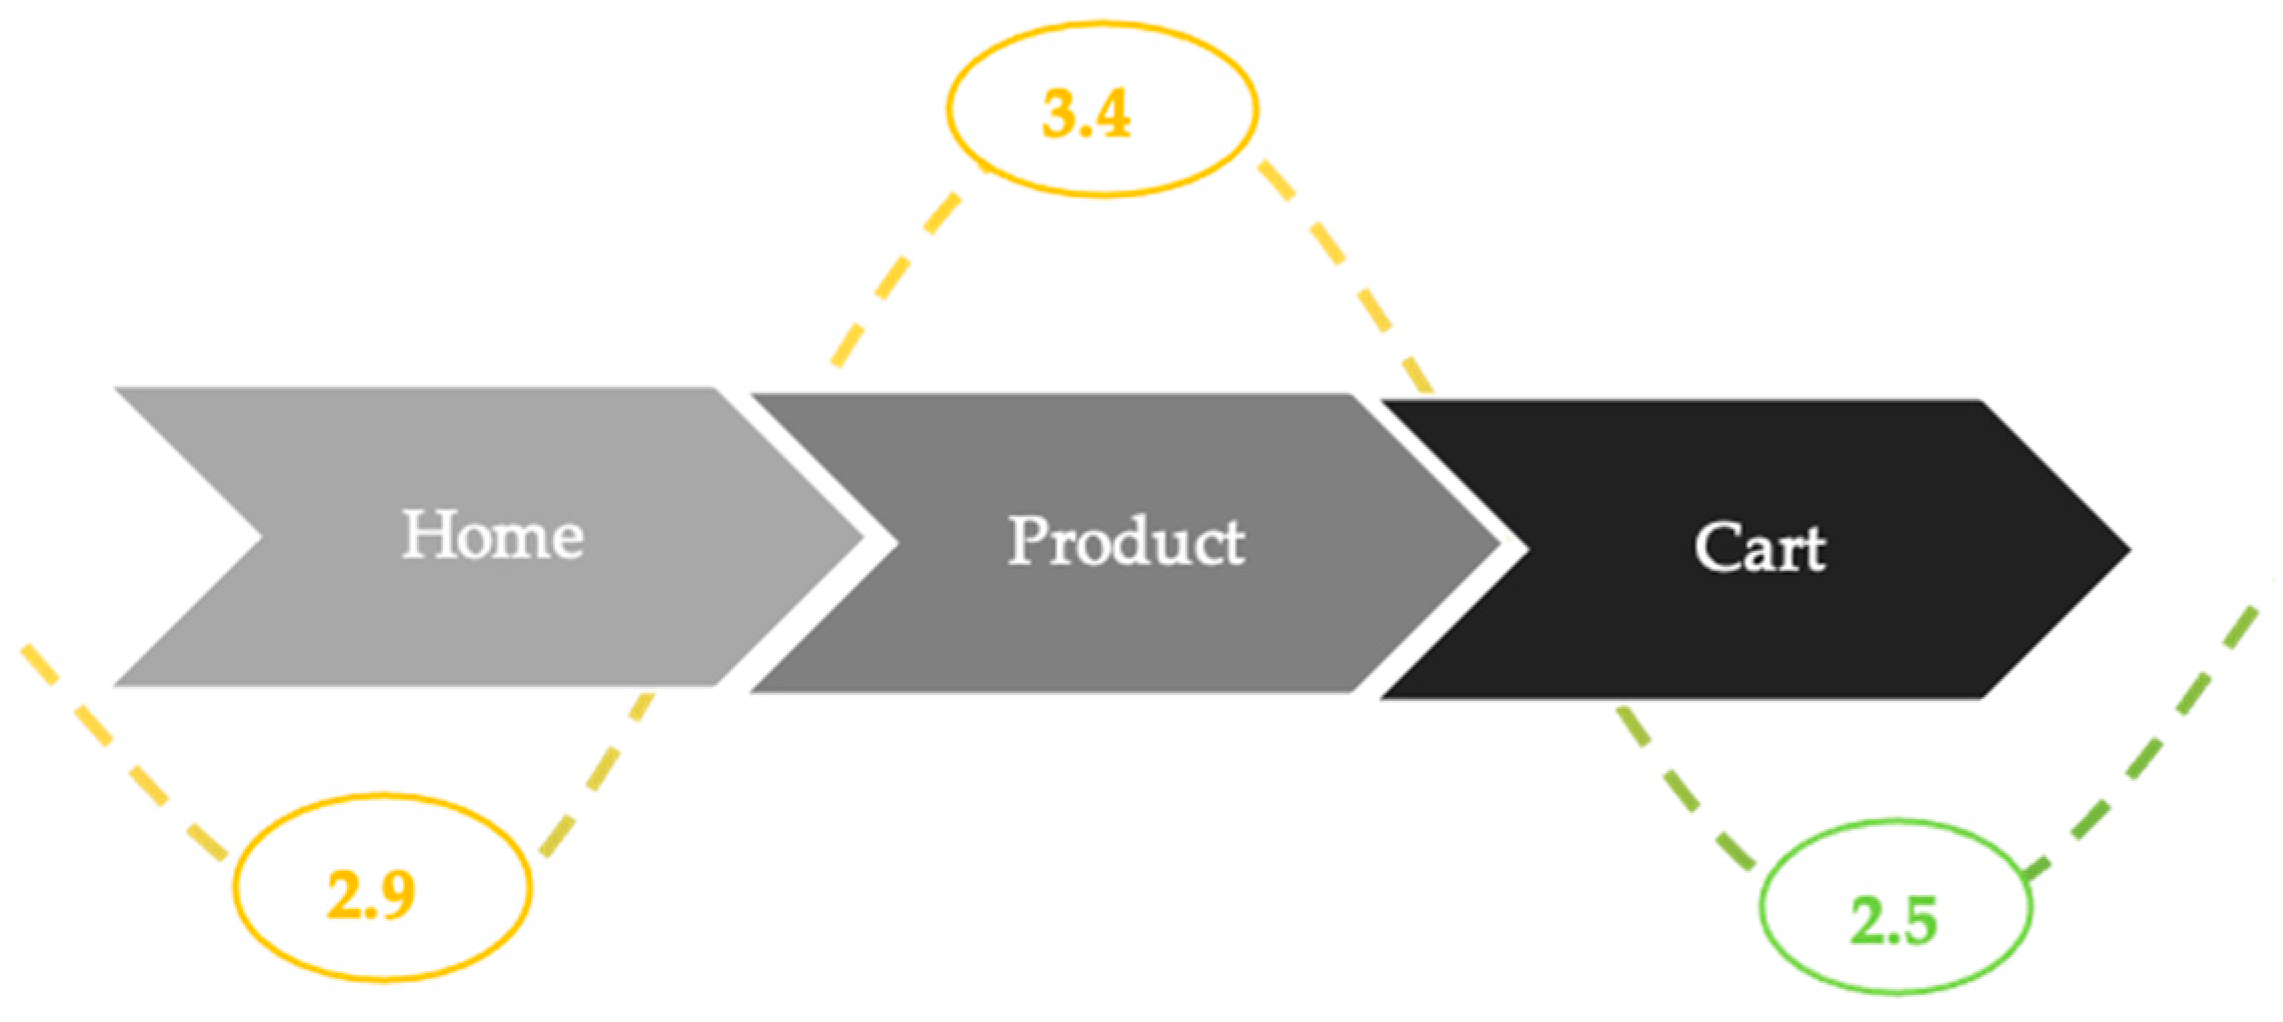
This is maintained only in the case of two, marosbike.ro and buy4baby.ro. The ideal case in which it decreases as the user approaches the checkout is for a single online store (cafelepremiate.ro. However, every touchpoint of this retailer presents a page speed that needs improvements because of its high values. Therefore, a good example can be described in the situation illustrated in Figure 4. There, the process of the user who accesses the www.pentruanimale.ro’s website [53] and reaches the shopping cart page is presented. The shopping cart touchpoint has a good rating compared to previous touchpoints, presenting the recommended loading speed during the customer journey.
All other retailers have a product page and shopping cart load speed over 2.5 s, generating a poor rating that needs improvement to meet users’ expectations. Therefore, the authors considered it necessary to mention the rating that predominates in both 3G and 4G networks.
Rating. In the 3G network, there are three situations with results that show a strong need to implement improvements. These are represented by the average speeds of the sites and not by any analyzed touchpoint. This allows highlighting the fact that no studied touchpoint can meet the requirement of users to load fast and generate satisfaction in user perception. The fact that 100% of retailers have a low rating in the 3G network, creates the opportunity to improve the consumer experience by reducing loading time. Inamedicalsport.ro, marosbike.ro, and manier.ro have a rating that needs improvements regarding the site’s load speed, but when it comes to the performance of the touchpoints’ pages, the performance is non-existent. On the other hand, in the 4G network, inamedicalsport.ro and manier.ro no longer show the need for site improvements, presenting a good rating (2.2 and 2.5 s). Cafelepremiate.ro, with a loading speed of 2.5 s, and heliumking.ro, with 2.3 s, also join with a good rating, so exist four retailers that have an optimal site load speed. Only one has a slow loading speed and it is rated with a poor rating. This is the case of auto-soft.ro retailer, which has a site-level loading speed of 4.3 s. The rating and the long waiting time represented by the number of seconds discovered in the analysis, led the authors to identify solutions to improve the touchpoints pages load speed included in the study.
The monthly trend. The unfavorable situation of the retailers studied from the point of view of the satisfaction of connected consumers is underlined by one that was discovered, registering changes in the last month regarding the performance of the site in terms of speed loading This is f64.ro, which shows a fast loading speed, the performance at the site level is improved by 6 s in the 3G network. Unfortunately, in the 4G network, it no longer records this performance, like the others that do not show any change in both the 3G network and the 4G. This result convinced the authors that they do not continuously increase performance, to seek to improve the user experience and thus optimization of the customer journey.
The evaluation generated reports that all retailers received recommendations in two directions, for marketers and developers. For marketers, the report presents opportunities to improve the loading speed, to deploy customization, and give access to a fast purchase process. A checklist was exported for developers based on how they can make improvements to the studied pages.
Regarding the improvement of page load speed, the report generated opportunities to update images, reducing their size, generating faster loading performance. Loading images offscreen is another opportunity to enhance the loading speed, as well as clean up code which involves removing unused code and minimizing JavaScript and CSS resources. It was also recommended to maintain a monthly routine for testing and measuring the elements that work to improve the condition of the site’s pages in terms of loading speed.
In addition, 40% of users are willing to spend more than they planned if they encounter personalized experiences at a high level. Therefore, the report generated presents four opportunities that retailers have to improve the user experience. Use the Optimize platform to continuously improve a personalized user experience, implement experiments using A/B tests, re-engaging users with push notifications with relevant content, and use Progressive Web Apps (PWA) to facilitate site access, even offline.
According to reports, to ensure fast access to the purchase process, the online stores must allow authentication with a Google account, using the Autofill option for an easier checkout process. How the payment is made can be a challenge for retailers, being often the main barrier in mobile transactions, determined by the massive abandonment in the checkout process. By creating an easy environment for concluding transactions during this touchpoint, users will convert more.
Developers can use the available checklist exported after running the PSI test. It consists of seven key points in increasing mobile loading speed:
  • Optimize the quality of your user experience by focusing on the metrics that matter most according to Core Web vitals
  • Improve the site speed with the custom recommendations from report
  • Check if the site is an installable and exemplary PWA
  • Implement Google Optimize to run server-side experiments against variants.
  • Enable Google Identity Services and Autofill to build a system that allows seamless sign-in
  • Add GPay to your existing payments processing stack to offer simpler, more secure checkout
Connect the web pages to the app pages with deep linking for both Android (App links) and iOS (Universal links).

4.1.2. Page Speed Insights (PSI)

The PSI test ran to identify the characteristics related to the loading speed, especially the one perceived by users, interactivity, visual stability, and perceived utility. All data were centralized in the content analysis and were interpreted according to its structure.
The performance score generated by running the test includes almost the entire set of retailers analyzed in the range 0–49, which means that they have a poor rating of site performance. The only pentruanimale.ro has a performance score related to the need for improvement, with a performance score of 53. This score reflects the performance of the following features.
In the case of all studied retailers, FCP is over the limit of users’ expectations, registering between 1 s (cafelepremiate.ro) and 4.8 s (auto-soft.ro). Given the role for which this parameter was introduced in the analysis, namely that it analyzes the perceived loading speed, measuring the time from the beginning of loading the content until its appearance on the screen, the results show that most studied touchpoints are perceived as less useful. For example, auto-soft.ro records the following timeline when loading content (Figure 5).
Compared to cafelepremiate.ro, which has the performance of displaying content faster, it happens that auto-soft.ro loses conversions from the first contact with users. On the other hand, sdhouse.ro manages to display the content almost instantly (Figure 6), at the first touch. The chronology of the content loaded is shown in the following figure.
LCP. By completing the FCP and measuring the perceived loading speed when the main content of the page has been loaded, the analyzed indicator guides the authors to identify the necessary improvements so that users perceive from the first interactions the usefulness and ease of use of mobile online store pages. The values under 2.5 s of this indicator places the f64.ro, inamedicalsport.ro, and heliumking.ro in favorable positions from this point of view towards users, while the rest of the retailers face the opposite situation, in which the pages are difficult to access.
FID. Although most of them face the challenge of displaying the content on the accessed page as soon as possible, the first impression that they provide to users is a good one, assuring them of the functionality and usefulness of the page. The experience that users feel at the moment of interaction with the first pixels is the factor that determines them to wait further, until the moment of displaying the content (FCP). This was concluded by the authors, because the FID values obtained are in the optimal range, representing an opportunity in the customer journey.
CLS. Unfortunately, 12 retailers recorded CLS values outside of the optimal range and one of them (f64.ro) shows a very high value (3.32.). This indicates the need to implement the opportunities and solutions that the online stores need. The best ones in terms of this indicator have values between 0–0.6. The range provided the opportunity to conclude that users consider that the site’s cellini.ro, pentruanimale.ro, and marosbike.ro are visually stable and attractive.
These being mentioned, according to the Core Web Vitals assessment, no retailer out of the 16 studied passed the evaluation. Taking into consideration the distance of each touchpoint from the point of purchase and the impact rate assigned, the authors state that there are online stores that do not carefully drive the users to the checkout. Their attention to the performance of technological features must be amplified. If the performance of the loading speed improved, the results regarding the completion of the customer journey would not hesitate to appear. Moreover, the number of conversions would increase, and the bounce rate, but also of the shopping cart, would decrease, which would be reflected positively on the business income.
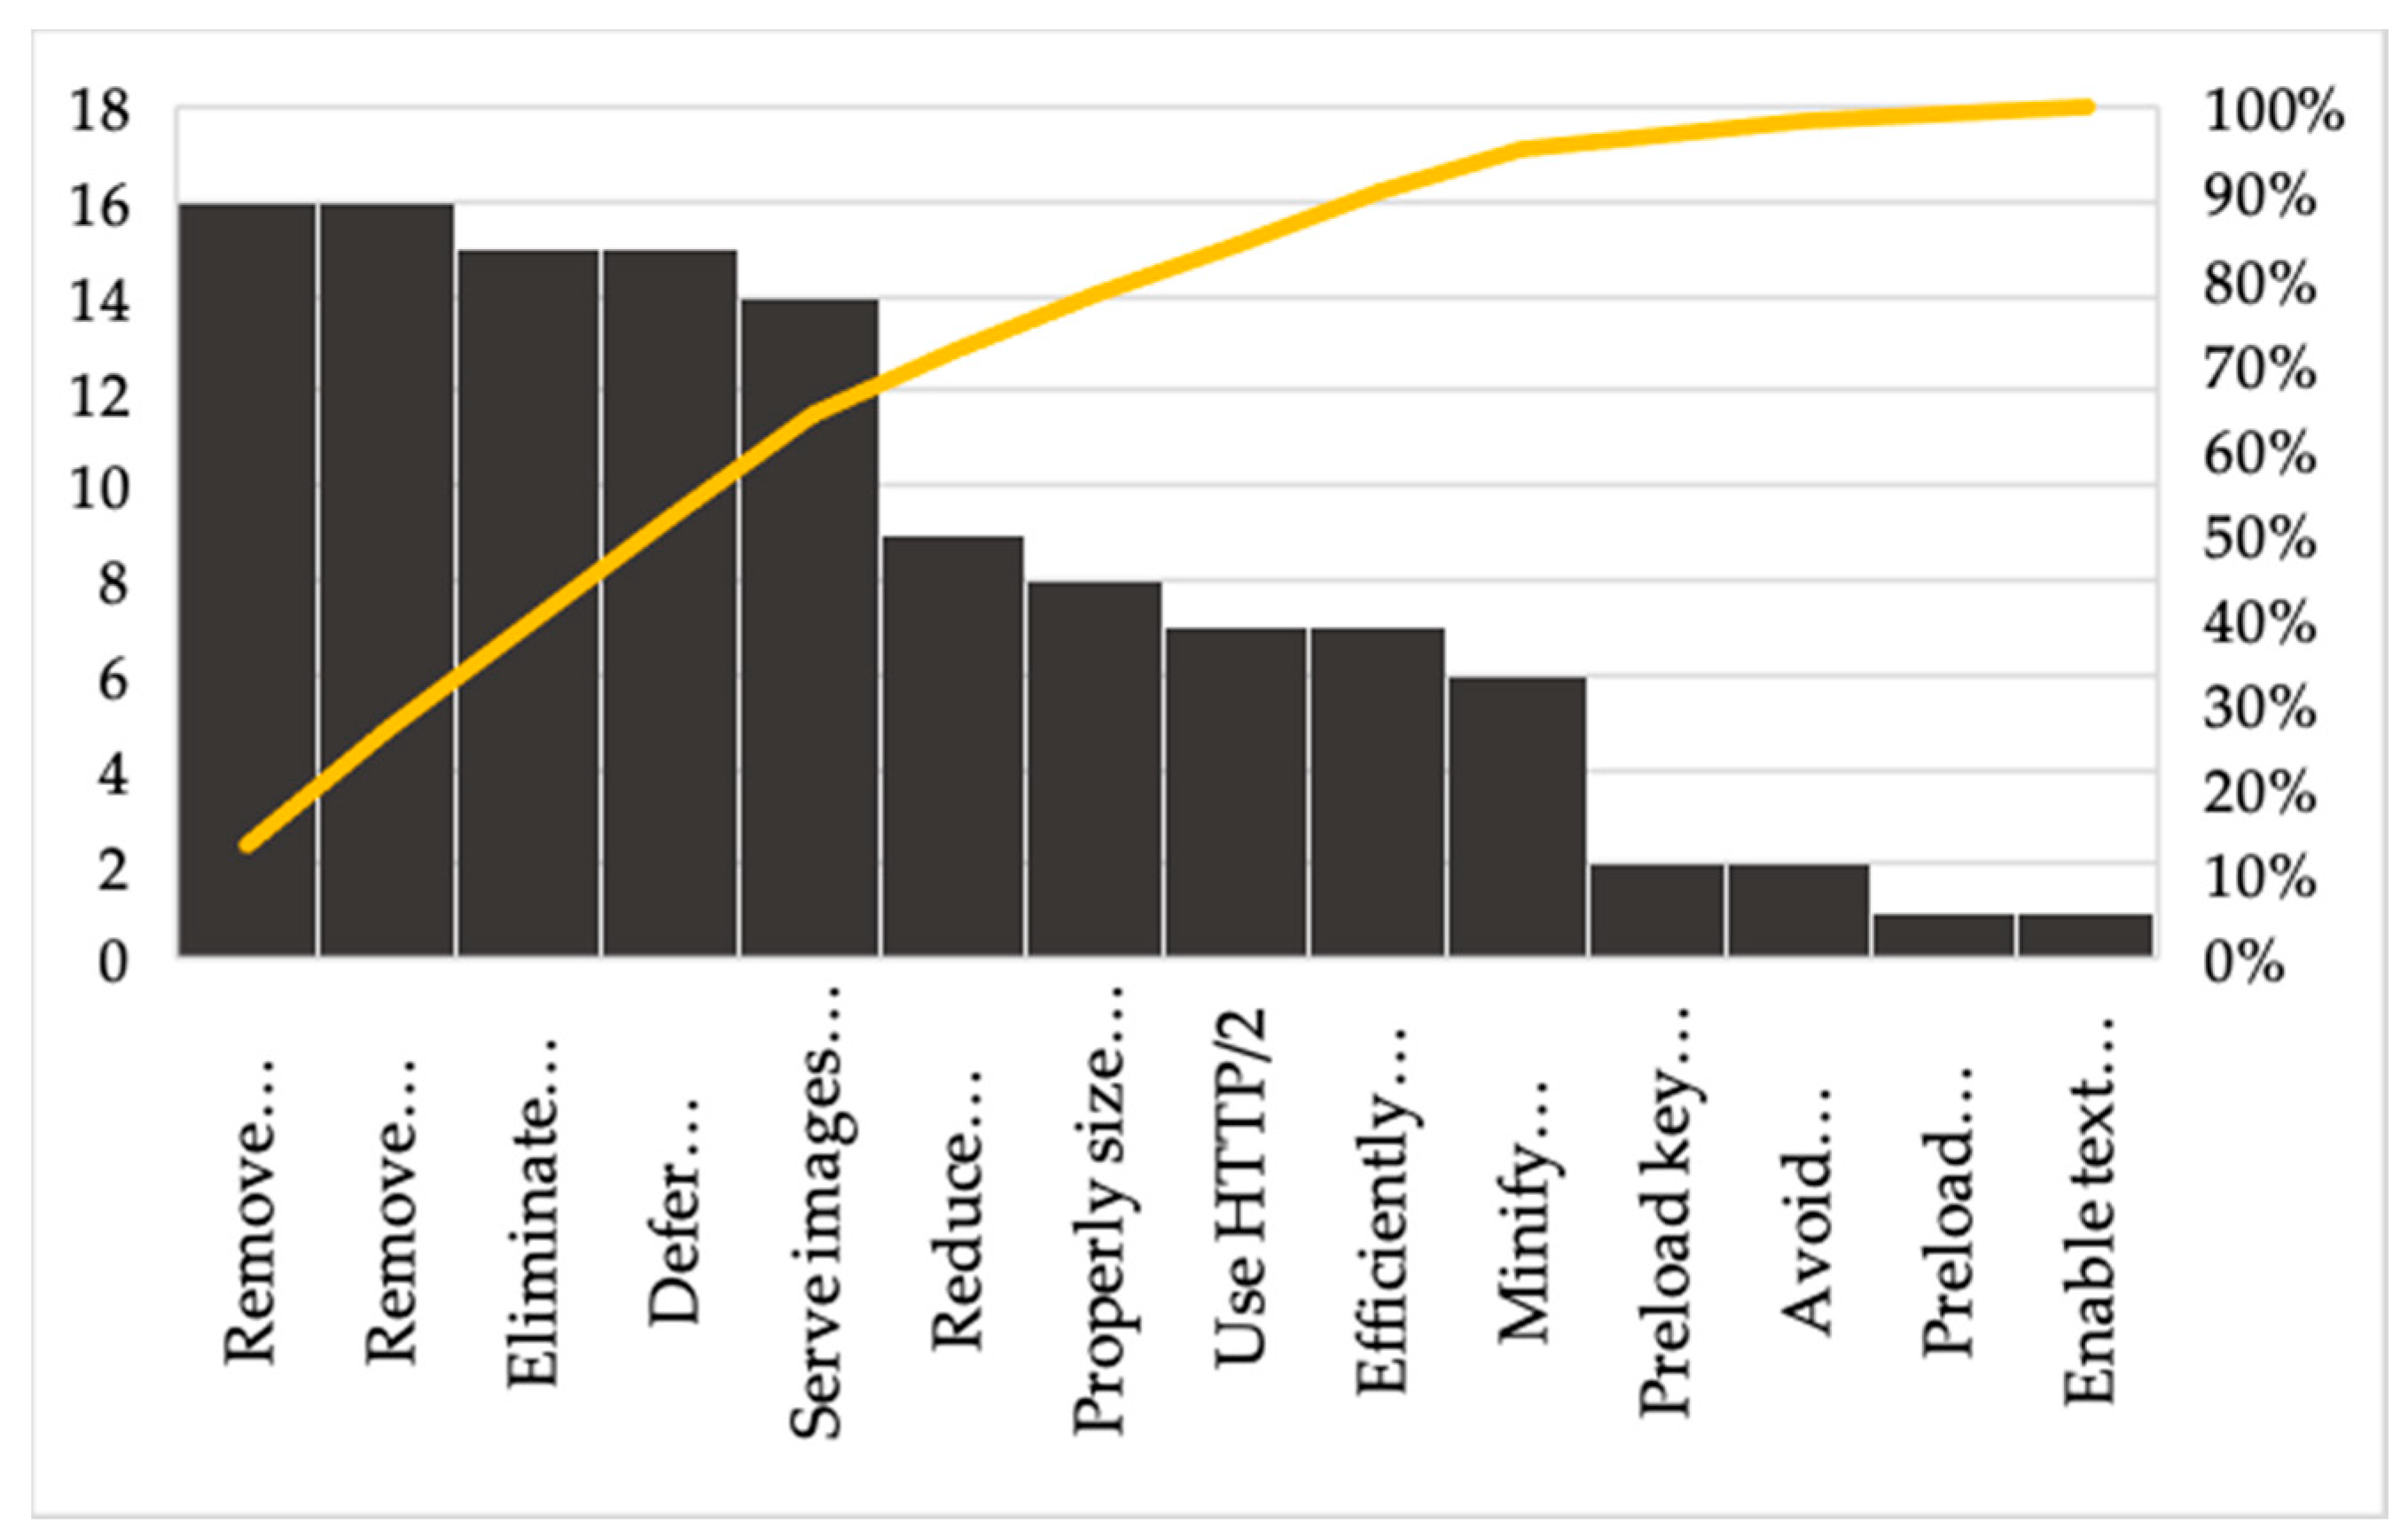
To propose concrete solutions in the Discussion section, 14 recommendations given by Google were highlighted to improve the experience on mobile devices by reducing the seconds required to display the content, their implementation determining a certain saving of the specific loading time (Table 1).
Creating the Pareto diagram, on the horizontal axis were located the resulted opportunities after running the tests. According to the information presented in the table above, Figure 7 illustrates that relatively 80% of the effects produced by the implementation of opportunities are caused by 20% of them.

4.2. Comparative Analysis of Selected E-Commerce Sites

In this analysis, the authors tried to compare the selected sites from two perspectives, using a hierarchy by the method of diameters.
The ranking of the 16 sites proposed from the perspective was made:
  • Performance calculated by the diameter method based on 6 sub-indicators: First Contentful Paint, Speed Index, Largest Contentful Paint, Time to Interactive, Total Blocking Time and Cumulative Layout Shift.
  • Performance, Accessibility, Best Practices, and SEO.

4.2.1. Hierarchy Based on Performance Calculated by the Diameter Method

First, the web.dev application provides a performance level calculated based on 6 sub-indicators: First Contentful Paint, Speed Index, Largest Contentful Paint, Time to Interactive, Total Blocking Time, and Cumulative Layout Shift. The authors tried to obtain new scores by the method of diameters through which they can order the 16 sites considered.
Starting from Table 2, the matrix of LOC1 places is built, where: l o c ( V i ,   C j ) = k , that is, the value of the variant Vi for criterion j occupies the place k in the hierarchy of the m values associated with criterion j (Table 3).
Calculate the appreciation function of each electronic store A, according to relation (1), the diameter function D, according to relation (2), and the aggregate A&D function given by relation (3). This calculation was made based on Table 4 and Table 5 provided by the web.dev. The results obtained are:
Analyzing Table 4, we notice that the first two places are identical both in the hierarchy of performances made by the diameter method and the initial one made by web.dev, being occupied by pentruanimale.ro and buy4baby.ro. At the level of cellini.ro, the biggest difference is observed because in the ranking made by the diameter method, the 3rd place was obtained, and in the initial ranking, it was the 13th place.

4.2.2. Ranking Based on Performance, Accessibility, Best Practices, and SEO

The web.dev application provides a level of Performance, Accessibility, Best Practices, and SEO (Table 6 and Table 7). We tried to obtain a ranking by the method of diameters for the 16 sites considered (Table 8).
Starting from Table 6, the matrix of LOC2 places is built, where: l o c ( V i ,   C j ) = k , that is, the value of the variant Vi for criterion j occupies the place k in the hierarchy of the m values associated with criterion j.
Calculate the appreciation function of each electronic store A, according to relation (1), the diameter function D, according to relation (2), and the aggregate A&D function given by relation (3). This calculation was made based on the considered weights of Performance of 0.4, Accessibility of 0.2, Best Practices of 0.1, and SEO of 0.3.

5. Discussion

The results presented in the paper confirm the studies mentioned in the literature review and refine the significance of the in-between touchpoints from the customer journey. The page load speed might be marked as a non-touchpoint that shapes the total consumer experience [20] of the engaged connected customer in the purchase process. Reflecting on the negative perceived experience due to the long waiting time to make a purchase [26], the retailers must deploy technological performance enhancements to positively influence both the behavior and decisions during the purchase process on smartphones. In this way, those who consider this step risky [28] will be able to clear and solve their concerns about optimizing the conversion rate [29]. Gaining the users’ trust by avoiding the long waiting time between touchpoints, the online stores might reach with swiftness the emotional mitigation and the customer journey duration minimization. The adapted assets vigorously strengthen and ensure the perceived usefulness and ease of use of an m-commerce site, resulting in a positive consumer attitude [35,36,39]. Understanding the magnitude of the website performance [45] and the perspective of approaching an isolated pre-checkout process, might be obtained the drop of bounce rate and the positive impact on performance indicators related to business revenue [41].
The retailers learning approach to explore touchpoint testing lies with keeping the prospect engaged with content enriching to mitigate the sensitivity to loading page speed. To overcome long waiting times, the retailer should engage in active and tailored content revision to prove vigilance toward customer concerns during the journey, which is the value-added per se. The gain is twofold. Both customers and retailers overcome technology flaws and gain insights about mobile purchase process improvement. Technology trust antecedents construct is under scrutiny when it comes to mobile marketing environment design. Recalling competing forces (the authors’ ‘challenges and opportunities’ affecting mobile marketing performance: gaining from a variety with omnichannel and continuous vigilance over reputation flaws from increasing exposure, the retailer has to focus on delivering value to overcome loading page speed negative influence. In terms of tech performance, the loading speed metric, more often than not, is not influenced by the retailer but affects both retailer and customer technology trust. Instead, research has to provide a mobile marketing toolkit to benefit from increased exposure of the retailer who has to exploit signals along the mobile journey to forge customer commitment, despite technological flaws.
Emotional mitigation by optimizing the touchpoints load speed is the main opportunity that retailers can take advantage of because the waiting loading time is a real challenge for them. The authors’ first hypothesis has been confirmed and the online stores that present a poor rating do not show a notable performance in terms of speed in the last month. According to the results, the attention that they pay to the evolution of performance tends to zero, even if they need to implement enhancements is imperative. In this case, the characteristics of the retailers’ websites do not meet the needs of consumers and do not facilitate the search, highlighting the negative influence of the in-between non-interaction touchpoints on the decision-making process [20]. The authors expected the shopping cart page to be treated with high interest by retailers, given that users’ sensitivity to loading time, especially in the pre-checkout phase. In contrast, all studied cases present a cart load speed greater than 2.5 s, in some cases reaching a doubled load speed when users are moving forward to the product page or the shopping cart page, reaching values extremely high (up to 19.8 s).
The need for the customer journey’s duration minimization occurs in theory [26,42,43], but in practice, according to the results of the analysis, a single retailer has a decrease in the number of seconds needed to load pages during the process. Even in this case, the effect on satisfying an immediate user requirement is negative because the loading speed is not fast and demands improvements in both 3G and 4G networks.
Content loading, interactivity, and visual stability were analyzed for site evaluation according to CoreWeb Vitals criteria. Unfortunately, no retailer was able to pass the assessment. The real challenges that might be encountered are represented by the perceived loading speed (FCP), which has registered a loading speed for all online stores beyond the limits of users’ expectations. The high values of LCP generate the risk of a misperception of users about the site usefulness and CLS whose values have shown that users consider the visited pages unattractive and visually unstable, the retailers indirectly determining the consumers not to add the brand on their perception map, becoming the ones who leave the site and never return to it. The users’ negative experience not only drives away the potential consumers but also reduces conversions by up to 20% for every second delay.
The return on evidence reveals that a qualified pilot sample of Romanian retailers fails to deliver upon mobile customer journey expectations, due to significant flaws with processing capturable opportunities within the mobile purchasing environment. What is not captured becomes knowledge waste, which competition will capture. The recorded site load speed presents a need for improvement, the in-between touchpoints’ loading time showing that seconds are increasing as much as the distance to the moment of purchase decreases, none of the online stores pass the evaluation of Core Web Vitals. All these represent real challenges for retailers, which is why they are the starting point for proposing the solutions.

6. Conclusions

With this research, the authors attempt to enrich the scientific knowledge by introducing the touchpoints’ loading speed as a positive factor of the total consumer experience optimization. Approaching an isolated pre-checkout process perspective, the page load speed is marked as a non-touchpoint that shapes the customer journey, with which the retailers have the opportunity to gain the users’ trust by avoiding the long waiting time on smartphones and mitigating the emotional fluctuations with technological performance enhancements.
The theoretical implications are characterized by the creation of continuous learning programs for specialists to provide the needed advice to retailers to develop their assets, the expansion of the universities activity to provide knowledge and assistance about specified consumers requirements, and the encouragement of academic employees to work directly with the online stores to develop mobile commerce in Romania.
The managerial implications regarding the development of m-commerce are represented by the implementation of the opportunities that this paper underpins. Fourteen opportunities have been identified, in the form of specific actions with which managers, developers, and marketers can enhance the user experience in the purchase process on smartphones to achieve a low site bounce rate and an increase in revenue by improving the conversion rate.
A first limit of the elaborated research is the secondary character of the data source (The National Research Program of Online Stores [51]). The retailers included in the study are among those already concerned with consumer perception and the generated results may be characterized as subjective. Another limit is the lack of testing of online stores from the perspective of real people, the primary data being generated entirely by the software. In addition, given the qualitative nature of the research, the sample considered in this study is not representative of the research population.
The research perspectives proposed by the authors are closely related to the limits of the research, but also the results achieved. They want to conduct quantitative research, through which to analyze the indicators of Core Web Vitals evaluation with eye-tracking technology to identify the type of content and where it should first appear on the smartphone to reach user satisfaction immediately. At the same time, it is necessary to elaborate quantitative marketing research to quantify the opinions and attitudes of the consumers regarding the perception about the loading speed of the different touchpoints of the Romanian retailers to ensure a representative study of the researched population. It is also necessary to perform an analysis to identify the level of optimization of web pages on smartphones to complete the present study. Finally, a qualitative focus group research is proposed in which we will try to identify the main barriers to increasing technological performance in terms of the page load speed on smartphones that could complete the list of future directions research.

Author Contributions

Conceptualization, E.N., R.C.L., I.B.C., G.B. and A.T.; methodology, E.N., R.C.L., G.B.; literature review, I.B.C., analysis and writing the results, E.N. and R.C.L.; discussion and conclusions, E.N., R.C.L., I.B.C., G.B., A.T.; writing—original draft preparation, I.B.C.; writing—review and editing, A.T.; visualization, A.T.; supervision, G.B.; project administration, G.B.; funding acquisition, G.B. All authors have read and agreed to the published version of the manuscript.

Funding

This research was funded by the Transilvania University of Brasov.

Institutional Review Board Statement

Not applicable.

Informed Consent Statement

Not applicable.

Data Availability Statement

The data presented in this study are available online at http://bit.ly/3qSa4M0 (accessed on 16 April 2021).

Conflicts of Interest

The authors declare no conflict of interest.

Appendix A

Table A1. The loading speed in the consumer’s journey.
OpportunityTouchpoint’s Loading SpeedLoading Speed in the Consumer’s Journey
Home PageProduct PageCart Page
1cusutsibrodat.ro5.48.64.4 Jtaer 16 00077 i001
2f64.ro2.93.65.8 Jtaer 16 00077 i002
3sdhouse.ro3.53.53.4 Jtaer 16 00077 i003
4auto-soft.ro4.655 Jtaer 16 00077 i004
5cellini.ro5.64.95 Jtaer 16 00077 i005
6helloholidays.ro3.63.63.9 Jtaer 16 00077 i006
7inamdeicalsport.ro3.63.93.6 Jtaer 16 00077 i007
8pentruanimale.ro2.93.42.5 Jtaer 16 00077 i008
9marosbike.ro4.14.14.1 Jtaer 16 00077 i009
10officedirect.ro4.75.410 Jtaer 16 00077 i010
11cafelepremiate.ro4.54.13.8 Jtaer 16 00077 i011
12manier.ro5.16.94.7 Jtaer 16 00077 i012
13magazinulcolectionarului.ro4.34.43.8 Jtaer 16 00077 i013
14buy4baby.ro4.24.24.2 Jtaer 16 00077 i014
15heliumking.ro3.93.84 Jtaer 16 00077 i015
16sancogroup.ro3.73.73.9 Jtaer 16 00077 i016

References

  1. Ieva, M.; Ziliani, C. Mapping touchpoint exposure in retailing: Implications for developing an omnichannel customer experience. IJRDM 2018, 46, 304–322. [Google Scholar] [CrossRef]
  2. Wilson-Nash, C.; Goode, A.; Currie, A. Introducing the socialbot: A novel touchpoint along the young adult customer journey. Eur. J. Mark. 2020, 54, 2621–2643. [Google Scholar] [CrossRef]
  3. Barann, B.; Hermann, A.; Heuchert, M.; Becker, J. Can’t touch this? Conceptualizing the customer touchpoint in the context of omni-channel retailing. J. Retail. Consum. Serv. 2020, 102269, in press. [Google Scholar] [CrossRef]
  4. Roggeveen, A.L.; Sethuraman, R. Customer-Interfacing Retail Technologies in 2020 & Beyond: An Integrative Framework and Research Directions. J. Retail. 2020, 96, 299–309. [Google Scholar] [CrossRef]
  5. Stoica, I.; Vegheş, C.; Orzan, M. Statistical Exploratory Marketing Research on Romanian Consumer’s Behavior Regarding Smartphones. Proc. Econ. Financ. 2015, 32, 923–931. [Google Scholar] [CrossRef] [Green Version]
  6. Clarke, I., III. Emerging value propositions for m-commerce. J. Bus. Strateg. 2008, 25, 41–57. [Google Scholar]
  7. Liébana-Cabanillas, F.; Marinković, V.; Kalinić, Z.A. SEM-neural network approach for predicting antecedents of m-commerce acceptance. Int. J. Inf. Manag. 2017, 37, 14–24. [Google Scholar] [CrossRef]
  8. Sujatha, R.; Sekkizhar, J. Determinants of M-Commerce Adoption in India Using Technology Acceptance Model Infused with Innovation Diffusion Theory. J. Manag. Res. 2019, 19, 193–204. [Google Scholar]
  9. Kale, A.; Mente, R. M-Commerce: Services and applications. Int. J. Adv. Sci. Res. 2018, 3, 19–21. [Google Scholar]
  10. Heinze, J.; Thomann, M.; Fischer, P. Ladders to m-commerce resistance: A qualitative means-end approach. Comput. Hum. Behav. 2017, 73, 362–374. [Google Scholar] [CrossRef]
  11. Vakulenko, Y.; Shams, P.; Hellström, D.; Hjort, K. Service innovation in e-commerce last-mile delivery: Mapping the e-customer journey. J. Bus. Res. 2019, 101, 461–468. [Google Scholar] [CrossRef]
  12. Wang, Y.; Jia, F.; Schoenherr, T.; Gong, Y. Supply Chain-Based Business Model Innovation: The Case of a Cross-Border E-Commerce Company. Sustainability 2018, 10, 4362. [Google Scholar] [CrossRef] [Green Version]
  13. Usman, M.U.; Kumar, P. Factors influencing consumer intention to shop online in Nigeria: A conceptual study. Vision 2020. [Google Scholar] [CrossRef]
  14. Grewal, D.; Roggeveen, A.L. Understanding retail experiences and customer journey management. J. Retail. 2020, 96, 3–8. [Google Scholar] [CrossRef]
  15. Lemon, K.N.; Verhoef, P.C. Understanding customer experience throughout the customer journey. J. Mark. 2016, 80, 69–96. [Google Scholar] [CrossRef]
  16. Varnali, K. Understanding customer journey from the lenses of complexity theory. Serv. Ind. J. 2019, 39, 820–835. [Google Scholar] [CrossRef]
  17. Balaji, N.; Rao, U.S. Digital touchpoints and consumer decision journey with reference to two-wheelers. IJARnD 2018, 3, 21–27. [Google Scholar]
  18. Rudkowski, J.; Heney, C.; Yu, H.; Sedlezky, S.; Gunn, F. Here Today, Gone Tomorrow? Mapping and modelling the pop-up retail customer journey. J. Retail. Consum. Serv. 2020, 54. [Google Scholar] [CrossRef]
  19. Pop, R.A.; Săplăcan, Z.; Dabija, D.C.; Alt, M.A. The impact of social media influencers on travel decisions: The role of trust in consumer decision journey. Curr. Issues Tour. 2021, 1–21. [Google Scholar] [CrossRef]
  20. Chatzopoulos, C.G.; Weber, C. Challenges of Total Customer Experience (TCX): Measurement beyond Touchpoints. IJIEM 2018, 9, 187–196. [Google Scholar] [CrossRef]
  21. Jensen, M. Touchpoint management and interpersonal communication. Stud. Media Commun. 2016, 4, 30–48. [Google Scholar] [CrossRef]
  22. Walton, P. Web Vitals. 2020. Available online: https://web.dev/vitals/ (accessed on 5 April 2021).
  23. Rendtorff, J.D. Managing Authentic Experience in the Hypermodern Economy: Sociological and Philosophical Foundations. J. Manag. Policy Pract. 2018, 19. [Google Scholar] [CrossRef]
  24. Flacandji, M.; Krey, N. Remembering shopping experiences: The shopping experience memory scale. J. Bus. Res. 2020, 107, 279–289. [Google Scholar] [CrossRef]
  25. De Keyser, A.; Verleye, K.; Lemon, K.N.; Keiningham, T.L.; Klaus, P. Moving the customer experience field forward: Introducing the touchpoints, context, qualities (TCQ) nomenclature. J. Serv. Res. 2020, 23, 433–455. [Google Scholar] [CrossRef]
  26. McLean, G.; Osei-Frimpong, K.; Al-Nabhani, K.; Marriott, H. Examining consumer attitudes towards retailers’ m-commerce mobile applications—An initial adoption vs. continuous use perspective. J. Bus. Res. 2020, 106, 139–157. [Google Scholar] [CrossRef]
  27. Narang, B.; Arora, J.B. Present and Future of Mobile Commerce: Introduction, Comparative Analysis of M Commerce and E Commerce, Advantages, Present and Future. In Mobile Commerce: Concepts, Methodologies, Tools, and Applications; Information Resources Management Association; IGI Global: Hershey, PA, USA, 2018; pp. 1431–1447. [Google Scholar] [CrossRef]
  28. Rana, N.P.; Barnard, D.J.; Baabdullah, A.M.; Rees, D.; Roderick, S. Exploring barriers of m-commerce adoption in SMEs in the UK: Developing a framework using ISM. Int. J. Inf. Manag. 2019, 44, 141–153. [Google Scholar] [CrossRef]
  29. Di Fatta, D.; Patton, D.; Viglia, G. The determinants of conversion rates in SME e-commerce websites. J. Retail. Consum. Serv. 2018, 41, 161–168. [Google Scholar] [CrossRef]
  30. Chopdar, P.K.; Balakrishnan, J. Consumers response towards mobile commerce applications: S-O-R approach. Int. J. Inf. Manag. 2020, 53. [Google Scholar] [CrossRef]
  31. Al-Adwan, A.S.; Alrousan, M.; Al-Soud, A.; Al-Yaseen, H. Revealing the black box of shifting from electronic commerce to mobile commerce: The case of Jordan. J. Theor. Appl. Electron. Commer. Res. 2019, 14, 51–67. [Google Scholar] [CrossRef] [Green Version]
  32. Thongpapanl, N.; Ashraf, A.R.; Lapa, L.; Venkatesh, V. Differential Effects of Customers’ Regulatory Fit on Trust, Perceived Value, and M-Commerce Use among Developing and Developed Countries. J. Int. Mark. 2018, 26, 22–44. [Google Scholar] [CrossRef]
  33. Khaskheli, A.; Jun, Y.; Bhuiyan, M.A. M-Commerce and Mobile Apps: Opportunities for SMEs in Developing Countries. J. Int. Bus. Res. Mark. 2017, 2, 20–23. [Google Scholar] [CrossRef]
  34. Hassan, A.H.; Manna, R.F.; El-Ebiary, Y.A.B.; Al-Sammarraie, N.A. Evaluating Trust-Based Factors Influencing Uses M-Commerce in Jordan. Adv. Sci. Lett. 2018, 24, 4308–4311. [Google Scholar] [CrossRef]
  35. Hsu, C.-W.; Yeh, C.-C. Understanding the critical factors for successful M-commerce adoption. Int. J. Mob. Commun. 2018, 16. [Google Scholar] [CrossRef]
  36. Ijaz, M.F.; Rhee, J. Constituents and Consequences of Online-Shopping in Sustainable E-Business: An Experimental Study of Online-Shopping Malls. Sustainability 2018, 10, 3756. [Google Scholar] [CrossRef] [Green Version]
  37. Barry, M.; Jan, M.T. Factors influencing the use of M-commerce: An extended technology acceptance model perspective. Int. J. Econ. Manag. Account. 2018, 26, 157–183. [Google Scholar]
  38. Ajibola, A.S.; Goosen, L. Development of heuristics for usability evaluation of m-commerce applications. In Proceedings of the South African Institute of Computer Scientists and Information Technologists (SAICSIT ‘17), New York, NY, USA, 26–28 September 2017; pp. 1–10. [Google Scholar] [CrossRef]
  39. Chi, T. Understanding Chinese consumer adoption of apparel mobile commerce: An extended TAM approach. J. Retail. Consum. Serv. 2018, 44, 274–284. [Google Scholar] [CrossRef]
  40. Gatt, A. Developing UI/UX Design Guide for E-Commerce Mobile Applications. Bachelor’s Thesis, University of Malta, Msida, Malta, 2017. Available online: https://www.um.edu.mt/library/oar/handle/123456789/22253 (accessed on 6 February 2021).
  41. Akamai. The State of Online Retail Performance Report. 2017. Available online: https://www.akamai.com/uk/en/about/news/press/2017-press/akamai-releases-spring-2017-state-of-online-retail-performance-report.jsp (accessed on 6 February 2021).
  42. Deloitte Digital. Milliseconds Make Millions. Available online: https://www.thinkwithgoogle.com/_qs/documents/9382/Milliseconds_Make_Millions_report.pdf (accessed on 28 January 2021).
  43. Think with Google. Available online: https://www.thinkwithgoogle.com/marketing-strategies/app-and-mobile/mobile-site-speed-tools-improve-conversions/ (accessed on 28 January 2021).
  44. Think with Google. Available online: https://www.thinkwithgoogle.com/marketing-strategies/app-and-mobile/mobile-site-speed-tools-purchase-impact/ (accessed on 28 January 2021).
  45. Faulds, D.J.; Mangold, W.G.; Raju, P.S.; Valsalan, S. The mobile shopping revolution: Redefining the consumer decision process. Bus. Horiz. 2018, 61, 323–338. [Google Scholar] [CrossRef]
  46. Tueanrat, Y.; Papagiannidis, S.; Alamanos, E. Going on a journey: A review of the customer journey literature. J. Bus. Res. 2021, 125, 336–353. [Google Scholar] [CrossRef]
  47. Mlekus, L.; Bentler, D.; Paruzel, A.; Kato-Beiderwieden, A.L.; Maier, G.W. How to raise technology acceptance: User experience characteristics as technology-inherent determinants. Gr. Interakt. Organ. Z. Angew. Organ. (GIO) 2020, 51, 273–283. [Google Scholar] [CrossRef]
  48. Duan, J.; Zhang, C.; Gong, Y.; Brown, S.; Li, Z. A content-analysis based literature review in blockchain adoption within food supply chain. Int. J. Environ. Res. Public Health 2020, 17, 1784. [Google Scholar] [CrossRef] [Green Version]
  49. Yu, C.E. Humanlike robots as employees in the hotel industry: Thematic content analysis of online reviews. J. Hosp. Mark. Manag. 2020, 29, 22–38. [Google Scholar] [CrossRef]
  50. Tan, T.; Mills, G.; Papadonikolaki, E.; Liu, Z. Combining multi-criteria decision making (MCDM) methods with building information modelling (BIM): A review. Autom. Constr. 2021, 121, 103451. [Google Scholar] [CrossRef]
  51. Trusted.ro. Programul National Pentru Certificarea Magazinelor Online (National Program for the Certification of Online Stores). Available online: https://trusted.ro/magazine-atestate/ (accessed on 28 January 2021).
  52. Think with Google. Test My Site. Improve Your Mobile Site to Boost Your Business. Available online: https://www.thinkwithgoogle.com/intl/en-cee/feature/testmysite/ (accessed on 28 January 2021).
  53. Petshop Online—Pentru Animale. Available online: www.pentruanimale.ro (accessed on 28 January 2021).
Figure 1. The cases of retailers that presents changes in loading speed during customer journey in 3G network.
Jtaer 16 00077 g001
Figure 2. The loading speed for retailers that show an increase in the number of seconds as the user draws near the shopping cart.
Jtaer 16 00077 g002
Figure 3. The differences between 3G and 4G networks regarding loading page speed.
Jtaer 16 00077 g003
Figure 4. The customer journey for pentruanimale.ro’s users regarding loading page speed of studied touchpoints.
Jtaer 16 00077 g004
Figure 5. The chronology of content loading for auto-soft.ro.
Jtaer 16 00077 g005
Figure 6. The chronology of content loading for sdhouse.ro.
Jtaer 16 00077 g006
Figure 7. Pareto diagram for the identified opportunities.
Jtaer 16 00077 g007
Table 1. The opportunities for retailers and time savings once implemented.
OpportunityTime Savings (Seconds)Frequency (Retailers)
MinMax
1Remove unused JavaScript0.454.0516
2Remove unused CSS0.30.916
3Eliminate render-blocking resources0.32.6615
4Defer offscreen images0.155.5515
5Serve images in next-gen formats0.1547.114
6Reduce initial server response time0.582.979
7Properly size images0.152.48
8Use HTTP/20.1511.67
9Efficiently encode images0.2934.47
10Minify JavaScript0.150.396
11Preload key requests1.984.082
12Avoid serving legacy JavaScript to modern browsers0.150.452
13Preload Largest Contentful Paint image3.181
14Enable text compression0.151
Table 2. The values of the sub-indicators calculated by web.dev.
PerformanceFirst Contentful Paint (s)Speed Index (s)Largest Contentful Paint (s)Time to Interactive (s)Total Blocking Time (ms)Cumulative Layout Shift
1cusutsibrodat.ro3719.339.443.215100.847
2f64.ro45.619.518.726.329800.437
3sdhouse.ro17312.71624.646900.007
4auto-soft.ro204.77.815.712.87401.504
5cellini.ro65.812.713.220.414100.55
6directbooking.ro303.19.84.411.621900.001
7inamedicalsport.ro323.618.73.622.28800.388
8pentruanimale.ro372.96.4412.412100.293
9marosbike.ro234.1108.212.86201.023
10officedirect.ro214.78.97.3108000.794
11cafelepremiate.ro45.914.726.418.672500.804
12manier.ro88.411.713.516.718900.002
13magazinulcolectionarului.ro123.88.31323.925801.441
14buy4baby.ro354.58.59.810.44200.097
15heliumking.ro163.88.71319.623400.002
16sancogrup.ro76.410.112.714.820600.315
Table 3. The 1st place matrix for performance sub-indicators.
RetailerFirst Contentful Paint (s)Speed Index (s)Largest Contentful Paint (s)Time to Interactive (s)Total Blocking Time (ms)Cumulative Layout Shift
1cusutsibrodat.ro15151616813
2f64.ro11161415149
3sdhouse.ro2111314154
4auto-soft.ro92125316
5cellini.ro12121011710
6directbooking.ro3733111
7inamedicalsport.ro41411258
8pentruanimale.ro112466
9marosbike.ro7856214
10officedirect.ro10641411
11cafelepremiate.ro13131591612
12manier.ro161011892
13magazinulcolectionarului.ro538131315
14buy4baby.ro846215
15heliumking.ro65910123
16sancogrup.ro14977107
Table 4. Performance hierarchy by diameter method vs. initial web.dev hierarchy.
RetailerA(Vi)D(Vi)A&D(Vi)New HierarchyWeb.Dev Hierarchy
1cusutsibrodat.ro2.4585.2251416
2f64.ro2.2575.6251114
3sdhouse.ro4.75133.875168
4auto-soft.ro9.05145.525127
5cellini.ro658.5313
6directbooking.ro10.5108.2554
7inamedicalsport.ro9.6136.393
8pentruanimale.ro12.8511.911
9marosbike.ro10.4127.285
10officedirect.ro10.9108.4546
11cafelepremiate.ro2.475.71015
12manier.ro5.8143.91511
13magazinulcolectionarului.ro6.85125.4251310
14buy4baby.ro11.9710.4522
15heliumking.ro7.4597.22579
16sancogrup.ro6.977.95612
Table 5. The share of performance indicators given by web.dev.
TitleWeight
First Contentful Paint15%
Speed Index15%
Largest Contentful Paint25%
Time to Interactive15%
Total Blocking Time25%
Cumulative Layout Shift5%
Table 6. The values of the indicators calculated by web.dev.
RetailerPerformanceAccessibilityBest PracticesSEO
1cusutsibrodat.ro3815382
2f64.ro4737399
3sdhouse.ro17816784
4auto-soft.ro20646085
5cellini.ro6856079
6directbooking.ro30565375
7inamedicalsport.ro32635384
8pentruanimale.ro37556782
9marosbike.ro23676080
10officedirect.ro21787389
11cafelepremiate.ro4676065
12manier.ro8896089
13magazinulcolectionarului.ro12756082
14buy4baby.ro35776084
15heliumking.ro16736086
16sancogrup.ro7666784
Table 7. The 2nd place matrix for Performance, Accessibility, Best Practices, and SEO indicators.
RetailerPerformanceAccessibilityBest PracticesSEO
1cusutsibrodat.ro1231410
2f64.ro9811
3sdhouse.ro2436
4auto-soft.ro101365
5cellini.ro112714
6directbooking.ro15151515
7inamedicalsport.ro614167
8pentruanimale.ro516411
9marosbike.ro110813
10officedirect.ro3522
11cafelepremiate.ro411916
12manier.ro131103
13magazinulcolectionarului.ro771112
14buy4baby.ro86128
15heliumking.ro149134
16sancogrup.ro161259
Table 8. Ranking based on Performance, Accessibility, Best Practices, and SEO.
RetailerA(Vi)D(Vi)A&D(Vi)Ranking
1cusutsibrodat.ro6.2115.612
2f64.ro10.489.23
3sdhouse.ro12.3412.152
4auto-soft.ro7.387.657
5cellini.ro6.3125.1515
6directbooking.ro108.56
7inamedicalsport.ro7.1106.558
8pentruanimale.ro7.1125.5513
9marosbike.ro8.9126.459
10officedirect.ro133131
11cafelepremiate.ro6.5125.2514
12manier.ro8.7126.3510
13magazinulcolectionarului.ro7.159.054
14buy4baby.ro8695
15heliumking.ro6.1106.0511
16sancogrup.ro4114.516
Publisher’s Note: MDPI stays neutral with regard to jurisdictional claims in published maps and institutional affiliations.

