sensors-logo

Journal Browser

Journal Browser

Sensors in Agriculture and Forestry

A topical collection in Sensors (ISSN 1424-8220). This collection belongs to the section "Smart Agriculture".

Viewed by 278578

Editor


E-Mail Website1 Website2
Collection Editor
Department Software Engineering and Artificial Intelligence, Faculty of Informatics, University Complutense of Madrid, 28040 Madrid, Spain
Interests: computer vision; image processing; pattern recognition; 3D image reconstruction, spatio-temporal image change detection and tracking; fusion and registering from imaging sensors; superresolution from low-resolution image sensors
Special Issues, Collections and Topics in MDPI journals

Topical Collection Information

Dear Colleagues,

Sensors and technologies involving sensors in agriculture and forestry play an important role today. In agriculture and silviculture, as a branch of forestry, the need for increasing the production and simultaneously the efforts for minimizing the environmental impact and for saving costs make the sensor systems the best allied tool. The use of sensors helps to exploit all available resources appropriately and to apply hazardous products moderately. When nutrients in the soil, humidity, solar radiation, density of weeds and all factors affecting the production are known, this gets better and the use of chemical products such as fertilizers, herbicides and other pollution products can be reduced considerably. These activities fall inside the emerging area known as Precision Agriculture. In forest management, which can be considered a branch of forestry, a lot of number of activities is oriented towards wood production or forest inventories with the aims of controlling parameters of interest such as diameter of trees, height, crown height, bark thickness and other variables, such as canopy, humidity, illumination, CO2 transformation, where the social acceptation is of interest.

The use of unmanned aerial or ground vehicles (UAVs and UGVs), equipped with a set of sensors, has experimented an important growing during the last years to carry out the tasks involved in the above processes and also for autonomous navigation on the specific agricultural and forestry environments. But also traditional crewed vehicles are sensorized conveniently with same purpose.

Additionally, during the post-production process, including transportation, storage, packing, selection, classification or distribution among others, the use of sensors is of vital importance for minimizing costs and negative environmental impact allowing saving energy or minimizing the application of chemical products.

A list of sensors covering the above topics, but are not limited, is the following: biological (including chemical and gas analyzers), water sensors, meteorological sensors, weed seekers, optical cameras, Light Detection and Ranging (LIDAR), photometric sensors, soil respiration or moisture, photosynthesis sensors, Leaf Area index (LAI) sensors, range finders, Dendrometers, hygrometers.

This Topical Collection covers the following topics related to the above sensors:

  • Sensors devices capabilities, materials and technologies
  • Applications and problems addressed
  • Sensors domain-oriented devices and methods used for processing the data sensed

Prof. Dr. Gonzalo Pajares Martinsanz
Collection Editor

Manuscript Submission Information

Manuscripts for the topical collection can be submitted online at www.mdpi.com by registering and logging in to this website. Once you are registered, click here to go to the submission form. All papers will be peer-reviewed. Accepted papers will be published continuously in the journal (as soon as accepted) and will be listed together on this website. The topical collection considers regular research articles, short communications and review articles. A guide for authors and other relevant information for submission of manuscripts is available on the Instructions for Authors page.

Please visit the Instructions for Authors page before submitting a manuscript. The article processing charge (APC) for publication in this open access journal is 2600 CHF (Swiss Francs).

Keywords

  • sensors in agriculture and forestry
  • precision agriculture
  • sensors in agricultural and forestry production
  • storage and distribution
  • technologies
  • material and methods
  • sensors applications
  • processing of sensed data

Published Papers (40 papers)

2024

Jump to: 2023, 2022, 2021, 2020, 2019, 2018, 2017, 2016, 2015, 2014

17 pages, 8946 KiB  
Article
A Tree Attenuation Factor Model for a Low-Power Wide-Area Network in a Ruby Mango Plantation
by Supachai Phaiboon and Pisit Phokharatkul
Sensors 2024, 24(3), 750; https://doi.org/10.3390/s24030750 - 24 Jan 2024
Viewed by 538
Abstract
Ruby mangoes are a cultivar with a thick skin, firm texture, red color, no splinters, and thin seeds that is grown in eastern Thailand for export. Implementing a low-power wide-area network (LPWAN) for smart agriculture applications can help increase the crop quality or [...] Read more.
Ruby mangoes are a cultivar with a thick skin, firm texture, red color, no splinters, and thin seeds that is grown in eastern Thailand for export. Implementing a low-power wide-area network (LPWAN) for smart agriculture applications can help increase the crop quality or yield. In this study, empirical path loss models were developed to help plan a LPWAN, operating at 433 MHz, of a Ruby mango plantation in Sakaeo, eastern Thailand. The proposed models take advantage of the symmetric pattern of Ruby mango trees cultivated in the plantation by using tree attenuation factors (TAFs) to consider the path loss at the trunk and canopy levels. A field experiment was performed to collect received signal strength indicator (RSSI) measurements and compare the performance of the proposed models with those of conventional models. The proposed models demonstrated a high prediction accuracy for both line-of-sight and non-line-of-sight routes and performed better than the other models. Full article
Show Figures

Figure 1

2023

Jump to: 2024, 2022, 2021, 2020, 2019, 2018, 2017, 2016, 2015, 2014

19 pages, 4626 KiB  
Article
Toward Optimal Irrigation Management at the Plot Level: Evaluation of Commercial Water Potential Sensors
by Alaitz Aldaz-Lusarreta, Miguel Ángel Campo-Bescós, Iñigo Virto and Rafael Giménez
Sensors 2023, 23(22), 9255; https://doi.org/10.3390/s23229255 - 17 Nov 2023
Viewed by 743
Abstract
Proper irrigation practice consists of applying the optimum amount of water to the soil at the right time. The porous characteristics of the soil determine the capacity of the soil to absorb, infiltrate, and store water. In irrigation, it is not sufficient to [...] Read more.
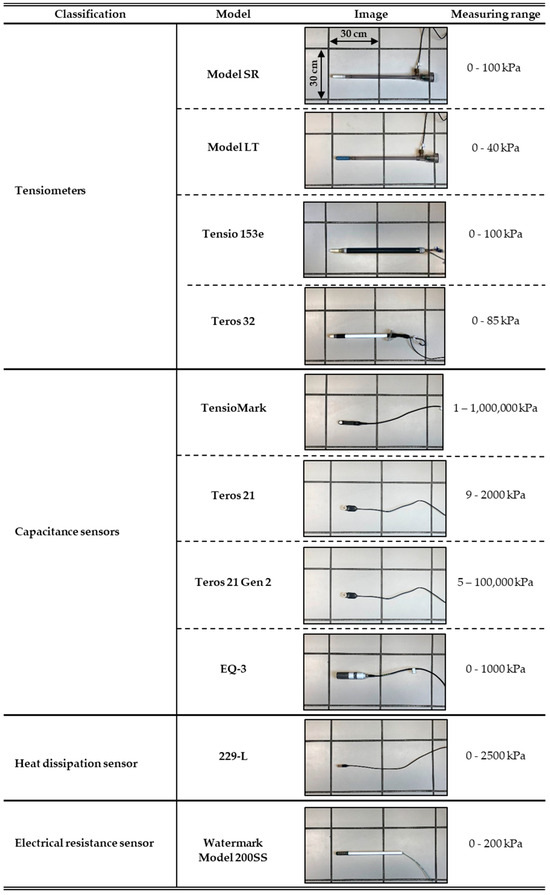
Proper irrigation practice consists of applying the optimum amount of water to the soil at the right time. The porous characteristics of the soil determine the capacity of the soil to absorb, infiltrate, and store water. In irrigation, it is not sufficient to only determine the water content of the soil; it is also necessary to determine the availability of water for plants: water potential. In this paper, a comprehensive laboratory evaluation—accuracy and variability—of the world’s leading commercial water potential sensors is carried out. No such comprehensive and exhaustive comparative evaluation of these devices has been carried out to date. Ten pairs of representative commercial sensors from four different families were selected according to their principle of operation (tensiometers, capacitive sensors, heat dissipation sensors, and resistance blocks). The accuracy of the readings (0 kPa–200 kPa) was determined in two soils of contrasting textures. The variability in the recordings—repeatability and reproducibility—was carried out in a homogeneous and inert material (sand) in the same suction range. The response in terms of accuracy and value dispersion of the different sensor families was different according to the suction range considered. In the suction range of agronomic interest (0–100 kPa), the heat dissipation sensor and the capacitive sensors were the most accurate. In both families, registrations could be extended up to 150–200 kPa. The scatter in the readings across the different sensors was due to approximately 80% of the repeatability or intrinsic variability in the sensor unit and 20% of the reproducibility. Some sensors would significantly improve their performance with ad hoc calibrations. Full article
Show Figures

Figure 1

2022

Jump to: 2024, 2023, 2021, 2020, 2019, 2018, 2017, 2016, 2015, 2014

13 pages, 1892 KiB  
Article
Bayesian Aggregation Improves Traditional Single-Image Crop Classification Approaches
by Ivan Matvienko, Mikhail Gasanov, Anna Petrovskaia, Maxim Kuznetsov, Raghavendra Jana, Maria Pukalchik and Ivan Oseledets
Sensors 2022, 22(22), 8600; https://doi.org/10.3390/s22228600 - 08 Nov 2022
Cited by 2 | Viewed by 1302
Abstract
Accurate information about growing crops allows for regulating the internal stocks of agricultural products and drawing strategies for negotiating agricultural commodities on financial markets. Machine learning methods are widely implemented for crop type recognition and classification based on satellite images. However, field classification [...] Read more.
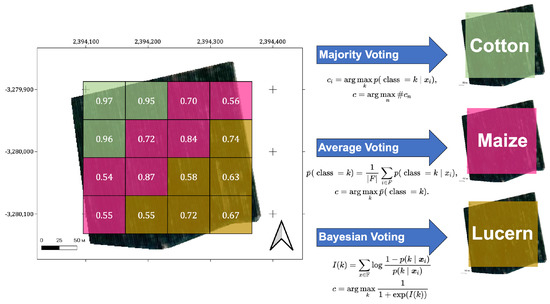
Accurate information about growing crops allows for regulating the internal stocks of agricultural products and drawing strategies for negotiating agricultural commodities on financial markets. Machine learning methods are widely implemented for crop type recognition and classification based on satellite images. However, field classification is complicated by class imbalance and aggregation of pixel-wise into field-wise forecasting. We propose here a Bayesian methodology for the aggregation of classification results. We report the comparison of class balancing techniques. We also report the comparison of classical machine learning methods and the U-Net convolutional neural network for classifying crops using a single satellite image. The best result for single-satellite-image crop classification was achieved with an overall accuracy of 77.4% and a Macro F1-score of 0.66. Bayesian aggregation for field-wise classification improved the result obtained using majority voting aggregation by 1.5%. We demonstrate here that the Bayesian aggregation approach outperforms the majority voting and averaging strategy in overall accuracy for the single-image crop classification task. Full article
Show Figures

Figure 1

2021

Jump to: 2024, 2023, 2022, 2020, 2019, 2018, 2017, 2016, 2015, 2014

13 pages, 5461 KiB  
Article
Control and Real-Time Data Acquisition of an Experimental Platform for Stored Grain Aeration Study
by Jingyun Liu and Ping Li
Sensors 2021, 21(16), 5403; https://doi.org/10.3390/s21165403 - 10 Aug 2021
Cited by 2 | Viewed by 1828
Abstract
Aeration is one of the most important methods to keep stored grain safe and maintain its quality. Experimental platforms are used for stored grain aeration study in a laboratory-scale. The purpose of this paper was to provide the real-time data acquisition and control [...] Read more.
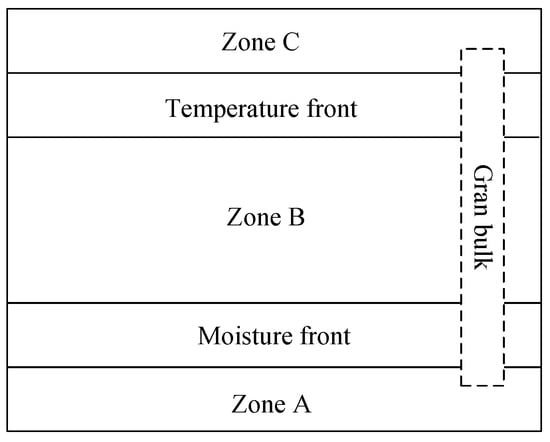
Aeration is one of the most important methods to keep stored grain safe and maintain its quality. Experimental platforms are used for stored grain aeration study in a laboratory-scale. The purpose of this paper was to provide the real-time data acquisition and control system design of a new experimental platform with multifunction for stored grain study. Requirements of the aeration experiments were analyzed, and multi running modes were designed. The aeration inlet air conditions were designed to be adjustable and multi variables need to be controlled simultaneously, which was a key problem to be solved for the platform. An ON/OFF-PID based multivariable cooperative control method was proposed, and two control loops were formed where inlet air temperature and humidity were considered separately while could be controlled simultaneously with a logic judgement strategy. Real-time data needed to be monitored was acquired with different sensors and displayed intuitively. Experiments were carried out to test the static and dynamic characteristics of the control method and three inlet air flow rates of 0.03, 0.08 and 0.13 m·s−1were used. Performance of the data acquisition system was also tested. The results showed that, the inlet air conditions control error was within ±1 °C and 10% for temperature and relative humidity, respectively. The real-time data acquisition of multi parameters during aeration process was realized. The experimental platform can be used for studies of different aeration objectives. Full article
Show Figures

Figure 1

18 pages, 3852 KiB  
Article
Compression-Aware Aggregation and Energy-Aware Routing in IoT–Fog-Enabled Forest Environment
by Srividhya Swaminathan, Suresh Sankaranarayanan, Sergei Kozlov and Joel J. P. C. Rodrigues
Sensors 2021, 21(13), 4591; https://doi.org/10.3390/s21134591 - 04 Jul 2021
Cited by 5 | Viewed by 2297
Abstract
Forest fire monitoring is very much needed for protecting the forest from any kind of disaster or anomaly leading to the destruction of the forest. Now, with the advent of Internet of Things (IoT), a good amount of research has been done on [...] Read more.
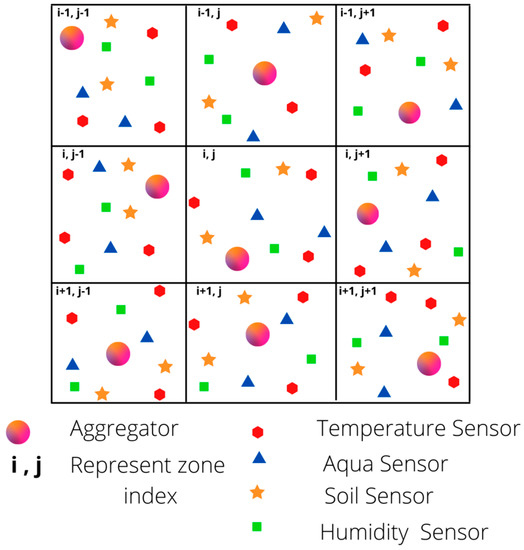
Forest fire monitoring is very much needed for protecting the forest from any kind of disaster or anomaly leading to the destruction of the forest. Now, with the advent of Internet of Things (IoT), a good amount of research has been done on energy consumption, coverage, and other issues. These works did not focus on forest fire management. The IoT-enabled environment is made up of low power lossy networks (LLNs). For improving the performance of routing protocol in forest fire management, energy-efficient routing protocol for low power lossy networks (E-RPL) was developed where residual power was used as an objective function towards calculating the rank of the parent node to form the destination-oriented directed acyclic graph (DODAG). The challenge in E-RPL is the scalability of the network resulting in a long end-to-end delay and less packet delivery. Additionally, the energy of sensor nodes increased with different transmission range. So, for obviating the above-mentioned drawbacks in E-RPL, compressed data aggregation and energy-based RPL routing (CAA-ERPL) is proposed. The CAA-ERPL is compared with E-RPL, and the performance is analyzed resulting in reduced packet transfer delay, less energy consumption, and increased packet delivery ratio for 10, 20, 30, 40, and 50 nodes. This has been evaluated using a Contiki Cooja simulator. Full article
Show Figures

Figure 1

21 pages, 9812 KiB  
Article
CMPC: An Innovative Lidar-Based Method to Estimate Tree Canopy Meshing-Profile Volumes for Orchard Target-Oriented Spray
by Chenchen Gu, Changyuan Zhai, Xiu Wang and Songlin Wang
Sensors 2021, 21(12), 4252; https://doi.org/10.3390/s21124252 - 21 Jun 2021
Cited by 16 | Viewed by 2699
Abstract
Canopy characterization detection is essential for target-oriented spray, which minimizes pesticide residues in fruits, pesticide wastage, and pollution. In this study, a novel canopy meshing-profile characterization (CMPC) method based on light detection and ranging (LiDAR)point-cloud data was designed for high-precision canopy volume calculations. [...] Read more.
Canopy characterization detection is essential for target-oriented spray, which minimizes pesticide residues in fruits, pesticide wastage, and pollution. In this study, a novel canopy meshing-profile characterization (CMPC) method based on light detection and ranging (LiDAR)point-cloud data was designed for high-precision canopy volume calculations. First, the accuracy and viability of this method were tested using a simulated canopy. The results show that the CMPC method can accurately characterize the 3D profiles of the simulated canopy. These simulated canopy profiles were similar to those obtained from manual measurements, and the measured canopy volume achieved an accuracy of 93.3%. Second, the feasibility of the method was verified by a field experiment where the canopy 3D stereogram and cross-sectional profiles were obtained via CMPC. The results show that the 3D stereogram exhibited a high degree of similarity with the tree canopy, although there were some differences at the edges, where the canopy was sparse. The CMPC-derived cross-sectional profiles matched the manually measured results well. The CMPC method achieved an accuracy of 96.3% when the tree canopy was detected by LiDAR at a moving speed of 1.2 m/s. The accuracy of the LiDAR system was virtually unchanged when the moving speeds was reduced to 1 m/s. No detection lag was observed when comparing the start and end positions of the cross-section. Different CMPC grid sizes were also evaluated. Small grid sizes (0.01 m × 0.01 m and 0.025 m × 0.025 m) were suitable for characterizing the finer details of a canopy, whereas grid sizes of 0.1 m × 0.1 m or larger can be used for characterizing its overall profile and volume. The results of this study can be used as a technical reference for the development of a LiDAR-based target-oriented spray system. Full article
Show Figures

Figure 1

17 pages, 4194 KiB  
Article
Electrical Capacitance Characteristics of Wood Chips at Low Frequency Ranges: A Cheap Tool for Quality Assessment
by Jakub Lev, Václav Křepčík, Egidijus Šarauskis and František Kumhála
Sensors 2021, 21(10), 3494; https://doi.org/10.3390/s21103494 - 17 May 2021
Cited by 2 | Viewed by 2290
Abstract
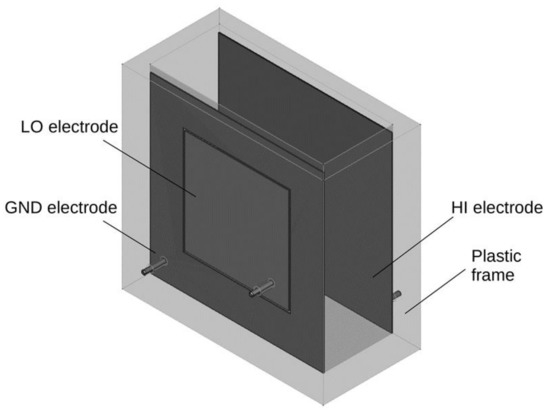
Moisture content is one of the most important parameters related to the quality of wood chips that affects both the calorific and economic value of fuel chips. For industrial applications, moisture content needs to be detected quickly. For this purpose, various indirect moisture [...] Read more.
Moisture content is one of the most important parameters related to the quality of wood chips that affects both the calorific and economic value of fuel chips. For industrial applications, moisture content needs to be detected quickly. For this purpose, various indirect moisture content measurement methods (e.g., capacitance, NIR, microwave, ECT, X-ray CT, and nuclear MR) have been investigated with different results in the past. Nevertheless, determining wood chip moisture content in real time is still a challenge. The main aim of this article was therefore to analyze the dielectric properties of wood chips at low frequencies (10 kHz–5 MHz) and to examine the possibility of using these properties to predict wood chip moisture content and porosity. A container-type probe was developed for this purpose. The electrical capacitance and dissipation factor of wood chips with different moisture content was measured by an LCR meter at 10 kHz, 50 kHz, 100 kHz, 500 kHz, 1 MHz, and 5 MHz frequencies. Wood chip porosity was also measured using a gas displacement method. Linear models for moisture content and porosity prediction were determined by backward stepwise linear regression. Mathematical model was developed to better understand the physical relationships between moisture content, porosity, and electrical capacitance. These models were able to predict the moisture content of observed quantities of wood chips with the required accuracy (R2 = 0.9–0.99). This finding opens another path to measuring the moisture content and porosity of wood chips in a relatively cheap and fast way and with adequate precision. In addition, principal component analysis showed that it is also possible to distinguish between individual wood chip fraction sizes from the information obtained. Full article
Show Figures

Figure 1

13 pages, 7001 KiB  
Article
Low-Cost Fluorescence Sensor for Ammonia Measurement in Livestock Houses
by Jesper Nørlem Kamp, Lise Lotte Sørensen, Michael Jørgen Hansen, Tavs Nyord and Anders Feilberg
Sensors 2021, 21(5), 1701; https://doi.org/10.3390/s21051701 - 02 Mar 2021
Cited by 6 | Viewed by 2960
Abstract
Measurements of ammonia with inexpensive and reliable sensors are necessary to obtain information about e.g., ammonia emissions. The concentration information is needed for mitigation technologies and documentation of existing technologies in agriculture. A flow-based fluorescence sensor to measure ammonia gas was developed. The [...] Read more.
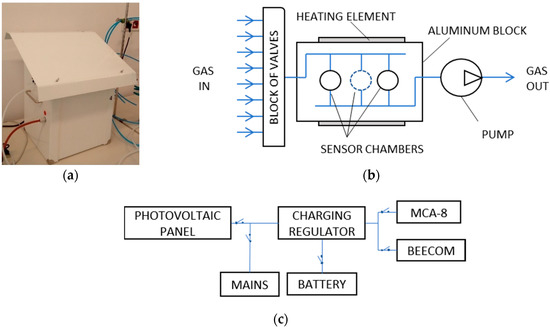
Measurements of ammonia with inexpensive and reliable sensors are necessary to obtain information about e.g., ammonia emissions. The concentration information is needed for mitigation technologies and documentation of existing technologies in agriculture. A flow-based fluorescence sensor to measure ammonia gas was developed. The automated sensor is robust, flexible and made from inexpensive components. Ammonia is transferred to water in a miniaturized scrubber with high transfer efficiency (>99%) and reacts with o-phthalaldehyde and sulfite (pH 11) to form a fluorescent adduct, which is detected with a photodiode. Laboratory calibrations with standard gas show good linearity over a dynamic range from 0.03 to 14 ppm, and the detection limit of the analyzer based on three-times the standard deviation of blank noise was approximately 10 ppb. The sampling frequency is 0.1 to 10 s, which can easily be changed through serial commands along with UV LED current and filter length. Parallel measurements with a cavity ring-down spectroscopy analyzer in a pig house show good agreement (R2 = 0.99). The fluorescence sensor has the potential to provide ammonia gas measurements in an agricultural environment with high time resolution and linearity over a broad range of concentrations. Full article
Show Figures

Figure 1

2020

Jump to: 2024, 2023, 2022, 2021, 2019, 2018, 2017, 2016, 2015, 2014

23 pages, 1602 KiB  
Review
Review of Novel and Emerging Proximal Soil Moisture Sensors for Use in Agriculture
by Marcus Hardie
Sensors 2020, 20(23), 6934; https://doi.org/10.3390/s20236934 - 04 Dec 2020
Cited by 50 | Viewed by 8250
Abstract
The measurement of soil moisture in agriculture is currently dominated by a small number of sensors, the use of which is greatly limited by their small sampling volume, high cost, need for close soil–sensor contact, and poor performance in saline, vertic and stony [...] Read more.
The measurement of soil moisture in agriculture is currently dominated by a small number of sensors, the use of which is greatly limited by their small sampling volume, high cost, need for close soil–sensor contact, and poor performance in saline, vertic and stony soils. This review was undertaken to explore the plethora of novel and emerging soil moisture sensors, and evaluate their potential use in agriculture. The review found that improvements to existing techniques over the last two decades are limited, and largely restricted to frequency domain reflectometry approaches. However, a broad range of new, novel and emerging means of measuring soil moisture were identified including, actively heated fiber optics (AHFO), high capacity tensiometers, paired acoustic / radio / seismic transceiver approaches, microwave-based approaches, radio frequency identification (RFID), hydrogels and seismoelectric approaches. Excitement over this range of potential new technologies is however tempered by the observation that most of these technologies are at early stages of development, and that few of these techniques have been adequately evaluated in situ agricultural soils. Full article
Show Figures

Figure 1

14 pages, 3873 KiB  
Article
Precision Landing Test and Simulation of the Agricultural UAV on Apron
by Yangyang Guo, Jiaqian Guo, Chang Liu, Hongting Xiong, Lilong Chai and Dongjian He
Sensors 2020, 20(12), 3369; https://doi.org/10.3390/s20123369 - 14 Jun 2020
Cited by 15 | Viewed by 3622
Abstract
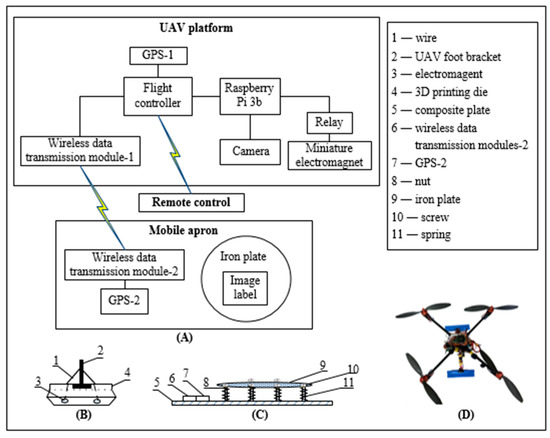
Unmanned aerial vehicle (UAV) has been used to assist agricultural production. Precision landing control of UAV is critical for application of it in some specific areas such as greenhouses or livestock/poultry houses. For controlling UAV landing on a fixed or mobile apron/platform accurately, [...] Read more.
Unmanned aerial vehicle (UAV) has been used to assist agricultural production. Precision landing control of UAV is critical for application of it in some specific areas such as greenhouses or livestock/poultry houses. For controlling UAV landing on a fixed or mobile apron/platform accurately, this study proposed an automatic method and tested it under three scenarios: (1) UAV landing at high operating altitude based on the GPS signal of the mobile apron; (2) UAV landing at low operating altitude based on the image recognition on the mobile apron; and (3) UAV landing progress control based on the fixed landing device and image detection to achieve a stable landing action. To verify the effectiveness of the proposed control method, apron at both stationary and mobile (e.g., 3 km/h moving speed) statuses were tested. Besides, a simulation was conducted for the UAV landing on a fixed apron by using a commercial poultry house as a model (135 L × 15 W × 3 H m). Results show that the average landing errors in high altitude and low altitude can be controlled within 6.78 cm and 13.29 cm, respectively. For the poultry house simulation, the landing errors were 6.22 ± 2.59 cm, 6.79 ± 3.26 cm, and 7.14 ± 2.41cm at the running speed of 2 km/h, 3 km/h, and 4 km/h, respectively. This study provides the basis for applying the UAV in agricultural facilities such as poultry or animal houses where requires a stricter landing control than open fields. Full article
Show Figures

Figure 1

21 pages, 10726 KiB  
Article
A “Global–Local” Visual Servo System for Picking Manipulators
by Yinggang Shi, Wei Zhang, Zhiwen Li, Yong Wang, Li Liu and Yongjie Cui
Sensors 2020, 20(12), 3366; https://doi.org/10.3390/s20123366 - 14 Jun 2020
Cited by 2 | Viewed by 2826
Abstract
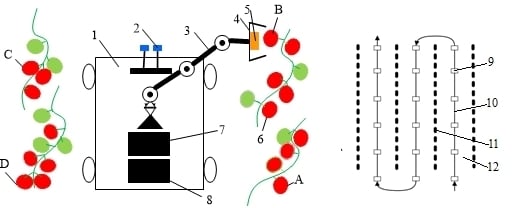
During the process of automated crop picking, the two hand–eye coordination operation systems, namely “eye to hand” and “eye in hand” have their respective advantages and disadvantages. It is challenging to simultaneously consider both the operational accuracy and the speed of a manipulator. [...] Read more.
During the process of automated crop picking, the two hand–eye coordination operation systems, namely “eye to hand” and “eye in hand” have their respective advantages and disadvantages. It is challenging to simultaneously consider both the operational accuracy and the speed of a manipulator. In response to this problem, this study constructs a “global–local” visual servo picking system based on a prototype of a picking robot to provide a global field of vision (through binocular vision) and carry out the picking operation using the monocular visual servo. Using tomato picking as an example, experiments were conducted to obtain the accuracies of judgment and range of fruit maturity, and the scenario of fruit-bearing was simulated over an area where the operation was ongoing to examine the rate of success of the system in terms of continuous fruit picking. The results show that the global–local visual servo picking system had an average accuracy of correctly judging fruit maturity of 92.8%, average error of fruit distance measurement in the range 0.485 cm, average time for continuous fruit picking of 20.06 s, and average success rate of picking of 92.45%. Full article
Show Figures

Graphical abstract

13 pages, 10615 KiB  
Article
A Machine Vision-Based Method for Monitoring Broiler Chicken Floor Distribution
by Yangyang Guo, Lilong Chai, Samuel E. Aggrey, Adelumola Oladeinde, Jasmine Johnson and Gregory Zock
Sensors 2020, 20(11), 3179; https://doi.org/10.3390/s20113179 - 03 Jun 2020
Cited by 43 | Viewed by 8485
Abstract
The proper spatial distribution of chickens is an indication of a healthy flock. Routine inspections of broiler chicken floor distribution are done manually in commercial grow-out houses every day, which is labor intensive and time consuming. This task requires an efficient and automatic [...] Read more.
The proper spatial distribution of chickens is an indication of a healthy flock. Routine inspections of broiler chicken floor distribution are done manually in commercial grow-out houses every day, which is labor intensive and time consuming. This task requires an efficient and automatic system that can monitor the chicken’s floor distributions. In the current study, a machine vision-based method was developed and tested in an experimental broiler house. For the new method to recognize bird distribution in the images, the pen floor was virtually defined/divided into drinking, feeding, and rest/exercise zones. As broiler chickens grew, the images collected each day were analyzed separately to avoid biases caused by changes of body weight/size over time. About 7000 chicken areas/profiles were extracted from images collected from 18 to 35 days of age to build a BP neural network model for floor distribution analysis, and another 200 images were used to validate the model. The results showed that the identification accuracies of bird distribution in the drinking and feeding zones were 0.9419 and 0.9544, respectively. The correlation coefficient (R), mean square error (MSE), and mean absolute error (MAE) of the BP model were 0.996, 0.038, and 0.178, respectively, in our analysis of broiler distribution. Missed detections were mainly caused by interference with the equipment (e.g., the feeder hanging chain and water line); studies are ongoing to address these issues. This study provides the basis for devising a real-time evaluation tool to detect broiler chicken floor distribution and behavior in commercial facilities. Full article
Show Figures

Figure 1

18 pages, 4073 KiB  
Article
Hyperspectral Classification of Cyperus esculentus Clones and Morphologically Similar Weeds
by Marlies Lauwers, Benny De Cauwer, David Nuyttens, Simon R. Cool and Jan G. Pieters
Sensors 2020, 20(9), 2504; https://doi.org/10.3390/s20092504 - 28 Apr 2020
Cited by 11 | Viewed by 3135
Abstract
Cyperus esculentus (yellow nutsedge) is one of the world’s worst weeds as it can cause great damage to crops and crop production. To eradicate C. esculentus, early detection is key—a challenging task as it is often confused with other Cyperaceae and displays wide [...] Read more.
Cyperus esculentus (yellow nutsedge) is one of the world’s worst weeds as it can cause great damage to crops and crop production. To eradicate C. esculentus, early detection is key—a challenging task as it is often confused with other Cyperaceae and displays wide genetic variability. In this study, the objective was to classify C. esculentus clones and morphologically similar weeds. Hyperspectral reflectance between 500 and 800 nm was tested as a measure to discriminate between (I) C. esculentus and morphologically similar Cyperaceae weeds, and between (II) different clonal populations of C. esculentus using three classification models: random forest (RF), regularized logistic regression (RLR) and partial least squares–discriminant analysis (PLS–DA). RLR performed better than RF and PLS–DA, and was able to adequately classify the samples. The possibility of creating an affordable multispectral sensing tool, for precise in-field recognition of C. esculentus plants based on fewer spectral bands, was tested. Results of this study were compared against simulated results from a commercially available multispectral camera with four spectral bands. The model created with customized bands performed almost equally well as the original PLS–DA or RLR model, and much better than the model describing multispectral image data from a commercially available camera. These results open up the opportunity to develop a dedicated robust tool for C. esculentus recognition based on four spectral bands and an appropriate classification model. Full article
Show Figures

Figure 1

27 pages, 12191 KiB  
Article
The Comparison of Different Types of Heat Accumulators and Benefits of Their Use in Horticulture
by Sławomir Kurpaska, Jarosław Knaga, Hubert Latała, Michał Cupiał, Paweł Konopacki and Ryszard Hołownicki
Sensors 2020, 20(5), 1417; https://doi.org/10.3390/s20051417 - 05 Mar 2020
Cited by 5 | Viewed by 3546
Abstract
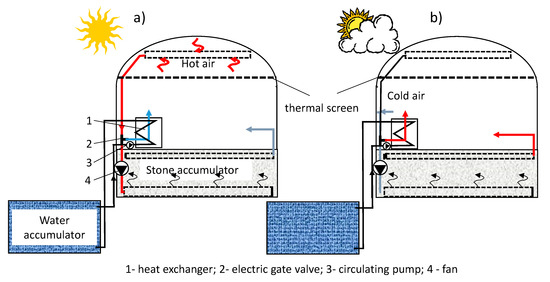
This paper presents the results of the analysis of thermal issues and energy efficiency of three types of accumulators; namely stone-bed; water and phase change. Research experiments were carried out during April–October 2013 in a standard commercial semi-cylindrical high plastic tunnel with tomato [...] Read more.
This paper presents the results of the analysis of thermal issues and energy efficiency of three types of accumulators; namely stone-bed; water and phase change. Research experiments were carried out during April–October 2013 in a standard commercial semi-cylindrical high plastic tunnel with tomato cultivation of 150 m2. A stone-bed accumulator; with an area of almost 75 m2 was installed in the tunnel below ground level; while a water accumulator with a volume of 4 m3 was installed outside the tunnel. A phase change material (PCM) accumulator, with a volume of 1 m3 containing paraffin, was located inside the tunnel. The heat storage capacity of the tested accumulators and the energy efficiency of the process were determined based on the analyses of the 392 stone-bed charging and discharging cycles, the 62 water accumulator charging cycles and close to 40 PCM accumulator charging and discharging cycles. Dependencies in the form of easily measurable parameters; have been established to determine the amount of stored heat; as well as the conditions for which the effectiveness of these processes reaches the highest value. The presented analysis falls under the pro-ecological scope of replacing fossil fuels with renewable energy. As a result of the analysis; it was found that; in the case of a stone-bed; such an accumulator shows higher efficiency at lower parameters; that is, temperature difference and solar radiation intensity. In turn; a higher temperature difference and a higher value of solar radiation intensity are required for the water accumulator. The energy storage efficiency of the PCM accumulator is emphatically smaller and not comparable with either the stone-bed or the water accumulator. Full article
Show Figures

Figure 1

2019

Jump to: 2024, 2023, 2022, 2021, 2020, 2018, 2017, 2016, 2015, 2014

17 pages, 1753 KiB  
Article
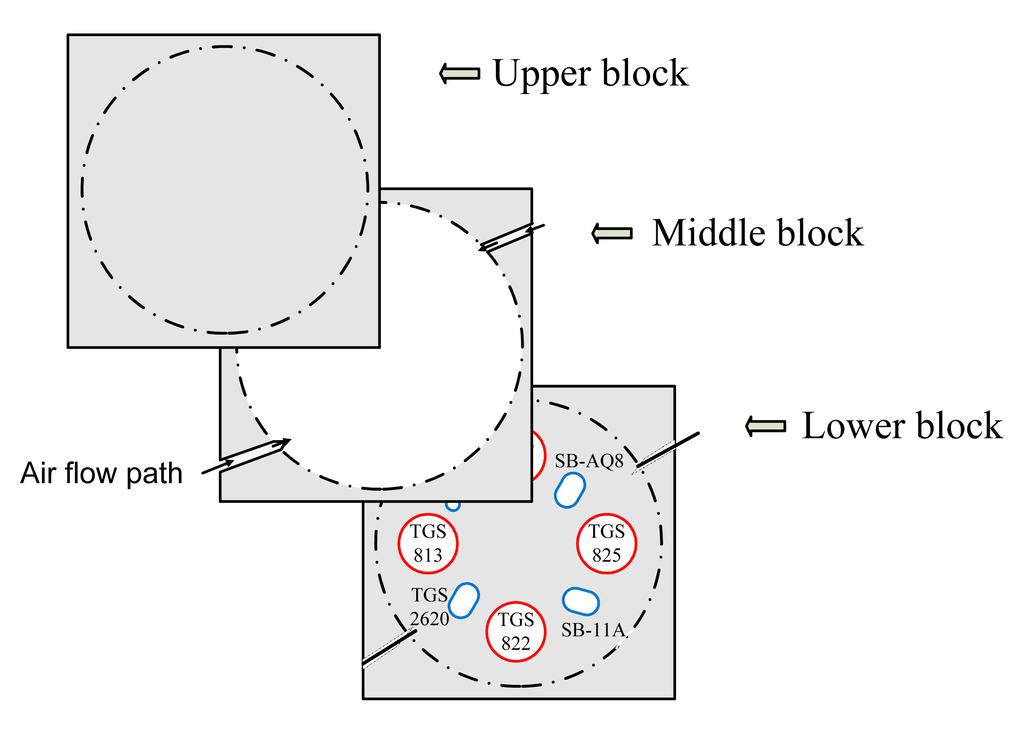
Gas Sensor Array and Classifiers as a Means of Varroosis Detection
by Andrzej Szczurek, Monika Maciejewska, Beata Bąk, Jakub Wilk, Jerzy Wilde and Maciej Siuda
Sensors 2020, 20(1), 117; https://doi.org/10.3390/s20010117 - 23 Dec 2019
Cited by 19 | Viewed by 3421
Abstract
The study focused on a method of detection for bee colony infestation with the Varroa destructor mite, based on the measurements of the chemical properties of beehive air. The efficient detection of varroosis was demonstrated. This method of detection is based on a [...] Read more.
The study focused on a method of detection for bee colony infestation with the Varroa destructor mite, based on the measurements of the chemical properties of beehive air. The efficient detection of varroosis was demonstrated. This method of detection is based on a semiconductor gas sensor array and classification module. The efficiency of detection was characterized by the true positive rate (TPR) and true negative rate (TNR). Several factors influencing the performance of the method were determined. They were: (1) the number and kind of sensors, (2) the classifier, (3) the group of bee colonies, and (4) the balance of the classification data set. Gas sensor array outperformed single sensors. It should include at least four sensors. Better results of detection were attained with a support vector machine (SVM) as compared with the k-nearest neighbors (k-NN) algorithm. The selection of bee colonies was important. TPR and TNR differed by several percent for the two examined groups of colonies. The balance of the classification data was crucial. The average classification results were, for the balanced data set: TPR = 0.93 and TNR = 0.95, and for the imbalanced data set: TP = 0.95 and FP = 0.53. The selection of bee colonies and the balance of classification data set have to be controlled in order to attain high performance of the proposed detection method. Full article
Show Figures

Figure 1

17 pages, 4586 KiB  
Article
Monitoring Water-Soil Dynamics and Tree Survival Using Soil Sensors under a Big Data Approach
by Adrián Pascual, Rafael Rivera, Rodrigo Gómez and Susana Domínguez-Lerena
Sensors 2019, 19(21), 4634; https://doi.org/10.3390/s19214634 - 24 Oct 2019
Cited by 4 | Viewed by 3357
Abstract
The high importance of green urban planning to ensure access to green areas requires modern and multi-source decision-support tools. The integration of remote sensing data and sensor developments can contribute to the improvement of decision-making in urban forestry. This study proposes a novel [...] Read more.
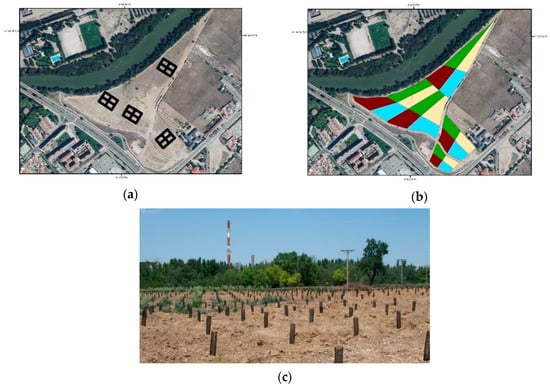
The high importance of green urban planning to ensure access to green areas requires modern and multi-source decision-support tools. The integration of remote sensing data and sensor developments can contribute to the improvement of decision-making in urban forestry. This study proposes a novel big data-based methodology that combines real-time information from soil sensors and climate data to monitor the establishment of a new urban forest in semi-arid conditions. Water-soil dynamics and their implication in tree survival were analyzed considering the application of different treatment restoration techniques oriented to facilitate the recovery of tree and shrub vegetation in the degraded area. The synchronized data-capturing scheme made it possible to evaluate hourly, daily, and seasonal changes in soil-water dynamics. The spatial variation of soil-water dynamics was captured by the sensors and it highly contributed to the explanation of the observed ground measurements on tree survival. The methodology showed how the efficiency of treatments varied depending on species selection and across the experimental design. The use of retainers for improving soil moisture content and adjusting tree-watering needs was, on average, the most successful restoration technique. The results and the applied calibration of the sensor technology highlighted the random behavior of water-soil dynamics despite the small-scale scope of the experiment. The results showed the potential of this methodology to assess watering needs and adjust watering resources to the vegetation status using real-time atmospheric and soil data. Full article
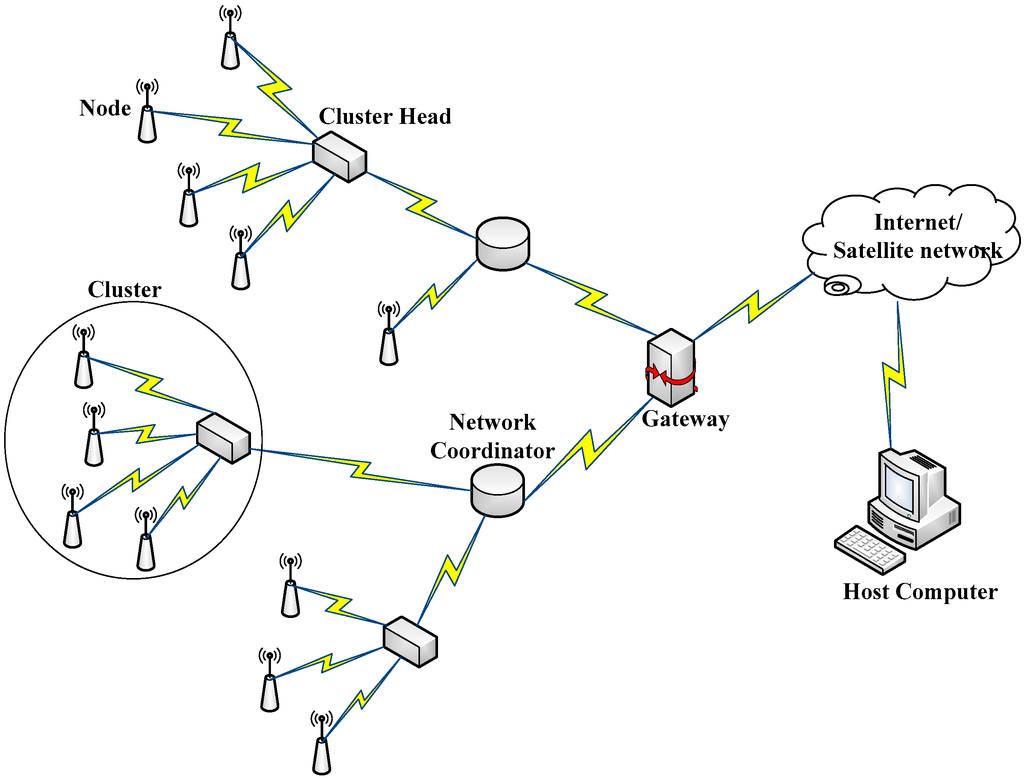
Show Figures

Figure 1

18 pages, 2270 KiB  
Article
On the Accuracy of Factory-Calibrated Low-Cost Soil Water Content Sensors
by Jesús María Domínguez-Niño, Heye Reemt Bogena, Johan Alexander Huisman, Bernd Schilling and Jaume Casadesús
Sensors 2019, 19(14), 3101; https://doi.org/10.3390/s19143101 - 13 Jul 2019
Cited by 30 | Viewed by 4555
Abstract
Soil water content (SWC) monitoring is often used to optimize agricultural irrigation. Commonly, capacitance sensors are used for this task. However, the factory calibrations have been often criticized for their limited accuracy. The aim of this paper is to test the degree of [...] Read more.
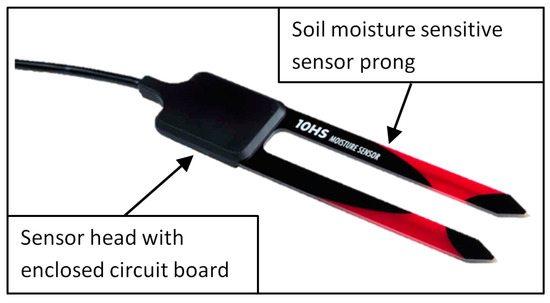
Soil water content (SWC) monitoring is often used to optimize agricultural irrigation. Commonly, capacitance sensors are used for this task. However, the factory calibrations have been often criticized for their limited accuracy. The aim of this paper is to test the degree of improvement of various sensor- and soil-specific calibration options compared to factory calibrations by taking the 10HS sensor as an example. To this end, a two-step sensor calibration was carried out. In the first step, the sensor response was related to dielectric permittivity using calibration in media with well-defined permittivity. The second step involved the establishment of a site-specific relationship between permittivity and soil water content using undisturbed soil samples and time domain reflectometry (TDR) measurements. Our results showed that a model, which considered the mean porosity and a fitted dielectric permittivity of the solid phase for each soil and depth, provided the best fit between bulk permittivity and SWC. Most importantly, it was found that the two-step calibration approach (RMSE: 1.03 vol.%) provided more accurate SWC estimates compared to the factory calibration (RMSE: 5.33 vol.%). Finally, we used these calibrations on data from drip-irrigated almond and apple orchards and compared the factory calibration with our two-step calibration approach. Full article
Show Figures

Figure 1

23 pages, 8912 KiB  
Article
Design of Plant Protection UAV Variable Spray System Based on Neural Networks
by Sheng Wen, Quanyong Zhang, Xuanchun Yin, Yubin Lan, Jiantao Zhang and Yufeng Ge
Sensors 2019, 19(5), 1112; https://doi.org/10.3390/s19051112 - 05 Mar 2019
Cited by 32 | Viewed by 6712
Abstract
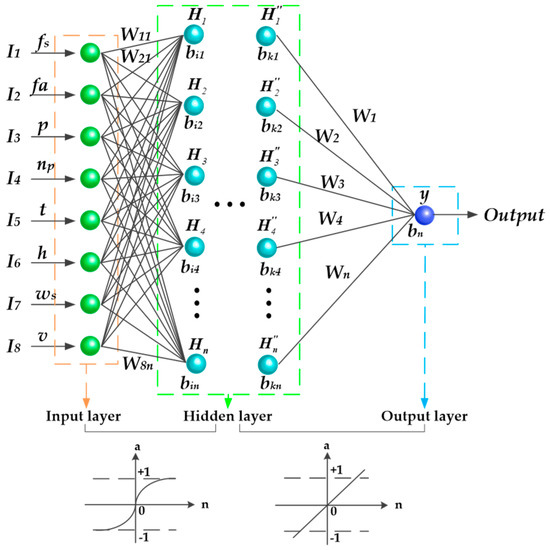
Recently, unmanned aerial vehicles (UAVs) have rapidly emerged as a new technology in the fields of plant protection and pest control in China. Based on existing variable spray research, a plant protection UAV variable spray system integrating neural network based decision making is [...] Read more.
Recently, unmanned aerial vehicles (UAVs) have rapidly emerged as a new technology in the fields of plant protection and pest control in China. Based on existing variable spray research, a plant protection UAV variable spray system integrating neural network based decision making is designed. Using the existing data on plant protection UAV operations, combined with artificial neural network (ANN) technology, an error back propagation (BP) neural network model between the factors affecting droplet deposition is trained. The factors affecting droplet deposition include ambient temperature, ambient humidity, wind speed, flight speed, flight altitude, propeller pitch, nozzles pitch and prescription value. Subsequently, the BP neural network model is combined with variable rate spray control for plant protection UAVs, and real-time information is collected by multi-sensor. The deposition rate is determined by the neural network model, and the flow rate of the spray system is regulated according to the predicted deposition amount. The amount of droplet deposition can meet the prescription requirement. The results show that the training variance of the ANN is 0.003, and thus, the model is stable and reliable. The outdoor tests show that the error between the predicted droplet deposition and actual droplet deposition is less than 20%. The ratio of droplet deposition to prescription value in each unit is approximately equal, and a variable spray operation under different conditions is realized. Full article
Show Figures

Figure 1

15 pages, 6055 KiB  
Article
Guava Detection and Pose Estimation Using a Low-Cost RGB-D Sensor in the Field
by Guichao Lin, Yunchao Tang, Xiangjun Zou, Juntao Xiong and Jinhui Li
Sensors 2019, 19(2), 428; https://doi.org/10.3390/s19020428 - 21 Jan 2019
Cited by 101 | Viewed by 8769
Abstract
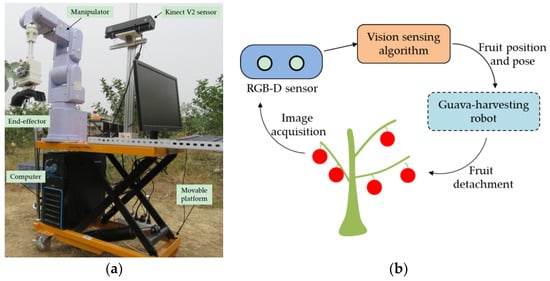
Fruit detection in real outdoor conditions is necessary for automatic guava harvesting, and the branch-dependent pose of fruits is also crucial to guide a robot to approach and detach the target fruit without colliding with its mother branch. To conduct automatic, collision-free picking, [...] Read more.
Fruit detection in real outdoor conditions is necessary for automatic guava harvesting, and the branch-dependent pose of fruits is also crucial to guide a robot to approach and detach the target fruit without colliding with its mother branch. To conduct automatic, collision-free picking, this study investigates a fruit detection and pose estimation method by using a low-cost red–green–blue–depth (RGB-D) sensor. A state-of-the-art fully convolutional network is first deployed to segment the RGB image to output a fruit and branch binary map. Based on the fruit binary map and RGB-D depth image, Euclidean clustering is then applied to group the point cloud into a set of individual fruits. Next, a multiple three-dimensional (3D) line-segments detection method is developed to reconstruct the segmented branches. Finally, the 3D pose of the fruit is estimated using its center position and nearest branch information. A dataset was acquired in an outdoor orchard to evaluate the performance of the proposed method. Quantitative experiments showed that the precision and recall of guava fruit detection were 0.983 and 0.948, respectively; the 3D pose error was 23.43° ± 14.18°; and the execution time per fruit was 0.565 s. The results demonstrate that the developed method can be applied to a guava-harvesting robot. Full article
Show Figures

Figure 1

16 pages, 6561 KiB  
Article
Intelligent Spectroscopy System Used for Physicochemical Variables Estimation in Sugar Cane Soils
by Ofelia Landeta-Escamilla, Oscar Sandoval-Gonzalez, Albino Martínez-Sibaja, José de Jesús Agustín Flores-Cuautle, Rubén Posada-Gómez and Alejandro Alvarado-Lassman
Sensors 2019, 19(2), 240; https://doi.org/10.3390/s19020240 - 10 Jan 2019
Viewed by 3468
Abstract
The current condition of soils is a major area of interest due to the lack of certainty in their physicochemical properties, which can guarantee the quality and the production of a specific crop. Additionally, methodologies to improve land management must be implemented in [...] Read more.
The current condition of soils is a major area of interest due to the lack of certainty in their physicochemical properties, which can guarantee the quality and the production of a specific crop. Additionally, methodologies to improve land management must be implemented in order to address the consequences of many environmental issues. To date, many techniques have been implemented to improve the accuracy—and more recently the speed—of analysis, in order to obtain results while in the field. Among those, Near Infrared (NIR) spectroscopy has been widely used to achieve the objectives mentioned above. Nevertheless, it requires particular knowledge, and the cost might be high for farmers who own the fields and crops. Thus, the present work uses a system that implements capacitance spectroscopy plus artificial intelligence algorithms to estimate the physicochemical variables of soil used to grow sugar cane. The device uses the frequency response of the soil to determine its magnitude and phase values, which are used by artificial intelligence algorithms that are capable of estimating the soil properties. The obtained results show errors below 8% in the estimation of the variables compared to the analysis results of the soil in laboratories. Additionally, it is a portable system, with low cost, that is easy to use and could be implemented to test other types of soils after evaluating the necessary algorithms or proposing alternatives to restore soil properties. Full article
Show Figures

Figure 1

2018

Jump to: 2024, 2023, 2022, 2021, 2020, 2019, 2017, 2016, 2015, 2014

11 pages, 2340 KiB  
Article
A Novel Dielectric Tomography System for In-Situ Tracking Three-Dimensional Soil Water Dynamics
by Song Yu, Chao Chen, Qiang Xu, Qiang Cheng, Xiaofei Yan, Zhou Yu, Yihan Ma and Haonan Chen
Sensors 2018, 18(9), 2880; https://doi.org/10.3390/s18092880 - 31 Aug 2018
Cited by 1 | Viewed by 3300
Abstract
In this study, we developed a novel dielectric tomography system for in-situ tracking three-dimensional (3D) soil water dynamics. The system was designed to control a single dielectric tube sensor that automatically lowered in a PVC tube array installed in-situ to determine the water [...] Read more.
In this study, we developed a novel dielectric tomography system for in-situ tracking three-dimensional (3D) soil water dynamics. The system was designed to control a single dielectric tube sensor that automatically lowered in a PVC tube array installed in-situ to determine the water content of a soil profile, which eliminated probe-to-probe uncertainties and labor costs. Two tests for evaluating the novel system were conducted (i) to analyze and correct the positional error of the probe due to out-of-step errors of stepper motors, and (ii) to track and visualize 3D soil water temporal variations in a soil tank with heterogenetic bulk densities and initial water contents under drip irrigation. The results show that the positioning correcting algorithm combined with starting point alignment can minimize the positioning error of the probe during the 3D tomography. The single drip emitter test illustrated spatial and temporal variations of soil water content due to heterogeneous soil properties in vertical and horizontal directions around the access tube array. Based on these data, 3D distributions of soil water dynamics were visualized. The developed tomography system has potential application to be extended to the local scale in a greenhouse or the large scale in an agricultural field. Future research should explore the performance for agricultural crop irrigation or for modeling and validating soil water flow or hydrological process under either steady state or non-steady state condition. Full article
Show Figures

Figure 1

20 pages, 6331 KiB  
Article
Postharvest Monitoring of Tomato Ripening Using the Dynamic Laser Speckle
by Piotr Mariusz Pieczywek, Małgorzata Nowacka, Magdalena Dadan, Artur Wiktor, Katarzyna Rybak, Dorota Witrowa-Rajchert and Artur Zdunek
Sensors 2018, 18(4), 1093; https://doi.org/10.3390/s18041093 - 04 Apr 2018
Cited by 16 | Viewed by 6104
Abstract
The dynamic laser speckle (biospeckle) method was tested as a potential tool for the assessment and monitoring of the maturity stage of tomatoes. Two tomato cultivars—Admiro and Starbuck—were tested. The process of climacteric maturation of tomatoes was monitored during a shelf life storage [...] Read more.
The dynamic laser speckle (biospeckle) method was tested as a potential tool for the assessment and monitoring of the maturity stage of tomatoes. Two tomato cultivars—Admiro and Starbuck—were tested. The process of climacteric maturation of tomatoes was monitored during a shelf life storage experiment. The biospeckle phenomena were captured using 640 nm and 830 nm laser light wavelength, and analysed using two activity descriptors based on biospeckle pattern decorrelation—C4 and ε. The well-established optical parameters of tomatoes skin were used as a reference method (luminosity, a*/b*, chroma). Both methods were tested with respect to their prediction capabilities of the maturity and destructive indicators of tomatoes—firmness, chlorophyll and carotenoids content. The statistical significance of the tested relationships were investigated by means of linear regression models. The climacteric maturation of tomato fruit was associated with an increase in biospckle activity. Compared to the 830 nm laser wavelength the biospeckle activity measured at 640 nm enabled more accurate predictions of firmness, chlorophyll and carotenoids content. At 640 nm laser wavelength both activity descriptors (C4 and ε) provided similar results, while at 830 nm the ε showed slightly better performance. The linear regression models showed that biospeckle activity descriptors had a higher correlation with chlorophyll and carotenoids content than the a*/b* ratio and luminosity. The results for chroma were comparable with the results for both biospeckle activity indicators. The biospeckle method showed very good results in terms of maturation monitoring and the prediction of the maturity indices of tomatoes, proving the possibility of practical implementation of this method for the determination of the maturity stage of tomatoes. Full article
Show Figures

Figure 1

23 pages, 10601 KiB  
Article
Automatic Non-Destructive Growth Measurement of Leafy Vegetables Based on Kinect
by Yang Hu, Le Wang, Lirong Xiang, Qian Wu and Huanyu Jiang
Sensors 2018, 18(3), 806; https://doi.org/10.3390/s18030806 - 07 Mar 2018
Cited by 67 | Viewed by 9485
Abstract
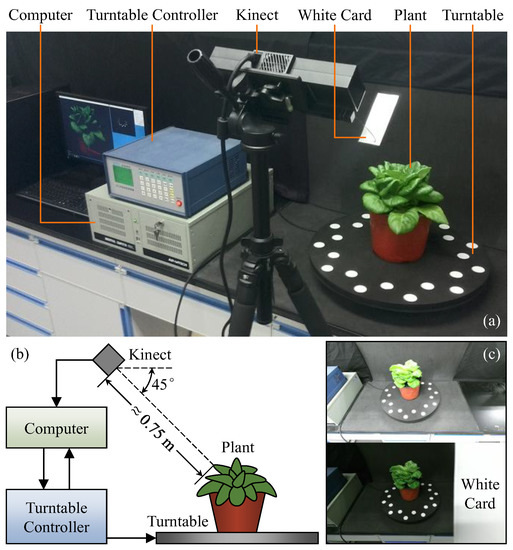
Non-destructive plant growth measurement is essential for plant growth and health research. As a 3D sensor, Kinect v2 has huge potentials in agriculture applications, benefited from its low price and strong robustness. The paper proposes a Kinect-based automatic system for non-destructive growth measurement [...] Read more.
Non-destructive plant growth measurement is essential for plant growth and health research. As a 3D sensor, Kinect v2 has huge potentials in agriculture applications, benefited from its low price and strong robustness. The paper proposes a Kinect-based automatic system for non-destructive growth measurement of leafy vegetables. The system used a turntable to acquire multi-view point clouds of the measured plant. Then a series of suitable algorithms were applied to obtain a fine 3D reconstruction for the plant, while measuring the key growth parameters including relative/absolute height, total/projected leaf area and volume. In experiment, 63 pots of lettuce in different growth stages were measured. The result shows that the Kinect-measured height and projected area have fine linear relationship with reference measurements. While the measured total area and volume both follow power law distributions with reference data. All these data have shown good fitting goodness (R2 = 0.9457–0.9914). In the study of biomass correlations, the Kinect-measured volume was found to have a good power law relationship (R2 = 0.9281) with fresh weight. In addition, the system practicality was validated by performance and robustness analysis. Full article
Show Figures

Figure 1

2017

Jump to: 2024, 2023, 2022, 2021, 2020, 2019, 2018, 2016, 2015, 2014

3097 KiB  
Article
The Use of Terrestrial Laser Scanning for Determining the Driver’s Field of Vision
by Tomáš Zemánek, Miloš Cibulka, Petr Pelikán and Jaromír Skoupil
Sensors 2017, 17(9), 2098; https://doi.org/10.3390/s17092098 - 13 Sep 2017
Cited by 4 | Viewed by 5587
Abstract
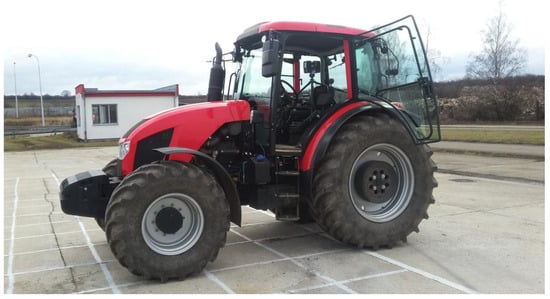
Terrestrial laser scanning (TLS) is currently one of the most progressively developed methods in obtaining information about objects and phenomena. This paper assesses the TLS possibilities in determining the driver’s field of vision in operating agricultural and forest machines with movable and immovable [...] Read more.
Terrestrial laser scanning (TLS) is currently one of the most progressively developed methods in obtaining information about objects and phenomena. This paper assesses the TLS possibilities in determining the driver’s field of vision in operating agricultural and forest machines with movable and immovable components in comparison to the method of using two light point sources for the creation of shade images according to ISO (International Organization for Standardization) 5721-1. Using the TLS method represents a minimum time saving of 55% or more, according to the project complexity. The values of shading ascertained by using the shadow cast method by the point light sources are generally overestimated and more distorted for small cabin structural components. The disadvantage of the TLS method is the scanner’s sensitivity to a soiled or scratched cabin windscreen and to the glass transparency impaired by heavy tinting. Full article
Show Figures

Figure 1

4709 KiB  
Article
Development of a Stereovision-Based Technique to Measure the Spread Patterns of Granular Fertilizer Spreaders
by Simon R. Cool, Jan G. Pieters, Dejan Seatovic, Koen C. Mertens, David Nuyttens, Tim C. Van De Gucht and Jürgen Vangeyte
Sensors 2017, 17(6), 1396; https://doi.org/10.3390/s17061396 - 15 Jun 2017
Cited by 11 | Viewed by 6137
Abstract
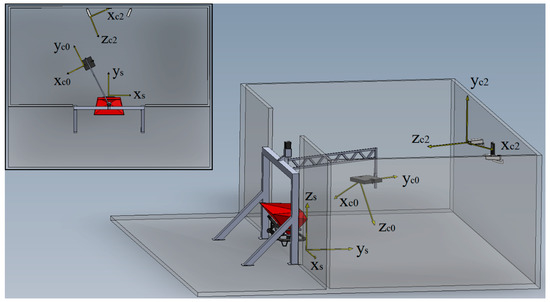
Centrifugal fertilizer spreaders are by far the most commonly used granular fertilizer spreader type in Europe. Their spread pattern however is error-prone, potentially leading to an undesired distribution of particles in the field and losses out of the field, which is often caused [...] Read more.
Centrifugal fertilizer spreaders are by far the most commonly used granular fertilizer spreader type in Europe. Their spread pattern however is error-prone, potentially leading to an undesired distribution of particles in the field and losses out of the field, which is often caused by poor calibration of the spreader for the specific fertilizer used. Due to the large environmental impact of fertilizer use, it is important to optimize the spreading process and minimize these errors. Spreader calibrations can be performed by using collection trays to determine the (field) spread pattern, but this is very time-consuming and expensive for the farmer and hence not common practice. Therefore, we developed an innovative multi-camera system to predict the spread pattern in a fast and accurate way, independent of the spreader configuration. Using high-speed stereovision, ejection parameters of particles leaving the spreader vanes were determined relative to a coordinate system associated with the spreader. The landing positions and subsequent spread patterns were determined using a ballistic model incorporating the effect of tractor motion and wind. Experiments were conducted with a commercial spreader and showed a high repeatability. The results were transformed to one spatial dimension to enable comparison with transverse spread patterns determined in the field and showed similar results. Full article
Show Figures

Figure 1

157 KiB  
Erratum
Erratum: Kim, K.-P.; Singh, A.K.; Bai, X.; Leprun, L.; Bhunia, A.K. Novel PCR Assays Complement Laser Biosensor-Based Method and Facilitate Listeria Species Detection from Food. Sensors 2015, 15, 22672–22691
by Kwang-Pyo Kim, Atul K. Singh, Xingjian Bai, Lena Leprun and Arun K. Bhunia
Sensors 2017, 17(5), 945; https://doi.org/10.3390/s17050945 - 25 Apr 2017
Cited by 1 | Viewed by 3881
Abstract
The authors wish to correct the oligonucleotide sequence of primer E-LAP-F1 and LIS-R1 in Table 1in their paper published in Sensors [1], doi:10.3390/s150922672, https://www.mdpi.com/1424-8220/15/9/22672. The following table should be used.[...] Full article
2359 KiB  
Article
Effective Calibration of Low-Cost Soil Water Content Sensors
by Heye Reemt Bogena, Johan Alexander Huisman, Bernd Schilling, Ansgar Weuthen and Harry Vereecken
Sensors 2017, 17(1), 208; https://doi.org/10.3390/s17010208 - 21 Jan 2017
Cited by 79 | Viewed by 13523
Abstract
Soil water content is a key variable for understanding and modelling ecohydrological processes. Low-cost electromagnetic sensors are increasingly being used to characterize the spatio-temporal dynamics of soil water content, despite the reduced accuracy of such sensors as compared to reference electromagnetic soil water [...] Read more.
Soil water content is a key variable for understanding and modelling ecohydrological processes. Low-cost electromagnetic sensors are increasingly being used to characterize the spatio-temporal dynamics of soil water content, despite the reduced accuracy of such sensors as compared to reference electromagnetic soil water content sensing methods such as time domain reflectometry. Here, we present an effective calibration method to improve the measurement accuracy of low-cost soil water content sensors taking the recently developed SMT100 sensor (Truebner GmbH, Neustadt, Germany) as an example. We calibrated the sensor output of more than 700 SMT100 sensors to permittivity using a standard procedure based on five reference media with a known apparent dielectric permittivity (1 < Ka < 34.8). Our results showed that a sensor-specific calibration improved the accuracy of the calibration compared to single “universal” calibration. The associated additional effort in calibrating each sensor individually is relaxed by a dedicated calibration setup that enables the calibration of large numbers of sensors in limited time while minimizing errors in the calibration process. Full article
Show Figures

Figure 1

4959 KiB  
Article
Nonlinear Fusion of Multispectral Citrus Fruit Image Data with Information Contents
by Peilin Li, Sang-Heon Lee, Hung-Yao Hsu and Jae-Sam Park
Sensors 2017, 17(1), 142; https://doi.org/10.3390/s17010142 - 13 Jan 2017
Cited by 9 | Viewed by 5967
Abstract
The main issue of vison-based automatic harvesting manipulators is the difficulty in the correct fruit identification in the images under natural lighting conditions. Mostly, the solution has been based on a linear combination of color components in the multispectral images. However, the results [...] Read more.
The main issue of vison-based automatic harvesting manipulators is the difficulty in the correct fruit identification in the images under natural lighting conditions. Mostly, the solution has been based on a linear combination of color components in the multispectral images. However, the results have not reached a satisfactory level. To overcome this issue, this paper proposes a robust nonlinear fusion method to augment the original color image with the synchronized near infrared image. The two images are fused with Daubechies wavelet transform (DWT) in a multiscale decomposition approach. With DWT, the background noises are reduced and the necessary image features are enhanced by fusing the color contrast of the color components and the homogeneity of the near infrared (NIR) component. The resulting fused color image is classified with a C-means algorithm for reconstruction. The performance of the proposed approach is evaluated with the statistical F measure in comparison to some existing methods using linear combinations of color components. The results show that the fusion of information in different spectral components has the advantage of enhancing the image quality, therefore improving the classification accuracy in citrus fruit identification in natural lighting conditions. Full article
Show Figures

Figure 1

2764 KiB  
Article
Automated Surveillance of Fruit Flies
by Ilyas Potamitis, Iraklis Rigakis and Nicolaos-Alexandros Tatlas
Sensors 2017, 17(1), 110; https://doi.org/10.3390/s17010110 - 08 Jan 2017
Cited by 39 | Viewed by 9793
Abstract
Insects of the Diptera order of the Tephritidae family cause costly, annual crop losses worldwide. Monitoring traps are important components of integrated pest management programs used against fruit flies. Here we report the modification of typical, low-cost plastic traps for fruit flies by [...] Read more.
Insects of the Diptera order of the Tephritidae family cause costly, annual crop losses worldwide. Monitoring traps are important components of integrated pest management programs used against fruit flies. Here we report the modification of typical, low-cost plastic traps for fruit flies by adding the necessary optoelectronic sensors to monitor the entrance of the trap in order to detect, time-stamp, GPS tag, and identify the species of incoming insects from the optoacoustic spectrum analysis of their wingbeat. We propose that the incorporation of automated streaming of insect counts, environmental parameters and GPS coordinates into informative visualization of collective behavior will finally enable better decision making across spatial and temporal scales, as well as administrative levels. The device presented is at product level of maturity as it has solved many pending issues presented in a previously reported study. Full article
Show Figures

Figure 1

2016

Jump to: 2024, 2023, 2022, 2021, 2020, 2019, 2018, 2017, 2015, 2014

5697 KiB  
Article
Simultaneous Moisture Content and Mass Flow Measurements in Wood Chip Flows Using Coupled Dielectric and Impact Sensors
by Pengmin Pan, Timothy McDonald, John Fulton, Brian Via and John Hung
Sensors 2017, 17(1), 20; https://doi.org/10.3390/s17010020 - 23 Dec 2016
Cited by 5 | Viewed by 5431
Abstract
An 8-electrode capacitance tomography (ECT) sensor was built and used to measure moisture content (MC) and mass flow of pine chip flows. The device was capable of directly measuring total water quantity in a sample but was sensitive to both dry matter and [...] Read more.
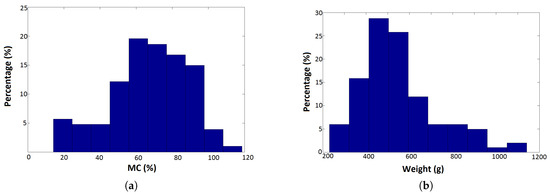
An 8-electrode capacitance tomography (ECT) sensor was built and used to measure moisture content (MC) and mass flow of pine chip flows. The device was capable of directly measuring total water quantity in a sample but was sensitive to both dry matter and moisture, and therefore required a second measurement of mass flow to calculate MC. Two means of calculating the mass flow were used: the first being an impact sensor to measure total mass flow, and the second a volumetric approach based on measuring total area occupied by wood in images generated using the capacitance sensor’s tomographic mode. Tests were made on 109 groups of wood chips ranging in moisture content from 14% to 120% (dry basis) and wet weight of 280 to 1100 g. Sixty groups were randomly selected as a calibration set, and the remaining were used for validation of the sensor’s performance. For the combined capacitance/force transducer system, root mean square errors of prediction (RMSEP) for wet mass flow and moisture content were 13.42% and 16.61%, respectively. RMSEP using the combined volumetric mass flow/capacitance sensor for dry mass flow and moisture content were 22.89% and 24.16%, respectively. Either of the approaches was concluded to be feasible for prediction of moisture content in pine chip flows, but combining the impact and capacitance sensors was easier to implement. In situations where flows could not be impeded, however, the tomographic approach would likely be more useful. Full article
Show Figures

Figure 1

17533 KiB  
Article
Towards Automated Large-Scale 3D Phenotyping of Vineyards under Field Conditions
by Johann Christian Rose, Anna Kicherer, Markus Wieland, Lasse Klingbeil, Reinhard Töpfer and Heiner Kuhlmann
Sensors 2016, 16(12), 2136; https://doi.org/10.3390/s16122136 - 15 Dec 2016
Cited by 50 | Viewed by 8750
Abstract
In viticulture, phenotypic data are traditionally collected directly in the field via visual and manual means by an experienced person. This approach is time consuming, subjective and prone to human errors. In recent years, research therefore has focused strongly on developing automated and [...] Read more.
In viticulture, phenotypic data are traditionally collected directly in the field via visual and manual means by an experienced person. This approach is time consuming, subjective and prone to human errors. In recent years, research therefore has focused strongly on developing automated and non-invasive sensor-based methods to increase data acquisition speed, enhance measurement accuracy and objectivity and to reduce labor costs. While many 2D methods based on image processing have been proposed for field phenotyping, only a few 3D solutions are found in the literature. A track-driven vehicle consisting of a camera system, a real-time-kinematic GPS system for positioning, as well as hardware for vehicle control, image storage and acquisition is used to visually capture a whole vine row canopy with georeferenced RGB images. In the first post-processing step, these images were used within a multi-view-stereo software to reconstruct a textured 3D point cloud of the whole grapevine row. A classification algorithm is then used in the second step to automatically classify the raw point cloud data into the semantic plant components, grape bunches and canopy. In the third step, phenotypic data for the semantic objects is gathered using the classification results obtaining the quantity of grape bunches, berries and the berry diameter. Full article
Show Figures

Graphical abstract

9242 KiB  
Article
Performance Evaluation of Proximal Sensors for Soil Assessment in Smallholder Farms in Embu County, Kenya
by Kristin Piikki, Mats Söderström, Jan Eriksson, Jamleck Muturi John, Patrick Ireri Muthee, Johanna Wetterlind and Eric Lund
Sensors 2016, 16(11), 1950; https://doi.org/10.3390/s16111950 - 19 Nov 2016
Cited by 22 | Viewed by 10382
Abstract
Four proximal soil sensors were tested at four smallholder farms in Embu County, Kenya: a portable X-ray fluorescence sensor (PXRF), a mobile phone application for soil color determination by photography, a dual-depth electromagnetic induction (EMI) sensor, and a LED-based soil optical reflectance sensor. [...] Read more.
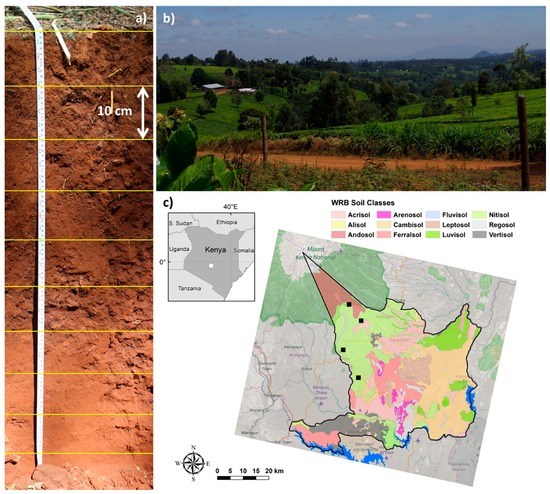
Four proximal soil sensors were tested at four smallholder farms in Embu County, Kenya: a portable X-ray fluorescence sensor (PXRF), a mobile phone application for soil color determination by photography, a dual-depth electromagnetic induction (EMI) sensor, and a LED-based soil optical reflectance sensor. Measurements were made at 32–43 locations at each site. Topsoil samples were analyzed for plant-available nutrients (N, P, K, Mg, Ca, S, B, Mn, Zn, Cu, and Fe), pH, total nitrogen (TN) and total carbon (TC), soil texture, cation exchange capacity (CEC), and exchangeable aluminum (Al). Multivariate prediction models of each of the lab-analyzed soil properties were parameterized for 576 sensor-variable combinations. Prediction models for K, N, Ca and S, B, Zn, Mn, Fe, TC, Al, and CEC met the setup criteria for functional, robust, and accurate models. The PXRF sensor was the sensor most often included in successful models. We concluded that the combination of a PXRF and a portable soil reflectance sensor is a promising combination of handheld soil sensors for the development of in situ soil assessments as a field-based alternative or complement to laboratory measurements. Full article
Show Figures

Figure 1

13173 KiB  
Article
Laboratory Performance of Five Selected Soil Moisture Sensors Applying Factory and Own Calibration Equations for Two Soil Media of Different Bulk Density and Salinity Levels
by Svatopluk Matula, Kamila Báťková and Wossenu Lemma Legese
Sensors 2016, 16(11), 1912; https://doi.org/10.3390/s16111912 - 15 Nov 2016
Cited by 53 | Viewed by 11041
Abstract
Non-destructive soil water content determination is a fundamental component for many agricultural and environmental applications. The accuracy and costs of the sensors define the measurement scheme and the ability to fit the natural heterogeneous conditions. The aim of this study was to evaluate [...] Read more.
Non-destructive soil water content determination is a fundamental component for many agricultural and environmental applications. The accuracy and costs of the sensors define the measurement scheme and the ability to fit the natural heterogeneous conditions. The aim of this study was to evaluate five commercially available and relatively cheap sensors usually grouped with impedance and FDR sensors. ThetaProbe ML2x (impedance) and ECH2O EC-10, ECH2O EC-20, ECH2O EC-5, and ECH2O TE (all FDR) were tested on silica sand and loess of defined characteristics under controlled laboratory conditions. The calibrations were carried out in nine consecutive soil water contents from dry to saturated conditions (pure water and saline water). The gravimetric method was used as a reference method for the statistical evaluation (ANOVA with significance level 0.05). Generally, the results showed that our own calibrations led to more accurate soil moisture estimates. Variance component analysis arranged the factors contributing to the total variation as follows: calibration (contributed 42%), sensor type (contributed 29%), material (contributed 18%), and dry bulk density (contributed 11%). All the tested sensors performed very well within the whole range of water content, especially the sensors ECH2O EC-5 and ECH2O TE, which also performed surprisingly well in saline conditions. Full article
Show Figures

Figure 1

1297 KiB  
Article
Real-Time Identification of Smoldering and Flaming Combustion Phases in Forest Using a Wireless Sensor Network-Based Multi-Sensor System and Artificial Neural Network
by Xiaofei Yan, Hong Cheng, Yandong Zhao, Wenhua Yu, Huan Huang and Xiaoliang Zheng
Sensors 2016, 16(8), 1228; https://doi.org/10.3390/s16081228 - 04 Aug 2016
Cited by 29 | Viewed by 9198
Abstract
Diverse sensing techniques have been developed and combined with machine learning method for forest fire detection, but none of them referred to identifying smoldering and flaming combustion phases. This study attempts to real-time identify different combustion phases using a developed wireless sensor network [...] Read more.
Diverse sensing techniques have been developed and combined with machine learning method for forest fire detection, but none of them referred to identifying smoldering and flaming combustion phases. This study attempts to real-time identify different combustion phases using a developed wireless sensor network (WSN)-based multi-sensor system and artificial neural network (ANN). Sensors (CO, CO2, smoke, air temperature and relative humidity) were integrated into one node of WSN. An experiment was conducted using burning materials from residual of forest to test responses of each node under no, smoldering-dominated and flaming-dominated combustion conditions. The results showed that the five sensors have reasonable responses to artificial forest fire. To reduce cost of the nodes, smoke, CO2 and temperature sensors were chiefly selected through correlation analysis. For achieving higher identification rate, an ANN model was built and trained with inputs of four sensor groups: smoke; smoke and CO2; smoke and temperature; smoke, CO2 and temperature. The model test results showed that multi-sensor input yielded higher predicting accuracy (≥82.5%) than single-sensor input (50.9%–92.5%). Based on these, it is possible to reduce the cost with a relatively high fire identification rate and potential application of the system can be tested in future under real forest condition. Full article
Show Figures

Figure 1

2015

Jump to: 2024, 2023, 2022, 2021, 2020, 2019, 2018, 2017, 2016, 2014

2666 KiB  
Article
Impedance of the Grape Berry Cuticle as a Novel Phenotypic Trait to Estimate Resistance to Botrytis Cinerea
by Katja Herzog, Rolf Wind and Reinhard Töpfer
Sensors 2015, 15(6), 12498-12512; https://doi.org/10.3390/s150612498 - 27 May 2015
Cited by 44 | Viewed by 9925
Abstract
Warm and moist weather conditions during berry ripening provoke Botrytis cinerea (B. cinerea) causing notable bunch rot on susceptible grapevines with the effect of reduced yield and wine quality. Resistance donors of genetic loci to increase B. cinerea resistance are widely [...] Read more.
Warm and moist weather conditions during berry ripening provoke Botrytis cinerea (B. cinerea) causing notable bunch rot on susceptible grapevines with the effect of reduced yield and wine quality. Resistance donors of genetic loci to increase B. cinerea resistance are widely unknown. Promising traits of resistance are represented by physical features like the thickness and permeability of the grape berry cuticle. Sensor-based phenotyping methods or genetic markers are rare for such traits. In the present study, the simple-to-handle I-sensor was developed. The sensor enables the fast and reliable measurement of electrical impedance of the grape berry cuticles and its epicuticular waxes (CW). Statistical experiments revealed highly significant correlations between relative impedance of CW and the resistance of grapevines to B. cinerea. Thus, the relative impedance Zrel of CW was identified as the most important phenotypic factor with regard to the prediction of grapevine resistance to B. cinerea. An ordinal logistic regression analysis revealed a R2McFadden of 0.37 and confirmed the application of Zrel of CW for the prediction of bunch infection and in this way as novel phenotyping trait. Applying the I-sensor, a preliminary QTL region was identified indicating that the novel phenotypic trait is as well a valuable tool for genetic analyses. Full article
Show Figures

Figure 1

14042 KiB  
Article
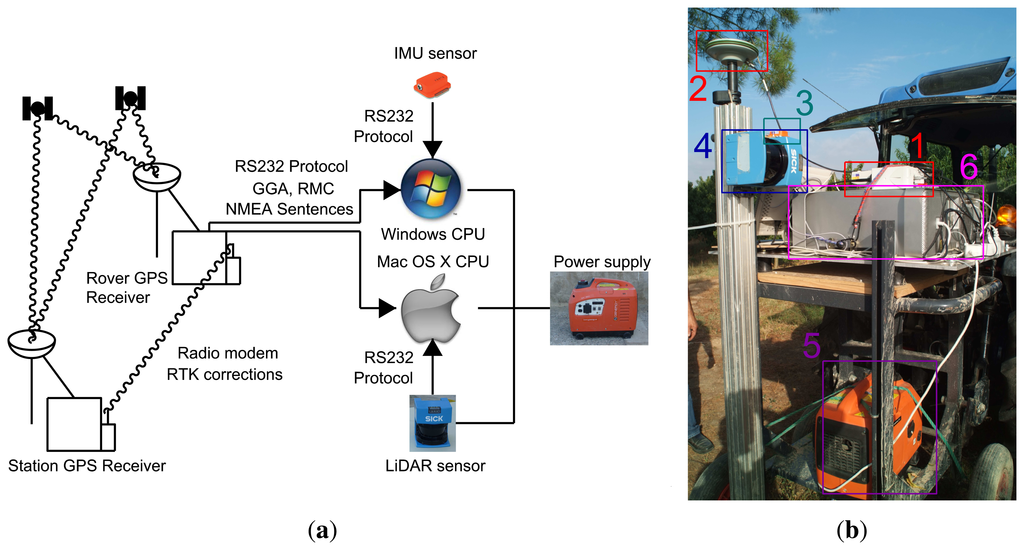
Georeferenced Scanning System to Estimate the Leaf Wall Area in Tree Crops
by Ignacio Del-Moral-Martínez, Jaume Arnó, Alexandre Escolà, Ricardo Sanz, Joan Masip-Vilalta, Joaquim Company-Messa and Joan R. Rosell-Polo
Sensors 2015, 15(4), 8382-8405; https://doi.org/10.3390/s150408382 - 10 Apr 2015
Cited by 14 | Viewed by 8325
Abstract
This paper presents the use of a terrestrial light detection and ranging (LiDAR) system to scan the vegetation of tree crops to estimate the so-called pixelated leaf wall area (PLWA). Scanning rows laterally and considering only the half-canopy vegetation to the line of [...] Read more.
This paper presents the use of a terrestrial light detection and ranging (LiDAR) system to scan the vegetation of tree crops to estimate the so-called pixelated leaf wall area (PLWA). Scanning rows laterally and considering only the half-canopy vegetation to the line of the trunks, PLWA refers to the vertical projected area without gaps detected by LiDAR. As defined, PLWA may be different depending on the side from which the LiDAR is applied. The system is completed by a real-time kinematic global positioning system (RTK-GPS) sensor and an inertial measurement unit (IMU) sensor for positioning. At the end, a total leaf wall area (LWA) is computed and assigned to the X, Y position of each vertical scan. The final value of the area depends on the distance between two consecutive scans (or horizontal resolution), as well as the number of intercepted points within each scan, since PLWA is only computed when the laser beam detects vegetation. To verify system performance, tests were conducted related to the georeferencing task and synchronization problems between GPS time and central processing unit (CPU) time. Despite this, the overall accuracy of the system is generally acceptable. The Leaf Area Index (LAI) can then be estimated using PLWA as an explanatory variable in appropriate linear regression models. Full article
Show Figures

5992 KiB  
Article
Quantifying Efficacy and Limits of Unmanned Aerial Vehicle (UAV) Technology for Weed Seedling Detection as Affected by Sensor Resolution
by José M. Peña, Jorge Torres-Sánchez, Angélica Serrano-Pérez, Ana I. De Castro and Francisca López-Granados
Sensors 2015, 15(3), 5609-5626; https://doi.org/10.3390/s150305609 - 06 Mar 2015
Cited by 143 | Viewed by 15516
Abstract
In order to optimize the application of herbicides in weed-crop systems, accurate and timely weed maps of the crop-field are required. In this context, this investigation quantified the efficacy and limitations of remote images collected with an unmanned aerial vehicle (UAV) for early [...] Read more.
In order to optimize the application of herbicides in weed-crop systems, accurate and timely weed maps of the crop-field are required. In this context, this investigation quantified the efficacy and limitations of remote images collected with an unmanned aerial vehicle (UAV) for early detection of weed seedlings. The ability to discriminate weeds was significantly affected by the imagery spectral (type of camera), spatial (flight altitude) and temporal (the date of the study) resolutions. The colour-infrared images captured at 40 m and 50 days after sowing (date 2), when plants had 5–6 true leaves, had the highest weed detection accuracy (up to 91%). At this flight altitude, the images captured before date 2 had slightly better results than the images captured later. However, this trend changed in the visible-light images captured at 60 m and higher, which had notably better results on date 3 (57 days after sowing) because of the larger size of the weed plants. Our results showed the requirements on spectral and spatial resolutions needed to generate a suitable weed map early in the growing season, as well as the best moment for the UAV image acquisition, with the ultimate objective of applying site-specific weed management operations. Full article
Show Figures

Figure 1

3758 KiB  
Article
Structure Optimization of a Grain Impact Piezoelectric Sensor and Its Application for Monitoring Separation Losses on Tangential-Axial Combine Harvesters
by Zhenwei Liang, Yaoming Li, Zhan Zhao and Lizhang Xu
Sensors 2015, 15(1), 1496-1517; https://doi.org/10.3390/s150101496 - 14 Jan 2015
Cited by 17 | Viewed by 7579
Abstract
Grain separation losses is a key parameter to weigh the performance of combine harvesters, and also a dominant factor for automatically adjusting their major working parameters. The traditional separation losses monitoring method mainly rely on manual efforts, which require a high labor intensity. [...] Read more.
Grain separation losses is a key parameter to weigh the performance of combine harvesters, and also a dominant factor for automatically adjusting their major working parameters. The traditional separation losses monitoring method mainly rely on manual efforts, which require a high labor intensity. With recent advancements in sensor technology, electronics and computational processing power, this paper presents an indirect method for monitoring grain separation losses in tangential-axial combine harvesters in real-time. Firstly, we developed a mathematical monitoring model based on detailed comparative data analysis of different feeding quantities. Then, we developed a grain impact piezoelectric sensor utilizing a YT-5 piezoelectric ceramic as the sensing element, and a signal process circuit designed according to differences in voltage amplitude and rise time of collision signals. To improve the sensor performance, theoretical analysis was performed from a structural vibration point of view, and the optimal sensor structural has been selected. Grain collide experiments have shown that the sensor performance was greatly improved. Finally, we installed the sensor on a tangential-longitudinal axial combine harvester, and grain separation losses monitoring experiments were carried out in North China, which results have shown that the monitoring method was feasible, and the biggest measurement relative error was 4.63% when harvesting rice. Full article
Show Figures

4086 KiB  
Article
A Customized Metal Oxide Semiconductor-Based Gas Sensor Array for Onion Quality Evaluation: System Development and Characterization
by Tharun Konduru, Glen C. Rains and Changying Li
Sensors 2015, 15(1), 1252-1273; https://doi.org/10.3390/s150101252 - 12 Jan 2015
Cited by 53 | Viewed by 13907
Abstract
A gas sensor array, consisting of seven Metal Oxide Semiconductor (MOS) sensors that are sensitive to a wide range of organic volatile compounds was developed to detect rotten onions during storage. These MOS sensors were enclosed in a specially designed Teflon chamber equipped [...] Read more.
A gas sensor array, consisting of seven Metal Oxide Semiconductor (MOS) sensors that are sensitive to a wide range of organic volatile compounds was developed to detect rotten onions during storage. These MOS sensors were enclosed in a specially designed Teflon chamber equipped with a gas delivery system to pump volatiles from the onion samples into the chamber. The electronic circuit mainly comprised a microcontroller, non-volatile memory chip, and trickle-charge real time clock chip, serial communication chip, and parallel LCD panel. User preferences are communicated with the on-board microcontroller through a graphical user interface developed using LabVIEW. The developed gas sensor array was characterized and the discrimination potential was tested by exposing it to three different concentrations of acetone (ketone), acetonitrile (nitrile), ethyl acetate (ester), and ethanol (alcohol). The gas sensor array could differentiate the four chemicals of same concentrations and different concentrations within the chemical with significant difference. Experiment results also showed that the system was able to discriminate two concentrations (196 and 1964 ppm) of methlypropyl sulfide and two concentrations (145 and 1452 ppm) of 2-nonanone, two key volatile compounds emitted by rotten onions. As a proof of concept, the gas sensor array was able to achieve 89% correct classification of sour skin infected onions. The customized low-cost gas sensor array could be a useful tool to detect onion postharvest diseases in storage. Full article
Show Figures

2014

Jump to: 2024, 2023, 2022, 2021, 2020, 2019, 2018, 2017, 2016, 2015

1188 KiB  
Review
A Review of Imaging Techniques for Plant Phenotyping
by Lei Li, Qin Zhang and Danfeng Huang
Sensors 2014, 14(11), 20078-20111; https://doi.org/10.3390/s141120078 - 24 Oct 2014
Cited by 733 | Viewed by 36856
Abstract
Given the rapid development of plant genomic technologies, a lack of access to plant phenotyping capabilities limits our ability to dissect the genetics of quantitative traits. Effective, high-throughput phenotyping platforms have recently been developed to solve this problem. In high-throughput phenotyping platforms, a [...] Read more.
Given the rapid development of plant genomic technologies, a lack of access to plant phenotyping capabilities limits our ability to dissect the genetics of quantitative traits. Effective, high-throughput phenotyping platforms have recently been developed to solve this problem. In high-throughput phenotyping platforms, a variety of imaging methodologies are being used to collect data for quantitative studies of complex traits related to the growth, yield and adaptation to biotic or abiotic stress (disease, insects, drought and salinity). These imaging techniques include visible imaging (machine vision), imaging spectroscopy (multispectral and hyperspectral remote sensing), thermal infrared imaging, fluorescence imaging, 3D imaging and tomographic imaging (MRT, PET and CT). This paper presents a brief review on these imaging techniques and their applications in plant phenotyping. The features used to apply these imaging techniques to plant phenotyping are described and discussed in this review. Full article
Show Figures

Back to TopTop