


Processes 2023, 11(7), 2068; https://doi.org/10.3390/pr11072068 - 11 Jul 2023
Cited by 1 | Viewed by 1139
Abstract
►
Show Figures
The central air conditioning system accounts for 50% of the building energy consumption, and the cold source system accounts for more than 60% of the total energy consumption of the central air conditioning system. Therefore, it is crucial to solve the optimal control
[...] Read more.
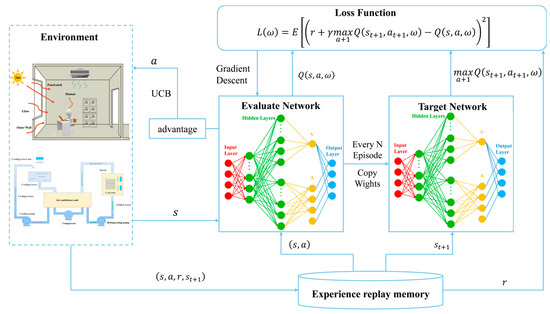
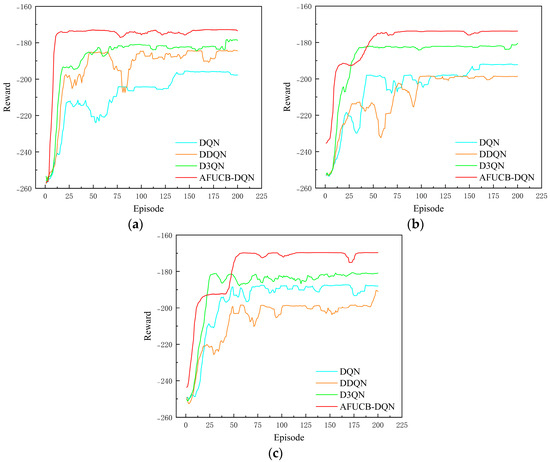
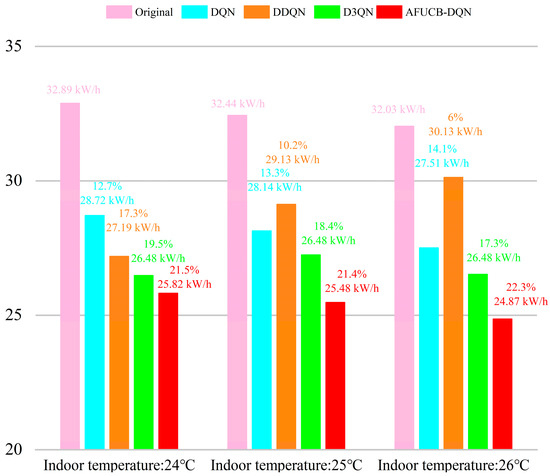
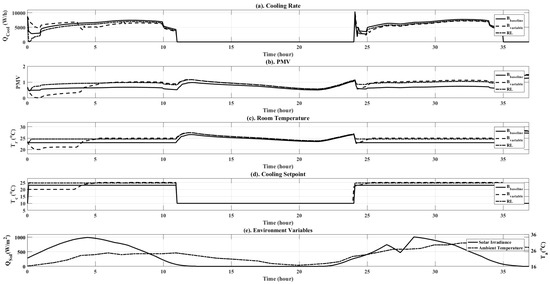
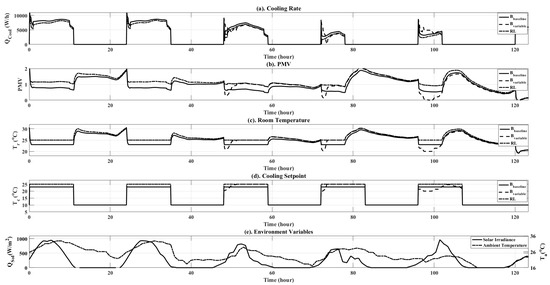
The central air conditioning system accounts for 50% of the building energy consumption, and the cold source system accounts for more than 60% of the total energy consumption of the central air conditioning system. Therefore, it is crucial to solve the optimal control strategy of the cold source system according to the cooling load demand, and adjust the operating parameters in time to achieve low energy consumption and high efficiency. Due to the complex and changeable characteristics of the central air conditioning system, it is often difficult to achieve ideal results using traditional control methods. In order to solve this problem, this study first coupled the building cooling load simulation environment and the cold source system simulation environment to build a central air conditioning system simulation environment. Secondly, noise interference was introduced to reduce the gap between the simulated environment and the actual environment, and improve the robustness of the environment. Finally, combined with deep reinforcement learning, an optimal control strategy for the central air conditioning system is proposed. Aiming at the simulation environment of the central air conditioning system, a new model-free algorithm is proposed, called the dominant function upper confidence bound deep Q-network (AFUCB-DQN). The algorithm combines the advantages of an advantage function and an upper confidence bound algorithm to balance the relationship between exploration and exploitation, so as to achieve a better control strategy search. Compared with the traditional deep Q-network (DQN) algorithm, double deep Q-network (DDQN) algorithm, and the distributed double deep Q-network (D3QN) algorithm, the AFUCB-DQN algorithm has more stable convergence, faster convergence speed, and higher reward. In this study, significant energy savings of 21.5%, 21.4%, and 22.3% were obtained by conducting experiments at indoor thermal comfort levels of 24 °C, 25 °C, and 26 °C in the summer.
Full article
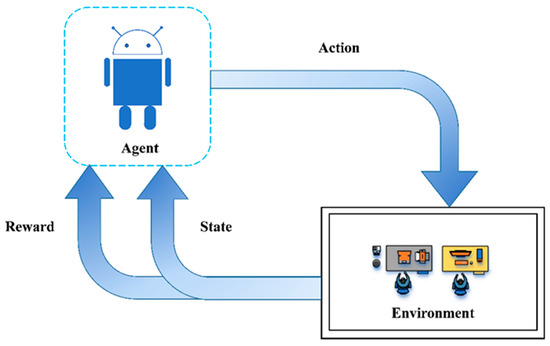
Figure 1

