
Metrology 2024, 4(2), 164-180; https://doi.org/10.3390/metrology4020011 - 02 Apr 2024
Viewed by 248
Abstract
►
Show Figures
The imperative need to advance the development of more efficient electric motors requires the meticulous measurement of small increments while minimizing the associated uncertainty in dynamometer tests. One of the key variables in such tests is the angular speed, which is typically obtained
[...] Read more.
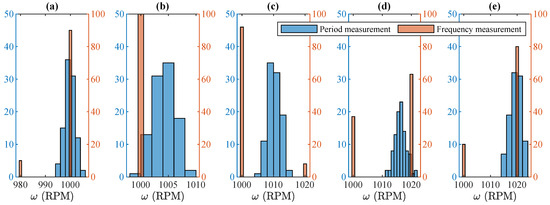
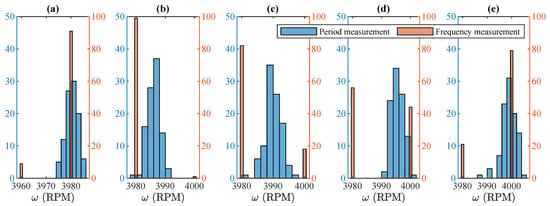
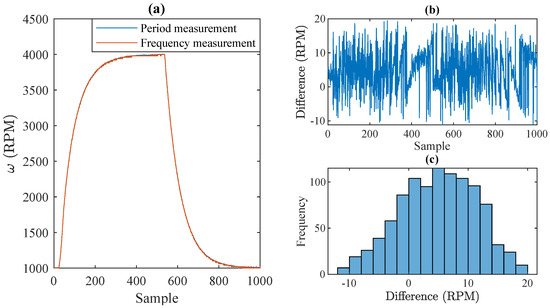
The imperative need to advance the development of more efficient electric motors requires the meticulous measurement of small increments while minimizing the associated uncertainty in dynamometer tests. One of the key variables in such tests is the angular speed, which is typically obtained based on encoder measurements. This paper proposes a systematic measurement uncertainty assessment method based on the Guide to the Expression of Uncertainty for the two most widely used methods for angular speed measurement, namely, the frequency and period methods. In addition, the impact of the angular speed calculation method on the efficiency test uncertainty is assessed using an automatic test rig for electric motors. Our experimental results consider both steady-state and dynamic analyses. The results show that the period measurement method provides measurements with lower uncertainty for the encoders typically used in such test rigs, about 30 times less than the uncertainty determined for the frequency measurement method. Based on these results, the choice of a proper method can drastically decrease the angular speed uncertainty, and consequently the motor efficiency uncertainty, without increasing instrumentation cost.
Full article
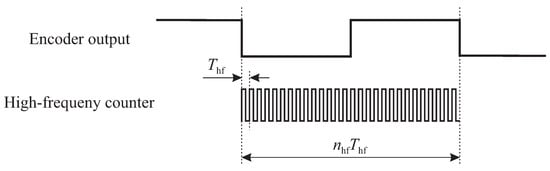
Figure 1


