
A Preliminary Investigation of Special Types of Honey Marketed in Morocco

 , and
, and
Abstract
:1. Introduction
2. Materials and Methods
2.1. Samples
2.2. Physico-Chemical Parameters
2.3. Multi-Element Analysis
2.3.1. Sample Preparation
2.3.2. ICP-MS Conditions
2.3.3. Analysis of Mercury
2.4. Volatile Fingerprint
2.4.1. SPME-GC Parameters
2.4.2. Mass Spectrometry
3. Results and Discussion
3.1. Physico-Chemical Parameters
3.1.1. Humidity
3.1.2. Total Soluble Solids (TSS)
3.1.3. Refractive Index (RI)
3.1.4. Acidity and pH
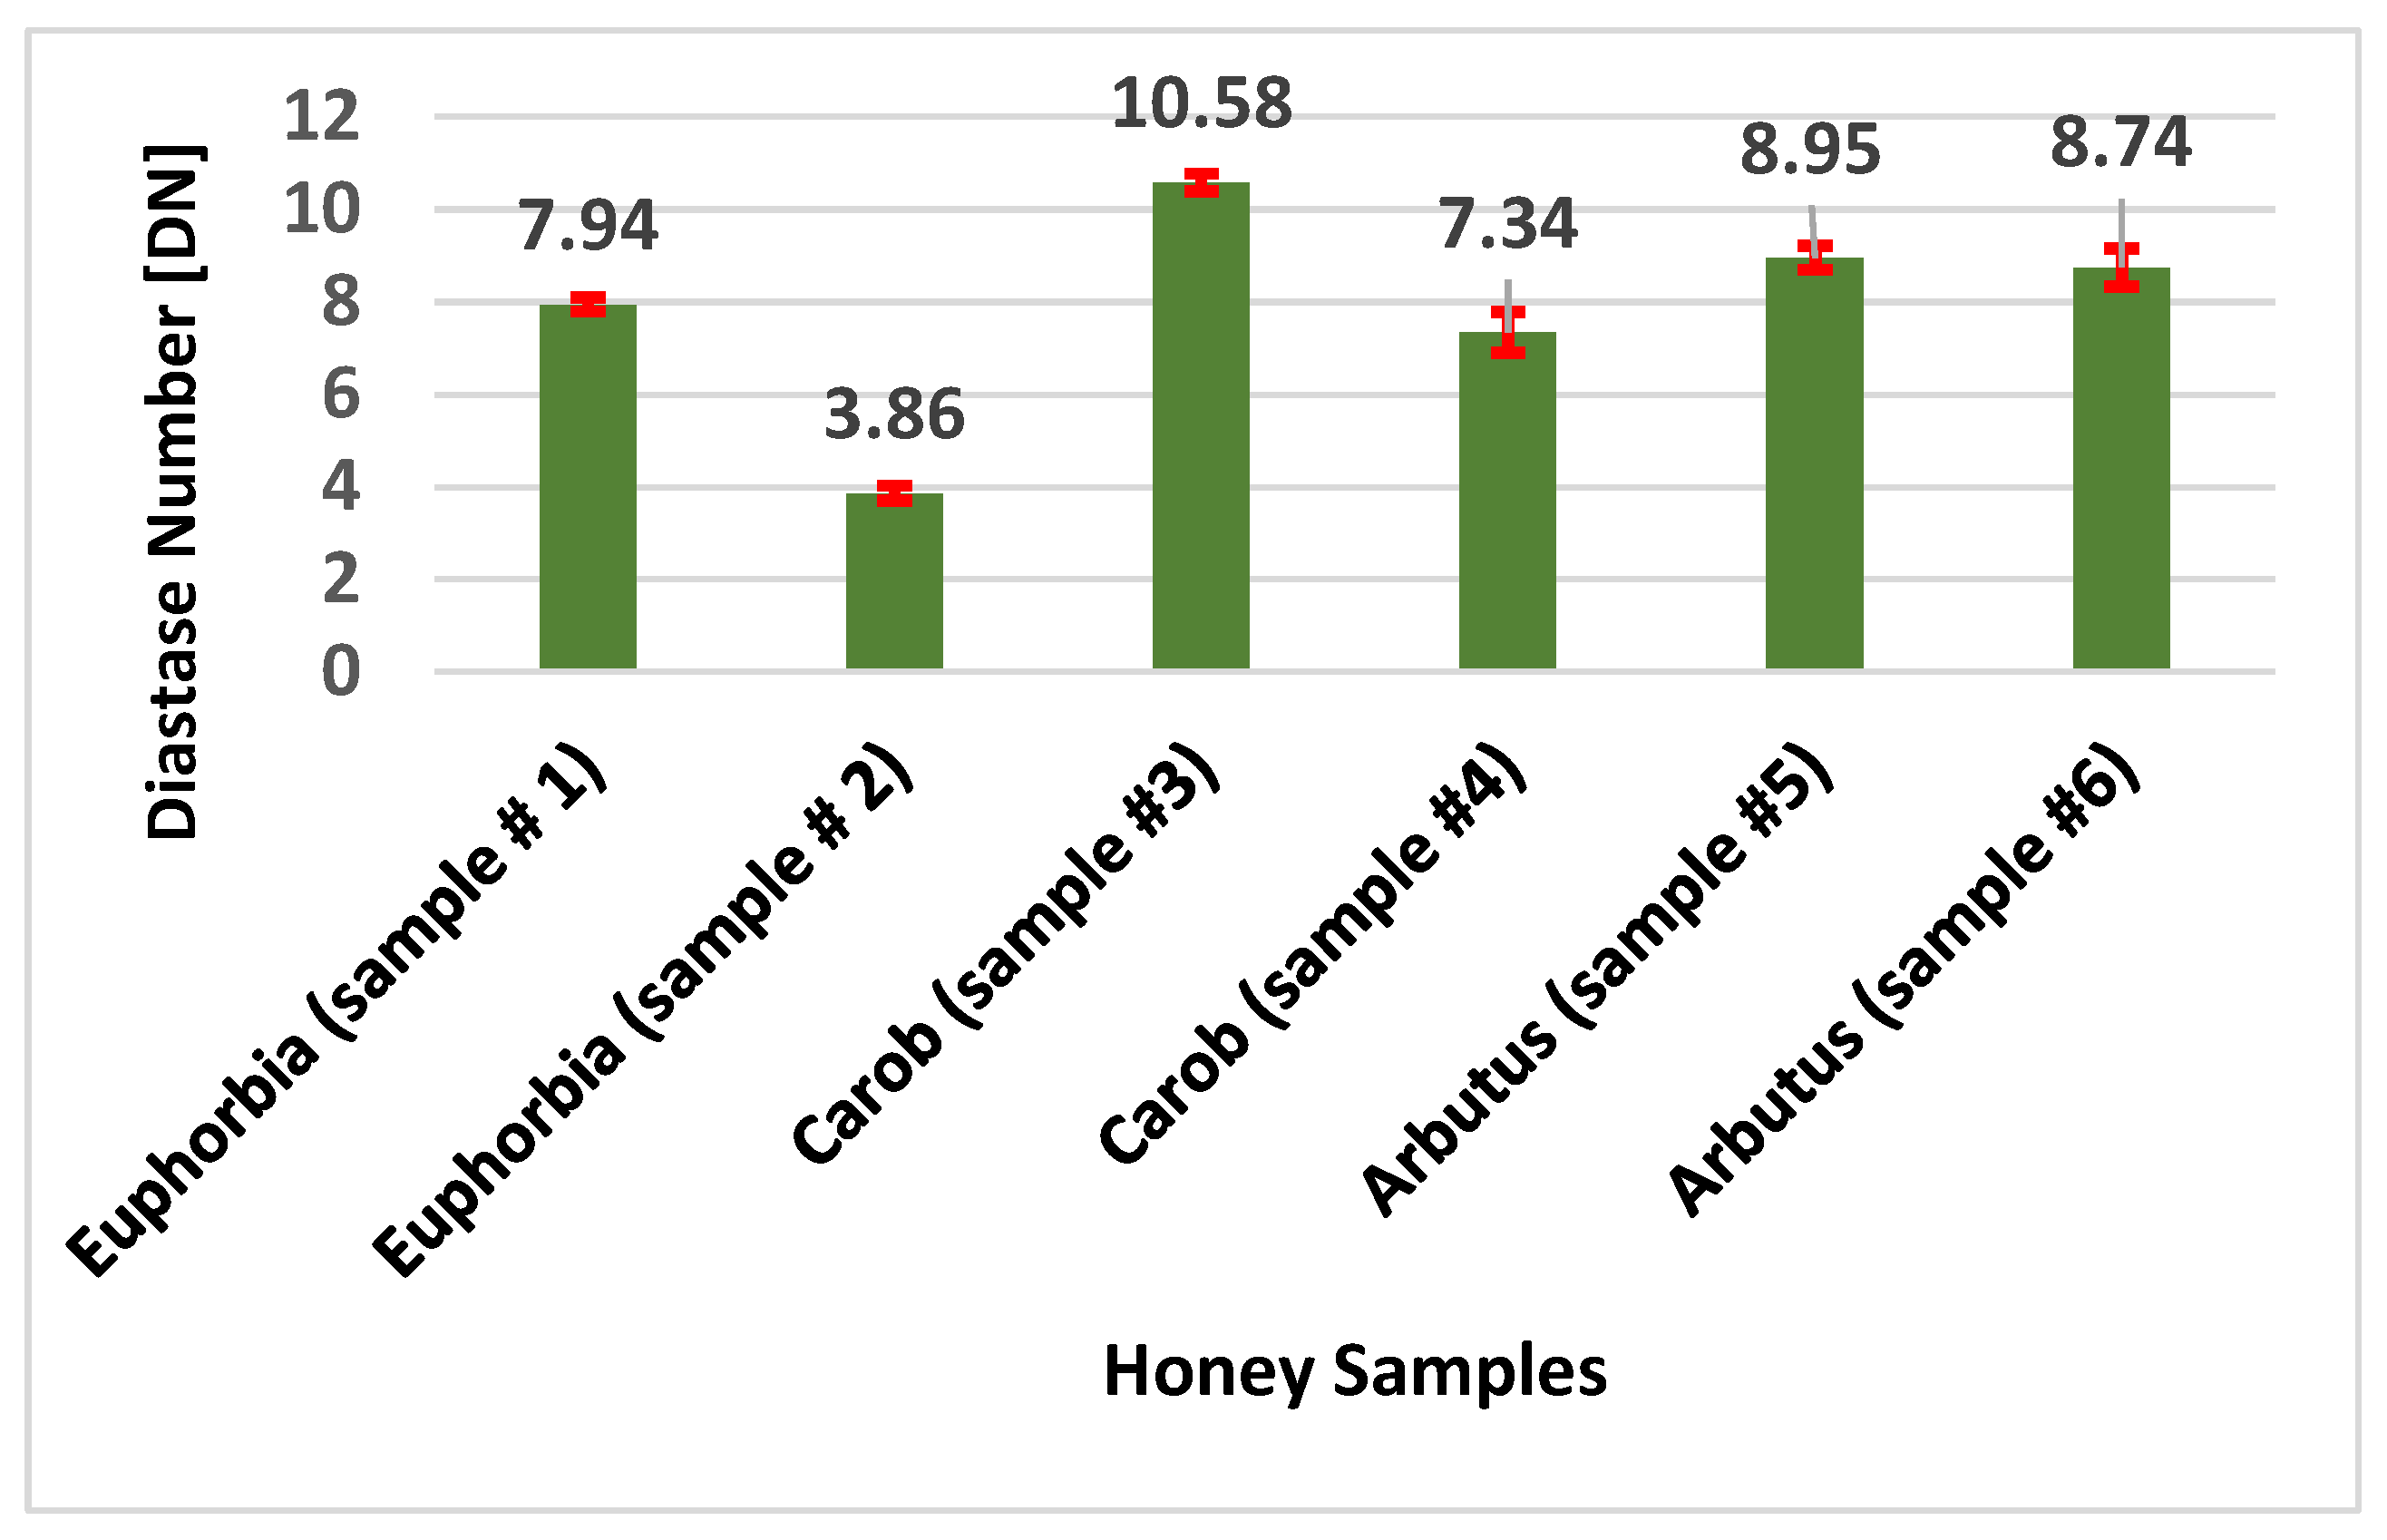
3.1.5. Diastase
3.2. Multi-Element Analysis
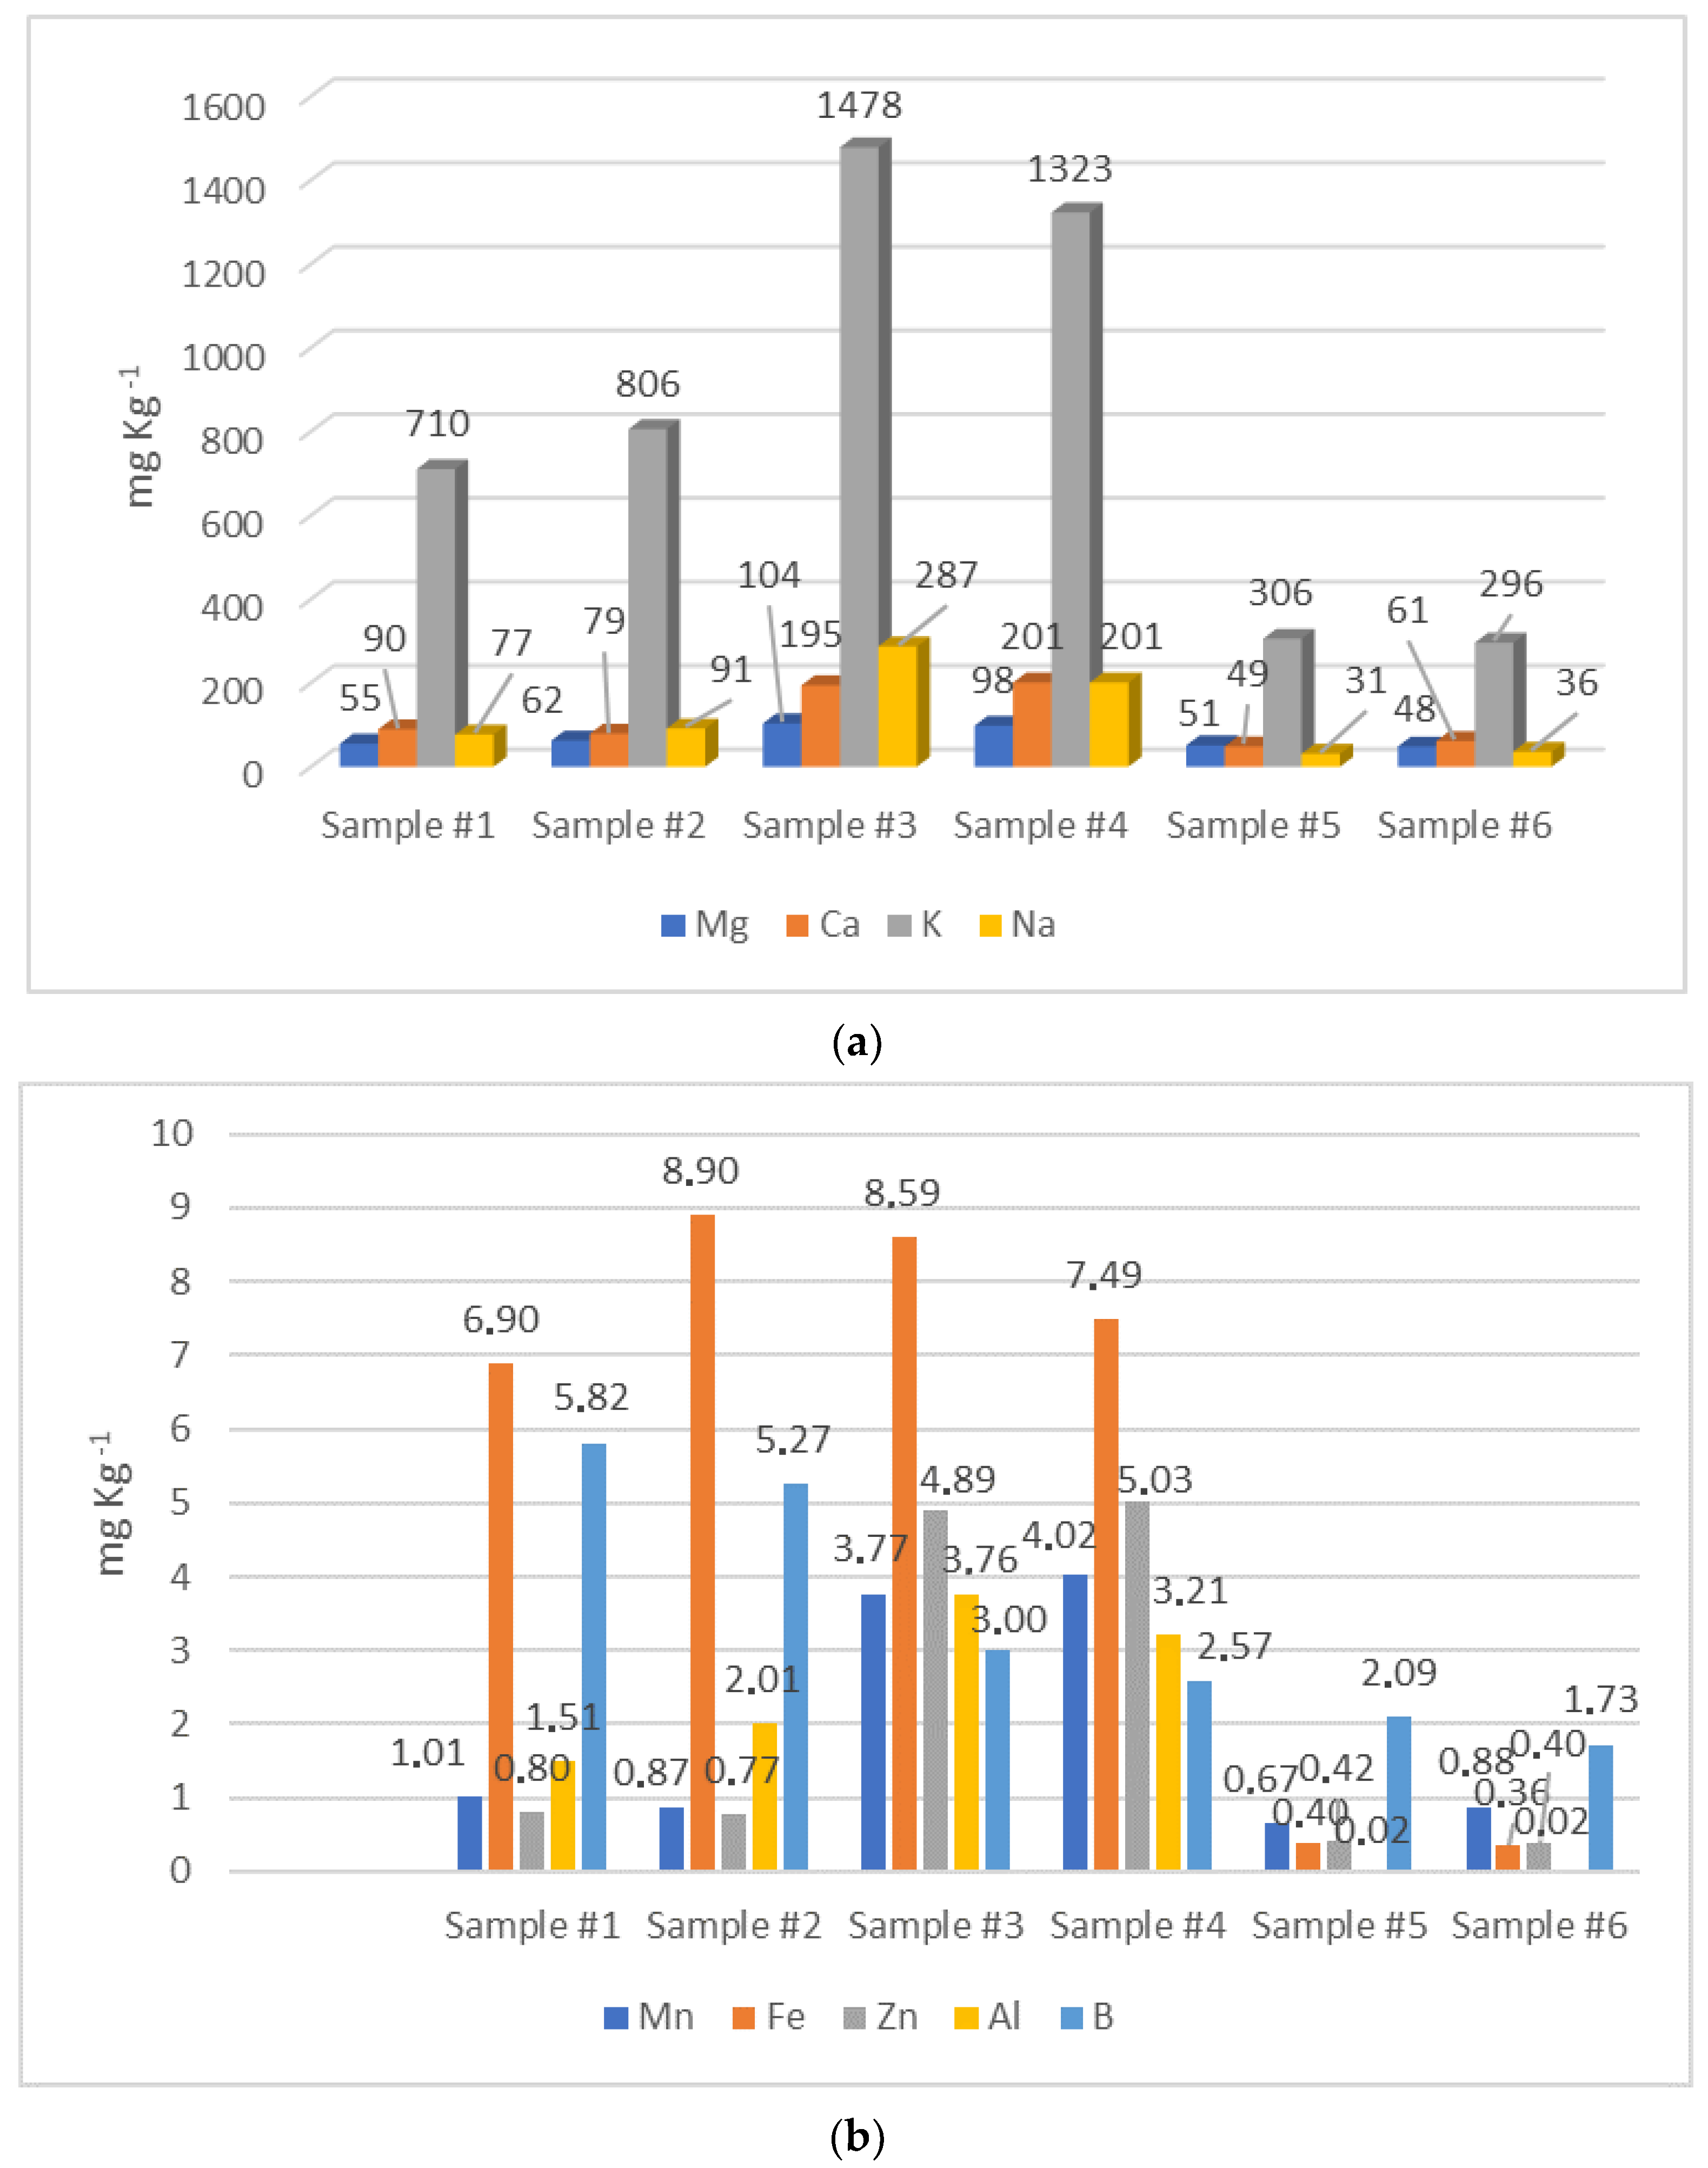
3.2.1. Macroelements
3.2.2. Microelements
Quantitative Analysis
Toxic Elements
Nutritional Value
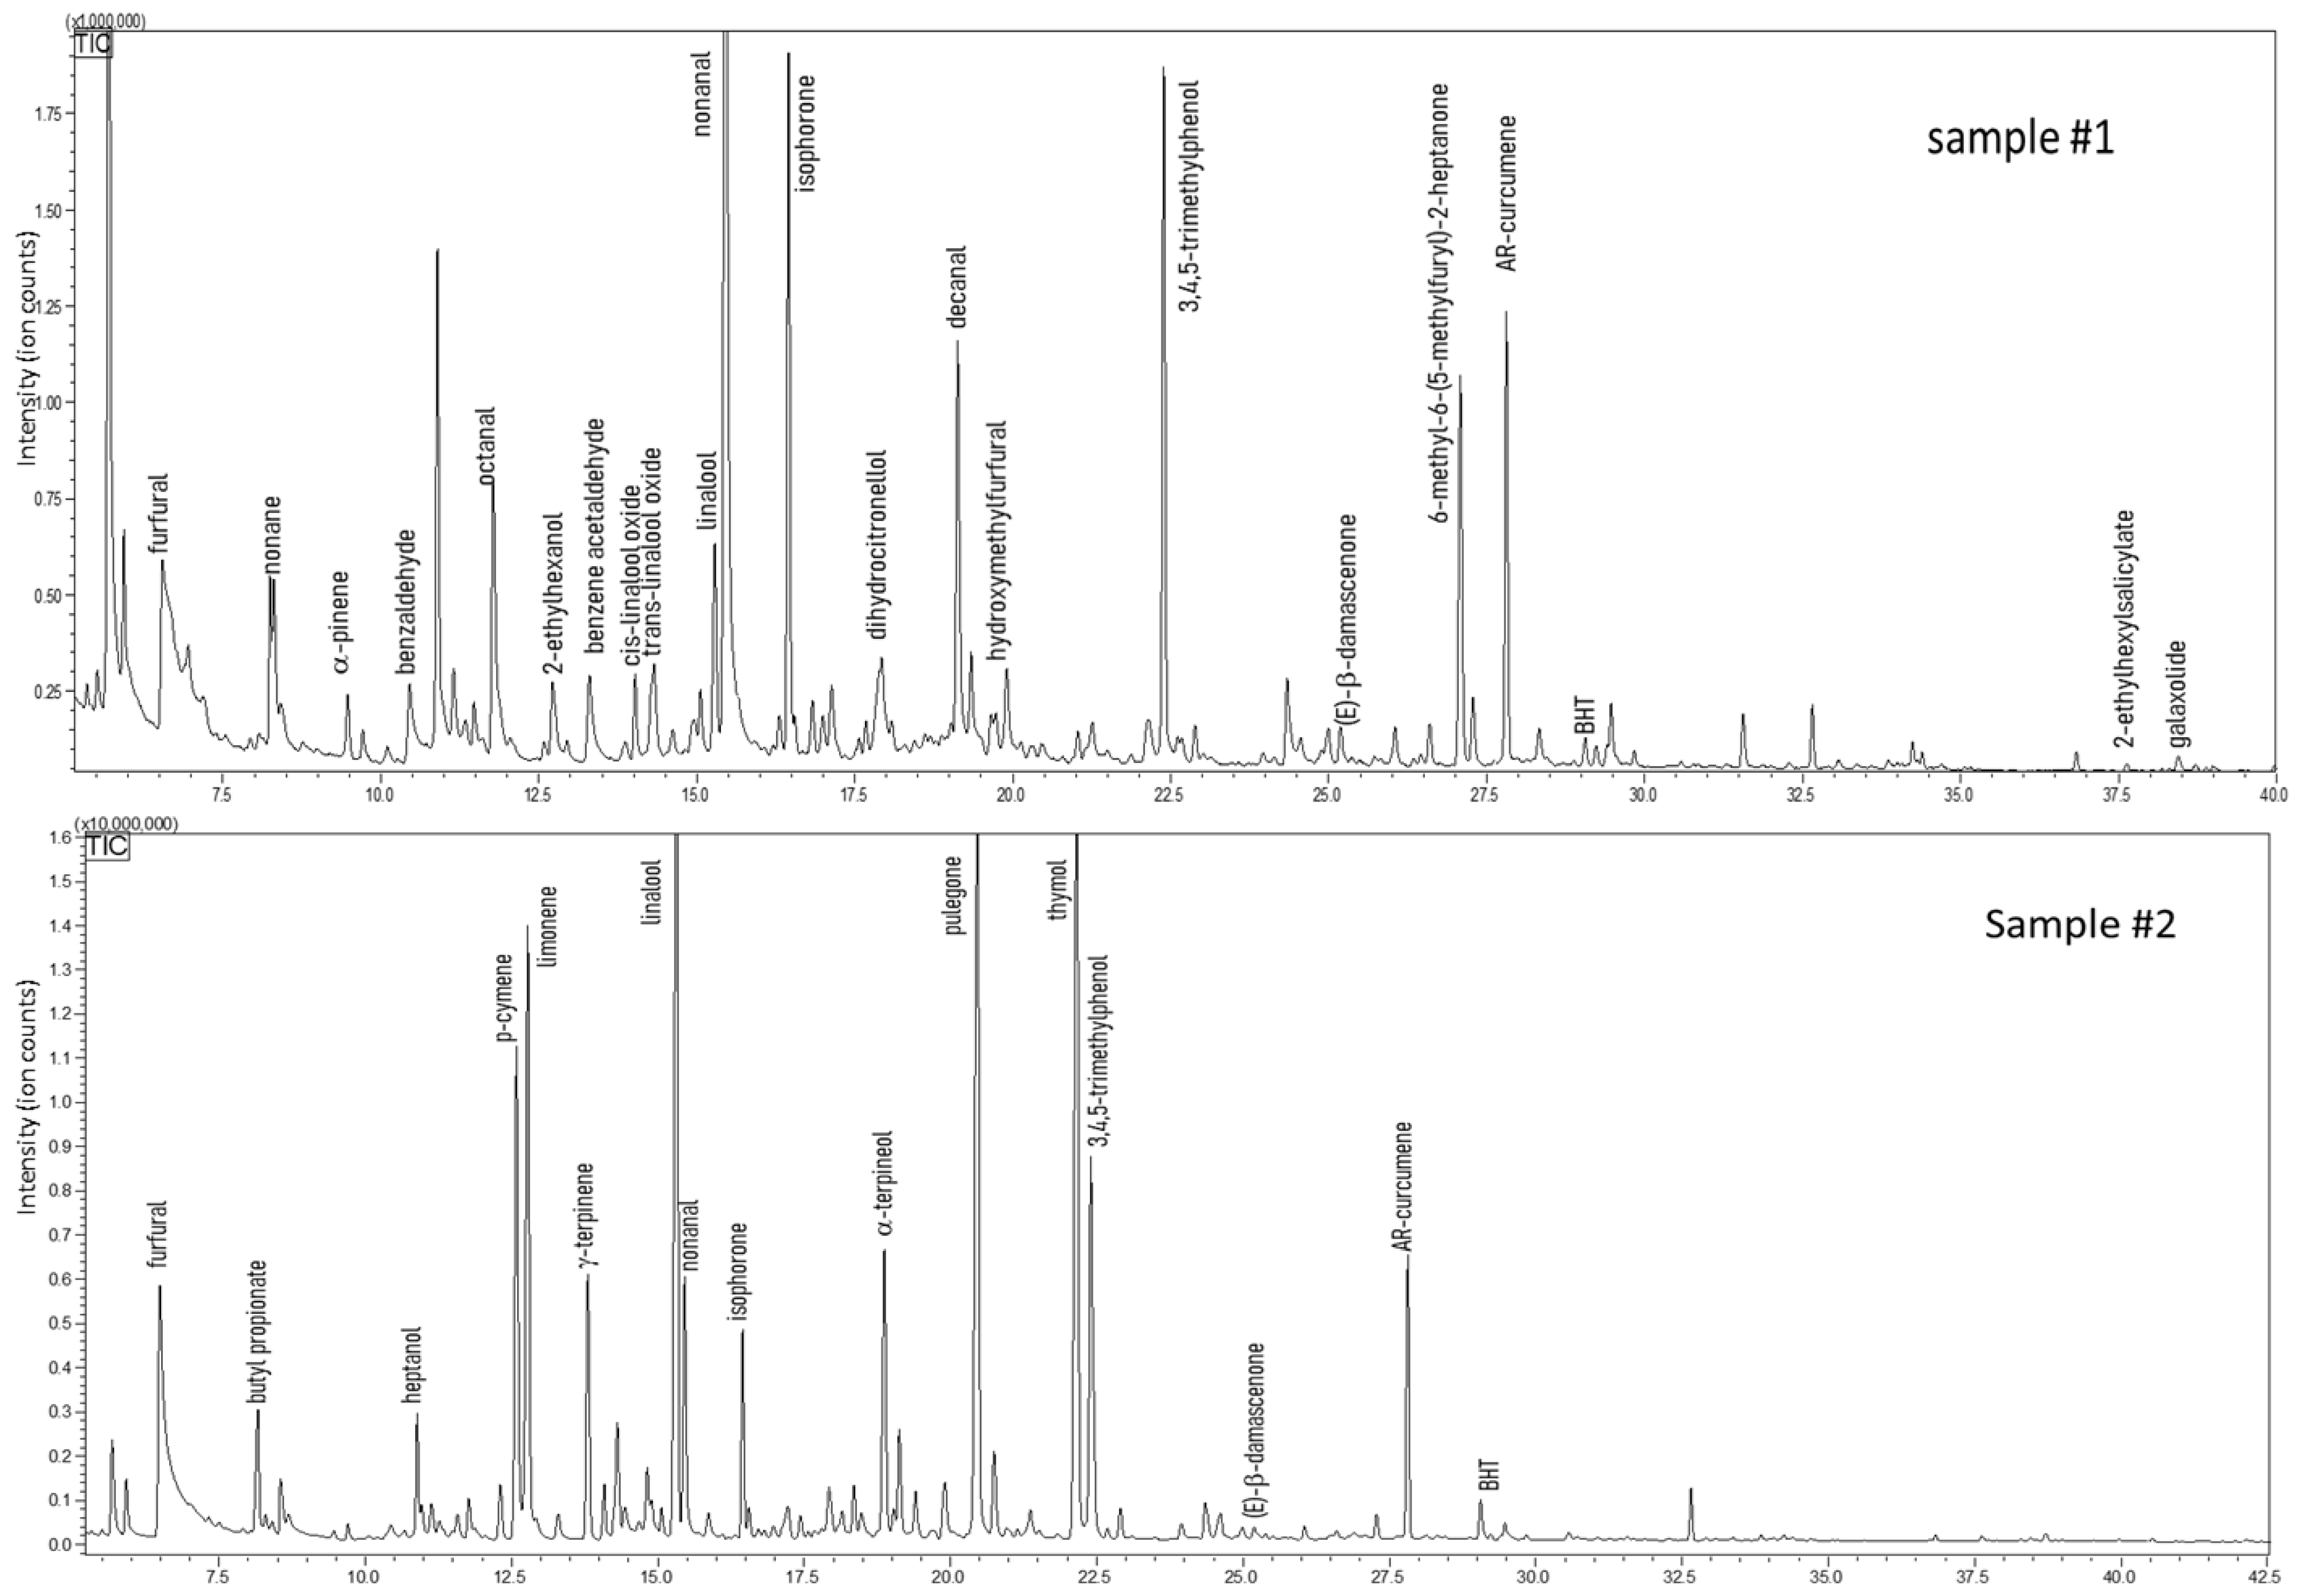
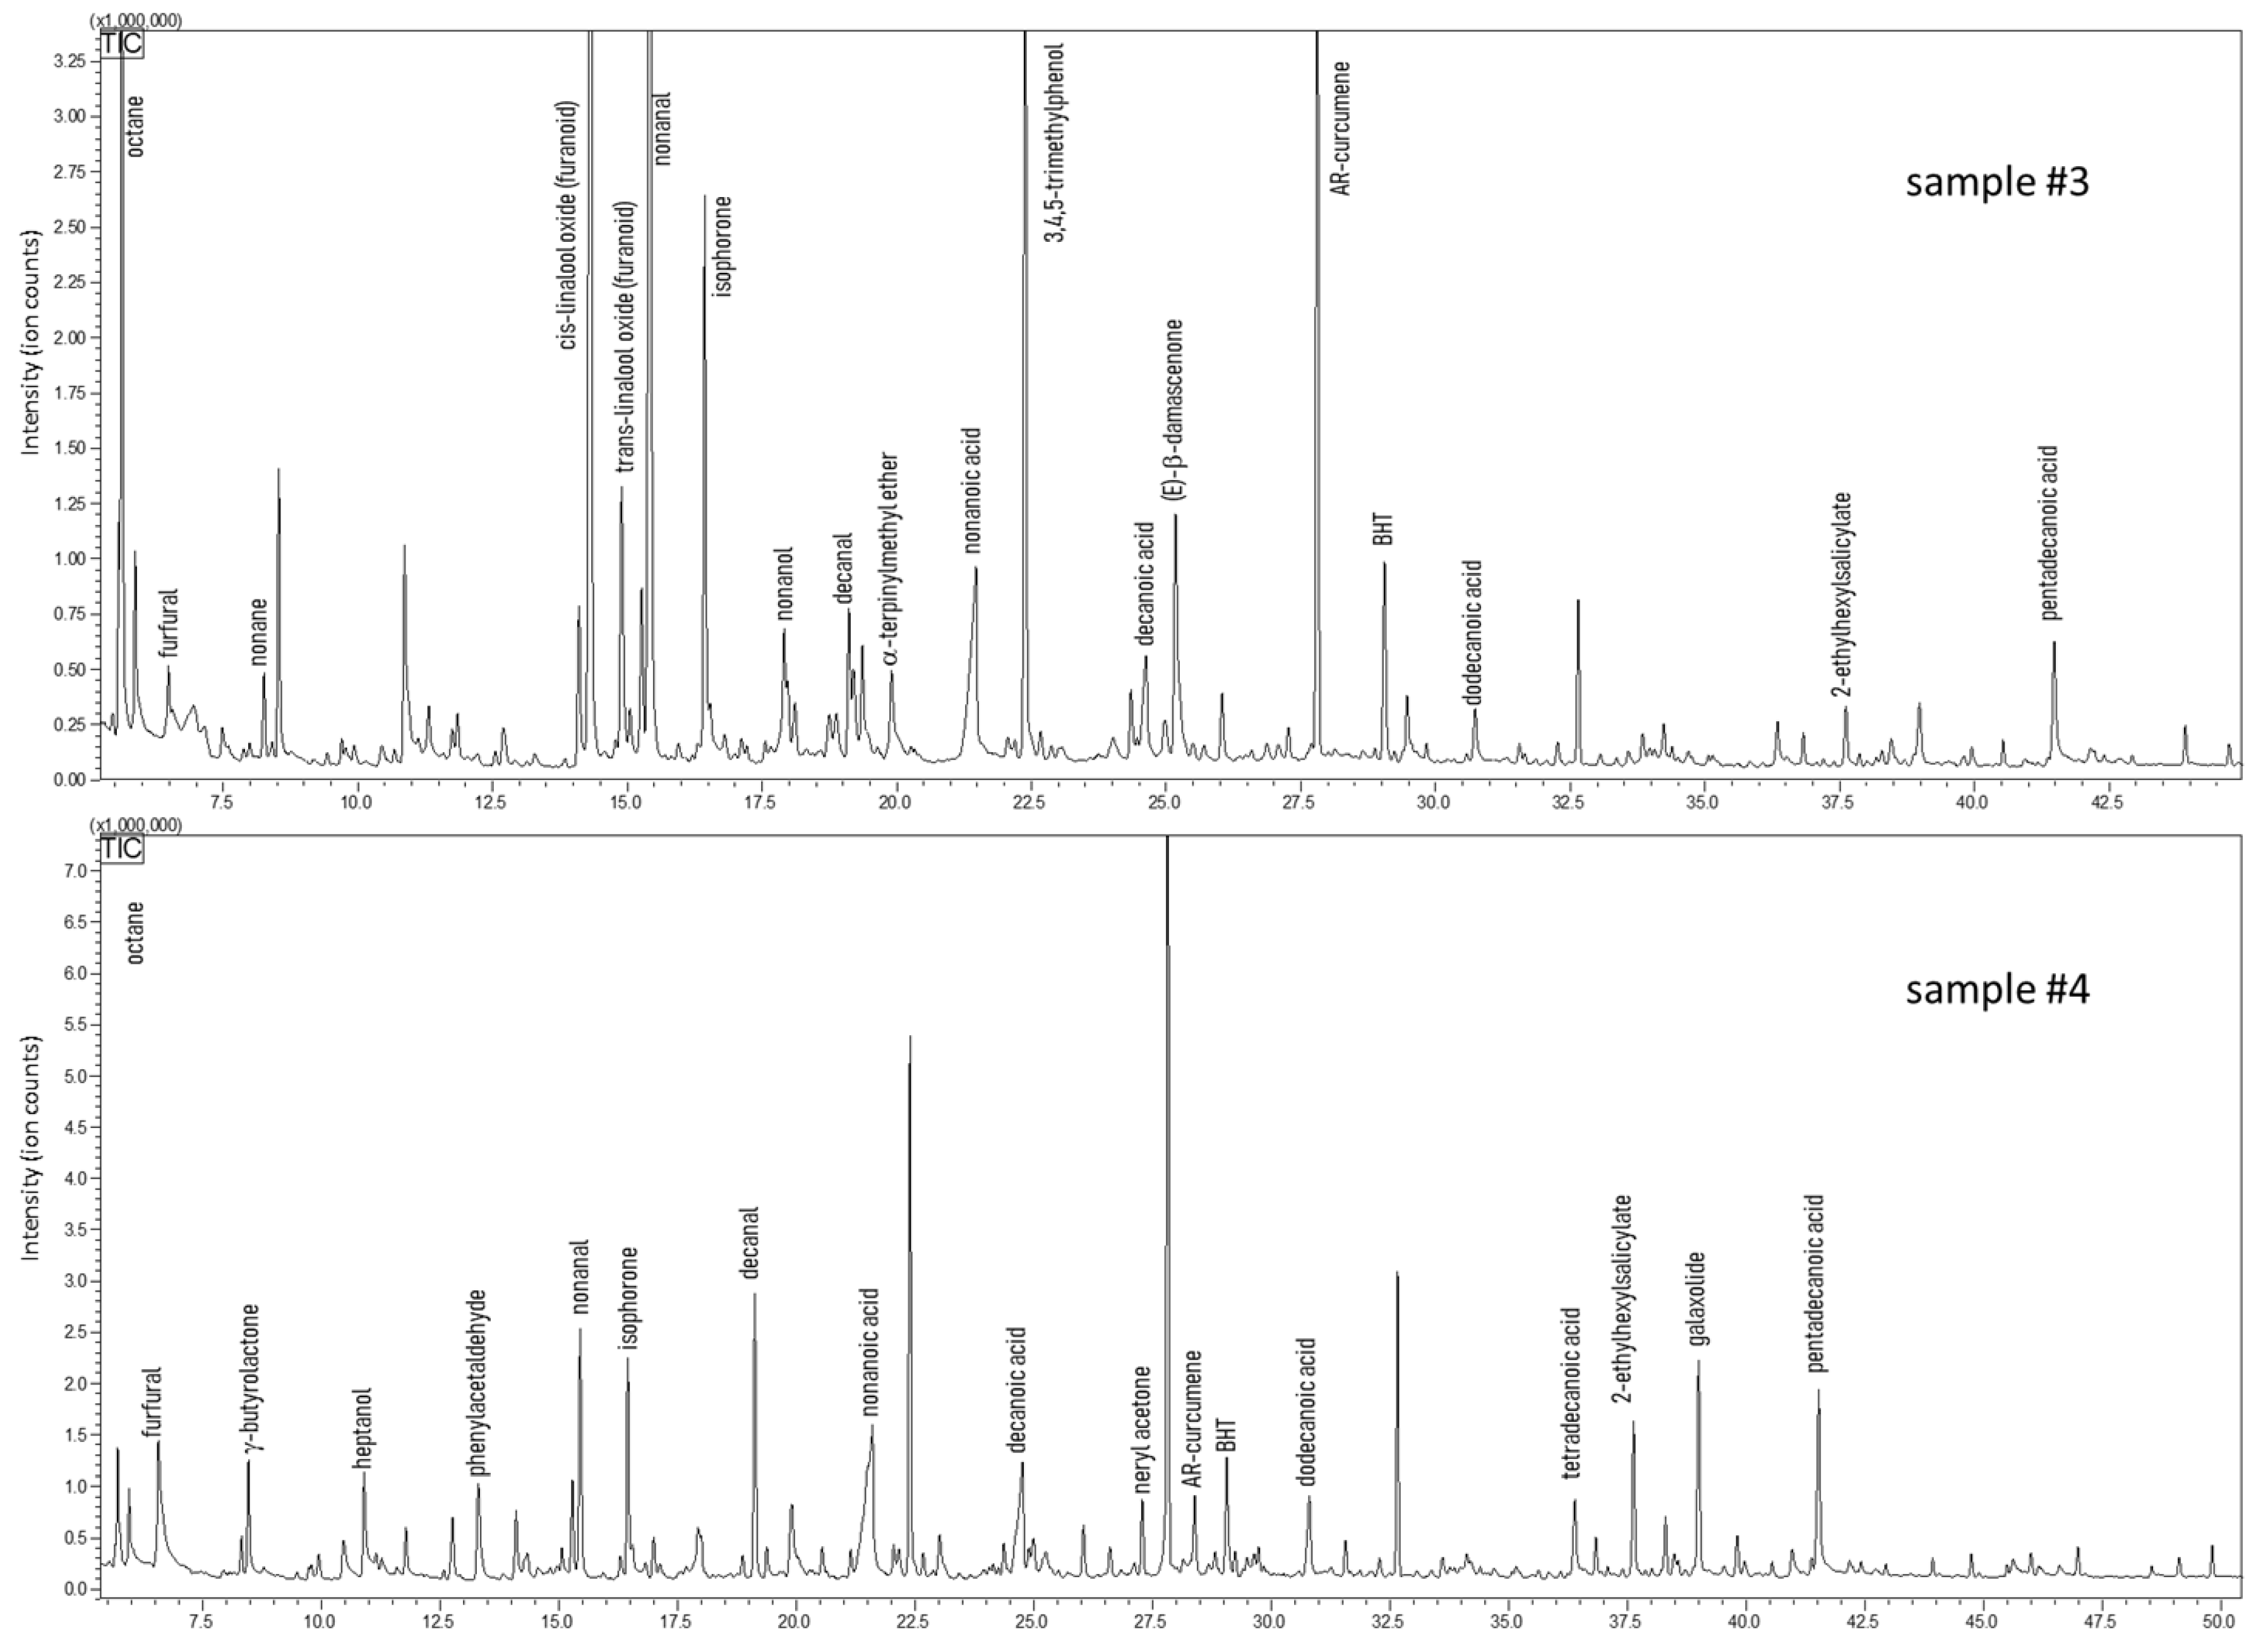
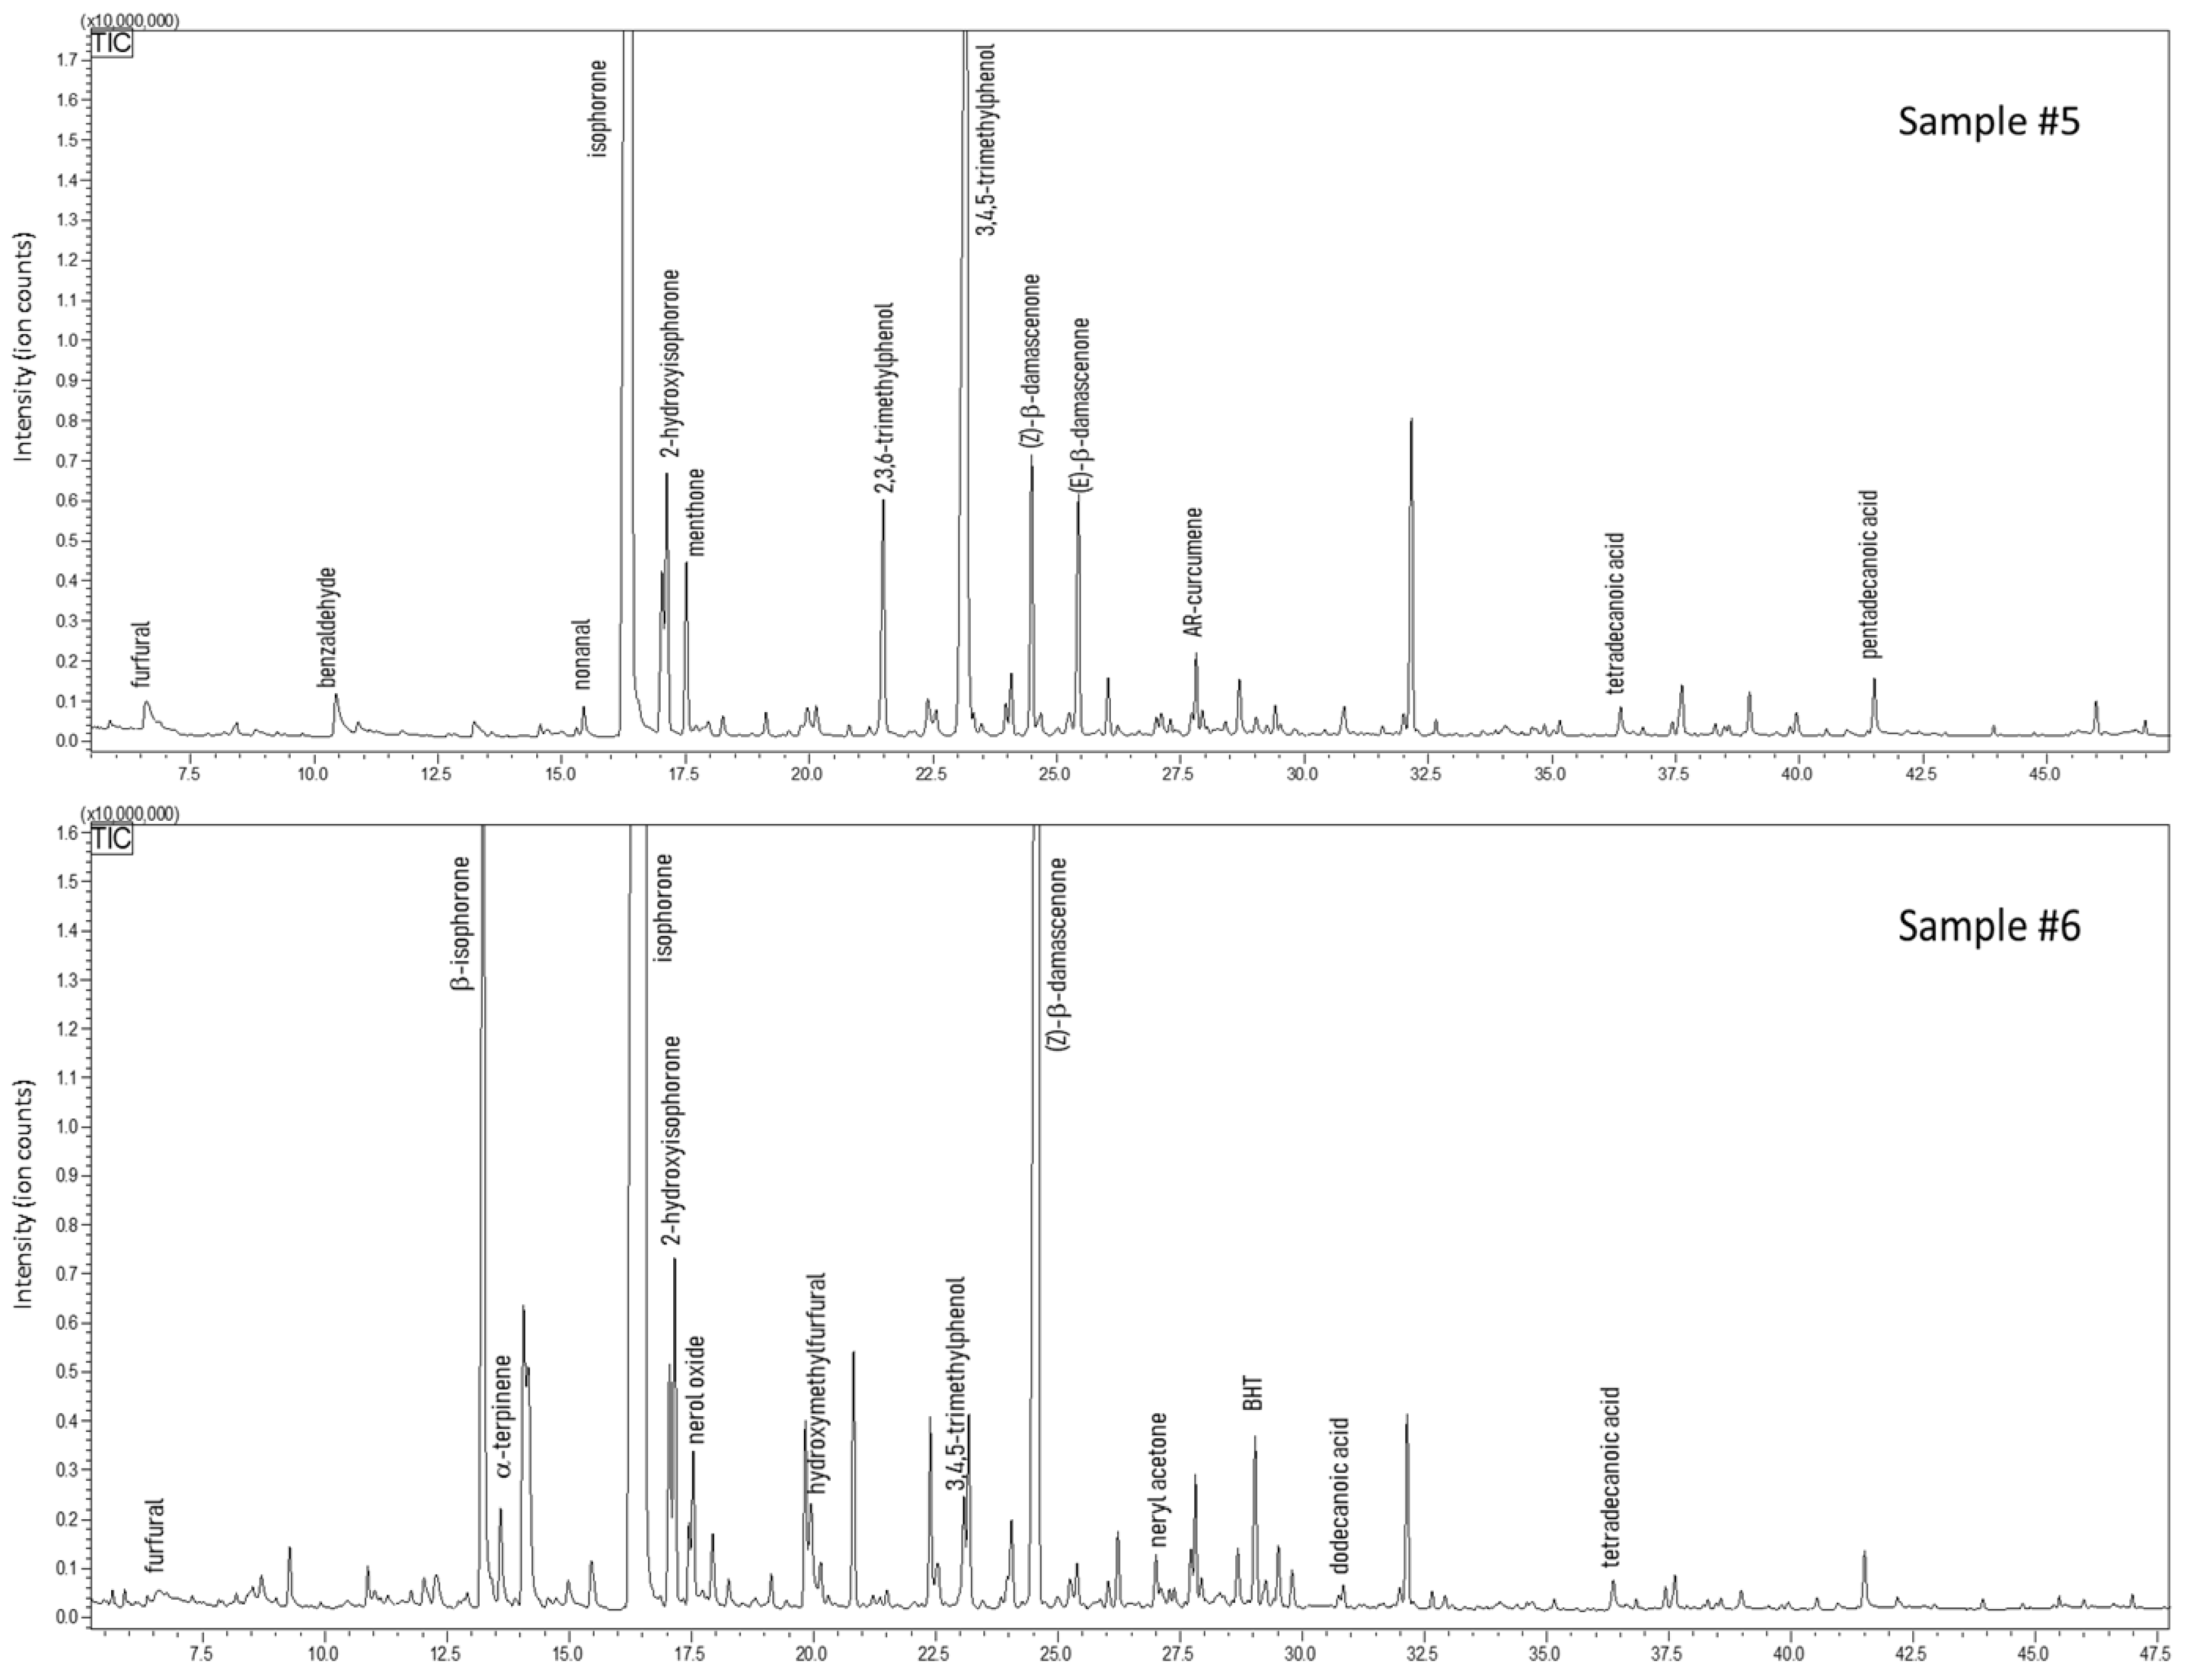
3.3. Volatiles Distribution
4. Conclusions
Supplementary Materials
Author Contributions
Funding
Data Availability Statement
Acknowledgments
 .
.Conflicts of Interest
References
- FAO; WHO. Codex Alimentarius—International Food Standards; Standard for honey CXS 12-1981. Adopted in 1981, amended in 2019; FAO: Rome, Italy; WHO: Genewa, Switzerland, 2019. [Google Scholar]
- Alvarez-Suarez, J.; Giampieri, F.; Battino, M. Honey as a Source of Dietary Antioxidants: Structures, Bioavailability and Evidence of Protective Effects Against Human Chronic Diseases. CMC 2013, 20, 621–638. [Google Scholar] [CrossRef] [PubMed]
- Pichichero, E.; Cicconi, R.; Mattei, M.; Muzi, M.G.; Canini, A. Acacia Honey and Chrysin Reduce Proliferation of Melanoma Cells through Alterations in Cell Cycle Progression. Int. J. Oncol. 2010, 37, 973–981. [Google Scholar] [CrossRef] [PubMed] [Green Version]
- Schramm, D.D.; Karim, M.; Schrader, H.R.; Holt, R.R.; Cardetti, M.; Keen, C.L. Honey with High Levels of Antioxidants Can Provide Protection to Healthy Human Subjects. J. Agric. Food Chem. 2003, 51, 1732–1735. [Google Scholar] [CrossRef]
- Statista. Available online: www.statista.com (accessed on 20 September 2022).
- Becerril-Sánchez, A.L.; Quintero-Salazar, B.; Dublán-García, O.; Escalona-Buendía, H.B. Phenolic Compounds in Honey and Their Relationship with Antioxidant Activity, Botanical Origin, and Color. Antioxidants 2021, 10, 1700. [Google Scholar] [CrossRef]
- Machado, A.M.; Miguel, M.G.; Vilas-Boas, M.; Figueiredo, A.C. Honey Volatiles as a Fingerprint for Botanical Origin—A Review on Their Occurrence on Monofloral Honeys. Molecules 2020, 25, 374. [Google Scholar] [CrossRef] [PubMed] [Green Version]
- Lazarević, K.B.; Jovetić, M.S.; Tešić, Ž.L. Physicochemical Parameters as a Tool for the Assessment of Origin of Honey. J. AOAC Int. 2017, 100, 840–851. [Google Scholar] [CrossRef]
- Pita-Calvo, C.; Vázquez, M. Honeydew Honeys: A Review on the Characterization and Authentication of Botanical and Geographical Origins. J. Agric. Food Chem. 2018, 66, 2523–2537. [Google Scholar] [CrossRef]
- Siddiqui, A.J.; Musharraf, S.G.; Choudhary, M.I.; Rahman, A.-U. Application of Analytical Methods in Authentication and Adulteration of Honey. Food Chem. 2017, 217, 687–698. [Google Scholar] [CrossRef]
- Plutowska, B.; Chmiel, T.; Dymerski, T.; Wardencki, W. A headspace solid-phase microextraction method development and its application in the determination of volatiles in honeys by gas chromatography. Food Chem. 2011, 126, 1288–1298. [Google Scholar] [CrossRef]
- Mădaş, N.M.; Mărghitaş, L.A.; Dezmirean, D.S.; Bonta, V.; Bobiş, O.; Fauconnier, M.L.; Francis, F.; Haubruge, E.; Nguyen, K.B. Volatile Profile and Physico-Chemical Analysis of Acacia Honey for Geographical Origin and Nutritional Value Determination. Foods 2019, 8, 445. [Google Scholar] [CrossRef]
- Piasenzotto, L.; Gracco, L.; Conte, L. Solid phase microextraction (SPME) applied to honey quality control. J. Sci. Food Agric. 2003, 83, 1037–1044. [Google Scholar] [CrossRef]
- Soria, A.C.; Sanz, J.; Martínez-Castro, I. SPME followed by GC–MS: A powerful technique for qualitative analysis of honey volatiles. Eur. Food Res. Technol. 2009, 228, 579–590. [Google Scholar] [CrossRef] [Green Version]
- Andrade, P.; Ferreres, F.; Amaral, M.T. Analysis of Honey Phenolic Acids by HPLC, Its Application to Honey Botanical Characterization. J. Liq. Chromatogr. Relat. Technol. 1997, 20, 2281–2288. [Google Scholar] [CrossRef]
- Kozłowicz, K.; Różyło, R.; Gładyszewska, B.; Matwijczuk, A.; Gładyszewski, G.; Chocyk, D.; Samborska, K.; Piekut, J.; Smolewska, M. Identification of sugars and phenolic compounds in honey powders with the use of GC–MS, FTIR spectroscopy, and X-ray diffraction. Sci. Rep. 2020, 10, 16269. [Google Scholar] [CrossRef]
- Ristivojević, P.; Trifković, J.; Gašić, U.; Andrić, F.; Nedić, N.; Tešić, Ž.; Milojković-Opsenica, D. Ultrahigh-performance Liquid Chromatography and Mass Spectrometry (UHPLC–LTQ/Orbitrap/MS/MS) Study of Phenolic Profile of Serbian Poplar Type Propolis. Phytochem. Anal. 2015, 26, 127–136. [Google Scholar] [CrossRef] [PubMed]
- Biesaga, M.; Pyrzyńska, K. Stability of bioactive polyphenols from honey during different extraction methods. Food Chem. 2013, 136, 46–54. [Google Scholar] [CrossRef]
- Giordano, A.; Retamal, M.; Fuentes, E.; Ascar, L.; Velásquez, P.; Rodríguez, K.; Montenegro, G. Rapid Scanning of the Origin and Antioxidant Potential of Chilean Native Honey Through Infrared Spectroscopy and Chemometrics. Food Anal. Methods 2019, 12, 1511–1519. [Google Scholar] [CrossRef]
- Svecnjak, L.; Prđun, S.; Rogina, J.; Bubalo, D.; Jerkovic, I. Characterization of Satsuma mandarin (Citrus unshiu Marc.) nectar-to-honey transformation pathway using FTIR-ATR spectroscopy. Food Chem. 2017, 232, 286–294. [Google Scholar] [CrossRef] [PubMed]
- Bunaciu, A.A.; Aboul-Enein, H.Y. Honey Discrimination Using Fourier Transform-Infrared Spectroscopy. Chemistry 2022, 4, 848–854. [Google Scholar] [CrossRef]
- López, B.; Latorre, M.J.; Fernández, M.I.; García, M.A.; García, S.; Herreroa, C. Chemometric classification of honeys according to their type based on quality control data. Food Chem. 1996, 55, 281–287. [Google Scholar] [CrossRef]
- Anguebes-Franseschi, F.; Abatal, M.; Pat, L.; Flores, A.; Córdova Quiroz, A.V.; Ramírez-Elias, M.A.; San Pedro, L.; May Tzuc, O.; Bassam, A. Raman Spectroscopy and Chemometric Modeling to Predict Physical-Chemical Honey Properties from Campeche, Mexico. Molecules 2019, 24, 4091. [Google Scholar] [CrossRef] [Green Version]
- Yücel, Y.; Sultanoğlu, P. Characterization of Hatay honeys according to their multi-element analysis using ICP-OES combined with chemometrics. Food Chem. 2013, 140, 231–237. [Google Scholar] [CrossRef] [PubMed]
- Antonova, O.; Calvo, J.; Seifert, A. Rapid Detection of Thermal Treatment of Honey by Chemometrics-Assisted FTIR Spectroscopy. Foods 2021, 10, 2892. [Google Scholar] [CrossRef]
- Dos Santos, A.C.; Biluca, F.C.; Braghini, F.; Gonzaga, L.V.; Costa, A.C.O.; Fett, R. Phenolic Composition and Biological Activities of Stingless Bee Honey: An Overview Based on Its Aglycone and Glycoside Compounds. Food Res. Int. 2021, 147, 110553. [Google Scholar] [CrossRef] [PubMed]
- Seraglio, S.K.T.; Schulz, M.; Brugnerotto, P.; Silva, B.; Gonzaga, L.V.; Fett, R.; Costa, A.C.O. Quality, Composition and Health-Protective Properties of Citrus Honey: A Review. Food Res. Int. 2021, 143, 110268. [Google Scholar] [CrossRef] [PubMed]
- Bobis, O.; Moise, A.R.; Ballesteros, I.; Reyes, E.S.; Durán, S.S.; Sánchez-Sánchez, J.; Cruz-Quintana, S.; Giampieri, F.; Battino, M.; Alvarez-Suarez, J.M. Eucalyptus Honey: Quality Parameters, Chemical Composition and Health-Promoting Properties. Food Chem. 2020, 325, 126870. [Google Scholar] [CrossRef]
- Alvarez-Suarez, J.; Gasparrini, M.; Forbes-Hernández, T.; Mazzoni, L.; Giampieri, F. The Composition and Biological Activity of Honey: A Focus on Manuka Honey. Foods 2014, 3, 420–432. [Google Scholar] [CrossRef] [Green Version]
- Wedmore, E.B. The Accurate Determination of the Water Content of Honeys: Part I. Introduction and Results. Bee World 1955, 36, 197–206. [Google Scholar] [CrossRef]
- Harmonized Methods of the International Honey Commission. Available online: www.ihc-platform.net/ihcmethods2009.pdf (accessed on 2 December 2022).
- Louveaux, J.; Pourtallier, M.P.; Vorwohl, G. Méthodes d’analyses des miels. Conductivité. Bull. Apic. 1973, 16, 1–3. [Google Scholar]
- AOAC. Official Methods of Analysis, Acidity of Honey; AOAC: Rockwille, MD, USA, 1990; Volume 962, p. 1033. [Google Scholar]
- Phadebas. Available online: https://www.phadebas.com/products/honey-diastase-test-products/ (accessed on 2 December 2022).
- U.S. EPA. Method 7473 (SW-846): Mercury in Solids and Solutions by Thermal Decomposition, Amalgamation, and Atomic Absorption Spectrophotometry; U.S. EPA: Washington, DC, USA, 1998.
- Machado De-Melo, A.A.; de Almeida-Muradian, L.B.; Sancho, M.T.; Pascual-Maté, A. Composition and Properties of Apis Mellifera Honey: A Review. J. Apic. Res. 2018, 57, 5–37. [Google Scholar] [CrossRef]
- Bettar, I.; González-Miret, M.L.; Hernanz, D.; Marconi, A.; Heredia, F.J.; Terrab, A. Characterisation of Moroccan Spurge (Euphorbia) Honeys by Their Physicochemical Characteristics, Mineral Contents and Colour. Arab. J. Chem. 2019, 12, 2052–2060. [Google Scholar] [CrossRef]
- Shafiiq Kinoo, M.; Fawzi Mahomoodally, M.; Puchooa, D. Anti-Microbial and Physico-Chemical Properties of Processed and Raw Honeys of Mauritius. Adv. Infect. Dis. 2012, 2, 25–36. [Google Scholar] [CrossRef]
- Nikolova, K.; Panchev, I.; Sainov, S.; Gentscheva, G.; Ivanova, E. Selected Physical Properties of Lime Bee Honey in Order to Discriminate between Pure Honey and Honey Adulterated with Glucose. Int. J. Food Prop. 2012, 15, 1358–1368. [Google Scholar] [CrossRef]
- Ferrauto, G.; Pavone, P. Palynological, Physico-Chemical and Organoleptic Characteristics of Carob Tree (Ceratonia siliqua L.) Honey from Sicily. Int. J. Food Sci. Technol. 2013, 48, 1596–1602. [Google Scholar] [CrossRef]
- Schade, J.E.; Marsh, G.L.; Eckert, J.E. Diastase activity and hydroxy-methyl-furfural in honey and their usefulness in detecting heat alteration. J. Food Sci. 1958, 23, 446–463. [Google Scholar] [CrossRef]
- Szliszka, E.; Czuba, Z.; Domino, M.; Mazur, B.; Zydowicz, G.; Krol, W. Ethanolic Extract of Propolis (EEP) Enhances the Apoptosis-Inducing Potential of TRAIL in Cancer Cells. Molecules 2009, 14, 738–754. [Google Scholar] [CrossRef]
- Singh, I.; Singh, S. Honey Moisture Reduction and Its Quality. J. Food Sci. Technol. 2018, 55, 3861–3871. [Google Scholar] [CrossRef]
- Gürbüz, S.; Çakıcı, N.; Mehmetoğlu, S.; Atmaca, H.; Demir, T.; Arıgül Apan, M.; Atmaca, Ö.F.; Güney, F. Physicochemical Quality Characteristics of Southeastern Anatolia Honey, Turkey. Int. J. Anal. Chem. 2020, 2020, 8810029. [Google Scholar] [CrossRef]
- Bogdanov, S.; Lüllmann, C.; Martin, P.; von der Ohe, W.; Russmann, H.; Vorwohl, G.; Oddo, L.P.; Sabatini, A.-G.; Marcazzan, G.L.; Piro, R.; et al. Honey Quality and International Regulatory Standards: Review by the International Honey Commission. Bee World 1999, 80, 61–69. [Google Scholar] [CrossRef]
- Bicudo de Almeida-Muradian, L.; Monika Barth, O.; Dietemann, V.; Eyer, M.; Freitas, A.D.S.D.; Martel, A.-C.; Marcazzan, G.L.; Marchese, C.M.; Mucignat-Caretta, C.; Pascual-Maté, A.; et al. Standard Methods for Apis mellifera Honey Research. J. Apic. Res. 2020, 59, 1–62. [Google Scholar] [CrossRef]
- Lovaković, B.T.; Lazarus, M.; Brčić Karačonji, I.; Jurica, K.; Živković Semren, T.; Lušić, D.; Brajenović, N.; Pelaić, Z.; Pizent, A. Multi-Elemental Composition and Antioxidant Properties of Strawberry Tree (Arbutus unedo L.) Honey from the Coastal Region of Croatia: Risk-Benefit Analysis. J. Trace Elem. Med. Biol. 2018, 45, 85–92. [Google Scholar] [CrossRef] [PubMed]
- Boutoub, O.; El-Guendouz, S.; Estevinho, L.M.; Paula, V.B.; Aazza, S.; El Ghadraoui, L.; Rodrigues, B.; Raposo, S.; Carlier, J.; Costa, M.C.; et al. Antioxidant Activity and Enzyme Inhibitory Potential of Euphorbia Resinifera and E. Officinarum Honeys from Morocco and Plant Aqueous Extracts. Environ. Sci. Pollut. Res. 2021, 28, 503–517. [Google Scholar] [CrossRef] [PubMed]
- Cicero, N.; Gervasi, T.; Durazzo, A.; Lucarini, M.; Macrì, A.; Nava, V.; Giarratana, F.; Tardugno, R.; Vadalà, R.; Santini, A. Mineral and Microbiological Analysis of Spices and Aromatic Herbs. Foods 2022, 11, 548. [Google Scholar] [CrossRef]
- Mottese, A.F.; Naccari, C.; Vadalà, R.; Bua, G.D.; Bartolomeo, G.; Rando, R.; Cicero, N.; Dugo, G. Traceability of Opuntia ficus-indica L. Miller by ICP-MS multi-element profile and chemometric approach. J. Sci. Food Agric. 2018, 98, 198–204. [Google Scholar] [CrossRef] [PubMed]
- Solayman, M.; Islam, M.A.; Paul, S.; Ali, Y.; Khalil, M.I.; Alam, N.; Gan, S.H. Physicochemical Properties, Minerals, Trace Elements, and Heavy Metals in Honey of Different Origins: A Comprehensive Review. Compr. Rev. Food Sci. Food Saf. 2016, 15, 219–233. [Google Scholar] [CrossRef]
- Fernandeztorres, R.; Perezbernal, J.; Bellolopez, M.; Callejonmochon, M.; Jimenezsanchez, J.; Guiraumperez, A. Mineral Content and Botanical Origin of Spanish Honeys. Talanta 2005, 65, 686–691. [Google Scholar] [CrossRef] [PubMed]
- Pisani, A.; Protano, G.; Riccobono, F. Minor and Trace Elements in Different Honey Types Produced in Siena County (Italy). Food Chem. 2008, 107, 1553–1560. [Google Scholar] [CrossRef]
- El-Haskoury, R.; Kriaa, W.; Lyoussi, B.; Makni, M. Ceratonia siliqua Honeys from Morocco: Physicochemical Properties, Mineral Contents, and Antioxidant Activities. J. Food Drug Anal. 2018, 26, 67–73. [Google Scholar] [CrossRef]
- Karabagias, I.K.; Louppis, A.P.; Badeka, A.; Papastephanou, C.; Kontominas, M.G. Nutritional Aspects and Botanical Origin Recognition of Mediterranean Honeys Based on the “mineral Imprint’’ with the Application of Supervised and Non-Supervised Statistical Techniques. Eur. Food Res. Technol. 2019, 245, 1939–1949. [Google Scholar] [CrossRef]
- Tariba, B. Metals in Wine—Impact on Wine Quality and Health Outcomes. Biol. Trace Elem. Res. 2011, 144, 143–156. [Google Scholar] [CrossRef]
- Fallah, A.; Mohammad-Hasani, A.; Hosseinzadeh Colagar, A. Zinc is an Essential Element for Male Fertility: A Review of Zn Roles in Men’s Health, Germination, Sperm Quality, and Fertilization. J. Reprod. Infertil. 2018, 19, 69–81. [Google Scholar] [PubMed]
- Yücel, Y.; Sultanoğlu, P. Determination of Industrial Pollution Effects on Citrus Honeys with Chemometric Approach. Food Chem. 2012, 135, 170–178. [Google Scholar] [CrossRef]
- FAOSTAT. Production Database from the Food and Agriculture Organization of the United Nations. 2019. Available online: http://www.fao.org/faostat (accessed on 19 August 2022).
- European Commission. 2015/1005 amending Regulation (EC) no 1881/2006 as regards maximum levels of lead in certain foodstuffs. Off. J. Eur. Union 2015, 58, 9–14. [Google Scholar]
- The European Parliament and the Council of the European Union. Directive 2014/63/EU of the European Parliament and of the Council of 15 May 2014 amending Council Directive 2001/110/EC relating to honey. Off. J. Eur. Union 2014, L164, 1–5. [Google Scholar]
- EFSA CONTAM Panel (EFSA Panel on Contaminants in the Food Chain). Scientific opinion on the risks to public health related to the presence of arsenic in food. EFSA J. 2009, 7, 1351. [Google Scholar]
- EFSA CONTAM Panel (EFSA Panel on Contaminants in the Food Chain). Scientific opinion on lead in food. EFSA J. 2010, 8, 1570. [Google Scholar]
- Sotiropoulou, N.S.; Xagoraris, M.; Revelou, P.K.; Kaparakou, E.; Kanakis, C.; Pappas, C.; Tarantilis, P. The Use of SPME-GC-MS IR and Raman Techniques for Botanical and Geographical Authentication and Detection of Adulteration of Honey. Foods 2021, 10, 1671. [Google Scholar] [CrossRef]
- Ozcan-Sinir, G.; Copur, O.U.; Barringer, S.A. Botanical and Geographical Origin of Turkish Honeys by Selected-ion Flo-tube Mass Spectrometry and Chemometrics. J. Sci. Food Agric. 2020, 100, 2198–2207. [Google Scholar] [CrossRef] [PubMed]
- European Commission Regulation (EC). No. 1333/2008 of the European Parliament and of the Council of 16 December 2008 on food additives. Off. J. Eur. Union 2008, L354, 16–33. [Google Scholar]
- Costa, R.; Mondello, L. Methods in Flavor and Fragrance Analysis. In Kirk-Othmer Encyclopedia; John Wiley & sons, Inc.: Hoboken, NJ, USA, 2016. [Google Scholar] [CrossRef]
- Costa, R.; De Grazia, S.; Grasso, E.; Trozzi, A. Headspace-Solid-Phase Microextraction-Gas Chromatography as Analytical Methodology for the Determination of Volatiles in Wild Mushrooms and Evaluation of Modifications Occurring during Storage. J. Anal. Methods Chem. 2015, 2015, 951748. [Google Scholar] [CrossRef]
- Tardugno, R.; Cicero, N.; Costa, R.; Nava, V.; Vadalà, R. Exploring Lignans, a Class of Health Promoting Compounds, in a Variety of Edible Oils from Brazil. Foods 2022, 11, 1386. [Google Scholar] [CrossRef] [PubMed]
- USDA. Extracted Honey Grading Manual; Standards for Honey Grading; USDA: Washington, DC, USA, 1985. Available online: https://www.ams.usda.gov/sites/default/files/media/Extracted_Honey_Inspection_Instructions%5B1%5D.pdf (accessed on 15 December 2022).


| Sample ID | Cooperative/Brand | Botanical Source | Place of Production | Year of Production |
|---|---|---|---|---|
| #1 | Rimota | Euphorbiaceae | Tiznit (Souss, South Morocco) | 2021 |
| #2 | Al baraka | Euphorbiaceae | Guelmin (South Morocco) | 2021 |
| #3 | Rimota | Ceratonia siliqua L. (carob tree) | Sidi Ifni (South Morocco) | 2021 |
| #4 | Al baraka | Ceratonia siliqua L. (carob tree) | Khenifra (Morocco) | 2021 |
| #5 | Miel factory | Arbutus unedo L. (strawberry tree) | La Balagne (Corse, France) | Not reported |
| #6 | Bellota | Arbutus unedo L. (strawberry tree) | Ouazzane (Morocco) | Not reported |
| Honey Samples | Free Acidity (meq·kg−1) | Combined Acidity (meq·kg−1) | Total Acidity (meq·kg−1) | pH |
|---|---|---|---|---|
| Euphorbia (sample #1) | 11.99 ± 2.63 | 12.15 ± 1.99 | 24.14 ± 1.91 | 4.47 ± 0.09 |
| Euphorbia (sample #2) | 13.65 ± 1.26 | 11.15 ± 1.44 | 24.32 ± 1.87 | 4.45 ± 0.27 |
| Carob (sample #3) | 29.15 ± 1.05 | 4.49 ± 2.64 | 33.65 ± 1.96 | 4.50 ± 0.11 |
| Carob (sample #4) | 13.65 ± 0.56 | 7.49 ± 0.33 | 21.15 ± 2.64 | 4.78 ± 0.08 |
| Arbutus (sample #5) | 18.81 ± 1.25 | 5.16 ± 2.92 | 23.98 ± 1.92 | 4.81 ± 0.21 |
| Arbutus (sample #6) | 10.33 ± 1.042 | 9.66 ± 2.19 | 20.01 ± 2.27 | 4.37 ± 0.16 |
| Honey Samples | Microelements Mean ± Standard Deviation | |||||||||||
|---|---|---|---|---|---|---|---|---|---|---|---|---|
| Li (mg∙kg−1) | Ba (mg∙kg−1) | Ni (mg∙kg−1) | Se (mg∙kg−1) | Sb (mg∙kg−1) | Sr (mg∙kg−1) | Cr (mg∙kg−1) | Cu (mg∙kg−1) | Pb (mg∙kg−1) | As (mg∙kg−1) | Cd (mg∙kg−1) | Hg (µg∙kg−1) | |
| Euphorbia (sample #1) | 0.035 ± 0.004 | 0.097 ± 0.003 | 0.051 ± 0.004 | 0.040 ± 0.003 | 0.095 ± 0.007 | 0.210 ± 0.006 | 0.091 ± 0.004 | 0.059 ± 0.003 | 0.023 ± 0.002 | <LOD | 0.010 ± 0.001 | 0.347 ± 0.001 |
| Euphorbia (sample #2) | 0.023 ± 0.003 | 0.092 ± 0.002 | 0.046 ± 0.005 | 0.044 ± 0.002 | 0.111 ± 0.004 | 0.195 ± 0.003 | 0.102 ± 0.003 | 0.039 ± 0.003 | 0.028 ± 0.001 | <LOD | 0.009 ± 0.002 | 0.217 ± 0.001 |
| Carob (sample #3) | <LOD | 0.066 ± 0.002 | 0.108 ± 0.006 | 0.033 ± 0.002 | 0.086 ± 0.008 | 0.158 ± 0.004 | 0.053 ± 0.002 | 0.569 ± 0.007 | 0.028 ± 0.006 | <LOD | 0.030 ± 0.005 | 1.485 ± 0.002 |
| Carob (sample #4) | <LOD | 0.064 ± 0.002 | 0.083 ± 0.005 | 0.034 ± 0.002 | 0.102 ± 0.002 | 0.173 ± 0.003 | 0.065 ± 0.002 | 0.699 ± 0.011 | 0.067 ± 0.006 | <LOD | 0.021 ± 0.005 | 0.126 ± 0.002 |
| Arbutus (sample #5) | <LOD | 0.034 ± 0.003 | 0.031 ± 0.006 | 0.043 ± 0.002 | 0.118 ± 0.003 | 0.134 ± 0.004 | 0.037 ± 0.003 | 0.031 ± 0.002 | <LOD | <LOD | <LOD | 0.352 ± 0.002 |
| Arbutus (sample #6) | <LOD | 0.033 ± 0.003 | 0.026 ± 0.003 | 0.034 ± 0.002 | 0.126 ± 0.005 | 0.126 ± 0.004 | 0.039 ± 0.004 | 0.038 ± 0.003 | <LOD | <LOD | <LOD | 0.274 ± 0.002 |
| LOD (μg/Kg) | 0.001 | 0.004 | 0.001 | 0.042 | 0.002 | 0.003 | 0.001 | 0.014 | 0.002 | 0.001 | 0.001 | 0.001 |
| RIexp | RIdb | Compound | Sample #1 | Sample #2 | Sample #3 | Sample #4 | Sample #5 | Sample #6 |
|---|---|---|---|---|---|---|---|---|
| 782 | 788 | Octene | 0.41 ± 0.01 | - | - | - | - | - |
| 800 | 800 | Octane | 22.01 ± 0.15 | 2.51 ± 0.11 | 24.01 ± 1.42 | 10.09 ± 0.24 | - | - |
| 839 | 842 | Isovaleric acid | - | - | 0.18 ± 0.01 | - | - | - |
| 846 | 845 | Furfural | 0.69 ± 0.05 | 6.10 ± 0.19 | 1.41 ± 0.39 | 2.57 ± 0.16 | 0.16 ± 0.02 | 0.02 ± 0.00 |
| 812 | 814 | Ethyl lactate | - | - | - | - | - | 0.17 ± 0.02 |
| 864 | 863 | Hexanol | - | - | 2.15 ± 0.19 | - | - | - |
| 866 | 865 | Butyrone | - | - | 0.35 ± 0.02 | - | - | - |
| 882 | 885 | Ethyl butyl ketone | - | 0.06 ± 0.01 | - | - | - | - |
| 900 | 900 | Nonane | 2.03 ± 0.12 | 0.24 ± 0.04 | 0.69 ± 0.04 | 3.33 ± 0.36 | - | - |
| 904 | 906 | Heptanal | 1.10 ± 0.14 | - | - | - | - | - |
| 910 | 907 | Butyl propionate | - | 0.81 ± 0.05 | - | - | - | - |
| 913 | 909 | 2-Acetylfuran | 0.31 ± 0.04 | - | - | - | 0.21 ± 0.02 | - |
| 914 | 913 | 2-Heptanol | - | - | 0.31 ± 0.06 | - | - | - |
| 930 | 932 | α-Pinene | 2.55 ± 0.13 | 0.10 ± 0.03 | 0.23 ± 0.03 | 0.12 ± 0.03 | - | - |
| 935 | 941 | γ-Butyrolactone | - | - | - | 1.28 ± 0.23 | 0.07 ± 0.02 | - |
| 939 | 942 | 2-Methylpropylbutyrate | - | - | 0.33 ± 0.04 | - | - | - |
| 958 | 960 | Benzaldehyde | 0.39 ± 0.08 | 0.17 ± 0.02 | 0.87 ± 0.08 | 1.26 ± 0.13 | 0.29 ± 0.03 | 0.01 ± 0.01 |
| 962 | 959 | Heptanol | - | 0.10 ± 0.02 | 0.68 ± 0.04 | 0.44 ± 0.06 | - | - |
| 973 | 968 | Bois de rose oxide | - | 0.47 ± 0.05 | - | - | - | - |
| 981 | 986 | 6-Methyl-5-hepten-2-one | 0.26 ± 0.03 | 0.37 ± 0.03 | - | 0.26 ± 0.04 | - | - |
| 992 | 991 | trans-Dehydrolinalool oxide | - | 0.28 ± 0.02 | - | - | - | - |
| 994 | 991 | Myrcene | - | - | - | 0.16 ± 0.02 | - | - |
| 994 | 991 | 2-Pentylfuran | 0.47 ± 0.05 | - | - | - | - | 0.18 ± 0.04 |
| 980 | 978 | β-Pinene | - | - | - | - | - | 0.30 ± 0.06 |
| 991 | 994 | Mesitylene | - | 0.18 ± 0.04 | - | - | - | - |
| 997 | 1000 | δ-2-Carene | - | - | - | - | - | 0.06 ± 0.02 |
| 1008 | 1006 | Octanal | 3.01 ± 0.13 | 0.90 ± 0.06 | - | 1.98 ± 0.13 | 0.21 ± 0.03 | - |
| 1010 | 1008 | δ-3-Carene | 0.48 ± 0.04 | - | - | - | - | - |
| 1020 | 1018 | α-Terpinene | - | 0.77 ± 0.08 | - | - | - | 0.45 ± 0.08 |
| 1026 | 1025 | p-Cymene | 0.23 ± 0.04 | 9.22 ± 0.23 | 0.16 ± 0.02 | 1.16 ± 0.13 | - | - |
| 1030 | 1030 | Limonene | - | 13.30 ± 0.34 | - | 5.61 ± 0.34 | - | - |
| 1032 | 1030 | 2-Ethylhexanol | 1.66 ± 0.29 | - | 1.18 ± 0.19 | - | - | - |
| 1032 | 1032 | Eucalyptol | 1.39 ± 0.17 | - | - | - | - | - |
| 1034 | 1035 | (Z)-β-Ocimene | - | 0.16 ± 0.04 | - | 0.11 ± 0.01 | - | - |
| 1037 | 1036 | Phenylacetaldehyde | 1.25 ± 0.07 | 0.24 ± 0.04 | 0.20 ± 0.03 | 0.84 ± 0.08 | 0.27 ± 0.05 | - |
| 1052 | 1054 | γ-Terpinene | - | 5.40 ± 0.22 | - | - | - | - |
| 1061 | 1059 | (2E)-Octenal | - | - | - | - | - | - |
| 1066 | 1069 | cis-Sabinene hydrate | - | - | - | - | - | - |
| 1069 | 1069 | cis-Linalool oxide | 0.58 ± 0.09 | 0.81 ± 0.04 | 13.30 ± 0.27 | - | - | - |
| 1080 | 1076 | Octanol | 1.02 ± 0.09 | - | - | - | - | - |
| 1086 | 1084 | trans-Linalool oxide | 1.85 ± 0.20 | - | 2.56 ± 0.10 | - | - | - |
| 1089 | 1086 | Terpinolene | - | 1.50 ± 0.11 | - | 1.21 ± 0.25 | 0.14 ± 0.02 | - |
| 1090 | 1084 | 3-Acetyl-2,5-dimethylfuran | - | - | - | - | 0.04 ± 0.01 | 0.02 ± 0.01 |
| 1092 | 1088 | Butyric anhydride | - | - | 0.40 ± 0.04 | - | - | - |
| 1095 | 1090 | Heptylmethyl ketone | - | - | - | 0.37 ± 0.02 | - | - |
| 1103 | 1101 | Linalool | 2.01 ± 0.10 | 12.59 ± 0.41 | 2.34 ± 0.47 | 6.07 ± 0.27 | - | - |
| 1111 | 1107 | Nonanal | 19.25 ± 0.64 | 4.78 ± 0.29 | 16.04 ± 0.54 | 8.13 ± 0.22 | 1.32 ± 0.13 | 0.30 ± 0.08 |
| 1048 | 1044 | β-Isophorone | - | - | - | - | - | 14.19 ± 0.29 |
| 1120 | 1116 | Phenylethanol | - | 0.12 ± 0.02 | - | - | - | - |
| 1125 | 1123 | Isophorone | 1.91 ± 0.12 | 0.21 ± 0.04 | 0.39 ± 0.04 | 0.91 ± 0.06 | 71.39 ± 0.55 | 60.90 ± 0.43 |
| 1142 | 1140 | 4-Ketoisophorone | 1.07 ± 0.12 | 0.14 ± 0.02 | - | 0.48 ± 0.07 | 2.45 ± 0.26 | 0.88 ± 0.08 |
| 1148 | 1146 | 2-Hydroxyisophorone | - | - | - | - | 4.02 ± 0.21 | 1.14 ± 0.12 |
| 1156 | 1154 | Nerol oxide | - | 0.50 ± 0.06 | 0.12 ± 0.03 | - | - | 0.38 ± 0.06 |
| 1160 | 1155 | Menthone | - | 0.67 ± 0.05 | - | - | 2.86 ± 0.09 | - |
| 1171 | 1164 | Propiophenone | - | - | - | - | 0.20 ± 0.02 | 0.20 ± 0.02 |
| 1173 | 1165 | Nonanol | - | - | 0.27 ± 0.05 | - | - | 0.59 ± 0.02 |
| 1176 | 1174 | trans-Linalool oxide (pyranoid) | - | - | 0.19 ± 0.04 | - | - | - |
| 1178 | 1175 | Isoamyl acetoacetate | 0.54 ± 0.07 | - | - | - | - | 0.04 ± 0.01 |
| 1181 | 1180 | Terpinen-4-ol | - | 0.58 ± 0.05 | - | - | - | - |
| 1183 | 1181 | p-Ethylbenzaldehyde | - | 0.52 ± 0.04 | - | - | - | - |
| 1183 | 1181 | (Z)-Ethyllinalool | 1.39 ± 0.06 | - | - | - | - | - |
| 1187 | 1186 | α-Terpineol | - | 2.35 ± 0.09 | 4.24 ± 0.39 | 1.23 ± 0.14 | - | - |
| 1192 | 1190 | Methyl salicylate | - | - | 0.99 ± 0.17 | - | - | - |
| 1994 | 1192 | Octanoic acid | - | - | - | 1.78 ± 0.22 | - | - |
| 1197 | 1194 | Dihydrocitronellol | 2.20 ± 0.12 | - | - | - | - | - |
| 1210 | 1201 | Safranal | - | 0.25 ± 0.05 | - | - | - | - |
| 1211 | 1201 | Decanal | 9.82 ± 0.27 | 1.77 ± 0.04 | 0.61 ± 0.04 | 9.30 ± 0.17 | 1.26 ± 0.08 | 0.76 ± 0.12 |
| 1223 | 1220 | α-Terpinyl methyl ether | - | - | 1.49 ± 0.15 | - | - | - |
| 1228 | 1225 | Hydroxymethylfurfural | 0.75 ± 0.04 | 1.53 ± 0.21 | - | 2.07 ± 0.15 | 0.53 ± 0.06 | 0.13 ± 0.02 |
| 1236 | 1233 | Pulegone | - | 12.28 ± 0.36 | - | - | - | - |
| 1239 | 1234 | 2,3,6-Trimethylphenol | - | - | - | - | 0.90 ± 0.05 | - |
| 1245 | 1241 | 3,4,5-Trimethylphenol | 0.48 ± 0.07 | 1.11 ± 0.08 | 0.15 ± 0.04 | - | 6.95 ± 0.34 | 0.30 ± 0.03 |
| 1249 | 1246 | Ethylphenyl acetate | - | - | - | - | - | 0.03 ± 0.01 |
| 1250 | 1247 | Cuminaldehyde | - | - | - | 0.33 ± 0.08 | - | - |
| 1250 | 1250 | Linalyl acetate | - | - | - | 0.87 ± 0.08 | - | - |
| 1251 | 1250 | Thymoquinone | - | 0.48 ± 0.04 | - | - | - | - |
| 1264 | 1265 | (2E)-Decenal | - | 0.22 ± 0.04 | - | 0.40 ± 0.02 | - | - |
| 1271 | 1268 | Geranial | - | 0.62 ± 0.04 | - | - | - | - |
| 1287 | 1289 | Thymol | - | 7.83 ± 0.29 | - | - | - | - |
| 1291 | 1289 | Nonanoic acid | 0.27 ± 0.04 | - | 3.30 ± 0.33 | 5.98 ± 0.23 | - | 0.02 ± 0.01 |
| 1299 | 1294 | 2-Undecanone | - | - | - | 0.26 ± 0.02 | - | - |
| 1301 | 1297 | Ethyl nonanoate | - | - | 0.16 ± 0.03 | - | - | 0.02 ± 0.01 |
| 1304 | 1300 | Carvacrol | 1.44 ± 0.13 | - | - | - | - | - |
| 1308 | 1309 | Undecanal | 0.39 ± 0.02 | 0.25 ± 0.03 | 0.11 ± 0.02 | 0.59 ± 0.07 | - | 0.03 ± 0.02 |
| 1331 | 1334 | Methyl anthranilate | - | - | - | 0.11 ± 0.02 | - | - |
| 1338 | 1340 | Piperitenone | - | 0.23 ± 0.03 | - | - | - | - |
| 1342 | 1344 | 3-Hydroxy-4-phenyl-2-butanone | - | - | 1.33 ± 0.11 | - | - | - |
| 1345 | 1346 | α-Terpinyl acetate | - | - | - | 0.14 ± 0.01 | - | - |
| 1355 | 1356 | Eugenol | - | - | - | 0.17 ± 0.02 | - | - |
| 1362 | 1361 | (Z)-β-Damascenone | - | - | 0.06 ± 0.01 | - | 2.78 ± 0.30 | 13.93 ± 0.23 |
| 1365 | 1364 | Decanoic acid | - | 0.60 ± 0.04 | 1.46 ± 0.10 | 5.65 ± 0.22 | 0.10 ± 0.01 | 0.10 ± 0.02 |
| 1382 | 1379 | (E)-β-Damascenone | 0.55 ± 0.06 | 0.20 ± 0.02 | 1.54 ± 0.11 | - | 1.02 ± 0.10 | - |
| 1396 | 1395 | Ethyl decanoate | - | - | 0.06 ± 0.01 | - | - | 0.03 ± 0.01 |
| 1400 | 1400 | Tetradecane | - | - | 0.04 ± 0.01 | - | - | - |
| 1412 | 1410 | Dodecanal | 0.66 ± 0.05 | 0.17 ± 0.02 | 0.73 ± 0.10 | 4.41 ± 0.18 | - | - |
| 1419 | 1417 | (E)-Caryophyllene | - | - | - | 1.72 ± 0.14 | - | - |
| 1424 | 1421 | (E)-α-Ionone | 0.54 ± 0.07 | - | 0.12 ± 0.03 | - | - | - |
| 1428 | 1426 | 6-Methyl-6-(5-methylfuryl)-2-heptanone | 3.79 ± 0.11 | - | - | - | - | - |
| 1436 | 1434 | Neryl acetone | 0.44 ± 0.04 | 0.26 ± 0.03 | 0.46 ± 0.09 | 0.83 ± 0.08 | - | 0.02 ± 0.01 |
| 1478 | 1476 | Dodecanol | - | - | - | 0.08 ± 0.02 | - | - |
| 1493 | 1479 | ar-Curcumene | 0.65 ± 0.07 | 0.14 ± 0.02 | 0.54 ± 0.07 | 1.03 ± 0.08 | 0.23 ± 0.06 | 0.19 ± 0.03 |
| 1495 | 1493 | α-Zingiberene | - | - | - | 0.74 ± 0.05 | - | - |
| 1505 | 1503 | BHT | 0.68 ± 0.03 | 0.54 ± 0.09 | 0.59 ± 0.03 | 2.14 ± 0.20 | - | 0.16 ± 0.03 |
| 1510 | 1508 | β-Bisabolene | - | 0.19 ± 0.03 | - | 0.62 ± 0.04 | - | - |
| 1526 | 1521 | β-Sesquiphellandrene | - | - | - | 0.86 ± 0.09 | - | - |
| 1559 | 1553 | Thymohydroquinone | - | 0.02 ± 0.01 | - | - | - | - |
| 1588 | 1581 | Dodecanoic acid | - | - | 0.07 ± 0.02 | 1.28 ± 0.15 | - | 0.02 ± 0.02 |
| 1595 | 1594 | Ethyl dodecanoate | - | - | 0.11 ± 0.02 | - | - | - |
| 1600 | 1600 | Hexadecane | - | - | 0.04 ± 0.02 | - | - | - |
| 1612 | 1614 | Tetradecanal | - | - | 0.06 ± 0.02 | 0.28 ± 0.06 | - | - |
| 1622 | 1621 | epi-Cedrol | - | - | - | - | - | - |
| 1648 | 1650 | cis-Methyldihydrojasmonate | - | - | 0.23 ± 0.05 | 0.09 ± 0.01 | - | - |
| 1669 | 1673 | trans-2-Tetradecenal | - | - | - | - | - | - |
| 1672 | 1670 | (3Z)-Hexenyl salicylate | - | - | 0.12 ± 0.04 | - | - | - |
| 1778 | 1773 | Tetradecanoic acid | - | - | 0.87 ± 0.09 | 1.29 ± 0.14 | 0.00 ± 0.01 | 0.03 ± 0.01 |
| 1785 | 1784 | Pentadecanol | - | - | - | 0.14 ± 0.03 | - | - |
| 1799 | 1794 | Ethyl tetradecanoate | - | - | - | - | - | - |
| 1810 | 1805 | 2-Ethylhexyl salicylate | - | - | 0.23 ± 0.03 | 0.75 ± 0.11 | - | - |
| 1835 | 1832 | Farnesyl acetate | - | - | - | 0.29 ± 0.04 | - | - |
| 1850 | 1845 | Galaxolide | - | - | - | 0.42 ± 0.08 | - | - |
| 1874 | 1869 | Pentadecanoic acid | - | - | 0.65 ± 0.01 | 0.59 ± 0.04 | 0.03 ± 0.01 | - |
| Total Area | 90.52 ± 2.04 | 94.84 ± 1.81 | 88.72 ± 3.66 | 92.79 ± 3.17 | 97.42 ± 2.24 | 95.61 ±1.44 |
Disclaimer/Publisher’s Note: The statements, opinions and data contained in all publications are solely those of the individual author(s) and contributor(s) and not of MDPI and/or the editor(s). MDPI and/or the editor(s) disclaim responsibility for any injury to people or property resulting from any ideas, methods, instructions or products referred to in the content. |
© 2023 by the authors. Licensee MDPI, Basel, Switzerland. This article is an open access article distributed under the terms and conditions of the Creative Commons Attribution (CC BY) license (https://creativecommons.org/licenses/by/4.0/).
Share and Cite
Mehdi, R.; Zrira, S.; Vadalà, R.; Nava, V.; Condurso, C.; Cicero, N.; Costa, R. A Preliminary Investigation of Special Types of Honey Marketed in Morocco. J. Exp. Theor. Anal. 2023, 1, 1-20. https://doi.org/10.3390/jeta1010001
Mehdi R, Zrira S, Vadalà R, Nava V, Condurso C, Cicero N, Costa R. A Preliminary Investigation of Special Types of Honey Marketed in Morocco. Journal of Experimental and Theoretical Analyses. 2023; 1(1):1-20. https://doi.org/10.3390/jeta1010001
Chicago/Turabian StyleMehdi, Rania, Saadia Zrira, Rossella Vadalà, Vincenzo Nava, Concetta Condurso, Nicola Cicero, and Rosaria Costa. 2023. "A Preliminary Investigation of Special Types of Honey Marketed in Morocco" Journal of Experimental and Theoretical Analyses 1, no. 1: 1-20. https://doi.org/10.3390/jeta1010001