
Metabolomics in Hyperuricemia and Gout

Abstract
:1. Introduction
2. Analytical Technology for Metabolomics
3. Metabolomics Data Analysis, Interpretation and Sharing
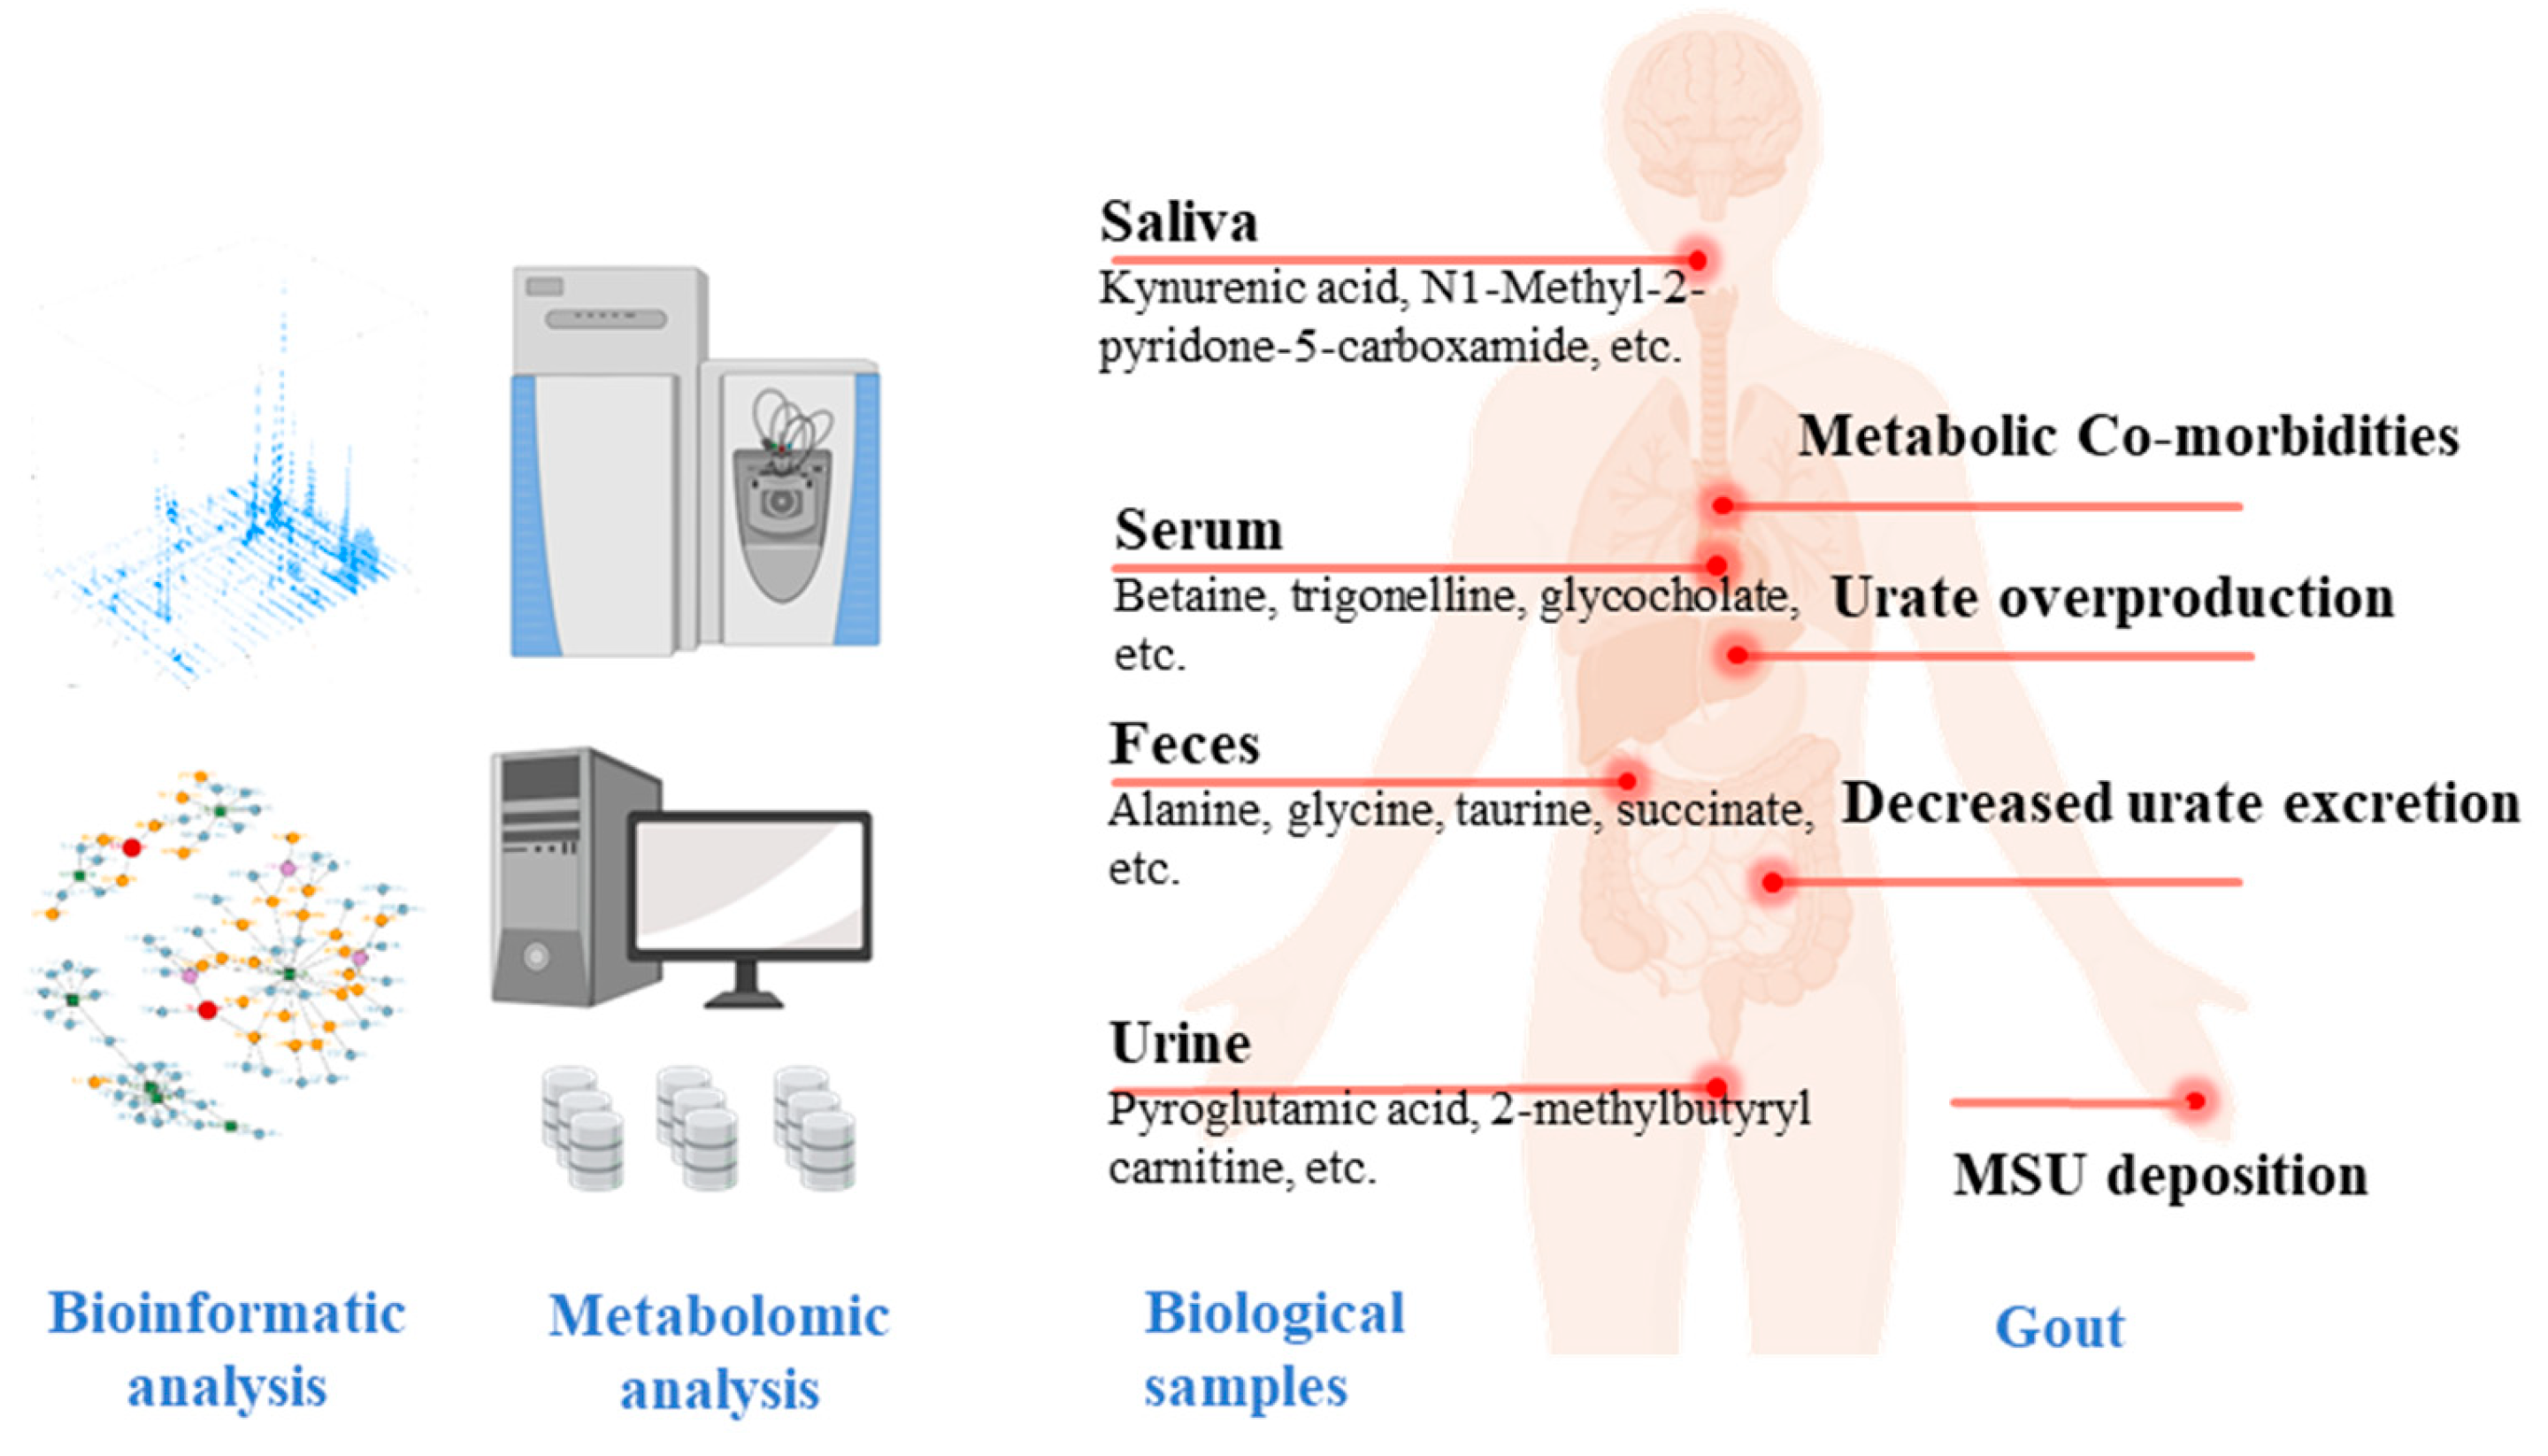
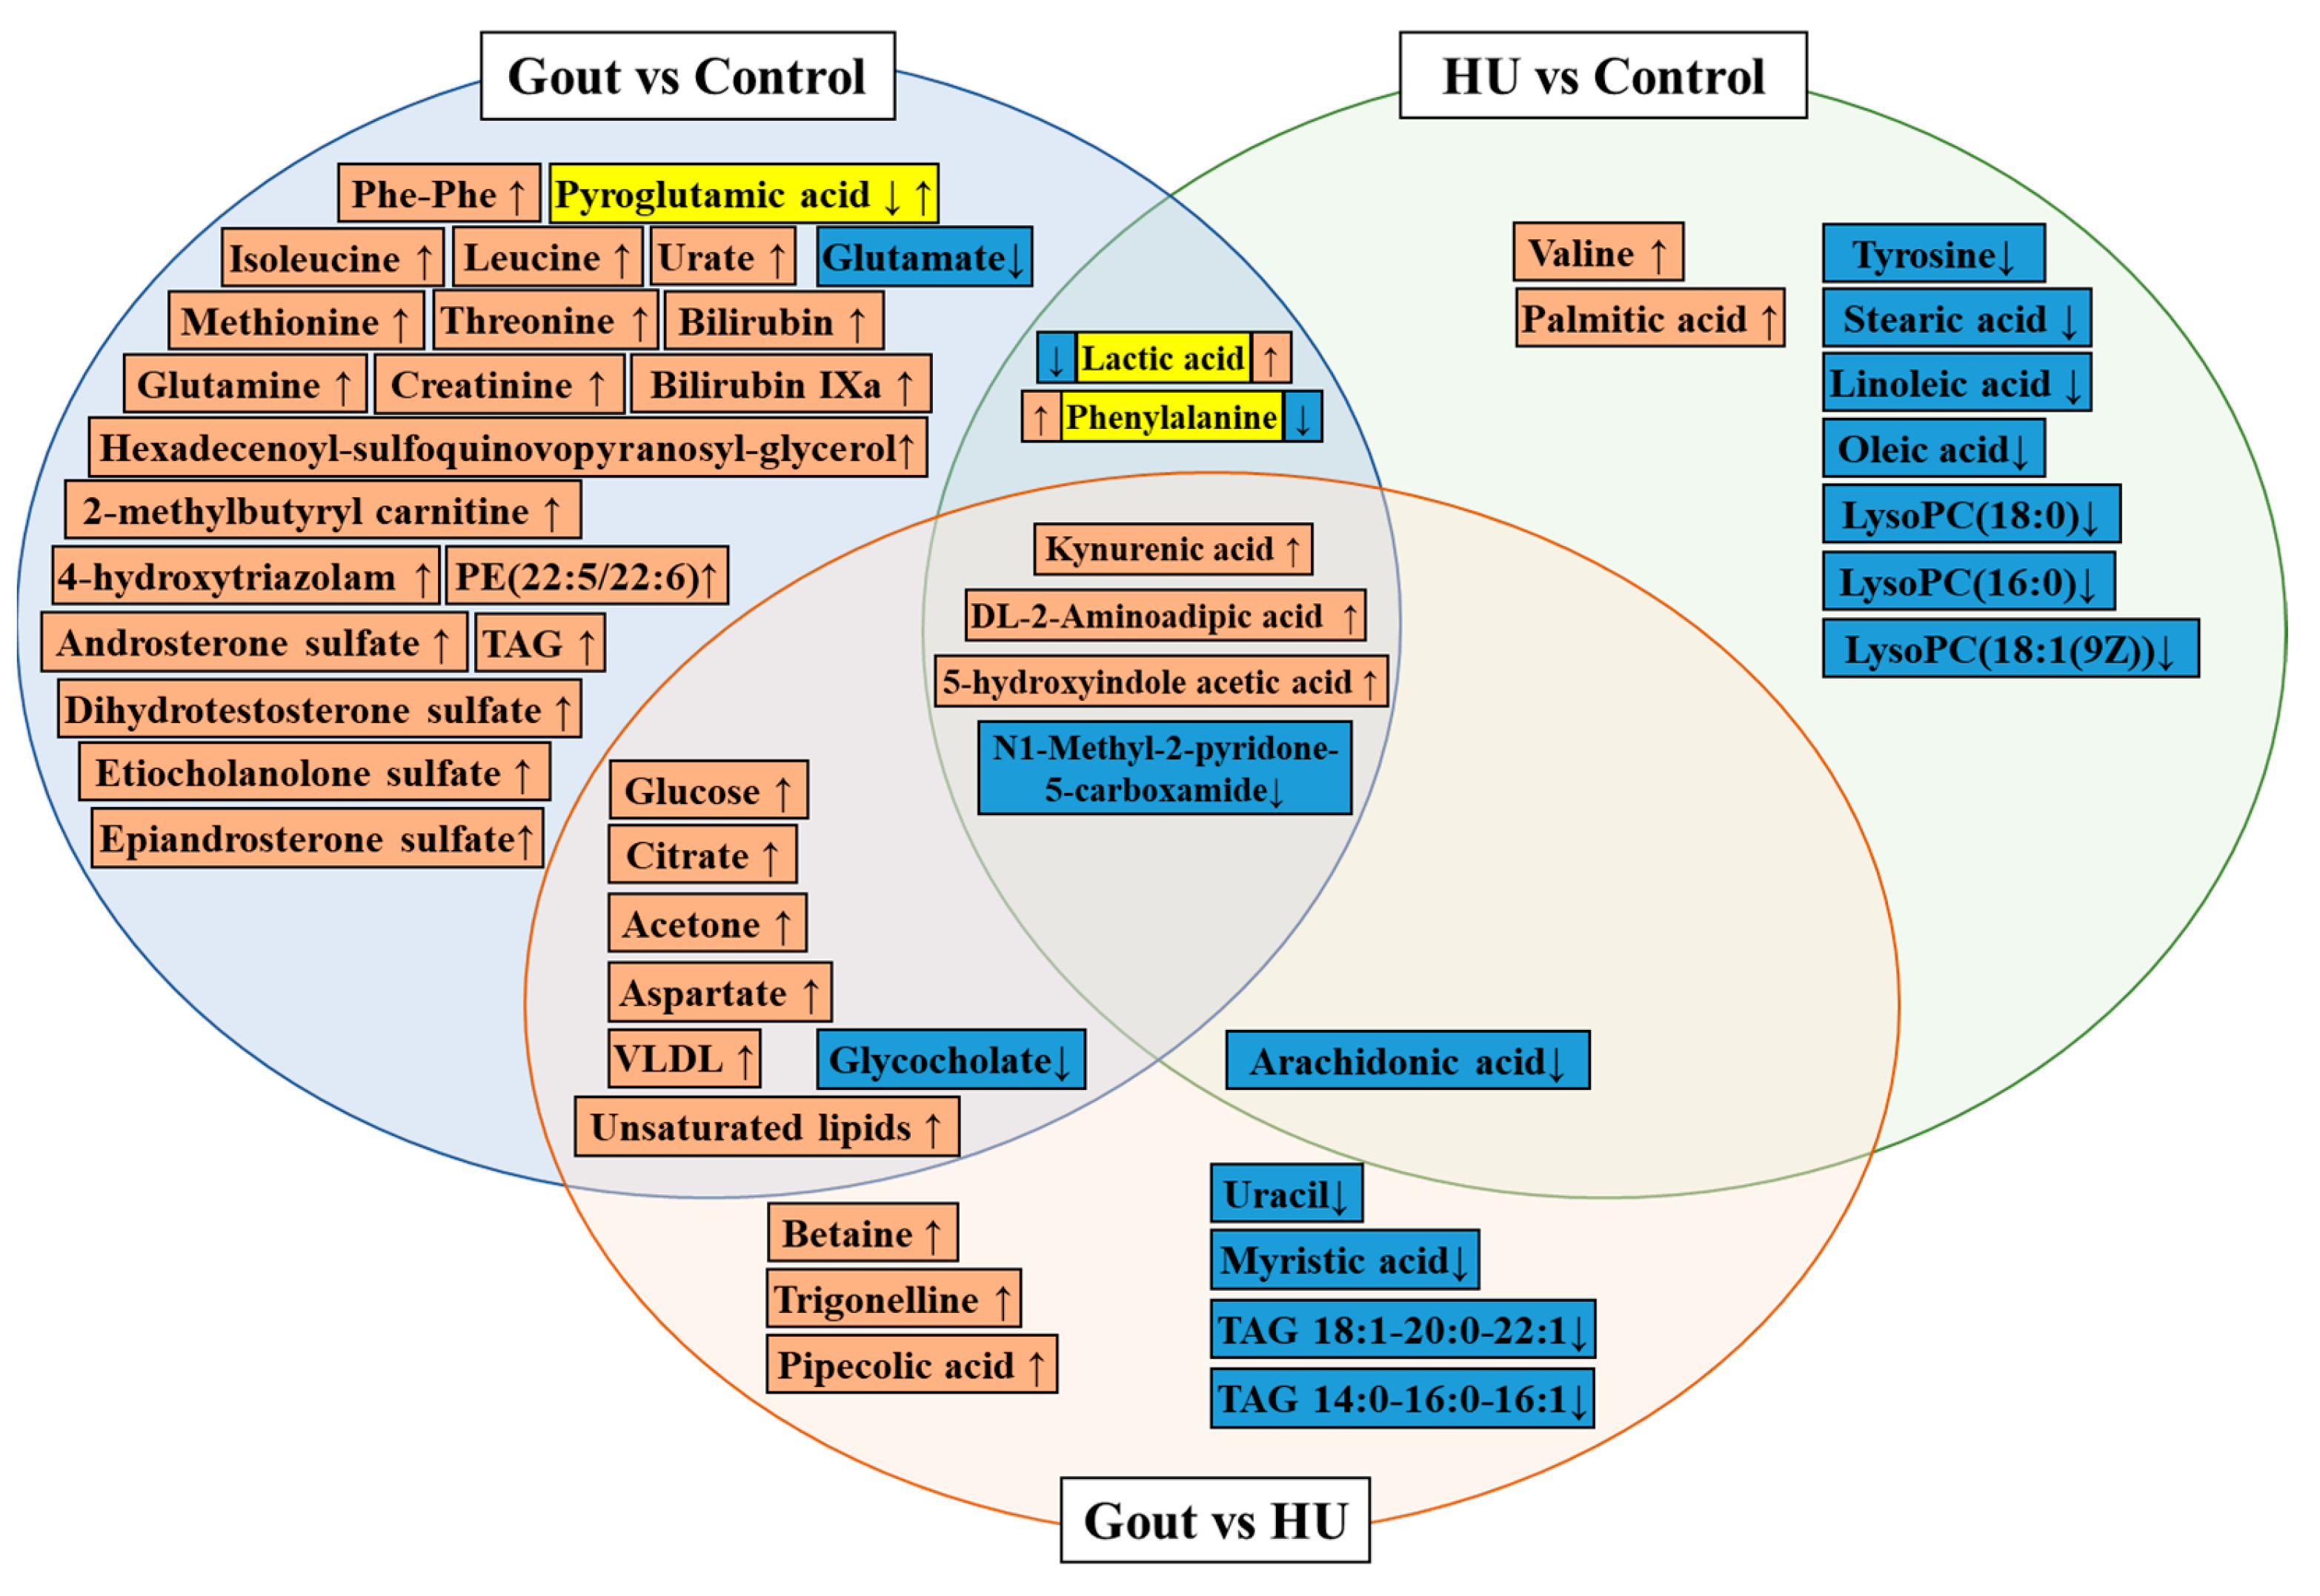
4. Metabolic Profiling and Metabolite Biomarker Discovery in Clinical Populations with HU and Gout

| Date | Sample | Discovery Cohort | Validation Cohort | Technique Platform | Upregulated Biomarkers | Downregulated Biomarkers | Conclusions |
|---|---|---|---|---|---|---|---|
| 2021 [31] | Serum | Gout (109) vs. healthy (119) | LCMS | Pyroglutamic acid, glycocholate, lactic acid, glutamate | Glycine, serine, and threonine metabolism disorder Arginine and proline metabolism disorder Ascorbate and aldarate metabolism disorder Alanine, aspartate, and glutamate metabolism disorder | ||
| Gout (109) vs. HU (102) | Betaine, trigonelline, pipecolic acid, | Glycocholate, uracil, myristic acid, arachidonate | Arginine biosynthesis↑ Glycine, serine, and threonine metabolism disorder | ||||
| 2018 [67] | Serum | Gout (49) vs. healthy (50) | NMR | VLDL, isoleucine, leucine, glutamine, methionine, acetone, citrate, aspartate, creatinine, glucose, threonine, triglycerides, unsaturated lipids and phenylalanine | Aminoacyl-tRNA biosynthesis↓ Valine, leucine and isoleucine biosynthesis↑ Nitrogen metabolism↑ Alanine, aspartate and glutamate metabolism↑ D-glutamine and D-glutamate metabolism disorder | ||
| Gout (49) vs. HU (50) | VLDL, lipid, acetone, citrate, aspartate, glucose | ||||||
| 2020 [68] | Serum | Gout (31) vs. healthy (31) | LCMS | 4-hydroxytriazolam, bilirubin, urate, 4E,15Z-Bilirubin IXa, androsterone sulfate, 5a-dihydrotestosterone sulfate, etiocholanolone sulfate, epiandrosterone sulfate, 1,2-Di-O-(8-hexadecenoyl)-3-O-(6-sulfoquinovopyranosyl)glycerol, PE(22:5(4Z,7Z,10Z,13Z,16Z)/22:6(4Z,7Z,10Z,13Z,16Z,19Z)) | Primary bile acid biosynthesis↓ Purine metabolism↑ Glycerophospholipid metabolism disorder | ||
| 2020 [69] | Serum and Urine | Gout (30) vs. healthy (30) | Gout (50) vs. healthy (50) | LCMS | Pyroglutamic acid, Phe-Phe, 2-methylbutyryl carnitine | Purine metabolism disorder Branched-chain amino acids (BCAAs) metabolism disorder Tricarboxylic acid cycle disorder Synthesis and degradation of ketone bodies disorder Bile secretion disorder Arachidonic acid metabolism disorder | |
| 2018 [71] | Urine | Gout (35) vs. healthy (29) | GCMS | Urate, isoxanthopterin | Purine nucleotide synthesis↑ Amino acid metabolism↓ Purine metabolism↑ Lipid and carbohydrate metabolism disorder | ||
| 2017 [72] | Feces | Gout (26) vs. healthy (26) | NMR | Alanine, glycine, taurine, succinate, acetate, a-glucose, b-glucose, a-xylose | Valine, asparagine, aspartate, citrulline, phenylalanine, a-ketoisocaproate | Urate excretion disorder Purine metabolism disorder Inflammatory responses disorder | |
| 2021 [73] | Serum | Gout (50) vs. HU (50) | Gout (69) vs. HU (50) | LCMS | TAG 18:1-20:0-22:1, TAG 14:0-16:0-16:1 | Lipid disorders | |
| 2022 [75] | Serum | HU (20) vs. healthy (20) | LCMS untargeted + targeted | Lactic acid, valine, palmitic acid, | Tyrosine, phenylalanine, arachidonic acid, stearic acid, linoleic acid, oleic acid, lipids, LysoPC(18:0), LysoPC(16:0), LysoPC(18:1(9Z)) | Glycerophospholipid metabolism disorder Arachidonic acid metabolism disorder Sphingolipid metabolism disorder Linoleic acid metabolism disorder α-linolenic acid metabolism disorder Phenylalanine, tyrosine, and tryptophan biosynthesis disorder Phenylalanine metabolism disorder | |
| 2017 [74] | Saliva | Gout (8) vs. healthy (15) | Gout (30) vs. healthy (30) | CICMS + assay kits | Urate, oxalic acid, L-homocysteic acid (HCA) | ||
| Gout (8) vs. HU (15) | Gout (30) vs. HU (30) | Urate, oxalic acid, L-homocysteic acid (HCA) | |||||
| 2022 [70] | Serum | 5 sequential stages (347) | 5 sequential stages (200) | LCMS untargeted + targeted | kynurenic acid (KYNA), 5-hydroxyindole acetic acid (5-HIAA), DL-2-Aminoadipic acid (2AMIA) | N1-Methyl-2-pyridone-5-carboxamide (2PY) | KYNA and 5-HIAA are related to acute inflammation of gouty arthritis 2PY and 2AMIA are related to renal function damage caused by long-term HU |
5. Multi-Omics and Big Data
6. Metabolomics in Experiment Models
| Data | Analytical Platform | Rodent Models | Differential Metabolites/ Metabolic Pathways |
|---|---|---|---|
| 2022 [87] | UPLC-QTOF-MS/MS | MSU Crystal-Induced Gouty arthritis Rats | Arachidonic acid, sphingolipid, and glycerophospholipid metabolism |
| 2021 [88] | UPLC-QTOF/MS | High fructose combined with potassium oxonate (HFCPO)-induced hyperuricemia Rats | Acylcarnitine and amino acid related metabolites |
| 2020 [89] | 1H NMR and UHPLC/Q-Orbitrap-MS | Potassium oxonate induced hyperuricemia rats | Pyruvate, lactate, creatine, glycine, LysoPC and PC and etc |
| 2019 [91] | Capillary electrophoresis–time-of-flight mass spectrometry (CE-TOFMS) | Rat model of renal I/R | Purine/pyrimidine metabolism |
| 2022 [90] | Shimadzu Nexera XR HPLC-MS SCIEX Triple Quad™ 3500 | Acute gouty peritonitis mouse model | Glycolysis pathway |
7. Summary and Future Directions
Author Contributions
Funding
Institutional Review Board Statement
Informed Consent Statement
Data Availability Statement
Conflicts of Interest
References
- Dalbeth, N.; Gosling, A.L.; Gaffo, A.; Abhishek, A. Gout. Lancet 2021, 397, 1843–1855. [Google Scholar] [CrossRef]
- Desai, J.; Steiger, S.; Anders, H.-J. Molecular Pathophysiology of Gout. Trends Mol. Med. 2017, 23, 756–768. [Google Scholar] [CrossRef] [PubMed]
- Dehlin, M.; Jacobsson, L.; Roddy, E. Global epidemiology of gout: Prevalence, incidence, treatment patterns and risk factors. Nat. Rev. Rheumatol. 2020, 16, 380–390. [Google Scholar] [CrossRef] [PubMed]
- Dalbeth, N.; Phipps-Green, A.; Frampton, C.; Neogi, T.; Taylor, W.J.; Merriman, T.R. Relationship between serum urate concentration and clinically evident incident gout: An individual participant data analysis. Ann. Rheum. Dis. 2018, 77, 1048–1052. [Google Scholar] [CrossRef] [PubMed]
- Fitzgerald, J.D.; Dalbeth, N.; Mikuls, T.; Brignardello-Petersen, R.; Guyatt, G.; Abeles, A.M.; Gelber, A.C.; Harrold, L.R.; Khanna, D.; King, C.; et al. 2020 American College of Rheumatology Guideline for the Management of Gout. Arthritis Care Res. 2020, 72, 744–760. [Google Scholar] [CrossRef]
- Schumacher, H.R.; Taylor, W.; Edwards, L.; Grainger, R.; Schlesinger, N.; Dalbeth, N.; Sivera, F.; Singh, J.; Evans, R.; Waltrip, R.W.; et al. Outcome Domains for Studies of Acute and Chronic Gout. J. Rheumatol. 2009, 36, 2342–2345. [Google Scholar] [CrossRef]
- Hirsch, J.D.; Terkeltaub, R.; Khanna, D.; Singh, J.; Sarkin, A.; Shieh, M.; Kavanaugh, A.; Lee, S.J. Gout disease-specific quality of life and the association with gout characteristics. Patient Relat. Outcome Meas. 2010, 1, 1–8. [Google Scholar] [CrossRef] [Green Version]
- Li, Q.; Li, X.; Wang, J.; Liu, H.; Kwong, J.S.; Chen, H.; Li, L.; Chung, S.C.; Shah, A.; Chen, Y.; et al. Diagnosis and treatment for hyperuricemia and gout: A systematic review of clinical practice guidelines and consensus statements. BMJ Open 2019, 9, e026677. [Google Scholar] [CrossRef] [Green Version]
- Soltani, Z.; Rasheed, K.; Kapusta, D.R.; Reisin, E. Potential Role of Uric Acid in Metabolic Syndrome, Hypertension, Kidney Injury, and Cardiovascular Diseases: Is It Time for Reappraisal? Curr. Hypertens. Rep. 2013, 15, 175–181. [Google Scholar] [CrossRef] [Green Version]
- Puig, J.G.; Martínez, M.A. Hyperuricemia, gout and the metabolic syndrome. Curr. Opin. Rheumatol. 2008, 20, 187–191. [Google Scholar] [CrossRef]
- Perez De Souza, L.; Alseekh, S.; Scossa, F.; Fernie, A.R. Ultra-high-performance liquid chromatography high-resolution mass spectrometry variants for metabolomics research. Nat. Methods 2021, 18, 733–746. [Google Scholar] [CrossRef] [PubMed]
- Alseekh, S.; Aharoni, A.; Brotman, Y.; Contrepois, K.; D’Auria, J.; Ewald, J.; Ewald, J.C.; Fraser, P.D.; Giavalisco, P.; Hall, R.D.; et al. Mass spectrometry-based metabolomics: A guide for annotation, quantification and best reporting practices. Nat. Methods 2021, 18, 747–756. [Google Scholar] [CrossRef] [PubMed]
- Rinschen, M.M.; Ivanisevic, J.; Giera, M.; Siuzdak, G. Identification of bioactive metabolites using activity metabolomics. Nat. Rev. Mol. Cell Biol. 2019, 20, 353–367. [Google Scholar] [CrossRef]
- Metallo, C.M.; Vander Heiden, M.G. Understanding metabolic regulation and its influence on cell physiology. Mol. Cell 2013, 49, 388–398. [Google Scholar] [CrossRef] [PubMed] [Green Version]
- Zhang, D.; Tang, Z.; Huang, H.; Zhou, G.; Cui, C.; Weng, Y.; Liu, W.; Kim, S.; Lee, S.; Perez-Neut, M.; et al. Metabolic regulation of gene expression by histone lactylation. Nature 2019, 574, 575–580. [Google Scholar] [CrossRef]
- Boon, R.; Silveira, G.G.; Mostoslavsky, R. Nuclear metabolism and the regulation of the epigenome. Nat. Metab. 2020, 2, 1190–1203. [Google Scholar] [CrossRef]
- Renaudin, F.; Orliaguet, L.; Castelli, F.; Fenaille, F.; Prignon, A.; Alzaid, F.; Combes, C.; Delvaux, A.; Adimy, Y.; Cohen-Solal, M.; et al. Gout and pseudo-gout-related crystals promote GLUT1-mediated glycolysis that governs NLRP3 and interleukin-1beta activation on macrophages. Ann. Rheum. Dis. 2020, 79, 1506–1514. [Google Scholar] [CrossRef]
- Cobo, I.; Cheng, A.; Murillo-Saich, J.; Coras, R.; Torres, A.; Abe, Y.; Lana, A.J.; Schlachetzki, J.; Liu-Bryan, R.; Terkeltaub, R.; et al. Monosodium urate crystals regulate a unique JNK-dependent macrophage metabolic and inflammatory response. Cell Rep. 2022, 38, 110489. [Google Scholar] [CrossRef]
- Newgard, C.B. Metabolomics and Metabolic Diseases: Where Do We Stand? Cell Metab. 2017, 25, 43–56. [Google Scholar] [CrossRef] [Green Version]
- Johnson, C.H.; Ivanisevic, J.; Siuzdak, G. Metabolomics: Beyond biomarkers and towards mechanisms. Nat. Rev. Mol. Cell Biol. 2016, 17, 451–459. [Google Scholar] [CrossRef] [Green Version]
- Alseekh, S.; Fernie, A.R. Metabolomics 20 years on: What have we learned and what hurdles remain? Plant J. 2018, 94, 933–942. [Google Scholar] [CrossRef] [PubMed]
- Wishart, D.S.; Guo, A.; Oler, E.; Wang, F.; Anjum, A.; Peters, H.; Dizon, R.; Sayeeda, Z.; Tian, S.; Lee, B.L.; et al. HMDB 5.0: The Human Metabolome Database for 2022. Nucleic Acids Res. 2022, 50, D622–D631. [Google Scholar] [CrossRef] [PubMed]
- Haug, K.; Cochrane, K.; Nainala, V.C.; Williams, M.; Chang, J.; Jayaseelan, K.V.; O’Donovan, C. MetaboLights: A resource evolving in response to the needs of its scientific community. Nucleic Acids Res. 2020, 48, D440–D444. [Google Scholar] [CrossRef] [Green Version]
- Shao, Y.; Le, W. Recent advances and perspectives of metabolomics-based investigations in Parkinson’s disease. Mol. Neurodegener. 2019, 14, 3. [Google Scholar] [CrossRef] [PubMed] [Green Version]
- Lane, A.N.; Higashi, R.M.; Fan, T.W.M. NMR and MS-based Stable Isotope-Resolved Metabolomics and applications in cancer metabolism. TrAC Trends Anal. Chem. 2019, 120, 115322. [Google Scholar] [CrossRef]
- Griffin, J.L. Metabonomics: NMR spectroscopy and pattern recognition analysis of body fluids and tissues for characterisation of xenobiotic toxicity and disease diagnosis. Curr. Opin. Chem. Biol. 2003, 7, 648–654. [Google Scholar] [CrossRef]
- Vignoli, A.; Ghini, V.; Meoni, G.; Licari, C.; Takis, P.G.; Tenori, L.; Turano, P.; Luchinat, C. High-Throughput Metabolomics by 1D NMR. Angew. Chem. Int. Ed. 2019, 58, 968–994. [Google Scholar] [CrossRef]
- Takis, P.G.; Ghini, V.; Tenori, L.; Turano, P.; Luchinat, C. Uniqueness of the NMR approach to metabolomics. TrAC Trends Anal. Chem. 2019, 120, 115300. [Google Scholar] [CrossRef]
- Markley, J.L.; Brüschweiler, R.; Edison, A.S.; Eghbalnia, H.R.; Powers, R.; Raftery, D.; Wishart, D.S. The future of NMR-based metabolomics. Curr. Opin. Biotechnol. 2017, 43, 34–40. [Google Scholar] [CrossRef] [Green Version]
- Zhang, A.; Sun, H.; Wang, P.; Han, Y.; Wang, X. Modern analytical techniques in metabolomics analysis. Analyst 2012, 137, 293–300. [Google Scholar] [CrossRef]
- Shen, X.; Wang, C.; Liang, N.; Liu, Z.; Li, X.; Zhu, Z.J.; Merriman, T.R.; Dalbeth, N.; Terkeltaub, R.; Li, C.; et al. Serum metabolomics identifies dysregulated pathways and potential metabolic biomarkers for hyperuricemia and gout. Arthritis Rheumatol. 2021, 73, 1738–1748. [Google Scholar] [CrossRef] [PubMed]
- Zhang, Z.; TeSlaa, T.; Xu, X.; Zeng, X.; Yang, L.; Xing, G.; Tesz, G.J.; Clasquin, M.F.; Rabinowitz, J.D. Serine catabolism generates liver NADPH and supports hepatic lipogenesis. Nat. Metab. 2021, 3, 1608–1620. [Google Scholar] [CrossRef] [PubMed]
- Hui, S.; Ghergurovich, J.M.; Morscher, R.J.; Jang, C.; Teng, X.; Lu, W.; Esparza, L.A.; Reya, T.; Le, Z.; Yanxiang Guo, J.; et al. Glucose feeds the TCA cycle via circulating lactate. Nature 2017, 551, 115–118. [Google Scholar] [CrossRef] [Green Version]
- Li, M.; He, X.; Guo, W.; Yu, H.; Zhang, S.; Wang, N.; Liu, G.; Sa, R.; Shen, X.; Jiang, Y.; et al. Aldolase B suppresses hepatocellular carcinogenesis by inhibiting G6PD and pentose phosphate pathways. Nat. Cancer 2020, 1, 735–747. [Google Scholar] [CrossRef] [PubMed]
- Lv, W.; Shi, X.; Wang, S.; Xu, G. Multidimensional liquid chromatography-mass spectrometry for metabolomic and lipidomic analyses. TrAC Trends Anal. Chem. 2019, 120, 115302. [Google Scholar] [CrossRef]
- Zhou, Z.; Shen, X.; Chen, X.; Tu, J.; Xiong, X.; Zhu, Z.-J. LipidIMMS Analyzer: Integrating multi-dimensional information to support lipid identification in ion mobility—Mass spectrometry based lipidomics. Bioinformatics 2019, 35, 698–700. [Google Scholar] [CrossRef]
- Haag, A.M. Mass Analyzers and Mass Spectrometers. In Modern Proteomics—Sample Preparation, Analysis and Practical Applications; Springer International Publishing: Berlin/Heidelberg, Germany, 2016; pp. 157–169. [Google Scholar]
- Doerr, A. Global metabolomics. Nat. Methods 2017, 14, 32. [Google Scholar] [CrossRef]
- Zhou, J.; Yin, Y. Strategies for large-scale targeted metabolomics quantification by liquid chromatography-mass spectrometry. Analyst 2016, 141, 6362–6373. [Google Scholar] [CrossRef]
- Zheng, F.; Zhao, X.; Zeng, Z.; Wang, L.; Lv, W.; Wang, Q.; Xu, G. Development of a plasma pseudotargeted metabolomics method based on ultra-high-performance liquid chromatography–mass spectrometry. Nat. Protoc. 2020, 15, 2519–2537. [Google Scholar] [CrossRef]
- Bonner, R.; Hopfgartner, G. SWATH data independent acquisition mass spectrometry for metabolomics. TrAC Trends Anal. Chem. 2019, 120, 115278. [Google Scholar] [CrossRef]
- Van Der Greef, J.; Van Wietmarschen, H.; Van Ommen, B.; Verheij, E. Looking back into the future: 30 years of metabolomics at TNO. Mass Spectrom. Rev. 2013, 32, 399–415. [Google Scholar] [CrossRef]
- Fernie, A.R.; Trethewey, R.N.; Krotzky, A.J.; Willmitzer, L. Metabolite profiling: From diagnostics to systems biology. Nat. Rev. Mol. Cell Biol. 2004, 5, 763–769. [Google Scholar] [CrossRef] [PubMed]
- Smith, C.A.; Want, E.J.; O’Maille, G.; Abagyan, R.; Siuzdak, G. XCMS: Processing Mass Spectrometry Data for Metabolite Profiling Using Nonlinear Peak Alignment, Matching, and Identification. Anal. Chem. 2006, 78, 779–787. [Google Scholar] [CrossRef] [PubMed]
- Pluskal, T.; Castillo, S.; Villar-Briones, A.; Orešič, M. MZmine 2: Modular framework for processing, visualizing, and analyzing mass spectrometry-based molecular profile data. BMC Bioinform. 2010, 11, 395. [Google Scholar] [CrossRef] [PubMed] [Green Version]
- Tsugawa, H.; Cajka, T.; Kind, T.; Ma, Y.; Higgins, B.; Ikeda, K.; Kanazawa, M.; Vandergheynst, J.; Fiehn, O.; Arita, M. MS-DIAL: Data-independent MS/MS deconvolution for comprehensive metabolome analysis. Nat. Methods 2015, 12, 523–526. [Google Scholar] [CrossRef]
- Kirkwood, K.I.; Pratt, B.S.; Shulman, N.; Tamura, K.; Maccoss, M.J.; Maclean, B.X.; Baker, E.S. Utilizing Skyline to analyze lipidomics data containing liquid chromatography, ion mobility spectrometry and mass spectrometry dimensions. Nat. Protoc. 2022, 17, 2415–2430. [Google Scholar] [CrossRef]
- Horai, H.; Arita, M.; Kanaya, S.; Nihei, Y.; Ikeda, T.; Suwa, K.; Ojima, Y.; Tanaka, K.; Tanaka, S.; Aoshima, K.; et al. MassBank: A public repository for sharing mass spectral data for life sciences. J. Mass Spectrom. 2010, 45, 703–714. [Google Scholar] [CrossRef]
- Wang, M.; Carver, J.J.; Phelan, V.V.; Sanchez, L.M.; Garg, N.; Peng, Y.; Nguyen, D.D.; Watrous, J.; Kapono, C.A.; Luzzatto-Knaan, T.; et al. Sharing and community curation of mass spectrometry data with Global Natural Products Social Molecular Networking. Nat. Biotechnol. 2016, 34, 828–837. [Google Scholar] [CrossRef] [Green Version]
- Kind, T.; Liu, K.-H.; Lee, D.Y.; Defelice, B.; Meissen, J.K.; Fiehn, O. LipidBlast in silico tandem mass spectrometry database for lipid identification. Nat. Methods 2013, 10, 755–758. [Google Scholar] [CrossRef] [Green Version]
- Montenegro-Burke, J.R.; Guijas, C.; Siuzdak, G. METLIN: A Tandem Mass Spectral Library of Standards. In Computational Methods and Data Analysis for Metabolomics; Springer: New York, NY, USA, 2020; pp. 149–163. [Google Scholar] [CrossRef]
- Schmid, R.; Petras, D.; Nothias, L.-F.; Wang, M.; Aron, A.T.; Jagels, A.; Tsugawa, H.; Rainer, J.; Garcia-Aloy, M.; Dührkop, K.; et al. Ion identity molecular networking for mass spectrometry-based metabolomics in the GNPS environment. Nat. Commun. 2021, 12, 3832. [Google Scholar] [CrossRef]
- Shen, X.; Wang, R.; Xiong, X.; Yin, Y.; Cai, Y.; Ma, Z.; Liu, N.; Zhu, Z.-J. Metabolic reaction network-based recursive metabolite annotation for untargeted metabolomics. Nat. Commun. 2019, 10, 1516. [Google Scholar] [CrossRef] [PubMed] [Green Version]
- Chen, L.; Lu, W.; Wang, L.; Xing, X.; Chen, Z.; Teng, X.; Zeng, X.; Muscarella, A.D.; Shen, Y.; Cowan, A.; et al. Metabolite discovery through global annotation of untargeted metabolomics data. Nat. Methods 2021, 18, 1377–1385. [Google Scholar] [CrossRef] [PubMed]
- Sen, P.; Lamichhane, S.; Mathema, V.B.; McGlinchey, A.; Dickens, A.M.; Khoomrung, S.; Orešič, M. Deep learning meets metabolomics: A methodological perspective. Brief. Bioinform. 2021, 22, 1531–1542. [Google Scholar] [CrossRef] [PubMed]
- Pang, Z.; Zhou, G.; Ewald, J.; Chang, L.; Hacariz, O.; Basu, N.; Xia, J. Using MetaboAnalyst 5.0 for LC–HRMS spectra processing, multi-omics integration and covariate adjustment of global metabolomics data. Nat. Protoc. 2022, 17, 1735–1761. [Google Scholar] [CrossRef]
- Kanehisa, M.; Furumichi, M.; Tanabe, M.; Sato, Y.; Morishima, K. KEGG: New perspectives on genomes, pathways, diseases and drugs. Nucleic Acids Res. 2017, 45, D353–D361. [Google Scholar] [CrossRef] [Green Version]
- Jewison, T.; Su, Y.; Disfany, F.M.; Liang, Y.; Knox, C.; Maciejewski, A.; Poelzer, J.; Huynh, J.; Zhou, Y.; Arndt, D.; et al. SMPDB 2.0: Big Improvements to the Small Molecule Pathway Database. Nucleic Acids Res. 2013, 42, D478–D484. [Google Scholar] [CrossRef] [Green Version]
- Xia, J.; Wishart, D.S. MSEA: A web-based tool to identify biologically meaningful patterns in quantitative metabolomic data. Nucleic Acids Res. 2010, 38, W71–W77. [Google Scholar] [CrossRef] [Green Version]
- Picart-Armada, S.; Fernández-Albert, F.; Vinaixa, M.; Yanes, O.; Perera-Lluna, A. FELLA: An R package to enrich metabolomics data. BMC Bioinform. 2018, 19, 538. [Google Scholar] [CrossRef] [Green Version]
- Jassal, B.; Matthews, L.; Viteri, G.; Gong, C.; Lorente, P.; Fabregat, A.; Sidiropoulos, K.; Cook, J.; Gillespie, M.; Haw, R.; et al. The reactome pathway knowledgebase. Nucleic Acids Res. 2019, 48, D498–D503. [Google Scholar] [CrossRef]
- Brunk, E.; Sahoo, S.; Zielinski, D.C.; Altunkaya, A.; Dräger, A.; Mih, N.; Gatto, F.; Nilsson, A.; Preciat Gonzalez, G.A.; Aurich, M.K.; et al. Recon3D enables a three-dimensional view of gene variation in human metabolism. Nat. Biotechnol. 2018, 36, 272–281. [Google Scholar] [CrossRef]
- Wang, Z.; Gerstein, M.; Snyder, M. RNA-Seq: A revolutionary tool for transcriptomics. Nat. Rev. Genet. 2009, 10, 57–63. [Google Scholar] [CrossRef]
- Fiehn, O.; Robertson, D.; Griffin, J.; Van Der Werf, M.; Nikolau, B.; Morrison, N.; Sumner, L.W.; Goodacre, R.; Hardy, N.W.; Taylor, C.; et al. The metabolomics standards initiative (MSI). Metabolomics 2007, 3, 175–178. [Google Scholar] [CrossRef] [Green Version]
- Sumner, L.W.; Amberg, A.; Barrett, D.; Beale, M.H.; Beger, R.; Daykin, C.A.; Fan, T.W.M.; Fiehn, O.; Goodacre, R.; Griffin, J.L.; et al. Proposed minimum reporting standards for chemical analysis. Metabolomics 2007, 3, 211–221. [Google Scholar] [CrossRef] [PubMed] [Green Version]
- Sud, M.; Fahy, E.; Cotter, D.; Azam, K.; Vadivelu, I.; Burant, C.; Edison, A.; Fiehn, O.; Higashi, R.; Nair, K.S.; et al. Metabolomics Workbench: An international repository for metabolomics data and metadata, metabolite standards, protocols, tutorials and training, and analysis tools. Nucleic Acids Res. 2015, 44, D463–D470. [Google Scholar] [CrossRef] [PubMed] [Green Version]
- Zhang, Y.; Zhang, H.; Chang, D.; Guo, F.; Pan, H.; Yang, Y. Metabolomics approach by 1H NMR spectroscopy of serum reveals progression axes for asymptomatic hyperuricemia and gout. Arthritis Res. Ther. 2018, 20, 111. [Google Scholar] [CrossRef] [Green Version]
- Zhong, Z.; Huang, Y.; Huang, Q.; Zheng, S.; Huang, Z.; Deng, W.; Li, T. Serum metabolic profiling analysis of gout patients based on UPLC-Q-TOF/MS. Clin. Chim. Acta 2021, 515, 52–60. [Google Scholar] [CrossRef]
- Huang, Y.; Xiao, M.; Ou, J.; Lv, Q.; Wei, Q.; Chen, Z.; Wu, J.; Tu, L.; Jiang, Y.; Zhang, X.; et al. Identification of the urine and serum metabolomics signature of gout. Rheumatology 2020, 59, 2960–2969. [Google Scholar] [CrossRef] [PubMed]
- Lyu, S.; Rao, Y.; Liu, P.; Yang, S.; Chen, W.; Yang, H.; Ke, S.; OuYang, H.; He, M.; Feng, Y. Metabolomics analysis reveals four biomarkers associated with the gouty arthritis progression in patients with sequential stages. Semin. Arthritis Rheum. 2022, 55, 152022. [Google Scholar] [CrossRef]
- Li, Q.; Wei, S.; Wu, D.; Wen, C.; Zhou, J. Urinary Metabolomics Study of Patients with Gout Using Gas Chromatography-Mass Spectrometry. Biomed. Res. Int. 2018, 2018, 3461572. [Google Scholar] [CrossRef] [PubMed] [Green Version]
- Shao, T.; Shao, L.; Li, H.; Xie, Z.; He, Z.; Wen, C. Combined Signature of the Fecal Microbiome and Metabolome in Patients with Gout. Front. Microbiol. 2017, 8, 268. [Google Scholar] [CrossRef] [Green Version]
- Liu, S.; Wang, Y.; Liu, H.; Xu, T.; Wang, M.-J.; Lu, J.; Guo, Y.; Chen, W.; Ke, M.; Zhou, G.; et al. Serum lipidomics reveals distinct metabolic profiles for asymptomatic hyperuricemic and gout patients. Rheumatology 2021, 61, 2644–2651. [Google Scholar] [CrossRef]
- Cui, L.; Liu, J.; Yan, X.; Hu, S. Identification of Metabolite Biomarkers for Gout Using Capillary Ion Chromatography with Mass Spectrometry. Anal. Chem. 2017, 89, 11737–11743. [Google Scholar] [CrossRef] [PubMed]
- Qin, N.; Qin, M.; Shi, W.; Kong, L.; Wang, L.; Xu, G.; Guo, Y.; Zhang, J.; Ma, Q. Investigation of pathogenesis of hyperuricemia based on untargeted and targeted metabolomics. Sci. Rep. 2022, 12, 13980. [Google Scholar] [CrossRef] [PubMed]
- Suhre, K.; Shin, S.-Y.; Petersen, A.-K.; Mohney, R.P.; Meredith, D.; Wägele, B.; Altmaier, E.; Deloukas, P.; Erdmann, J.; Grundberg, E.; et al. Human metabolic individuality in biomedical and pharmaceutical research. Nature 2011, 477, 54–60. [Google Scholar] [CrossRef] [PubMed] [Green Version]
- Döring, A.; Gieger, C.; Mehta, D.; Gohlke, H.; Prokisch, H.; Coassin, S.; Fischer, G.; Henke, K.; Klopp, N.; Kronenberg, F.; et al. SLC2A9 influences uric acid concentrations with pronounced sex-specific effects. Nat. Genet. 2008, 40, 430–436. [Google Scholar] [CrossRef]
- Sulem, P.; Gudbjartsson, D.F.; Walters, G.B.; Helgadottir, H.T.; Helgason, A.; Gudjonsson, S.A.; Zanon, C.; Besenbacher, S.; Bjornsdottir, G.; Magnusson, O.T.; et al. Identification of low-frequency variants associated with gout and serum uric acid levels. Nat. Genet. 2011, 43, 1127–1130. [Google Scholar] [CrossRef]
- Vasiliou, V.; Sandoval, M.; Backos, D.S.; Jackson, B.C.; Chen, Y.; Reigan, P.; Lanaspa, M.A.; Johnson, R.J.; Koppaka, V.; Thompson, D.C. ALDH16A1 is a novel non-catalytic enzyme that may be involved in the etiology of gout via protein–protein interactions with HPRT1. Chem.-Biol. Interact. 2013, 202, 22–31. [Google Scholar] [CrossRef] [Green Version]
- Charkoftaki, G.; Chen, Y.; Han, M.; Sandoval, M.; Yu, X.; Zhao, H.; Orlicky, D.J.; Thompson, D.C.; Vasiliou, V. Transcriptomic analysis and plasma metabolomics in Aldh16a1 -null mice reveals a potential role of ALDH16A1 in renal function. Chem.-Biol. Interact. 2017, 276, 15–22. [Google Scholar] [CrossRef] [Green Version]
- Crane, J.K. Role of host xanthine oxidase in infection due to enteropathogenic and Shiga-toxigenicEscherichia coli. Gut Microbes 2013, 4, 388–391. [Google Scholar] [CrossRef] [Green Version]
- Hooper, L.V.; Littman, D.R.; Macpherson, A.J. Interactions Between the Microbiota and the Immune System. Science 2012, 336, 1268–1273. [Google Scholar] [CrossRef] [Green Version]
- Ichida, K.; Matsuo, H.; Takada, T.; Nakayama, A.; Murakami, K.; Shimizu, T.; Yamanashi, Y.; Kasuga, H.; Nakashima, H.; Nakamura, T.; et al. Decreased extra-renal urate excretion is a common cause of hyperuricemia. Nat. Commun. 2012, 3, 764. [Google Scholar] [CrossRef] [Green Version]
- Méndez-Salazar, E.O.; Martínez-Nava, G.A. Uric acid extrarenal excretion: The gut microbiome as an evident yet understated factor in gout development. Rheumatol. Int. 2022, 42, 403–412. [Google Scholar] [CrossRef]
- Joshi, A.; McCormick, N.; Yokose, C.; Lu, N.; Choi, H. OP0164 A Population-Based, Prospective Metabolomics Study in the UK Biobank Identifies Glycoprotein Acetyls as a Novel Biomarker of Incident Gout. Ann. Rheum. Dis. 2022, 81 (Suppl. S1), 108. [Google Scholar] [CrossRef]
- Lu, J.; Dalbeth, N.; Yin, H.; Li, C.; Merriman, T.R.; Wei, W.H. Mouse models for human hyperuricaemia: A critical review. Nat. Rev. Rheumatol. 2019, 15, 413–426. [Google Scholar] [CrossRef] [PubMed]
- Lyu, S.; Ding, R.; Liu, P.; Ouyang, H.; Feng, Y.; Rao, Y.; Yang, S. LC-MS Analysis of Serum for the Metabolomic Investigation of the Effects of Pulchinenoside b4 Administration in Monosodium Urate Crystal-Induced Gouty Arthritis Rat Model. Molecules 2019, 24, 3161. [Google Scholar] [CrossRef] [Green Version]
- Shan, B.; Chen, T.; Huang, B.; Liu, Y.; Chen, J. Untargeted metabolomics reveal the therapeutic effects of Ermiao wan categorized formulas on rats with hyperuricemia. J. Ethnopharmacol. 2021, 281, 114545. [Google Scholar] [CrossRef] [PubMed]
- Wang, L.-M.; Wang, P.; Teka, T.; Zhang, Y.-C.; Yang, W.-Z.; Zhang, Y.; Wang, T.; Liu, L.-X.; Han, L.-F.; Liu, C.-X. 1H NMR and UHPLC/Q-Orbitrap-MS-Based Metabolomics Combined with 16S rRNA Gut Microbiota Analysis Revealed the Potential Regulation Mechanism of Nuciferine in Hyperuricemia Rats. J. Agric. Food Chem. 2020, 68, 14059–14070. [Google Scholar] [CrossRef]
- Zhao, L.; Zhao, T.; Yang, X.; Cao, L.; Xu, R.; Liu, J.; Lin, C.; Yu, Y.; Xuan, D.; Zhu, X.; et al. IL-37 blocks gouty inflammation by shaping macrophages into a non-inflammatory phagocytic phenotype. Rheumatology 2022, 61, 3841–3853. [Google Scholar] [CrossRef] [PubMed]
- Tani, T.; Okamoto, K.; Fujiwara, M.; Katayama, A.; Tsuruoka, S. Metabolomics analysis elucidates unique influences on purine/pyrimidine metabolism by xanthine oxidoreductase inhibitors in a rat model of renal ischemia-reperfusion injury. Mol. Med. 2019, 25, 40. [Google Scholar] [CrossRef] [Green Version]


Disclaimer/Publisher’s Note: The statements, opinions and data contained in all publications are solely those of the individual author(s) and contributor(s) and not of MDPI and/or the editor(s). MDPI and/or the editor(s) disclaim responsibility for any injury to people or property resulting from any ideas, methods, instructions or products referred to in the content. |
© 2023 by the authors. Licensee MDPI, Basel, Switzerland. This article is an open access article distributed under the terms and conditions of the Creative Commons Attribution (CC BY) license (https://creativecommons.org/licenses/by/4.0/).
Share and Cite
Li, R.; Liang, N.; Tao, Y.; Yin, H. Metabolomics in Hyperuricemia and Gout. Gout Urate Cryst. Depos. Dis. 2023, 1, 49-61. https://doi.org/10.3390/gucdd1010006
Li R, Liang N, Tao Y, Yin H. Metabolomics in Hyperuricemia and Gout. Gout, Urate, and Crystal Deposition Disease. 2023; 1(1):49-61. https://doi.org/10.3390/gucdd1010006
Chicago/Turabian StyleLi, Rui, Ningning Liang, Yongzhen Tao, and Huiyong Yin. 2023. "Metabolomics in Hyperuricemia and Gout" Gout, Urate, and Crystal Deposition Disease 1, no. 1: 49-61. https://doi.org/10.3390/gucdd1010006