
Diode Laser Overtone Spectroscopy of Methyl Iodide at 850 nm

Istituto Nazionale di Ottica del Consiglio Nazionale delle Ricerche (INO–CNR), S.S. “Adriano Gozzin” Pisa, Via Moruzzi 1, 56124 Pisa, Italy
Spectrosc. J. 2023, 1(1), 28-36; https://doi.org/10.3390/spectroscj1010003
Submission received: 15 March 2023
/
Revised: 7 April 2023
/
Accepted: 9 April 2023
/
Published: 12 April 2023
Abstract
:Using Tunable Diode Laser Absorption Spectroscopy (TDLAS), 82 CHI overtone absorption lines were detected for the first time in the range between 11,660 and 11,840 cm (844–857 nm), with strengths estimated around –10 cm/molecule. The lines were measured utilizing commercial heterostructure F–P type diode lasers, multipass cells, and wavelength modulation spectroscopy with the second harmonic detection technique. A high modulation amplitude approach was adopted for the analysis of the line shapes. Self-broadening coefficients were obtained for two lines.
1. Introduction
This work on methyl iodide or iodomethane (CHI) continues the previous work on methyl halides CHF [1] and CHCl [2] (C symmetry group), detected at 850 nm in the gas phase by the author. In fact, their absorption bands in the infrared (IR) and in the near-infrared (NIR) part of the e.m. spectra are very similar.
Methyl iodide is a prolate symmetric top molecule, which is used in agriculture as a pesticide and is present in the earth’s atmosphere, classified as a halogenated volatile organic compound (HVOC). It contributes to ozone layer depletion [3]. This molecule is one of the most studied symmetric tops in the IR, where it can be finely studied by spectroscopy using semiconductor sources.
The CHI absorption spectrum between 850 nm and 2.5 m has been detected previously by Gerhard and Luise Herzberg [4] using an infrared prism spectrometer, when they classified the observed overtone and combination bands. Even older is the work of Verleger on methyl halides at wavelengths below 1.2 m [5], where overtone bands were observed on photographic plates through a 3 m grating monochromator. Methyl iodide optical absorption was studied more recently in the NIR by Ishibashi and Sasada [6] with diode lasers as the sources to detect the 2 overtone band at 6050 cm with sub-Doppler resolution in a Fabry–Perot (F.–P.) type cavity measurement cell.
In this experimental work, a tunable diode laser spectrometer (TDLS) with frequency modulation and the second harmonic detection technique was used to observe the CHI ro-vibrational band at around 11,740 cm (850 nm), with a resolution of 0.01 cm. This NIR band is presumably related to the third overtone of the quanta of C–H stretching excitation [4] or a combination of overtones, such as, for instance, 2 + 2. This may imply overlapping bands, whose upper states are often coupled by various interactions, such as the Fermi and the Coriolis resonances [7]. For this reason it is difficult to identify the right quanta of vibration and rotation, unless sophisticated techniques such as microwave-optical double resonance [8] are used.
This band is very weak, as the dipole moment is even less than the one of CHF and CHCl, as the C–I bond length is shorter than the C–F and C–Cl ones; therefore, a lower absorption strength for this molecule is expected. It is therefore necessary to use long optical paths and noise reduction techniques to observe and study these absorption lines. Frequency modulation spectroscopy [9], conventionally called Wavelength Modulation Spectroscopy (WMS) when the value of the frequency of the modulation is chosen much lower than the sampled line width, was used here as the noise reduction technique.
In the following, we see how this technique allowed detection for the first time of the very weak ro-vibrational CHI lines at 850 nm and to study their behavior at different gas pressures.
2. Experimental Details
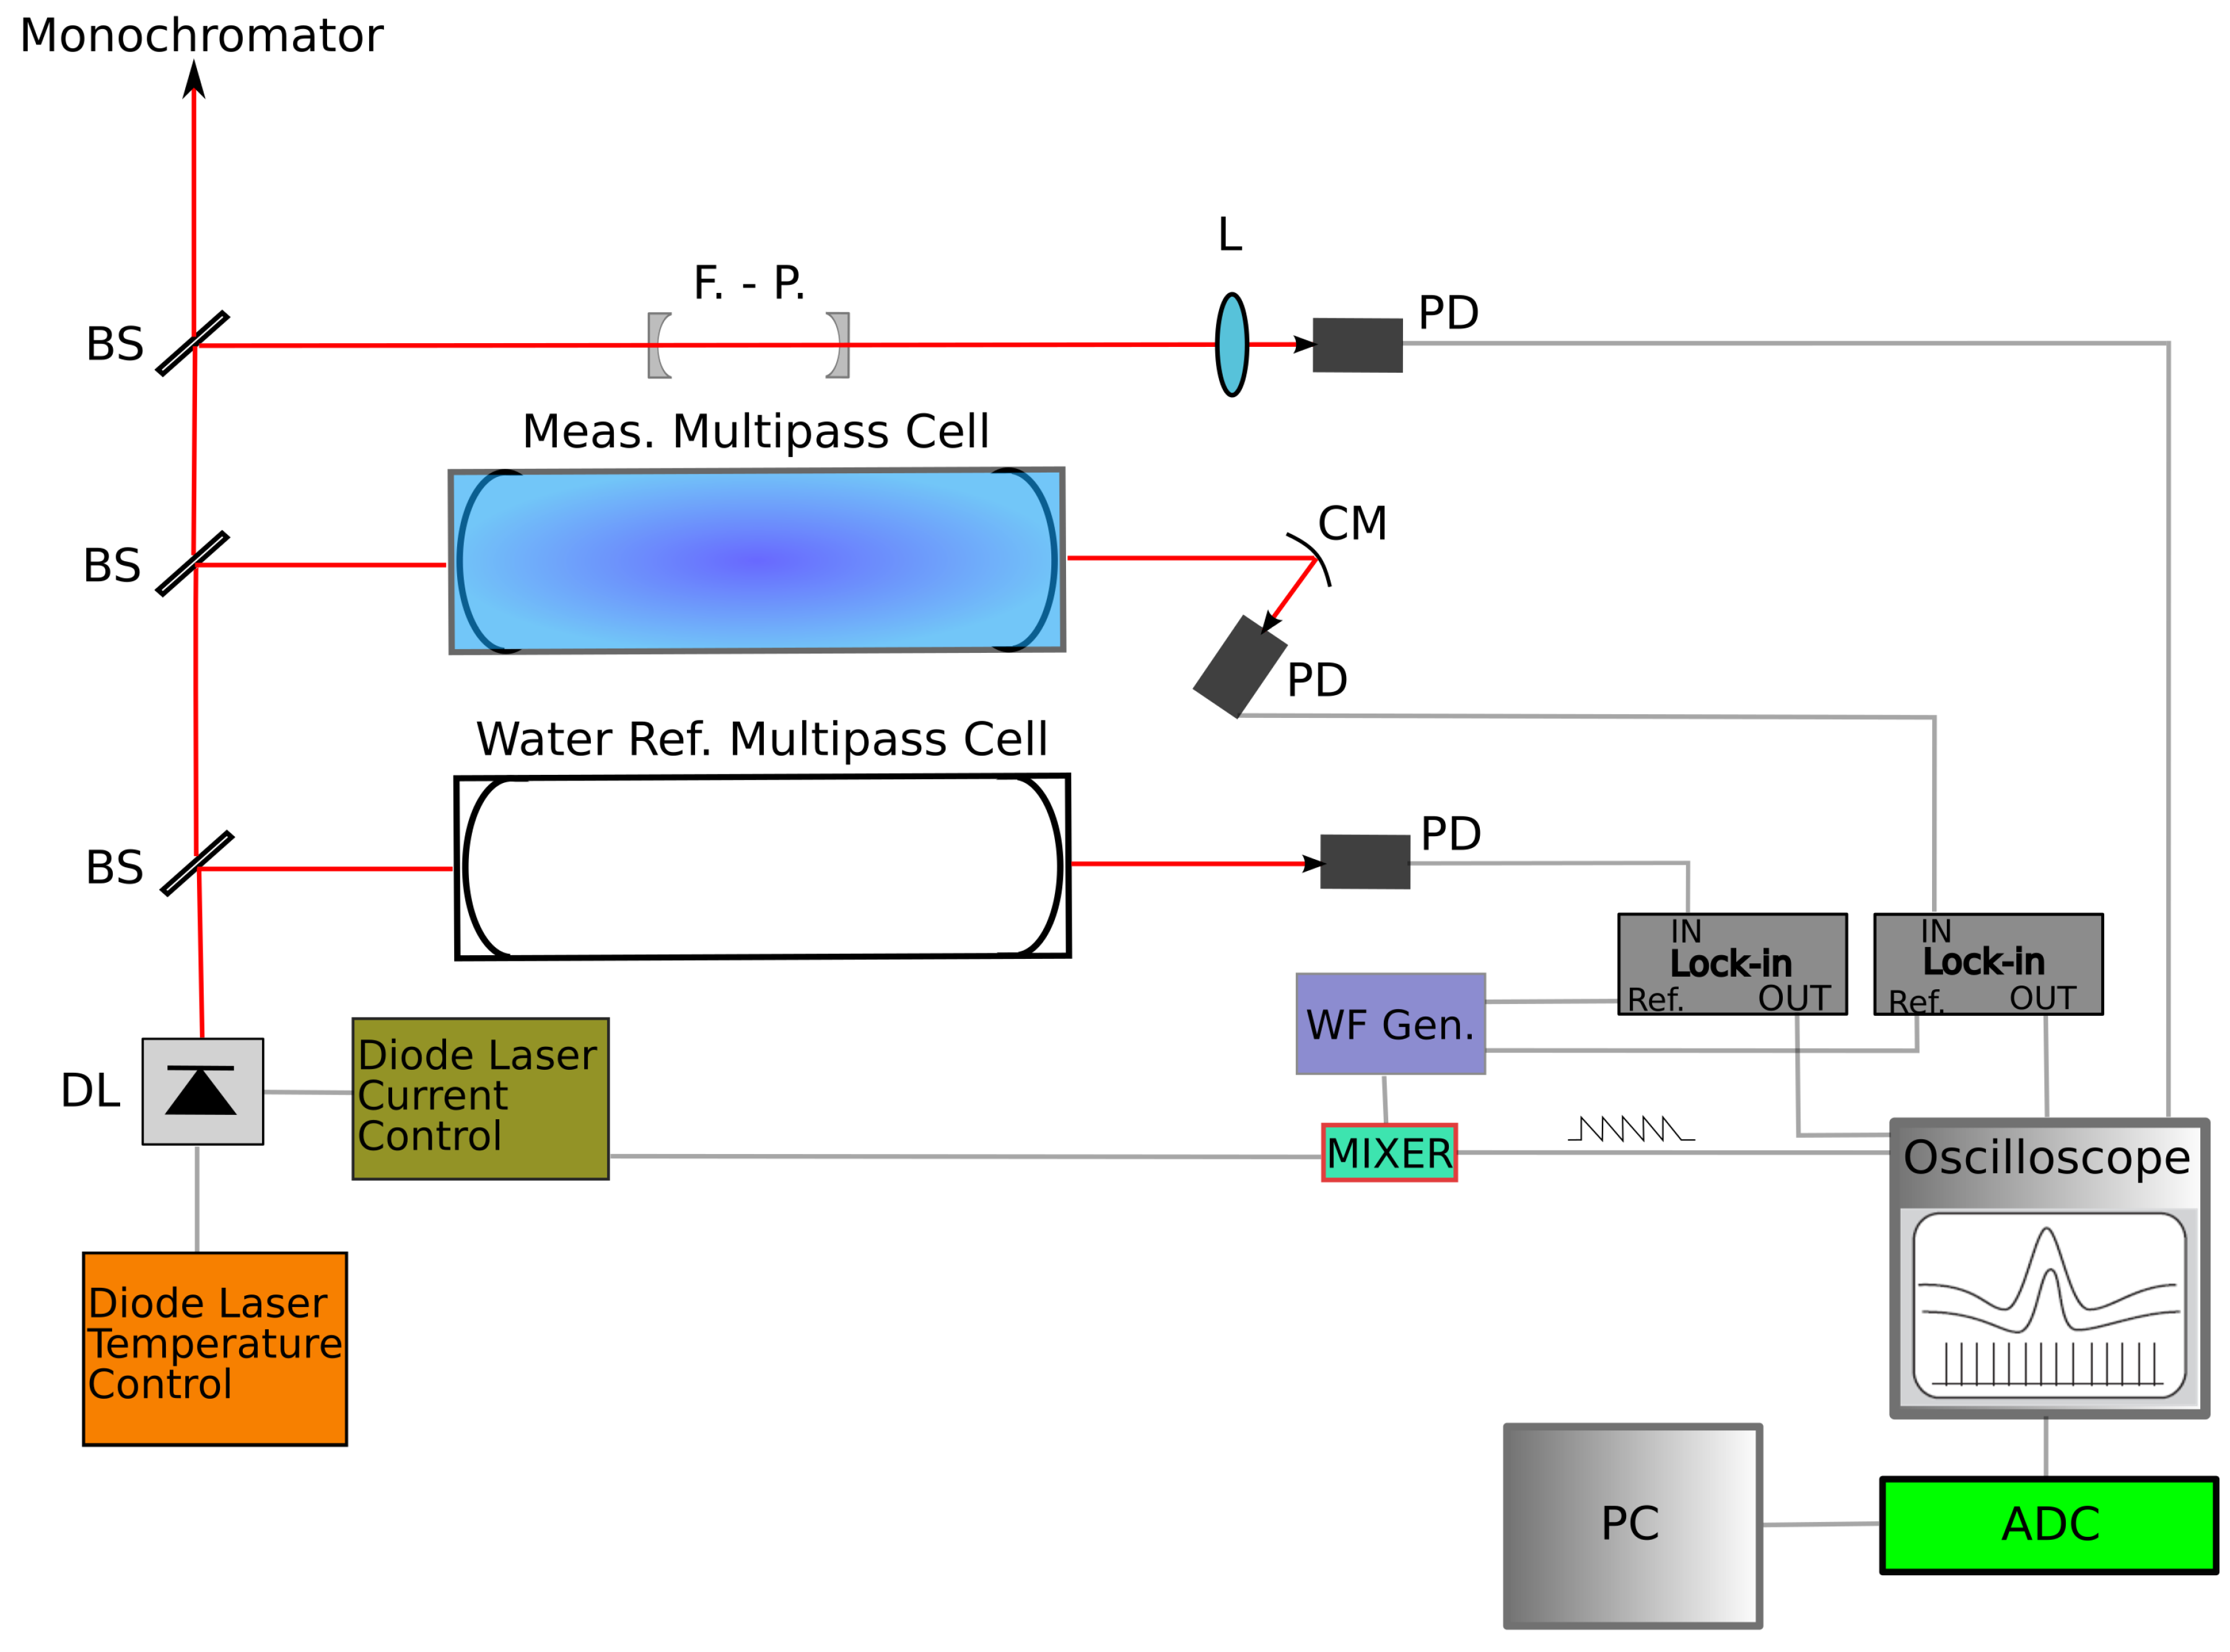
The adopted experimental setup is sketched in Figure 1 and follows the previous work on CHCl [2]. The employed source was the AlGaAs/GaAs double heterostructure F.–P. type diode laser (DL), Thorlabs L852P100, with single longitudinal and transverse emission mode and maximum power ≃100 mW cw in free-running configuration.
The DL temperature control is very critical, as its typical emission wavelength varies 0.1 nm/K; therefore, a customized bipolar temperature controller was used to drive a Peltier junction coupled to the DL mount. This guaranteed a stability of ∼0.002 K per hour. Moreover, the DL current needs precise and fine control, since the characteristic slope of the DL emission is about 0.01 nm/mA. Consequently, a low noise DL current controller was needed: for this experiment, a custom-made precise current source was used, operating between 0 and 250 mA, with an accuracy of A. To modulate and sweep the source frequency, a sine wave carrier signal from a low noise waveform generator was mixed with a ramp extracted from the oscilloscope sawtooth signal and fed to the DL current controller.
Two custom Herriott-type astigmatic multipass cells with optical path lengths of 30 m were used to house the sample and reference gases. The latter contained water vapor at room temperature (RT) with a partial pressure torr and was used as the reference gas for wavenumber measurements (for this purpose, the HITRAN2016 molecular spectroscopic database [10] was adopted) and to verify whether the water absorption lines could interfere with the observed CHI lines. At the exit of the measurement cell, a concave mirror focused the laser beam on the active spot of the photodiode (PD), with the purpose of reducing the mechanical noise originating from the optical leverage of the spectroscope set.
The detectors chosen for the purpose were preamplified silicon PDs (Centronic OSD5-5T) with an active surface of 2.52 mm in diameter, whose outputs were sent to lock-in amplifiers tuned to the carrier frequency ( kHz) from the waveform generator. It was verified that the residual phase errors in the synchronization of the two lock-in amplifiers could induce at most a corresponding wavenumber error of 0.003 cm. A confocal 5 cm F.–P. interferometer (f.s.r. = 0.05 cm) was utilized to check the DL emission mode and the linearity of its emission frequency, while a 0.35 m focal length Czerny–Turner monochromator with 1180 lines per mm grating was used for the rough wavelength check ( nm).
The vacuum in the sample cell was obtained by using a double stage rotary pump with limit pressure <1 × torr, and the pressure inside the cell was measured directly by a capacitive pressure gauge (accuracy torr). All experiments were conducted at room temperature and at pressure values ranging from 20 to 90 torr. Analytical grade methyl iodide (Sigma-Aldrich, 99% purity, with silver as stabilizer) was used as supplied. The sample was contained in a stainless steel tube and allowed to flow into the evacuated measuring cell at its vapor pressure.
Wavelength Modulation Spectroscopy
Let us describe the transmittance by the Lambert–Beer expression
where is the product of the density of the absorbing species and the optical path l of the radiation through the sample, and is the absorption cross section, which follows the behavior of the line shape. In regimes of small optical density [], as in most experimental conditions, Equation (1) becomes
The WMS technique applied was achieved here by modulating the the source emission frequency at , with amplitude a:
The transmitted intensity could then be written as a cosine Fourier series:
where is the n-th harmonic component of the modulated signal. With a lock-in amplifier tuned to a multiple () of the modulation frequency, an output signal proportional to the n-th component was obtained. In the case where the value of a is chosen smaller than the line-width, the n-th Fourier component is proportional to the n-th derivative of the original signal:
In order to detect very low absorbances, a high modulation amplitude regime is required, which implies a modulation index , where is the absorption line width.
Line position measurements were carried out at pressures around 30 torr. In this condition, where the collisional effect was not negligible, the absorption line shape was well described by the Voigt profile, a convolution of the Gaussian (Doppler regime) and Lorentzian (collisional regime) functions:
where is the gas resonance frequency, and and are the Gaussian and the Lorentzian half-width at half-maximums (HWHMs), respectively. Second-order effects, such as a velocity-changing collision or Dicke narrowing [11], were not observed within the sensitivity of the apparatus and therefore were not taken into account.
The phase detection technique, obtained by tuning the lock-in amplifiers to twice the modulation frequency ( kHz), produced a line-shape signal that was closer to the second derivative of the absorption feature, as the minor was the amplitude of the modulation. The symmetry of the line shape was not perfect due to the simultaneous amplitude modulation of the source as the DL injection current varied; however, this effect becomes negligible in high modulation regimes. This “ detection” brings the advantage of a flat baseline of the signal but cannot avoid optical interferences, coming from the many reflecting surfaces present in the optical path. In this specific case, this drawback limited the detection sensitivity to absorbances higher than . Under these conditions, this technique could not provide a reliable measurement of the intensity parameter when applied to very weak resonances. For this reason, it was possible only to estimate the strengths of the CHI absorption lines, which here appeared to fall in the range from a comparison with the absorption line strengths of the water vapor present in the same spectrum, when a known partial pressure of this gas was added into the measurement cell. The intensity distribution of the observed CHI lines showed a typical behavior of the ro-vibrational spectra, centered around 11,740 cm, where the strongest lines were found.
To obtain line positions and widths with good reliability even for the weakest lines, the values of the modulation index m were set around 2.0–2.3. This improved the S/N ratio but did not allow the use of Equation (5) any more. The approximate function that represented the absorption line distorted by the modulation was specifically evaluated and is reported in the Appendix A. A nonlinear least squares fit method was applied to extract the line parameters from the collected profiles.
Finally, the following expression of the collisional half-width at half-maximum (HWHM), as a function of pressure, was adopted for the line broadening calculations:
where p is the sample gas pressure, and is the gas self-broadening coefficient.
3. Experimental Results
The 82 detected CHI absorption lines are listed in Table 1, where the maximum error on the wavenumber () was within the second decimal unit, referring to the ten times more precise HO atlas [10]. The wavelengths are reported for convenience in air at T = 294 K, following the work of Edlén [12].
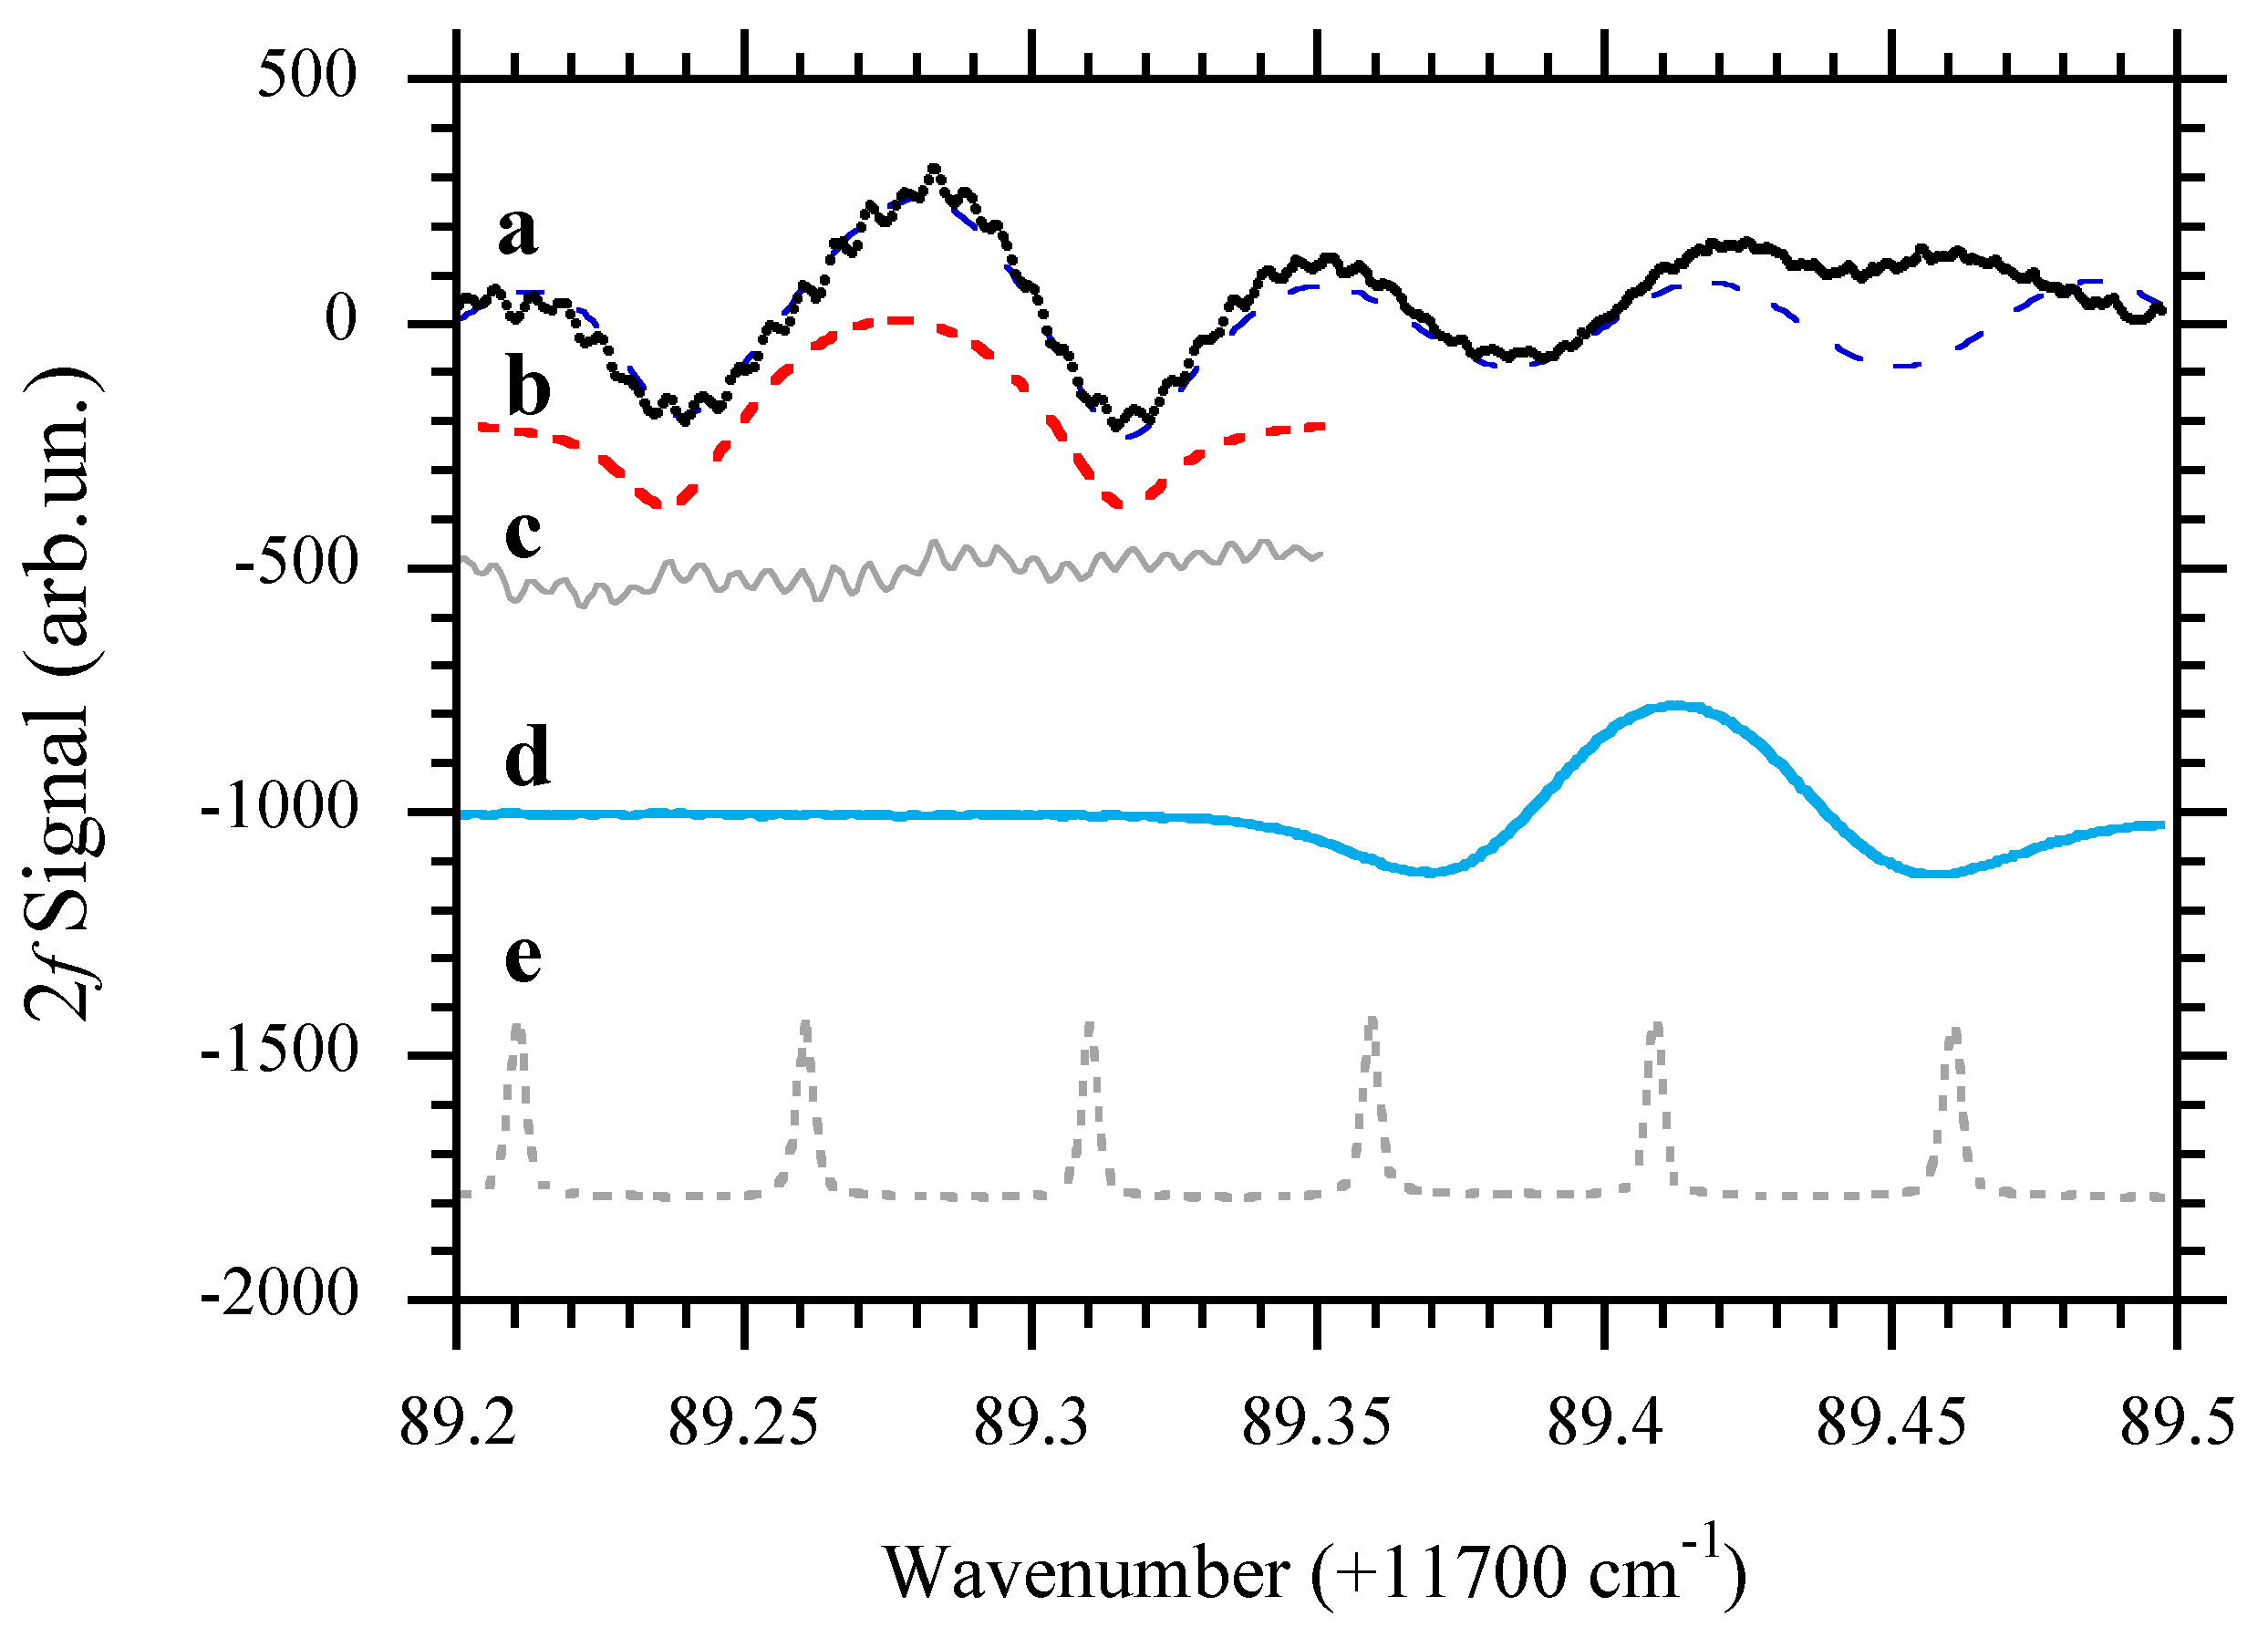
Figure 2 presents the absorption measurement signal for CHI at 11,789.28 cm, T = 294 K, torr, and , along with the fit and its residuals. It also displays the HO reference signal at 11,789.41 cm and the transmission of the F.–P. interferometer used for frequency linearization. The evident etalon effect in the CHI measurement plot originated from the reflections within the optical path, and it was taken into account in the fit procedure. Only the higher frequency fringes remained in the fit residuals, originating from the confocal mirrors of the multipass cell; in fact, the distance between them was cm and 1 cm.
The self-broadening coefficients () were measured for the first time for two CHI absorption lines at RT and are shown in Table 2.
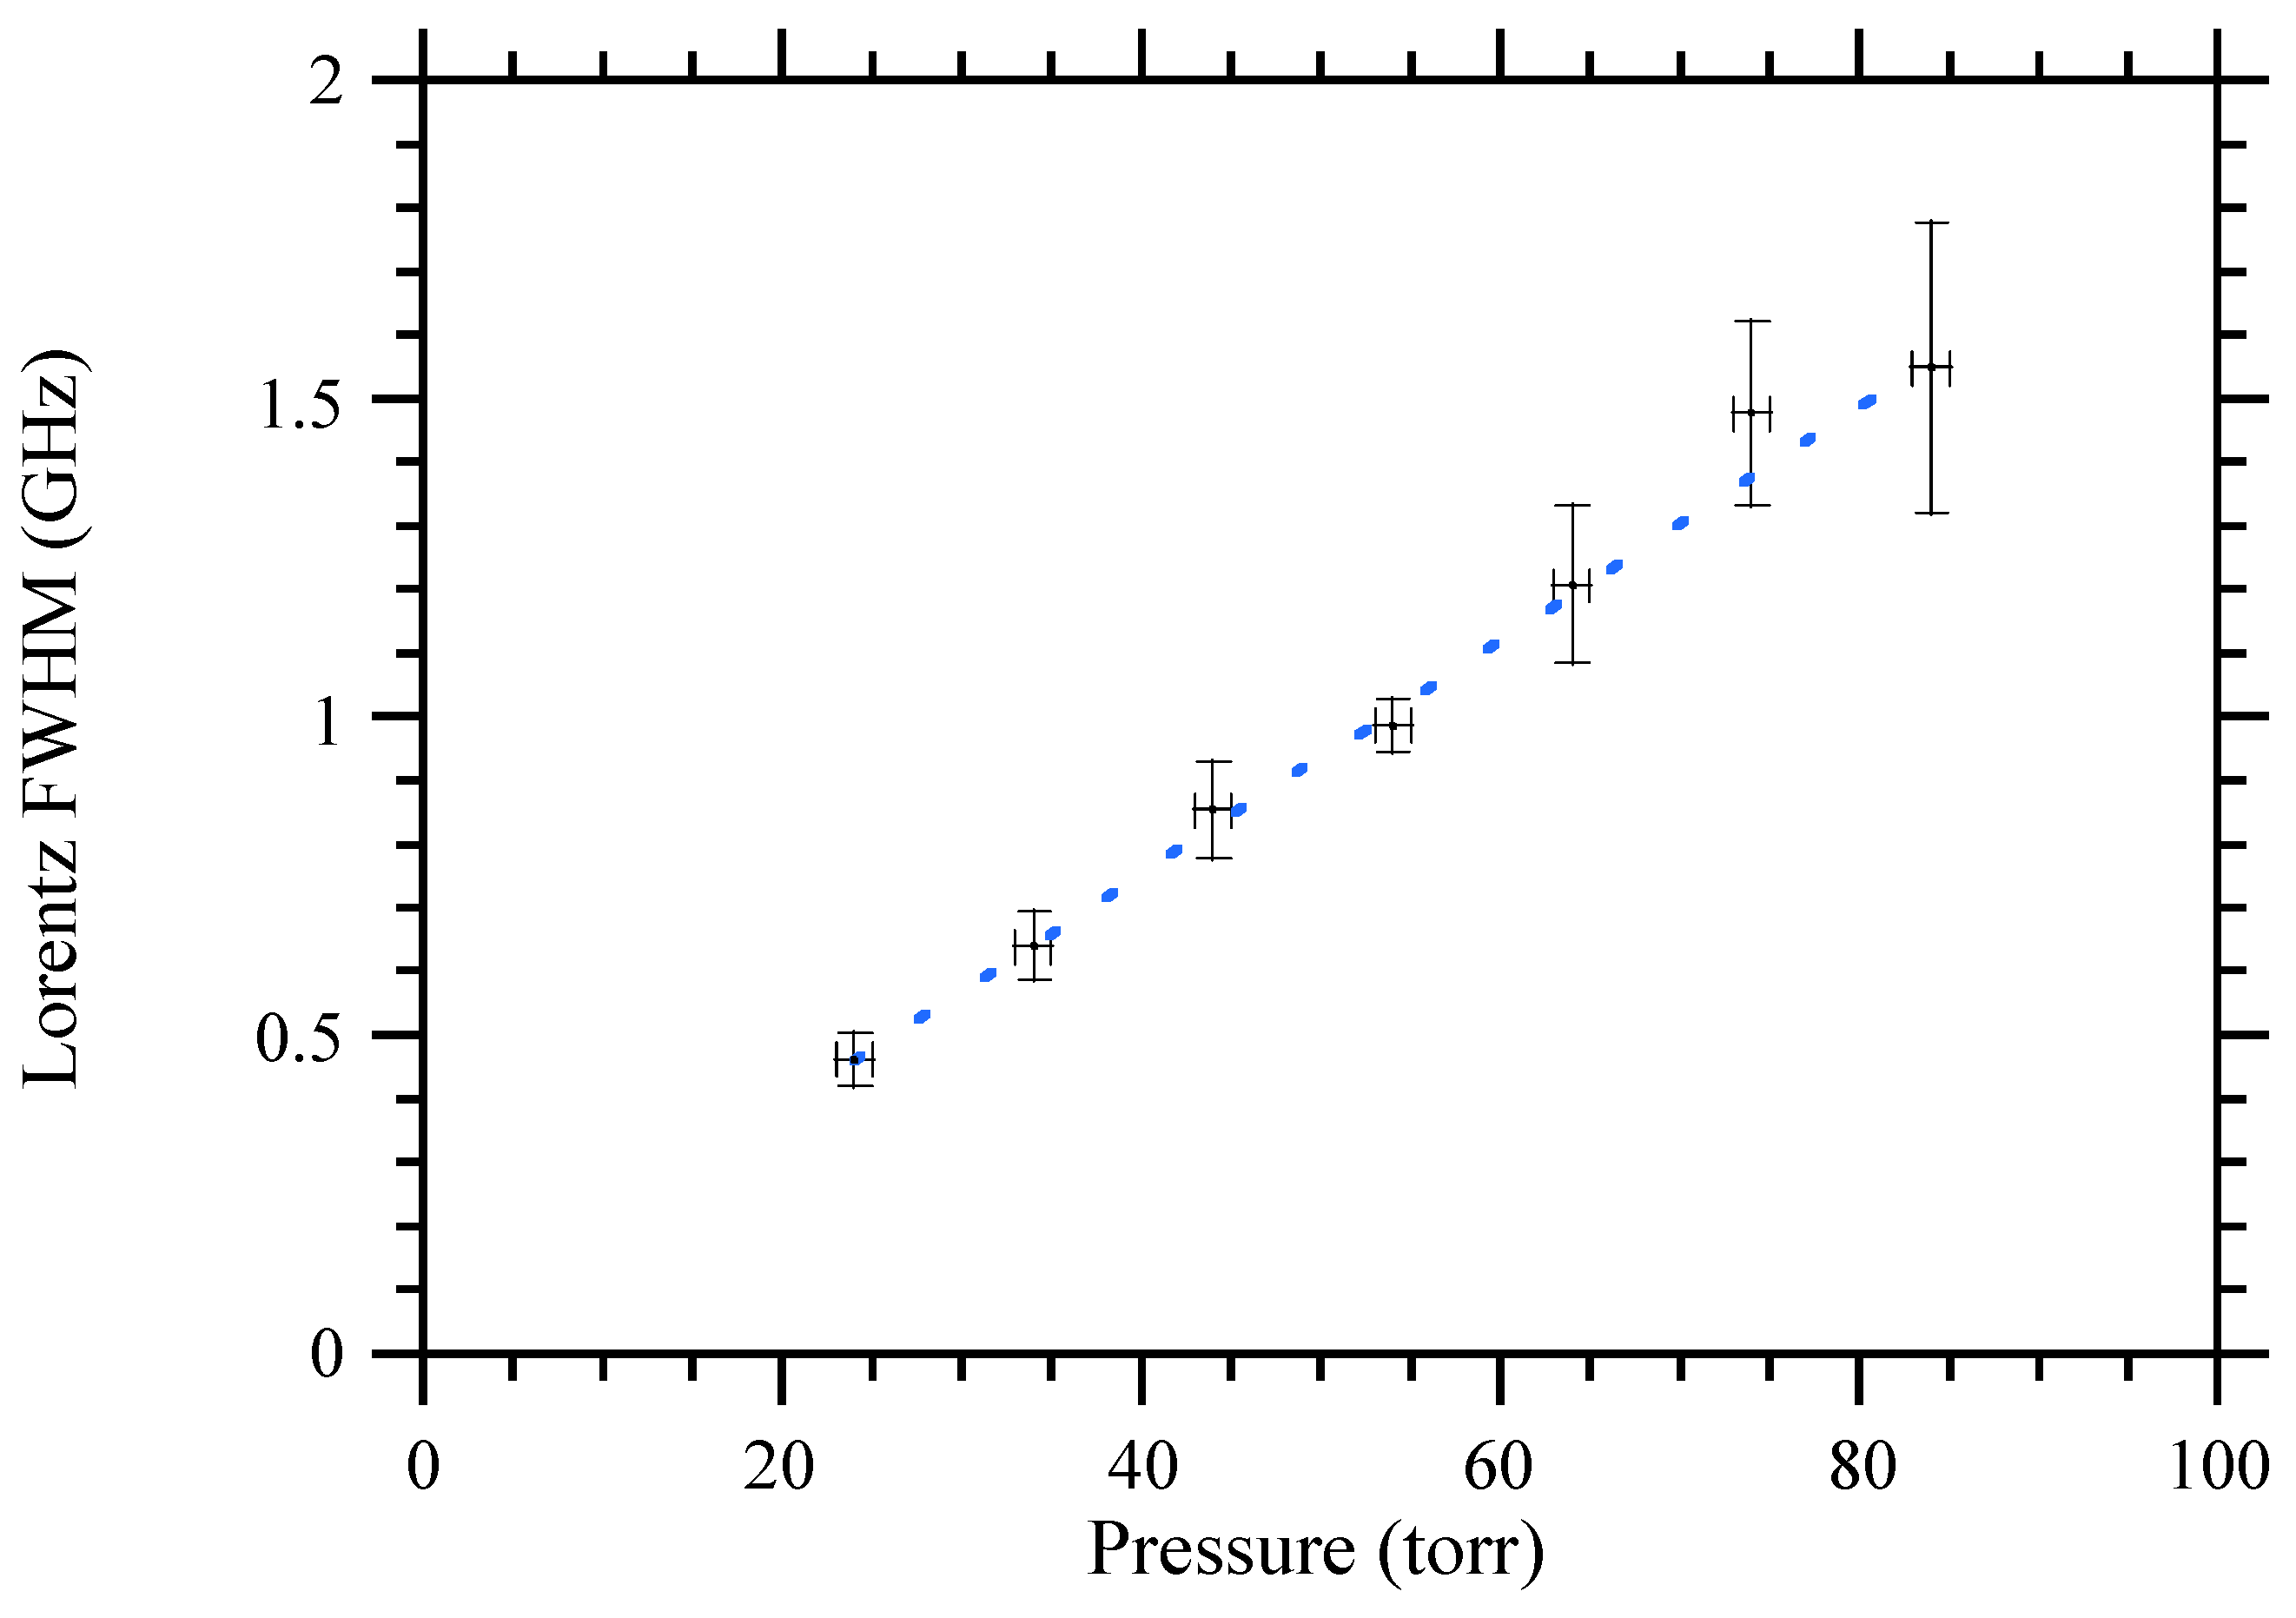
The self-broadening measurement for the line at 11,741.39 cm is shown in Figure 3, where the Lorentz component of the absorption line width is plotted as a function of methyl iodide pressure at RT.
In the literature, we did not find any measurements of pressure line-broadening at these wavenumbers, but a comparison can be attempted with what was obtained in other spectral regions.
From the HITRAN database [10], for the fundamental band at 3.3 m, the is reported between 0.1 and 0.5 cm/atm at 296 K. Hoffman et al. [13], using diode laser absorption spectroscopy, observed at RT for the band at 7 m from 0.10 to 0.45 cm/atm. Raddaoui et al. [14], using a Fourier transform spectrometer at RT, obtained ranging from 0.10 cm/atm (at low and high quantum rotational parameter J) to 0.45 cm/atm for the fundamental roto-vibrational band of CHI at around 11 m. Again, in this ro-vibrational band at RT, Attafi et al. [15] obtained from 0.15 to 0.36 cm/atm. Belli et al. [16], using the Doppler-free double-resonance technique, measured the self-collisional broadening parameters at RT for some absorption lines in the fundamental band, presenting values ranging from 0.18 to 0.20 cm/atm. Finally, Ben Fathallah et al., using Fourier transform spectroscopy at RT, obtained self-broadening coefficient values from 0.14 to 0.36 cm/atm for the bands and [17]; while for the band [18] at around 8 m, they obtained an average value of equal to 0.25 cm/atm, with a minimum at 0.1 cm/atm and a maximum at 0.4 cm/atm.
Our results were all within these ranges.
4. Conclusions
In total, 82 new CHI absorption lines between 11,660 and 11,840 cm were measured for the first time with a precision of 0.01 cm, using a tunable diode laser spectrometer, wavelength modulation spectroscopy, and the second harmonic detection technique in a 30 m Herriott-type multipass cell. A high modulation amplitude approach was adopted, and a dedicated fit function was developed. The strength of the observed lines varied between and cm/molecule at room temperature. For two of the observed lines, self-broadening coefficients similar to those reported for the same molecule in other spectral regions were obtained for the first time.
Funding
This research received no external funding.
Institutional Review Board Statement
Not applicable.
Informed Consent Statement
Not applicable.
Data Availability Statement
The data are contained within the article.
Acknowledgments
The author wishes to thank A. Barbini for the electronic advising, as well as M. Tagliaferri and M. Voliani for the technical assistance.
Conflicts of Interest
The author declares no conflict of interest.
Abbreviations
The following abbreviations are used in this manuscript:
| MDPI | Multidisciplinary Digital Publishing Institute |
| DL | Diode laser |
| F–P | Fabry–Perot |
| HVOC | Halogenated volatile organic compound |
| HWHM | Half-width at half-maximum |
| IR | Infrared |
| NIR | Near-infrared |
| PD | Photodiode |
| RT | Room temperature |
| S/N | Signal-to-noise |
| TDLAS | Tunable diode laser absorption spectroscopy |
| WMS | Wavelength modulation spectroscopy |
Appendix A. Frequency Modulation in the High-Amplitude Regime
The use of high modulation amplitude a is a necessity in order to increase the S/N ratio for very weak absorption lines. In this case the derivative approximation of Equation (5) no longer works, and it is more appropriate to start from the other expression [19]:
In order to extract the collisional component from the absorption line-shape, Arndt [20] and Wahlquist [21] derived the analytic form of the harmonics for a Lorentzian function, which is the right choice when dealing with collisional broadening.
To do this, they obtained the nth harmonic element inverting Equation (4):
where
is the Fourier transform of the transmittance profile; and , is the line width; is the nth order Bessel function; , (); and i is the imaginary unit. The absorption cross section in Equation (2) is then put into the Lorentzian form:
The second Fourier component of the absorption cross section can be recalculated following Arndt’s work by setting :
and by eliminating the imaginary part:
where
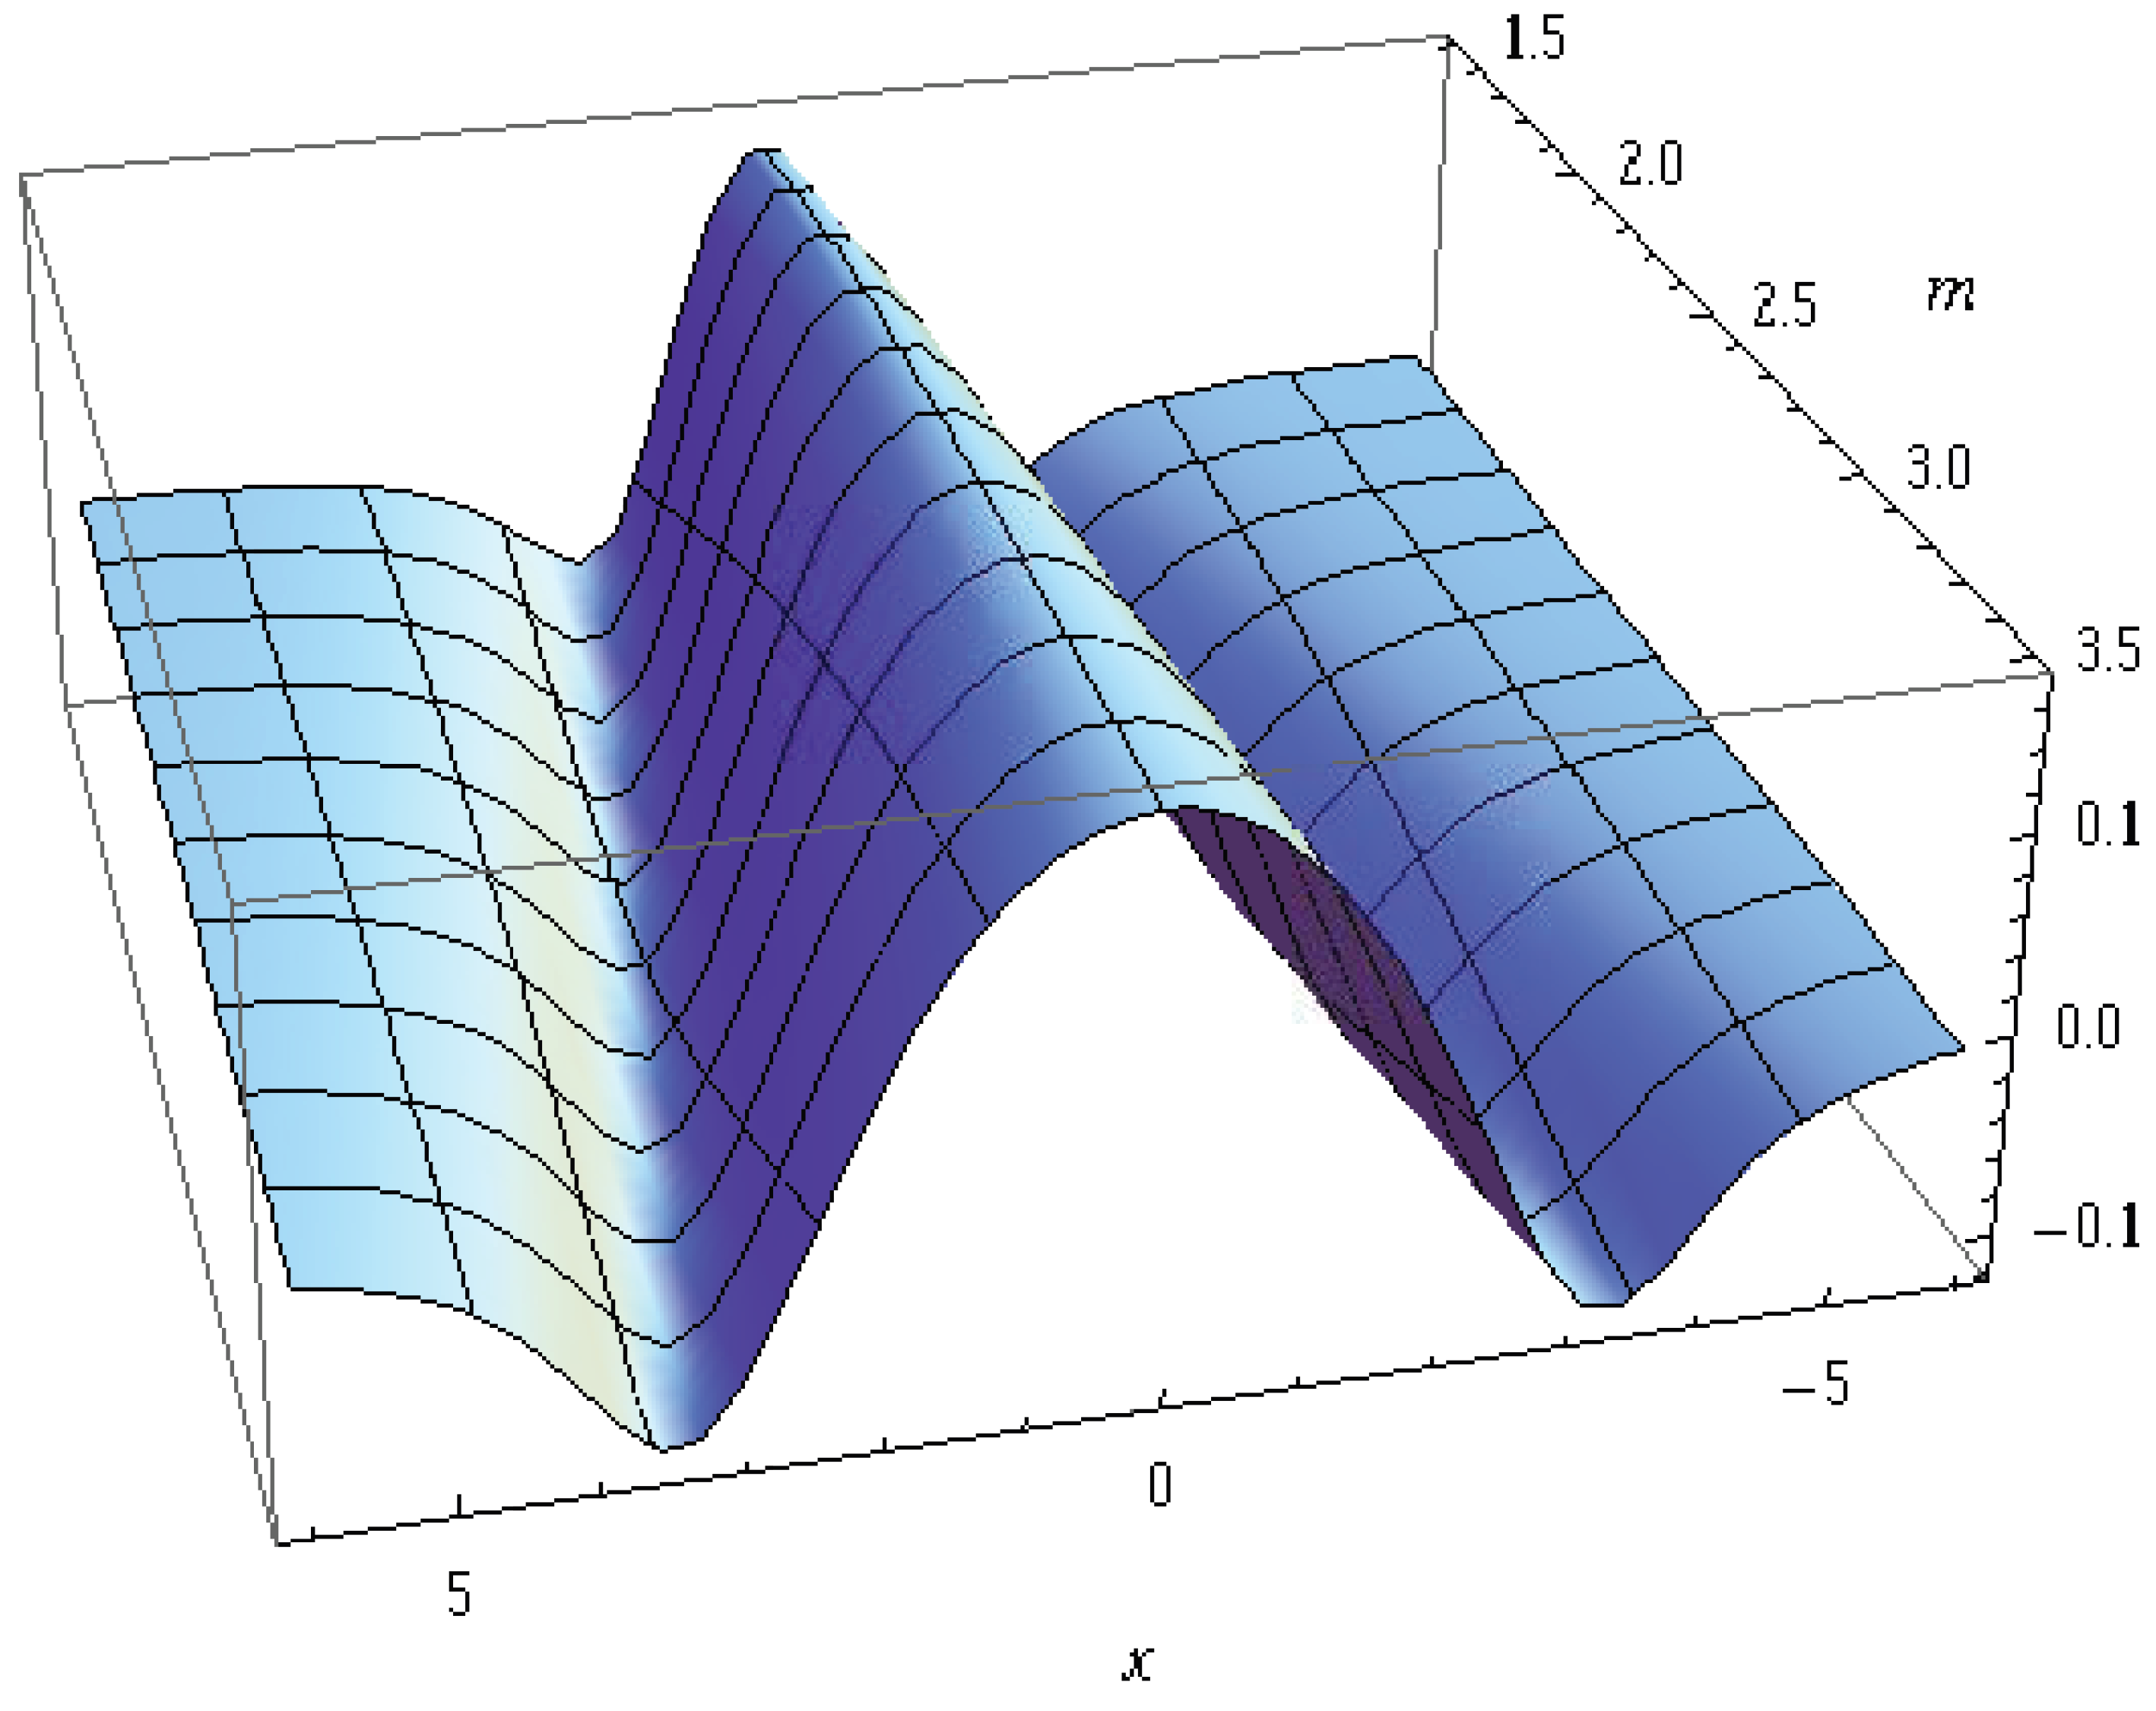
Equation (A6), close to the second derivative of the absorption feature only for low m, simulates the behavior of the line shape at high modulation amplitudes. This is shown in Figure A1, where the equation is plotted in 3D, varying the modulation index m. For , the second derivative is completely deformed by broadening, as occurs in reality.
Figure A1.
Behavior of Equation (A6) as a function of the modulation parameter m.
Figure A1.
Behavior of Equation (A6) as a function of the modulation parameter m.

References
- Lucchesini, A.; Gozzini, S. Diode Laser Spectroscopy of Methyl Fluoride Overtones at 850 nm. J. Quant. Spectrosc. Radiat. Transfer. 2013, 130, 352–358. [Google Scholar] [CrossRef]
- Lucchesini, A.; Gozzini, S. Diode Laser Spectroscopy of Methyl Chloride Overtones at 850–860 nm. J. Quant. Spectrosc. Radiat. Transfer. 2016, 168, 170–175. [Google Scholar] [CrossRef]
- Laube, J.C.; Tegtmeier, S.; Fernandez, R.P.; Harrison, J.; Hu, L.; Krummel, P.; Mahieu, E.; Park, S.; Western, L. Update on Ozone-Depleting Substances (ODSs) and Other Gases of Interest to the Montreal Protocol. In Scientific Assessment of Ozone Depletion: 2022; World Meteorological Organization: Geneva, Switzerland, 2022; Chapter 1; pp. 55–113. [Google Scholar]
- Herzberg, G.; Herzberg, L. Absorption Spectrum of Methyl Iodide in the Near Infrared. Can. J. Res. 1949, 27b, 332–338. [Google Scholar] [CrossRef]
- Verleger, H. Das Rotationsschwingungsspektrum der Methylhalogenide im Photographischen Ultrarot bei 1.11 μm. Z. Phys. 1935, 98, 342–352. [Google Scholar] [CrossRef]
- Ishibashi, C.; Sasada, H. Near-Infrared Laser Spectrometer with Sub-Doppler Resolution, High Sensitivity, and Wide Tunability: A Case Study in the 1.65-μm Region of CH3I Spectrum. J. Mol. Spectrosc. 2000, 200, 147–149. [Google Scholar] [CrossRef] [PubMed]
- Law, M.M. Joint Local- and Normal-Mode Studies of the Overtone Spectra of the Methyl Halides: CH3F, CH3Cl, CH3Br, CD3Br, and CH3I. J. Chem. Phys. 1999, 111, 10021–10033. [Google Scholar] [CrossRef]
- Ishibashi, C.; Saneto, R.; Sasada, H. Infrared Radio-Frequency Double-Resonance Spectroscopy of Molecular Vibrational-Overtone Bands Using a Fabry–Perot Cavity-Absorption Cell. J. Opt. Soc. Am. B 2001, 18, 1019–1030. [Google Scholar] [CrossRef]
- Bjorklund, G.C. Frequency-Modulation Spectroscopy: A New Method for Measuring Weak Absorptions and Dispersions. Opt. Lett. 1980, 25, 15–17. [Google Scholar] [CrossRef] [PubMed]
- Gordon, I.E.; Rothman, L.S.; Hill, C.; Kochanov, R.V.; Tan, Y.; Bernath, P.F.; Birk, M.; Boudon, V.; Campargue, A.; Chance, K.V.; et al. The HITRAN 2016 Molecular Spectroscopic Database. J. Quant. Spectrosc. Radiat. Transfer. 2017, 203, 3–69, HITRAN2016 Special Issue. [Google Scholar] [CrossRef]
- Dicke, R.H. The Effect of Collision upon the Doppler Width of the Spectral Lines. Phys. Rev. 1953, 89, 472–473. [Google Scholar] [CrossRef]
- Edlén, B. The Refractive Index of Air. Metrologia 1966, 2, 71–80. [Google Scholar] [CrossRef]
- Hoffman, K.J.; Davies, P.B. Pressure Broadening Coefficients of ν5 Fundamental Band Lines of CH3I at 7 μm Measured by Diode Laser Absorption Spectroscopy. J. Mol. Spectrosc. 2008, 252, 101–107. [Google Scholar] [CrossRef]
- Raddaoui, E.; Troitsyna, L.; Dudaryonok, A.; Soulard, P.; Guinet, M.; Aroui, H.; Buldyreva, J.; Lavrentieva, N.; Jacquemart, D. Line Parameters Measurements and Modeling for the ν6 Band of CH3I: A Complete Line List for Atmospheric Databases. J. Quant. Spectrosc. Radiat. Transfer. 2019, 232, 165–179. [Google Scholar] [CrossRef] [Green Version]
- Attafi, Y.; Ben Hassen, A.; Aroui, H.; Kwabia Tchana, F.; Manceron, L.; Doizi, D.; Vander Auwera, J.; Perrin, A. Self and N2 Collisional Broadening of Rovibrational Lines in the ν6 Band of Methyl Iodide (12CH3I) at Room Temperature: The J and K Dependence. J. Quant. Spectrosc. Radiat. Transfer. 2019, 231, 1–8. [Google Scholar] [CrossRef] [Green Version]
- Belli, S.; Buffa, G.; Di Lieto, A.; Minguzzi, P.; Tarrini, O.; Tonelli, M. Hyperfine Level Dependence of the Pressure Broadening of CH3I Rotational Transitions in the ν6 = 1 Vibrational State. J. Mol. Spectrosc. 1980, 201, 314–318. [Google Scholar] [CrossRef] [PubMed]
- Ben Fathallah, O.; Hmida, F.; Boughdiri, A.; Manceron, L.; Rotger, M.; Aroui, H. Line Intensities and Self-Broadening Coefficients of CH3I in the Region of ν5 and ν3+ν6 Bands. J. Quant. Spectrosc. Radiat. Transfer. 2021, 275, 107893. [Google Scholar] [CrossRef]
- Ben Fathallah, O.; Hammi, W.; Boughdiri, A.; Manceron, L.; Aroui, H. Measurements of Line Intensities and Self-Broadening Coefficients in the ν2 Band of CH3I. J. Quant. Spectrosc. Radiat. Transfer. 2021, 259, 107449. [Google Scholar] [CrossRef]
- Webster, C.R.; Menzies, R.T.; Hinkley, E.D. Infrared Laser Absorption: Theory and Applications. In Laser Remote Chemical Analysis; Measures, R.M., Ed.; John Wiley & Sons, Ltd.: New York, NY, USA, 1988. [Google Scholar]
- Arndt, R. Analytical Line Shapes for Lorentzian Signals Broadened by Modulation. J. Appl. Phys. 1965, 36, 2522–2524. [Google Scholar] [CrossRef]
- Wahlquist, H. Modulation Broadening of Unsaturated Lorentzian Lines. J. Chem. Phys. B 1961, 35, 1708–1710. [Google Scholar] [CrossRef]
Figure 1.
Outline of the experimental apparatus. ADC: analog-to-digital converter; BS: beam splitter; CM: concave mirror; DL: diode laser; F.– P.: confocal Fabry–Perot interferometer; L: lens; PC: desktop computer; PD: photodiode; WF Gen.: waveform generator.
Figure 1.
Outline of the experimental apparatus. ADC: analog-to-digital converter; BS: beam splitter; CM: concave mirror; DL: diode laser; F.– P.: confocal Fabry–Perot interferometer; L: lens; PC: desktop computer; PD: photodiode; WF Gen.: waveform generator.

Figure 2.
Second harmonic absorption signal of CHI around 848 nm (black dots) at torr and RT, with the best fit (dashed blue line) (a), the extracted peak fit (b), and the residuals (c), along with the HO reference signal (d), all obtained by WMS with 10 Hz bandwidth. The F.–P. interferometer transmission (f.s.r. = 0.05 cm) is also shown (e).

Figure 3.
Self-broadening measurements on the methyl iodide 11,741.39 cm absorption line at RT obtained by TDLS and the procedure explained in the text. The blue dashed line shows the best linear fit.
Figure 3.
Self-broadening measurements on the methyl iodide 11,741.39 cm absorption line at RT obtained by TDLS and the procedure explained in the text. The blue dashed line shows the best linear fit.


Table 1.
Wavenumbers and wavelengths (in air at room temperature) of the detected CHI absorption lines, with the maximum error within the second decimal unit.
Table 1.
Wavenumbers and wavelengths (in air at room temperature) of the detected CHI absorption lines, with the maximum error within the second decimal unit.
| (cm) | (Å) | (cm) | (Å) | (cm) | (Å) | (cm) | (Å) |
|---|---|---|---|---|---|---|---|
| 11,659.92 | 8574.08 | 11697.76 | 8546.35 | 11,720.95 | 8529.44 | 11,772.70 | 8491.94 |
| 11,660.13 | 8573.93 | 11,698.02 | 8546.16 | 11,730.12 | 8522.77 | 11,777.29 | 8488.63 |
| 11,664.91 | 8570.41 | 11,700.55 | 8544.31 | 11,730.34 | 8522.61 | 11,777.94 | 8488.17 |
| 11,665.03 | 8570.33 | 11,700.85 | 8544.09 | 11,730.43 | 8522.54 | 11,778.05 | 8488.09 |
| 11,667.27 | 8568.68 | 11,700.95 | 8544.02 | 11,730.62 | 8522.41 | 11,778.27 | 8487.93 |
| 11,683.78 | 8556.57 | 11,704.88 | 8541.15 | 11,738.96 | 8516.35 | 11,785.46 | 8482.75 |
| 11,683.92 | 8556.47 | 11,706.39 | 8540.04 | 11,739.46 | 8515.99 | 11,785.65 | 8482.61 |
| 11,684.03 | 8556.39 | 11,706.48 | 8539.98 | 11,739.58 | 8515.90 | 11,786.01 | 8482.35 |
| 11,684.18 | 8556.28 | 11,706.55 | 8539.94 | 11,739.69 | 8515.82 | 11,788.60 | 8480.49 |
| 11,684.43 | 8556.10 | 11,706.77 | 8539.77 | 11,739.80 | 8515.74 | 11,789.28 | 8480.00 |
| 11,684.58 | 8555.99 | 11,709.79 | 8537.57 | 11,741.14 | 8514.77 | 11,798.00 | 8473.73 |
| 11,684.74 | 8555.87 | 11,709.94 | 8537.46 | 11,741.39 | 8514.59 | 11,805.97 | 8468.01 |
| 11,684.95 | 8555.41 | 11,710.29 | 8537.20 | 11,748.32 | 8509.57 | 11,806.13 | 8467.90 |
| 11,686.83 | 8554.34 | 11,710.55 | 8537.01 | 11,761.04 | 8500.36 | 11,826.25 | 8453.49 |
| 11,687.14 | 8554.11 | 11,711.17 | 8536.56 | 11,761.75 | 8499.85 | 11,827.97 | 8452.26 |
| 11,687.44 | 8553.89 | 11,711.41 | 8536.38 | 11,767.15 | 8495.95 | 11,841.21 | 8442.81 |
| 11,687.72 | 8553.69 | 11,711.53 | 8536.30 | 11,767.29 | 8495.85 | 11,841.39 | 8442.68 |
| 11,694.13 | 8549.00 | 11,711.64 | 8536.22 | 11,767.42 | 8495.75 | 11,841.46 | 8442.63 |
| 11,694.39 | 8548.81 | 11,713.72 | 8534.70 | 11,768.03 | 8495.31 | 11,842.02 | 8442.23 |
| 11,694.67 | 8548.61 | 11,713.81 | 8534.64 | 11,768.13 | 8495.24 | ||
| 11,697.42 | 8546.59 | 11,720.67 | 8529.65 | 11,770.45 | 8493.57 |
Table 2.
Measured CHI self-broadening coefficients (HWHM).
| (cm) | (cm/atm) |
|---|---|
| 11,741.39 | |
| 11,778.27 |
Disclaimer/Publisher’s Note: The statements, opinions and data contained in all publications are solely those of the individual author(s) and contributor(s) and not of MDPI and/or the editor(s). MDPI and/or the editor(s) disclaim responsibility for any injury to people or property resulting from any ideas, methods, instructions or products referred to in the content. |
© 2023 by the author. Licensee MDPI, Basel, Switzerland. This article is an open access article distributed under the terms and conditions of the Creative Commons Attribution (CC BY) license (https://creativecommons.org/licenses/by/4.0/).
Share and Cite
MDPI and ACS Style
Lucchesini, A. Diode Laser Overtone Spectroscopy of Methyl Iodide at 850 nm. Spectrosc. J. 2023, 1, 28-36. https://doi.org/10.3390/spectroscj1010003
AMA Style
Lucchesini A. Diode Laser Overtone Spectroscopy of Methyl Iodide at 850 nm. Spectroscopy Journal. 2023; 1(1):28-36. https://doi.org/10.3390/spectroscj1010003
Chicago/Turabian StyleLucchesini, Alessandro. 2023. "Diode Laser Overtone Spectroscopy of Methyl Iodide at 850 nm" Spectroscopy Journal 1, no. 1: 28-36. https://doi.org/10.3390/spectroscj1010003