Article

Minimal PM2.5 Impact Observed in Communities Near Large, Recurring, Non-Independence Day Festivals with Fireworks Displays

by
Victoria A. Lang
and
Jonathan D. W. Kahl
*
Atmospheric Science Program, University of Wisconsin-Milwaukee, Milwaukee, WI 53204, USA
*
Author to whom correspondence should be addressed.
Air 2023, 1(1), 1-13; https://doi.org/10.3390/air1010001
Submission received: 1 September 2022 / Revised: 17 September 2022 / Accepted: 23 September 2022 / Published: 10 October 2022

Abstract

:
Fine particulate matter (PM2.5) from fireworks displays have been linked to serious health concerns, particularly in infants and children. Outdoor displays in large, recurring festivals such as state fairs thus may threaten local air quality, particularly given the proximity of fairgrounds to substantial, nearby residential populations. Here, we identify state fairs with known firework displays and assess their impact on air quality in nearby communities. We assessed the impact of three large, recurring festivals on PM2.5 levels in nearby communities. Overall, our multi-year analysis failed to identify measurable increases in PM2.5 concentrations during festival days at air quality monitoring sites within 4–10 km of the fairgrounds, even when data were filtered by wind direction. Results suggest that firework displays from such festivals are unlikely to violate PM2.5 air quality standards in communities near the fairgrounds. The results suggest that identifying a potential air pollution signal associated with fireworks is challenging, particularly in urban fairgrounds where air quality is impacted by multiple local and distant pollution sources. Local impacts may yet be identified in future studies if air quality is monitored closer to the fairgrounds and if the fireworks pyrotechnic content is known.

1. Introduction

The first state fair in United States history dates back to 1841 in Syracuse, New York. Nearly 200 years later, state fairs are still an annual event celebrated across the country. Typically lasting for ten days to two weeks, state fairs consist of amusement park rides, concerts, firework displays, food vendors, games, and livestock exhibitions spread throughout acres of fairground. In some instances, fairs can exceed daily attendance of one hundred thousand people [1]. The Minnesota State Fair alone sees over two million attendees annually in its twelve-day duration [2]. In some cases, county or regional fairs have attendance rivaling or exceeding those of state fairs [3]. Fairgrounds are often located in suburban communities outside large cities.
The literature is rich with research on impacts and increased emissions of firework displays from professional and amateur sources during large festivals like that of the Lantern Festival in China, Diwali Festival in India, and Independence Day in the United States [4,5,6]. Firework displays involve advanced chemical technologies including igniters, propellants, oxidizers, and color and sound producers [7]. Fireworks emissions, often visible as clouds of smoke during displays, are linked to short-term degradation of local air quality due to the high levels of fine particulate matter [5,6,8,9,10,11,12,13,14]. The particulate matter includes hazardous trace elements such as lead, aluminum, manganese, cadmium, chromium, and nickel [7] and can remain suspended in the area for a week or more after the display [15]. Fireworks also release gaseous pollutants and toxics including sulfur dioxide, carbon monoxide, and ethyl-benzene [16].
Compounds found in firework particulates have been linked to serious health concerns including respiratory and cardiovascular disorders, neurodevelopment deficits, and thyroid conditions, particularly in infants and children [17,18,19,20,21]. Fireworks displays inside large stadiums, due to the dispersion of harmful pollutants therein, can increase air pollution by more than an order of magnitude [22,23,24]. Outdoor displays such as those found in many state fairs would also be expected to reduce local air quality.
To mitigate the health risk of fireworks and other pollution sources, the U.S. Environmental Protection Agency (EPA) sets National Ambient Air Quality Standards (NAAQS) for fine particulates (PM2.5). The PM2.5 standard is 35 µg/m3 for a 24-h average [25], considerably higher than the World Health Organization (WHO) guideline of 10 µg/m3. Moreover, the specific language of EPA’s PM2.5 standard prohibits exceeding the 98th percentile of daily values averaged over three years. This means that over a three-year period, 24-h PM2.5 concentration can exceed 35 μg/m3 twenty-one times without violating the standard.
Despite the known hazards of fine particulates associated with fireworks displays in the United States, particularly those associated with Independence Day [6], there is a void of studies that observe local air quality impacts as a result of recurring, large festivals with firework displays taking place outside of Independence Day. A primary example of such festivals is the state fair. In addition to fireworks displays, state fairs introduce a mix of prolonged aerosol sources from fugitive dust and engine exhaust related to large numbers of vehicles, cooking smoke from food vendors, and livestock exhibitions [26,27,28]. The proximity of fairgrounds to substantial, nearby residential populations, creates a need to identify possible environmental impacts fairs may have on local air quality. In this study we identify state fairs with known firework displays and assess their impact on air quality in nearby communities.

2. Materials and Methods

Our analysis was designed to evaluate the hypothesis that state fairs with known firework displays lead to measurable increases in PM2.5 concentrations in nearby communities. We also required that such festivals have nearby air quality and meteorological measurements. For these festivals we compared PM2.5 levels on days with known fireworks displays to those on “control days”, i.e., days without a fair or known municipal firework events.

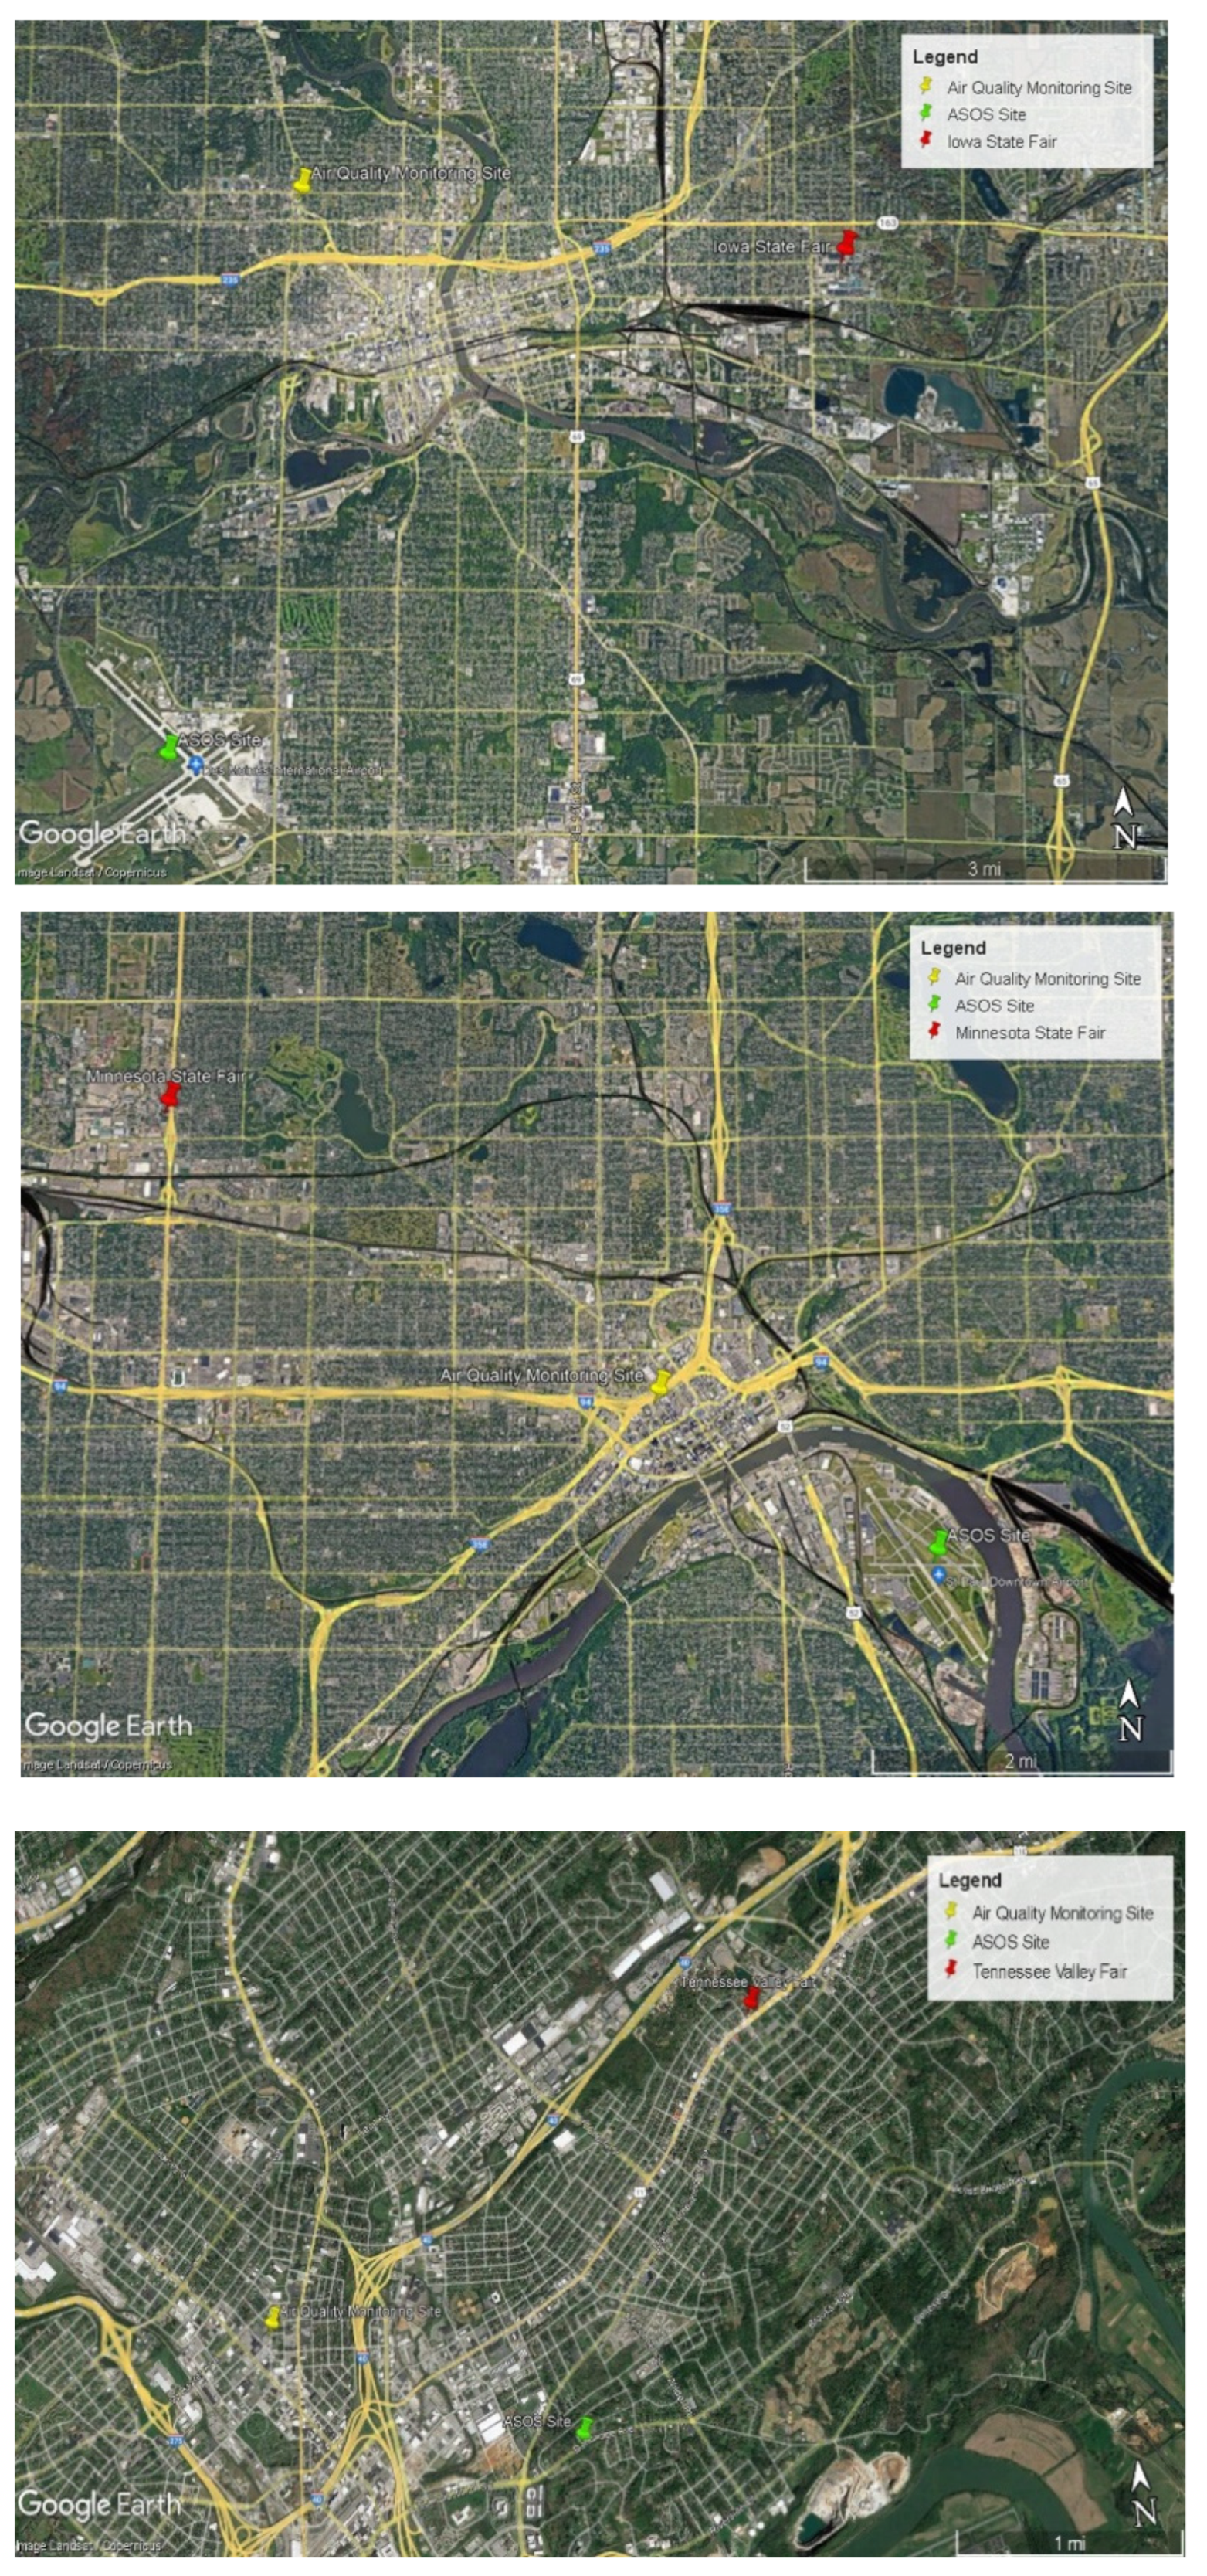
2.1. Identification of State Fairs with Fireworks

Event selection was conducted by first identifying state fairs in which there are known firework displays. Local newspaper articles from various state fair locations were used to determine the presence or absence of firework displays, the timing and duration of the displays, and the fair’s event schedule. Twenty-one state fairs with firework displays were thus identified.
Next, a determination was made as to whether the firework display was sizable enough to have the potential to affect local air quality. Unfortunately, this was not a straightforward task.
The numerous studies detailing elevated particulate matter following firework displays [5,6,8,9,10,11,12,13,14,15] have not discerned a relationship between the firework display parameters and emission strength. This is due to the lack of openly available data to quantify the size of a firework display. In order to accurately define the emissions of a firework display, the mass of pyrotechnic content must be known. Pyrotechnic content within a firework consists of a lift charge (such as gunpowder) and the burst charge which contains an oxidizer, fuel, varying chemical combinations for color, and a binder. Depending on the desired visual effect, the mass and chemical composition of pyrotechnic ingredients will vary [29]. When transferring fireworks to display sites, pyrotechnic companies are required to share the weight of explosive content with the U.S. Bureau of Alcohol, Tobacco, Firearms and Explosives Agency and Department of Transportation [30]. Nevertheless, pyrotechnic content weight is considered proprietary information of the pyrotechnic group and is not openly available.
Firework display parameters that are publicly available include cost and duration of the display. However, cost is an imperfect proxy for firework emissions because several factors unrelated to emissions are often included in reported firework cost, including personnel, transportation, storage, insurance, and taxes. Duration is similarly of limited usefulness. While longer displays would certainly be expected to involve higher emissions, other key factors remain unknown such as the types of fireworks used, and the number of fireworks launched per minute. Accurate characterization of firework emission strength is thus impossible without proprietary knowledge of the pyrotechnic content.
After reviewing the literature on firework emissions and consulting with pyrotechnic professionals it was decided to utilize display duration combined with fair attendance as a qualitative proxy. State fair events were thus included in the study if they were known to have a daily firework display of longer than five minutes, and an average daily attendance of over 10,000 people or a total festival attendance of over 100,000. By limiting the time duration of a display to over five minutes, short displays that likely do not produce measurable emissions were omitted. Attendance was utilized because data suggests fairs with a larger attendance may have greater spending power designated for firework displays, as well as displays of longer duration. For example, a budget from the 2018 Minnesota State Fair, which sees over two million attendees annually, allocated $32,500 USD for fireworks, and the 2019 Michigan State Fair, which sees 92,000 attendees annually, budgeted $10,000 USD for firework displays [31,32].
The selection criteria identified three large, recurring festivals with known daily firework displays for use in this study: Iowa State Fair, Minnesota State Fair, and Tennessee Valley Fair (Table 1). The Tennessee Valley Fair, a regional festival, includes daily firework displays and similar elements as most state fairs (amusement park rides, food vendors, livestock exhibitions). Its attendance is larger than the Tennessee State Fair and similar to smaller state fairs [3]. These fairs ranged from 10 to 12 days in duration and had nightly fireworks displays during the years 2013–2019 (Minnesota), 2017–2019 (Iowa), and 2018–2019 (Tennessee). These fairs also satisfied the requirement of having nearby air quality and meteorological measurement sites (see Section 2.2 below).

2.2. Air Quality and Meteorological Data

The selection criteria for state fairs to include in the present analysis also required the availability of appropriate air quality and meteorological data. Specifically, hourly PM2.5 and meteorological parameters corresponding to “Firework days” and “Control days” were required. Firework days were defined as state fair festival days with known firework displays. Control days, i.e., days without a fair or known municipal firework events, were determined to be the five days before and after each event, with the requirement that no festival or control days align with Independence Day events. This reduced the possibility of additional firework display emissions outside the fairgrounds.
Hourly PM2.5 measurements were obtained from the EPA’s Air Quality System (AQS) database [35,36]. For the state fairs selected, the associated AQS sites are located within 4–10 km of the fairgrounds (Figure 1), in accordance with the recommendations of Lin [15].
Hourly meteorological parameters of wind speed and wind direction were obtained from the U.S. Weather Service’s Automated Surface Observing Systems (ASOS) [37]. For the state fairs utilized, the associated ASOS locations are located within 3–31 km of the fairgrounds (Figure 1). Site IDs for the AQS and ASOS monitors are included in Table 1.
All AQS and ASOS data were subjected to quality control procedures. We removed repeated or erroneous records and required that at least 21 hourly measurements in a 24-h cycle were present for both air quality and ASOS data, and that 90% of hourly measurements were available for the entire duration of an event.

2.3. Data Filtering by Cooperating Meteorological Variables

In order to identify periods when air was moving from the festival sites toward the air quality monitors, hourly PM2.5 concentrations were filtered by wind direction and speed. Such periods, termed “cooperating meteorological variables” (CMV), required non-zero wind speeds and wind direction within ±30° of the azimuth of the fairground. Hours satisfying CMV criteria thus represented periods where wind was blowing in the general direction from the fairgrounds toward the AQS monitor (Table 2).

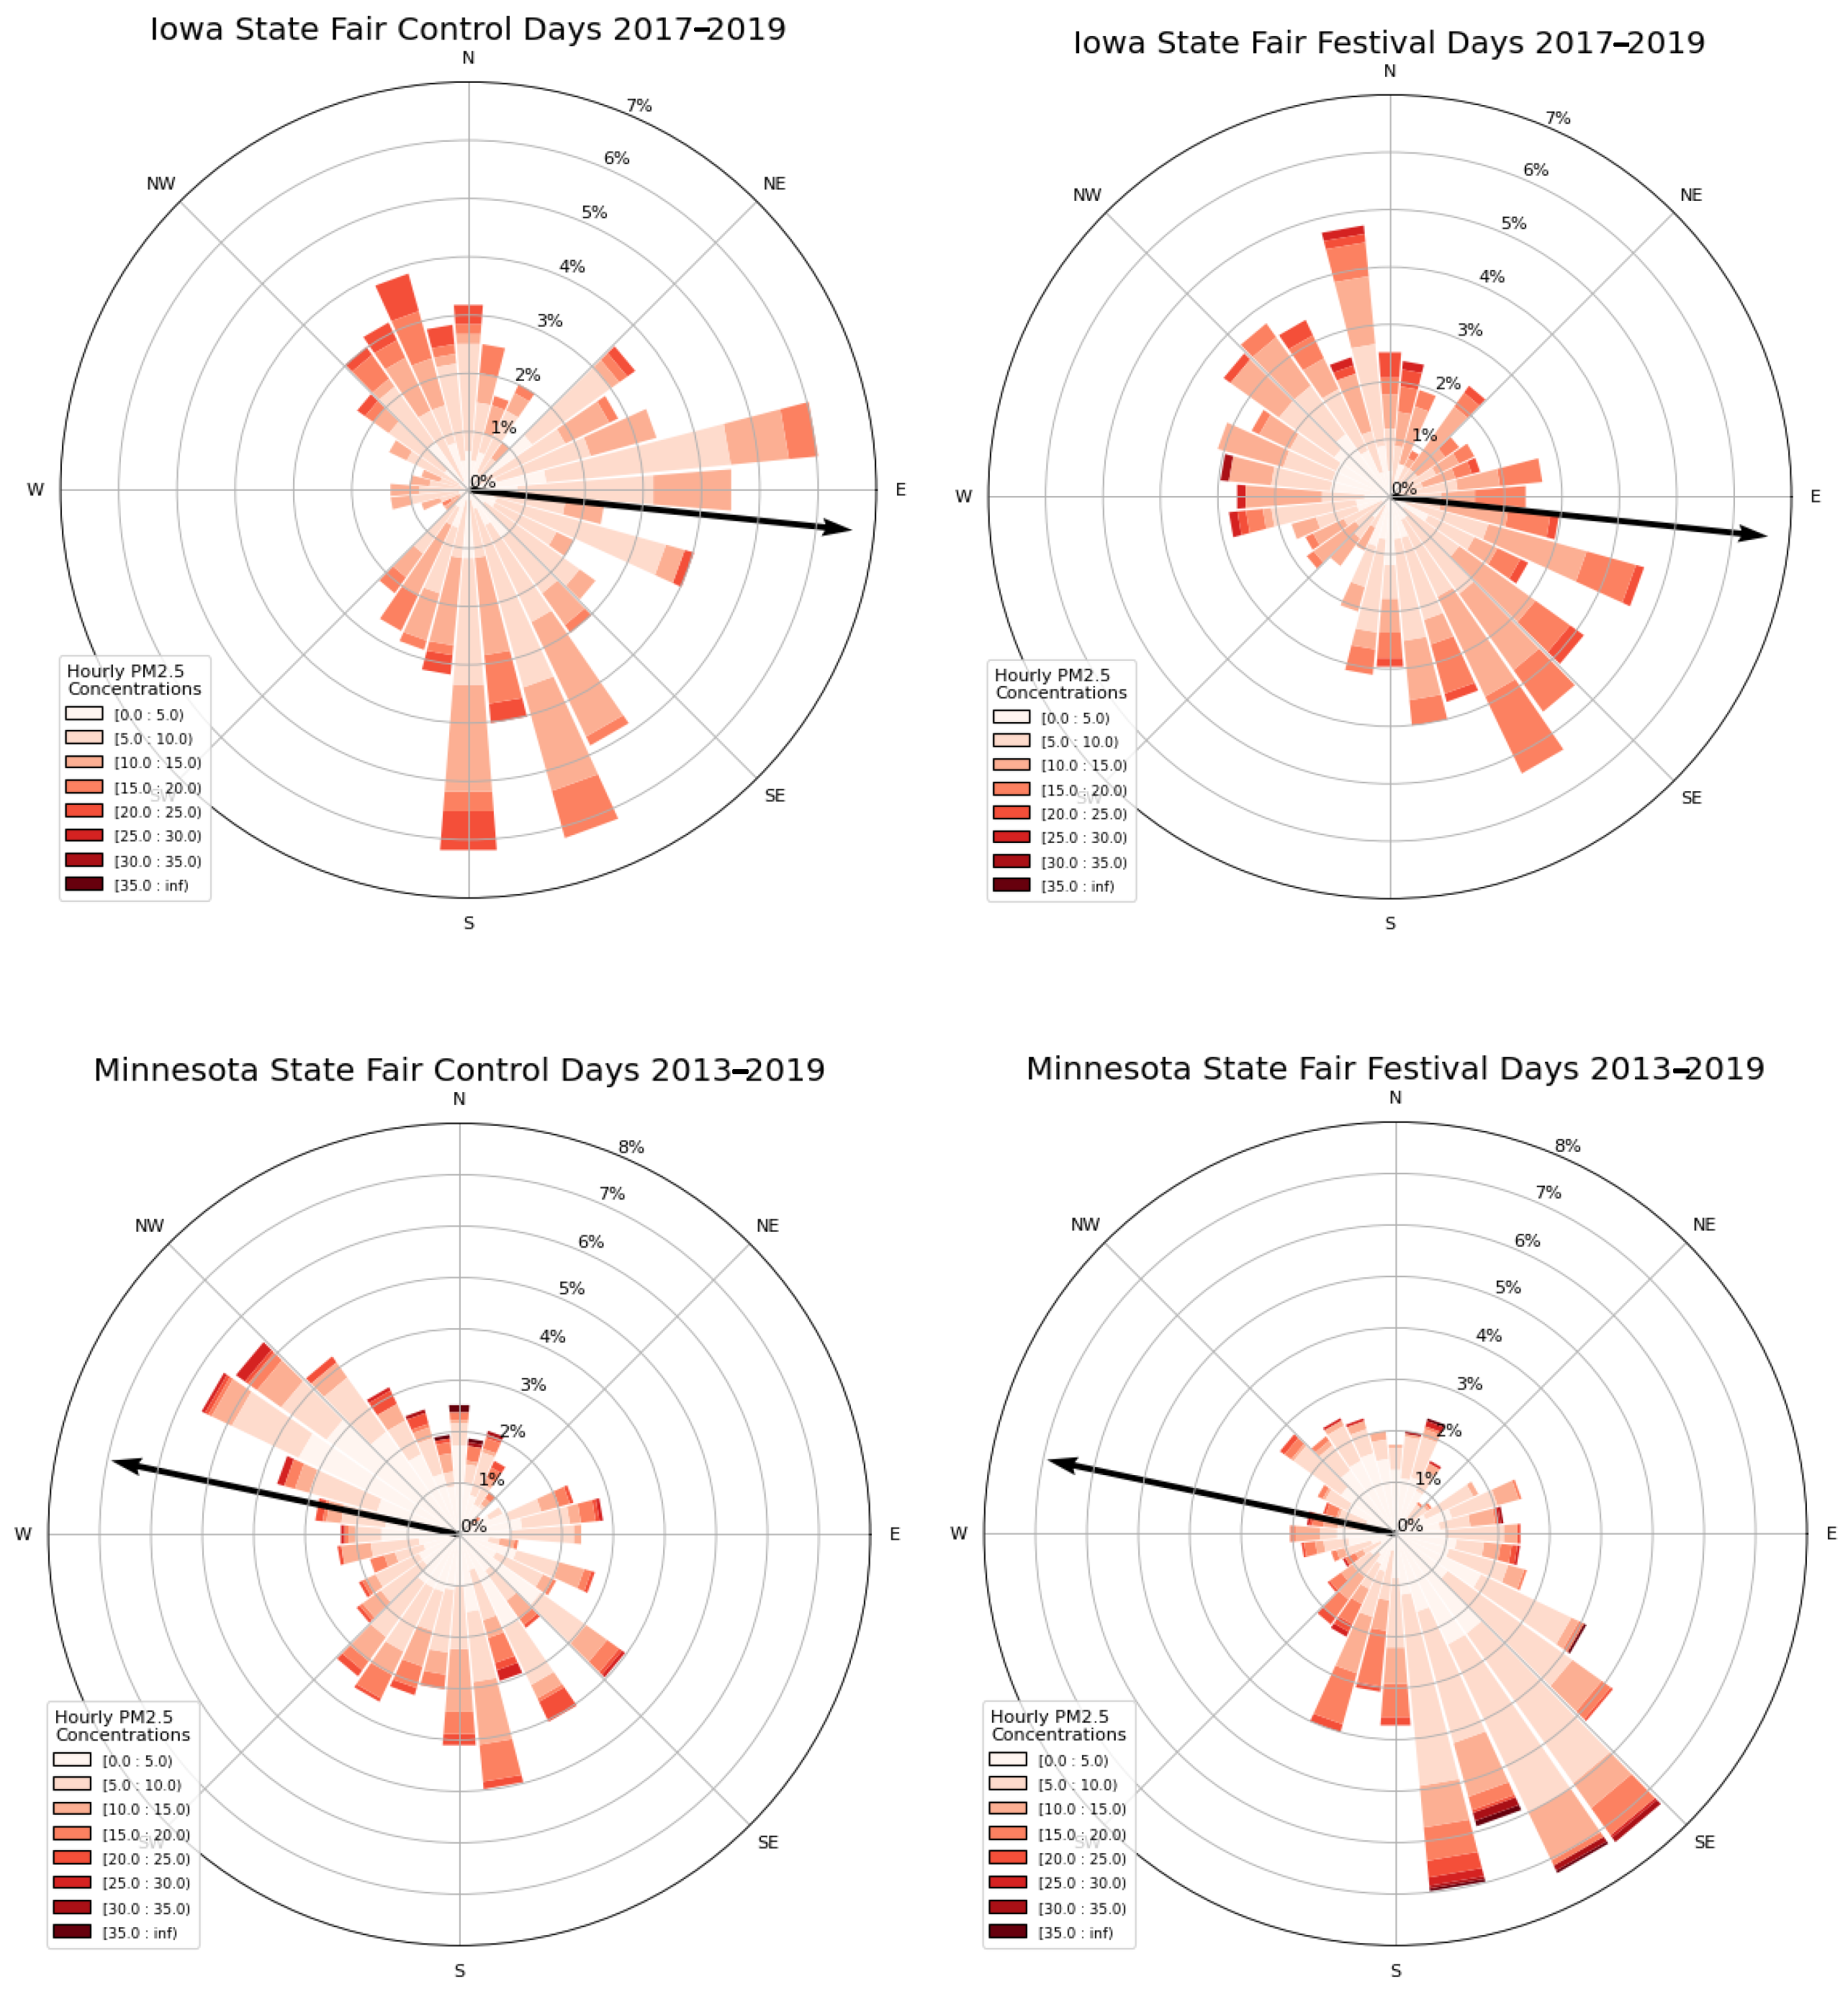
2.4. Air Pollution Rose Analysis

An air pollution rose depicting the frequency with which wind blows from different directions, and the PM2.5 concentrations associated with that direction, were prepared using both hourly ASOS and air quality monitoring site data during both control and festival days.

2.5. Statistical Significance Testing Using Bootstrap Sampling

Bootstrap sampling [38] was utilized to evaluate the hypothesis that state fairs with known firework displays lead to measurable increases in PM2.5 concentrations in nearby communities.
Hourly PM2.5 measurements from different festival days were combined to create a sampling dataset for each of the 24 h of a state fair’s annual festival days. For example, all measurements from 0600 LST over the course of all festival days were prepared for the subsequent bootstrap sampling. This process was repeated for all 24 h of both festival and control days. Control day and festival day PM2.5 measurements were then randomly selected with replacement from the sampling datasets for each hour. These new randomly selected measurements represent synthetic distributions of festival and control day concentrations. Mean PM2.5 concentrations were determined for the synthetic festival and control day distributions, and differences were found (festival day mean minus control day mean). This bootstrap sampling procedure was conducted 1000 times for each of the 24 h, resulting in a distribution of concentration differences at each hour. The null hypothesis, that festival day concentrations are not larger than control day concentrations, was rejected at the 5% confidence level if the fifth percentile of the 1000 differences was less than zero.
A minimum hourly sample size of five was required to be included in the bootstrap analysis. CMV filtering of meteorological data often significantly reduced the sample size. As a result, hypothesis testing was not possible for some hours, particularly at the Iowa and Tennessee fairs (Table 2).

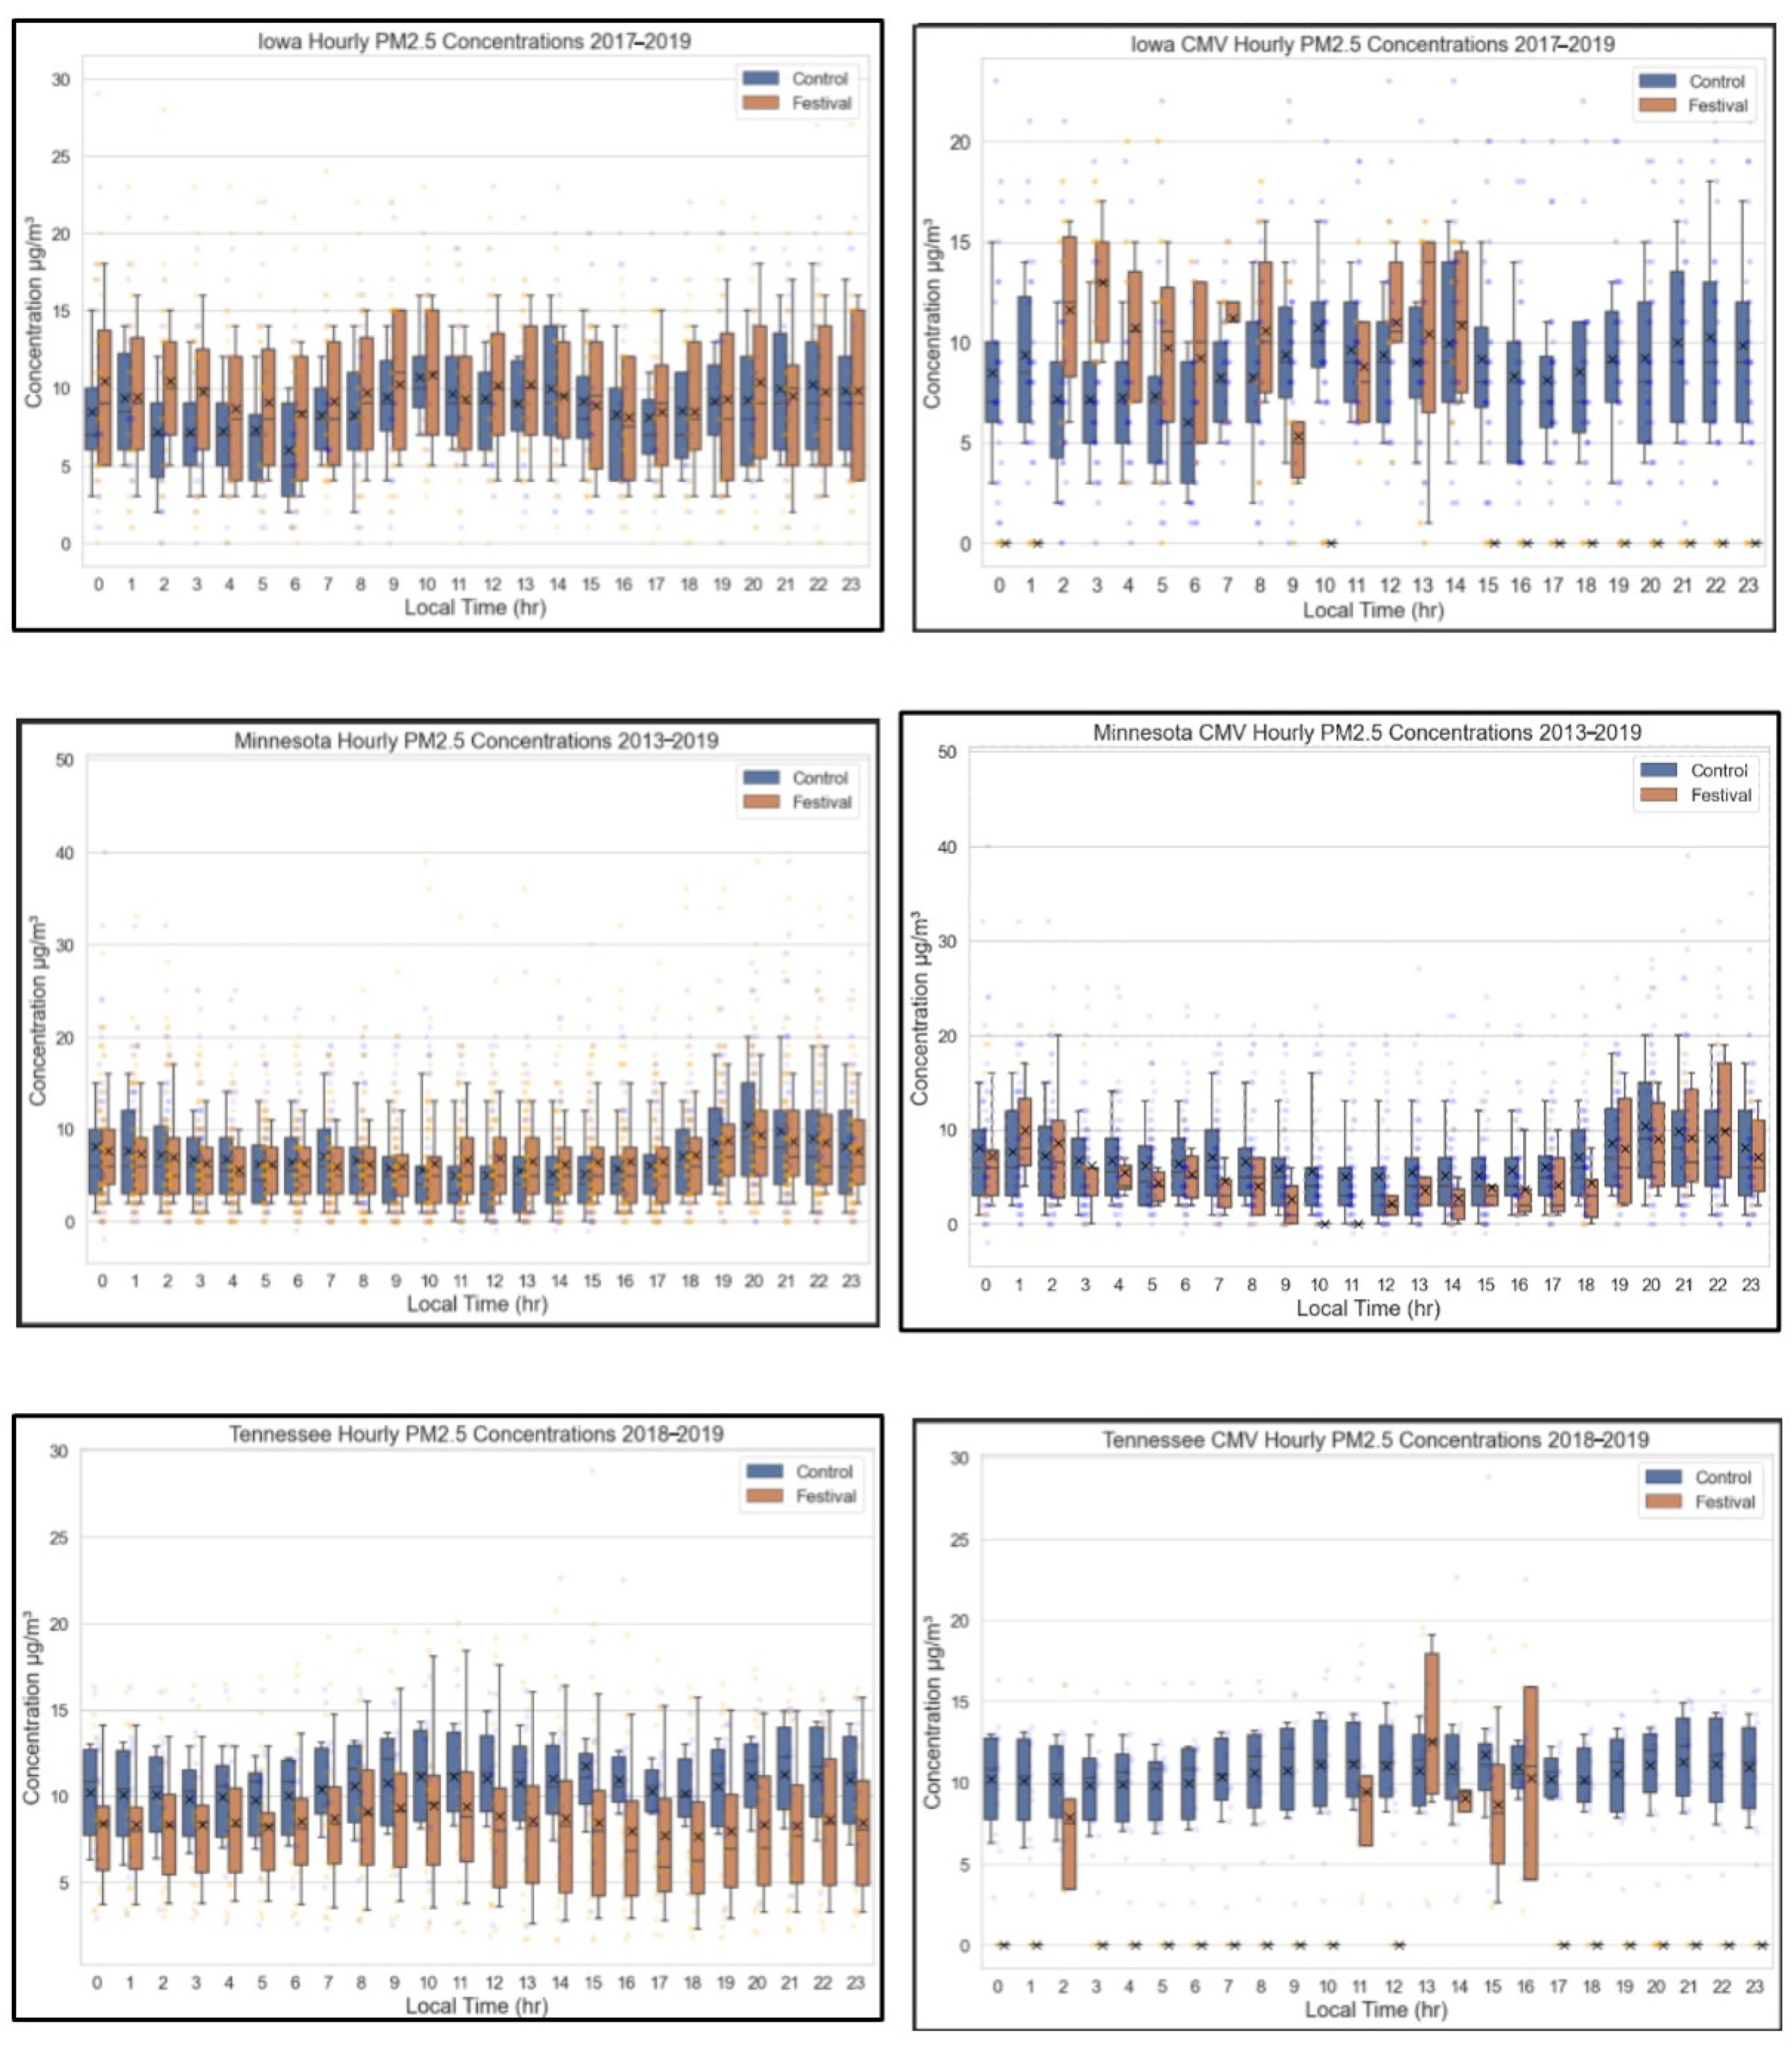
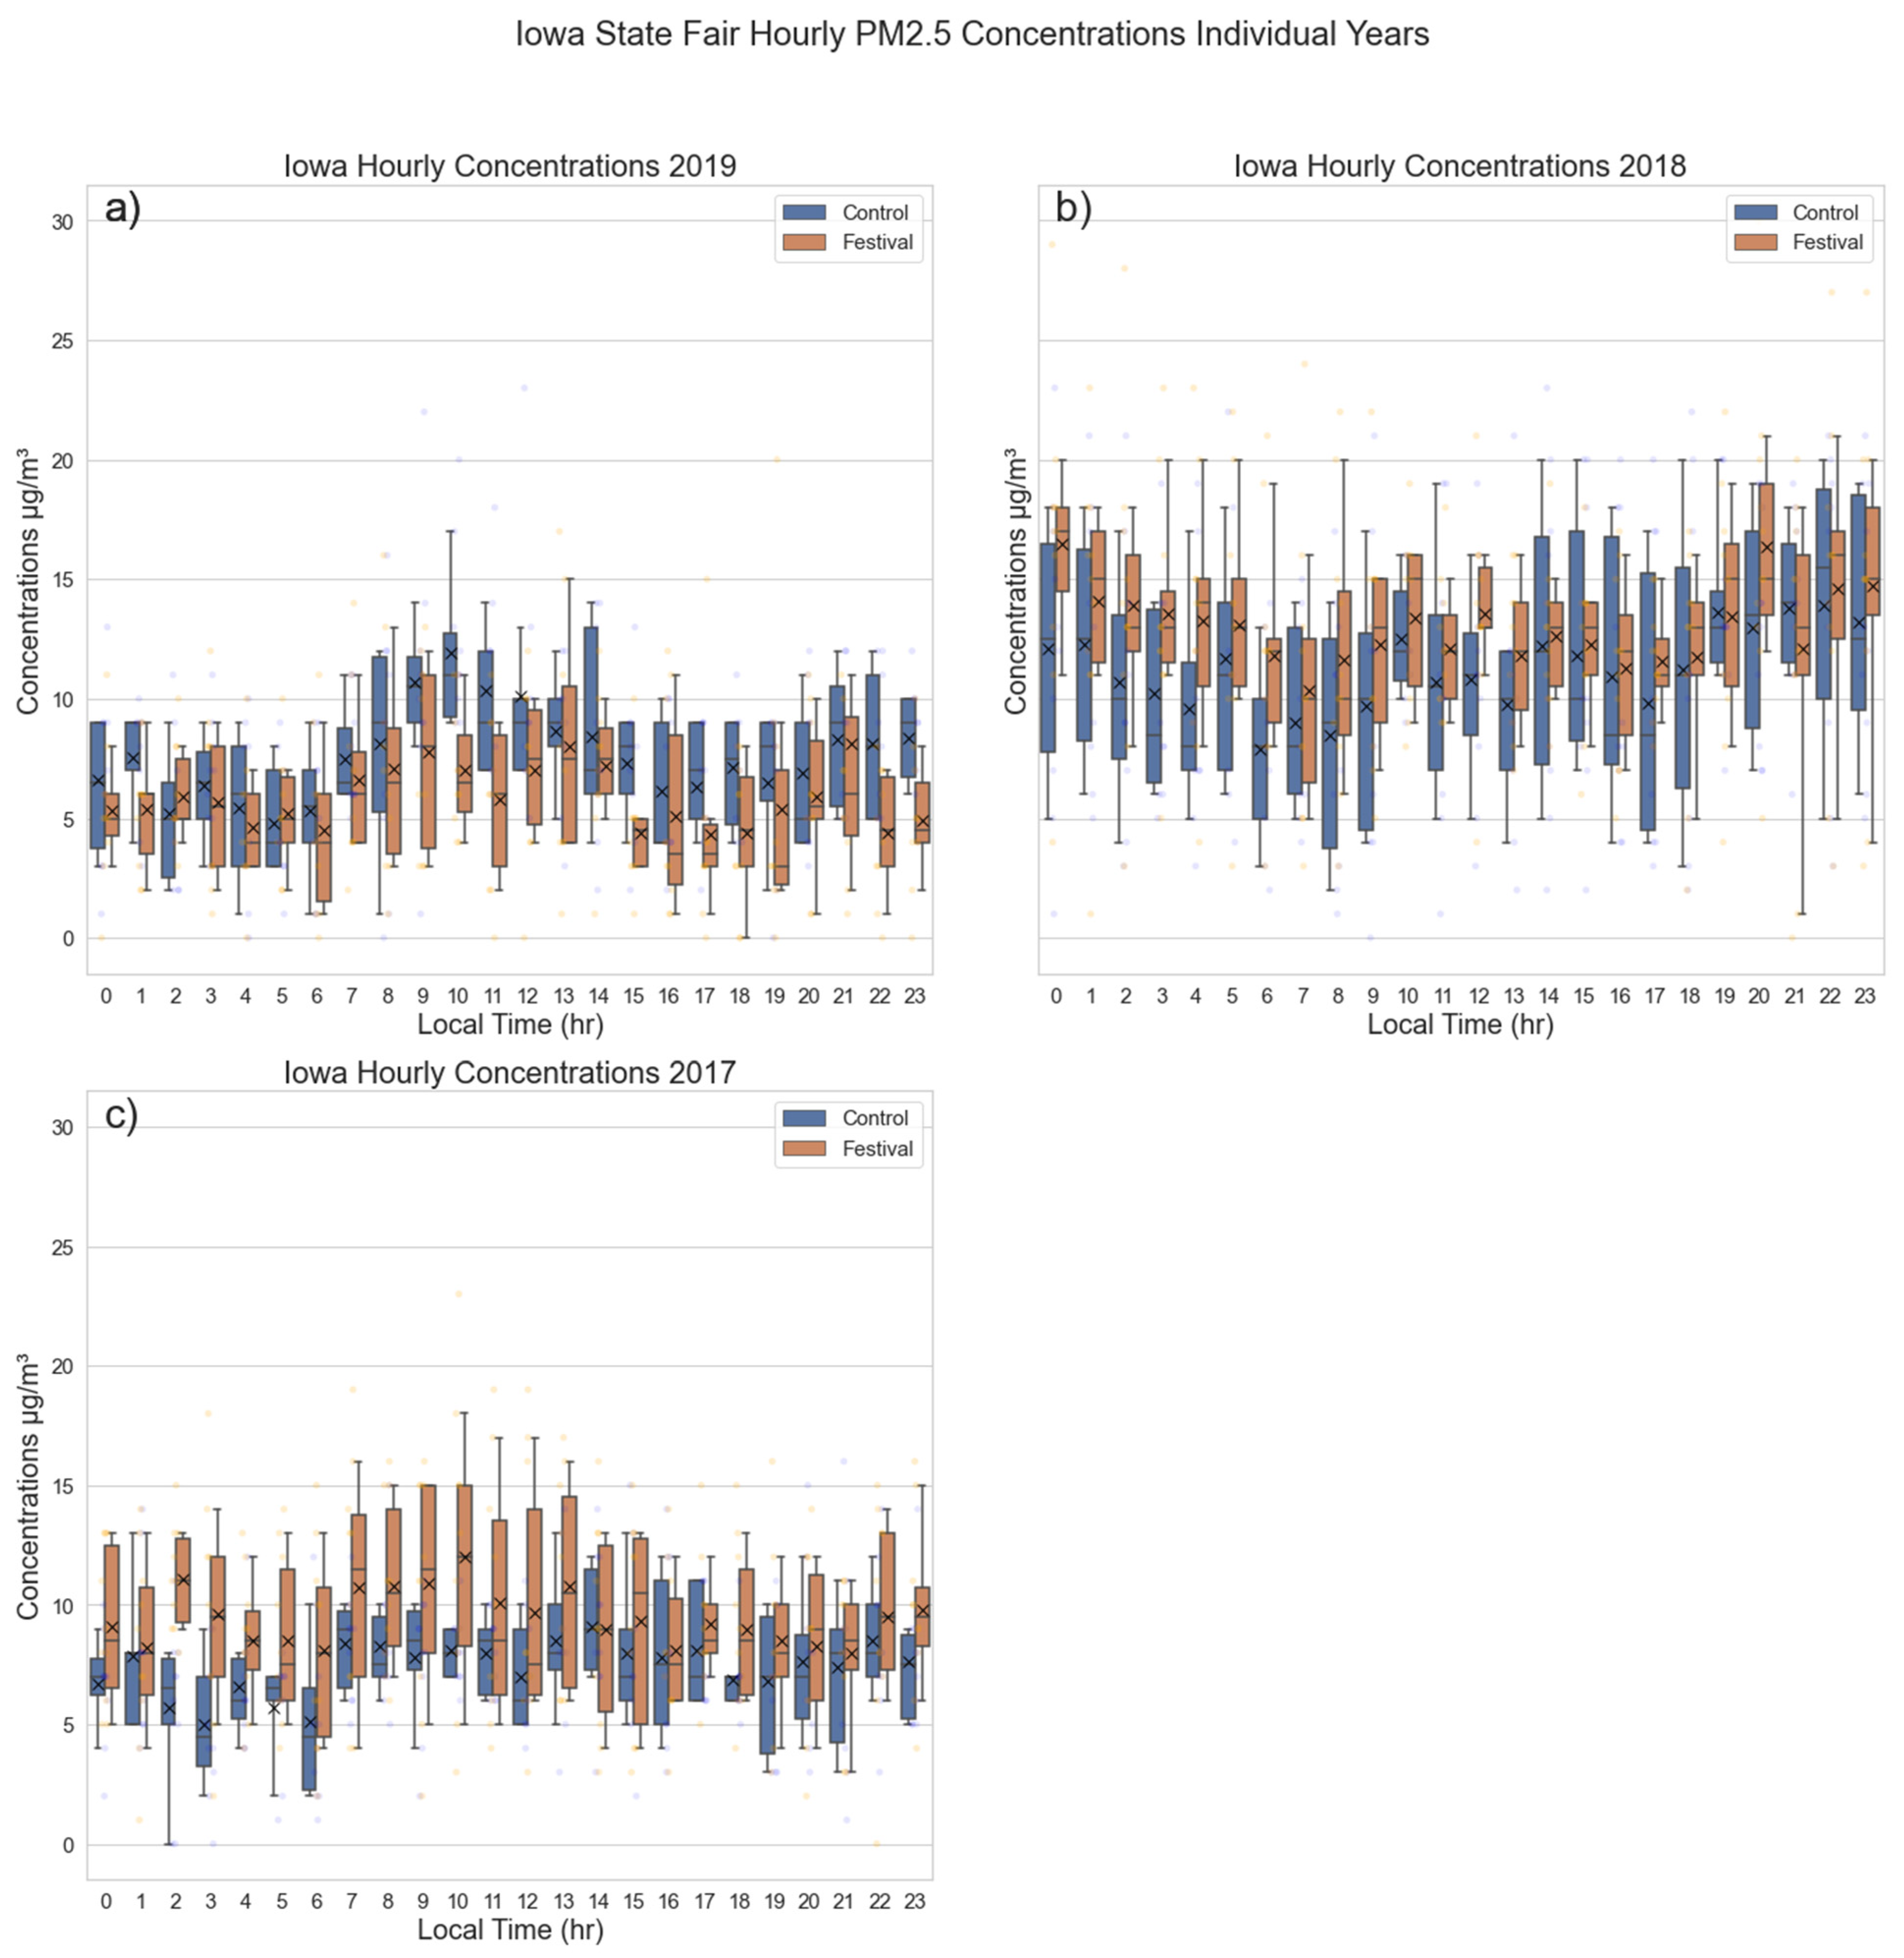
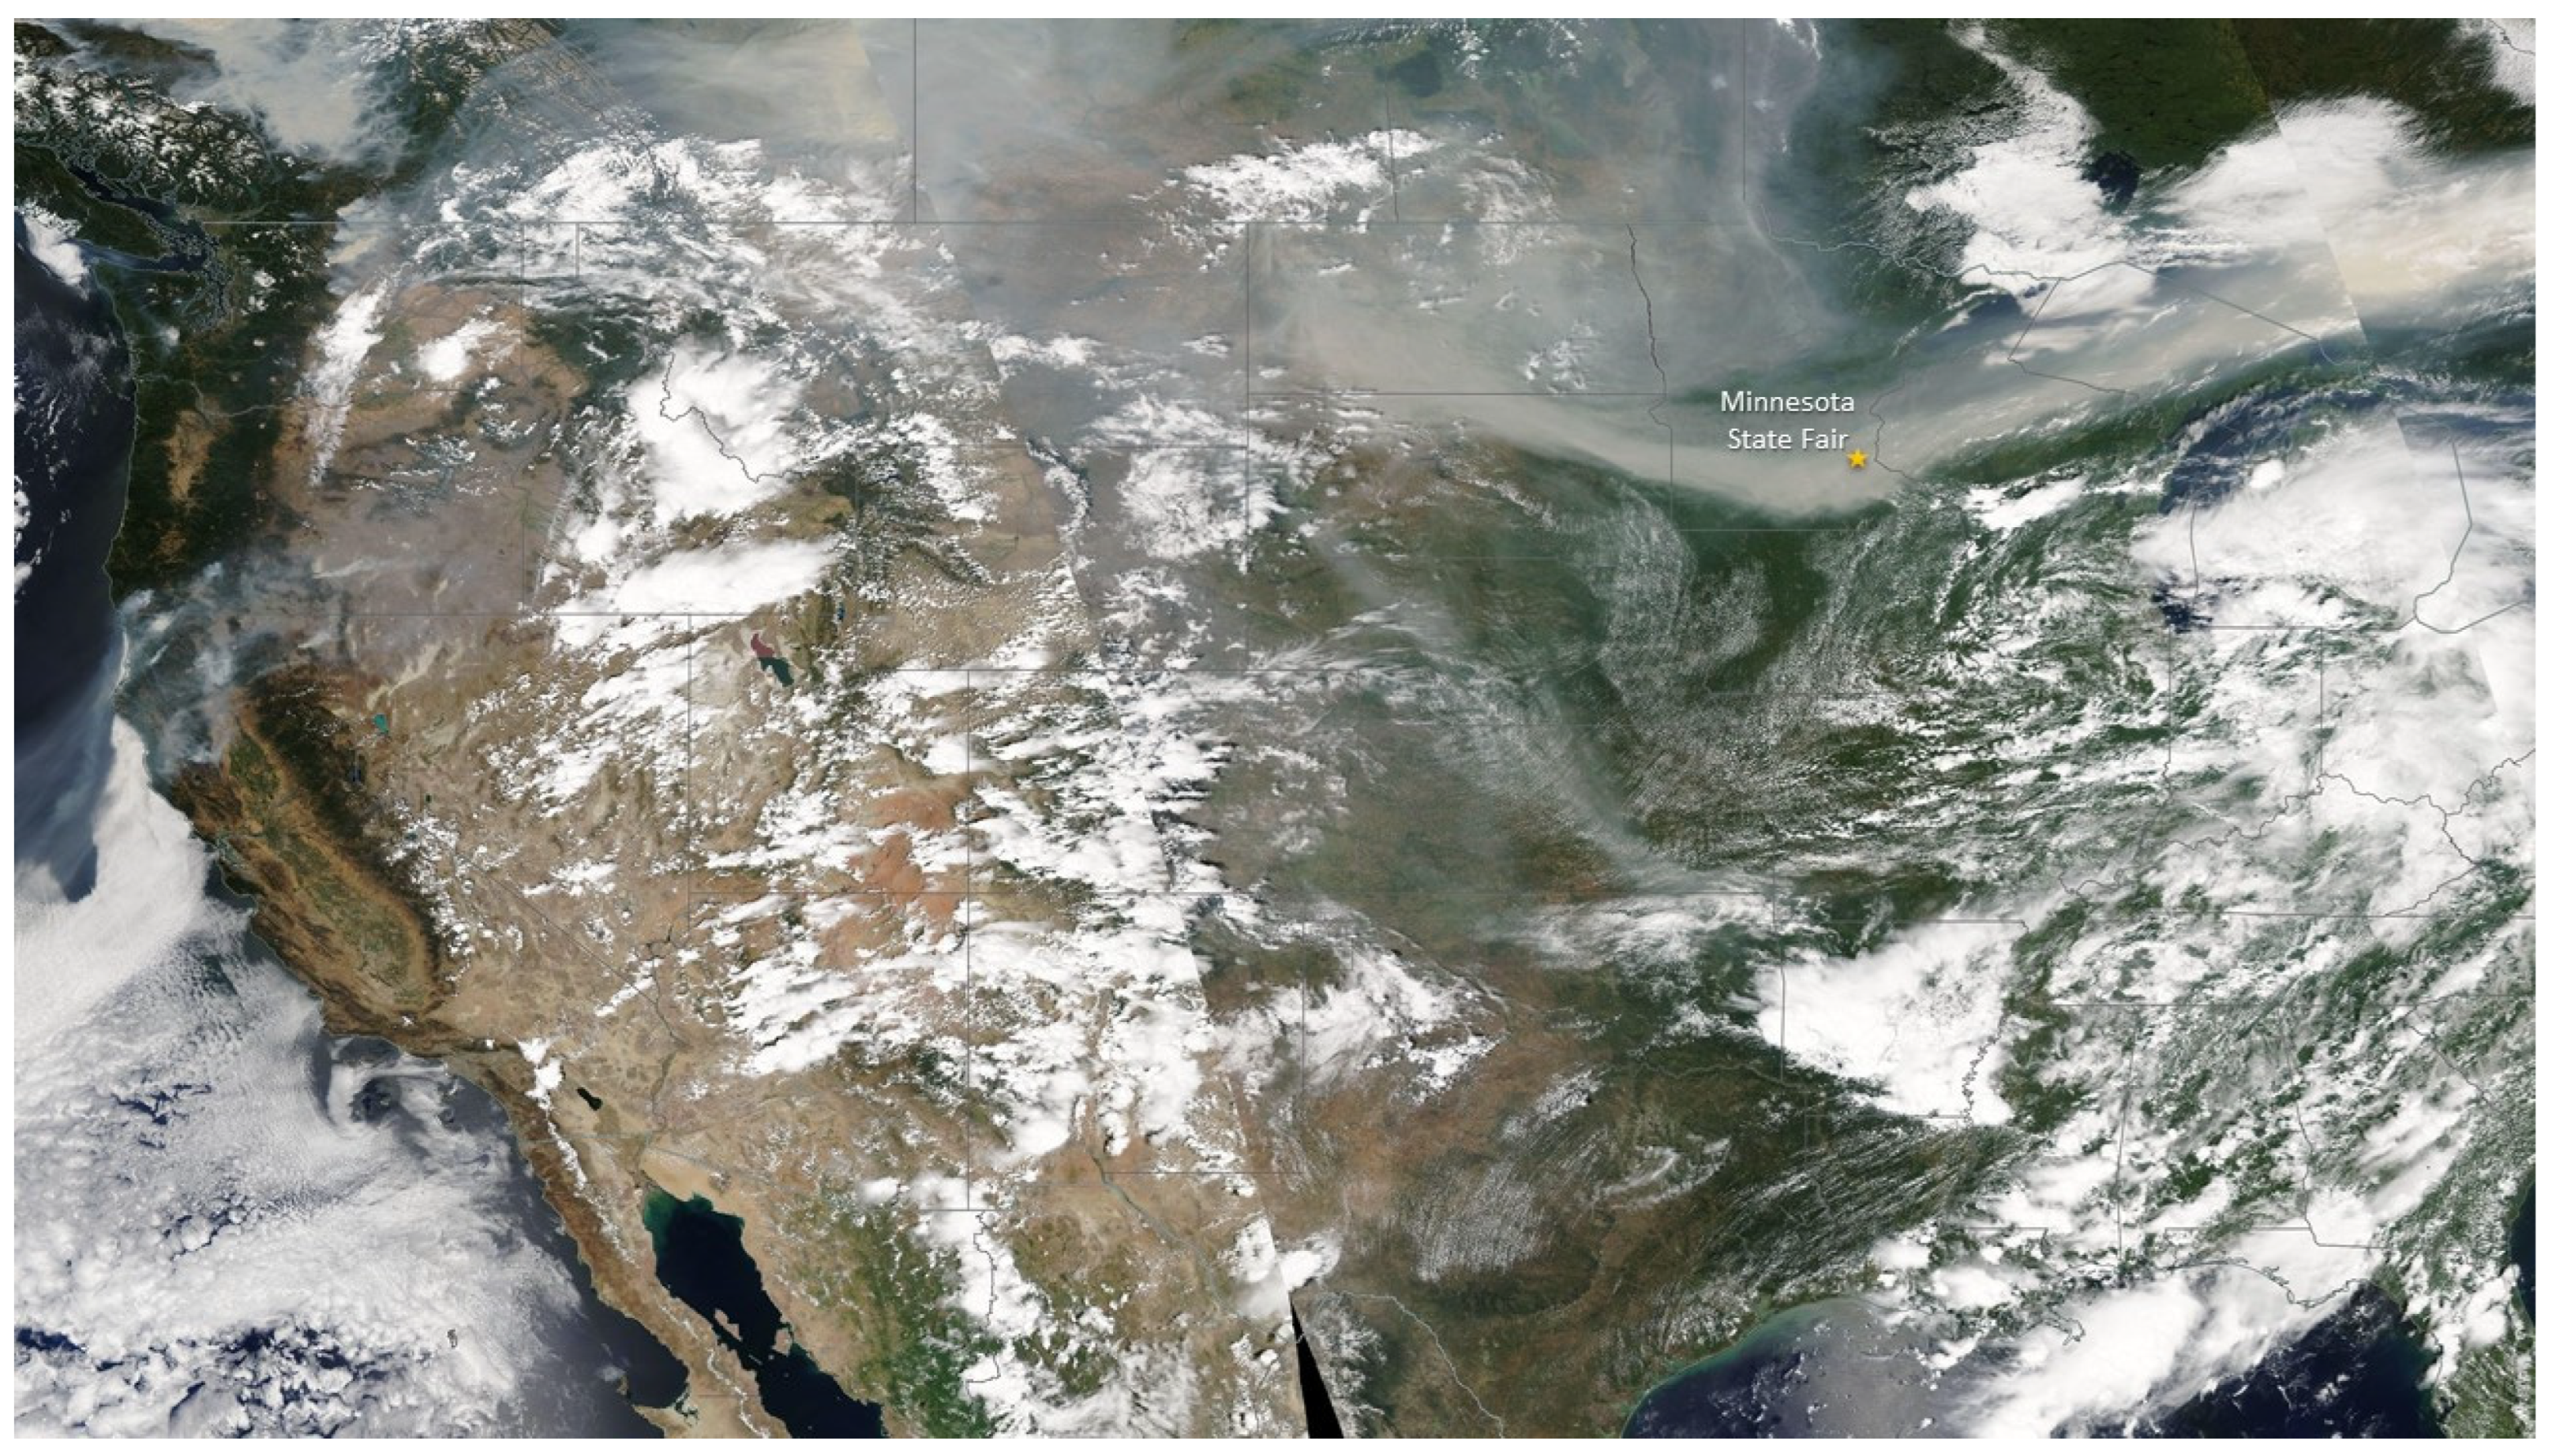
3. Results and Discussion

Hourly distributions of PM2.5 concentrations for festival and control days during all years of the Iowa, Minnesota, and Tennessee fairs are shown in Figure 2. Mean hourly concentrations at all fairs range from 7–13 µg/m3 on both festival and control days. Individual hourly concentrations rarely exceeded the 35 µg/m3 standard, and higher concentrations (above 20 µg/m3) occurred most frequently in the overnight hours from 8 p.m.–1 a.m. LST. Of the three fairs analyzed, the highest frequency of elevated concentrations was observed in Minnesota. Several of these instances occurred in 2018 and were likely influenced by wildfire smoke from British Columbia (discussed below).
In general, no clear impact of festival emissions on measured PM2.5 concentrations was evident. This is particularly true for Tennessee, where at all hours mean control day concentrations exceed festival day concentrations by nearly 5 µg/m3. Statistical significance testing for all hours, using multiyear aggregates at each fair, revealed that the null hypothesis (that festival day concentrations are not larger than control day concentrations) could not be rejected.
When only those hours where winds are blowing from fairground to AQS monitor were included (CMV filtering), fewer statistical comparisons were possible because many hours failed to meet the minimum threshold of 5 samples (Table 2). At Iowa, statistical testing results indicate that festival day concentrations during the early morning hours of 0200, 0300, 0400, 0600, and 0700 LST were significantly larger than control day concentrations at these hours. The significantly elevated concentrations at these hours could be a result of residual particulates from the previous night’s fireworks display. The null hypothesis could not be rejected for any hours at Minnesota or Tennessee, however.
Substantial interannual variability in hourly PM2.5 concentrations was observed at individual fairs. At the Iowa State Fair (Figure 3) for example, which has nightly fireworks generally between 9 p.m. and 11 p.m. [39], mean hourly PM2.5 concentrations during festival days were generally larger than control days for 2017 and 2018, but not in 2019. Bootstrap analysis revealed significantly larger concentrations during festival days during 9 h in 2017, and during 4 h in 2018. Hourly concentrations of PM2.5 for both control and festival day were likely larger in 2018 due to wildfire smoke from British Columbia. Wildfire smoke confounds the attempt to assess the impact of state fair emissions on air quality, as it can increase PM2.5 concentrations on both festival and control days (Figure 4).
Air pollution rose analysis (Figure 5) presents further insight into differences between multi-year aggregate festival and control day PM2.5 concentrations. For the Iowa State Fair, the wind blew somewhat less frequently from the direction of the state fair during festival days as compared to control days. The largest measured PM2.5 concentrations during festival days, 25–30 μg/m3, were associated with winds from the north and west, not from the direction of the state fair. The highest hourly concentrations measured at the air quality site were thus not from state fair emissions, but from other local or distant emission sources. Nevertheless, PM2.5 concentrations associated with wind coming from the direction of the state fair were 5–10 μg/m3 larger for festival days compared to control days. These results suggest the possibility of a signal of increased PM2.5 concentrations from the Iowa State Fair during festival days, however more data would be required in order to confirm the presence of this signal. Additionally, we note that the Iowa AQS site is not adjacent to the fairgrounds but is 7 km away (Table 1). Source attribution in the presence of alternate emission sources may be difficult at this distance.
For the Minnesota State Fair the largest PM2.5 concentrations during festival days were associated with winds from the north and southeast, while during control days the highest concentrations occurred with northerly winds (Figure 5). PM2.5 concentrations accompanying winds from the direction of the fairgrounds (west-southwest) were slightly larger during control days. These results help explain why the festival and control day concentration distributions in Figure 2 are similar, and further highlight the challenges in assessing the air quality impact of state fair emissions in urban areas with multiple pollution sources.

4. Conclusions

In this study we identified three large, recurring festivals (Iowa State Fair, Minnesota State Fair, and Tennessee Valley Fair) with known firework displays and assessed their impact on air quality in nearby communities. Overall, our multi-year analysis failed to identify measurable increases in PM2.5 concentrations during festival days at air quality monitoring sites within 4–10 km of the Iowa, Minnesota, or Tennessee fairgrounds. These results suggest that in communities located near fairgrounds where state fairs or other large festivals with fireworks displays are held, PM2.5 air quality standards are not likely to be exceeded due to emissions associated with the nearby state fairs.
However, identifying a potential air pollution signal associated with fireworks or other state fair activities is challenging. State fairgrounds are often located in suburban communities outside large cities where air quality is impacted by multiple local and distant pollution sources. Our analysis revealed cases in Minnesota where fine particulate loadings were elevated due to regional intrusions of smoke from distant wildfires, potentially masking a signal from the nearby state fair. A directional analysis using air pollution roses revealed that in Iowa, the largest measured PM2.5 concentrations during festival days were associated with winds from directions other than the direction of the state fair, again emphasizing the difficulty in quantifying source-receptor relationships in urban environments.
The known health risks of inhalable fireworks aerosols [7] may very well be problematic even if air quality standards are not violated, as experts have not agreed upon a set lower limit of PM2.5 concentration lacking health consequences [40]. One study found that PM2.5 measurements as low as 4.0 µg/m3 to 7.06 µg/m3 increases asthma symptoms and within this range, each increase of 1 µg/m3 increases symptoms by 3.4% [41]. Even short-term exposure to elevated PM2.5 can cause cardiovascular inflammation [42]. These risks limit the effectiveness of the NAAQS standards in communicating air quality hazards to the public, as fireworks can temporarily degrade PM2.5 conditions to unhealthy levels without raising the 24-h average above the set standard to alert the public.
The results of the present study suggest that identifying a potential air pollution signal associated with fireworks or other state fair activities may yet be possible if certain experimental design considerations are addressed. Principal among these is the distance of the air quality monitor from the fairgrounds: a shorter distance would reduce dispersion and maximize the influence of the state fair emissions relative to other pollution sources. Knowledge of pyrotechnic content and the exact timing of fireworks displays would also be valuable, as would consideration of other controlling meteorological factors including precipitation and atmospheric stability.

Author Contributions

Conceptualization, V.A.L. and J.D.W.K.; Methodology, V.A.L. and J.D.W.K.; Software, V.A.L.; Validation, V.A.L.; Formal Analysis, V.A.L.; Investigation, V.A.L.; Resources, V.A.L. and J.D.W.K.; Data Curation, V.A.L.; Writing—Original Draft Preparation, V.A.L. and J.D.W.K.; Writing—Review and Editing, V.A.L. and J.D.W.K.; Visualization, V.A.L.; Supervision, J.D.W.K.; Project Administration, J.D.W.K. All authors have read and agreed to the published version of the manuscript.

Funding

This research received no external funding.

Institutional Review Board Statement

Not applicable.

Informed Consent Statement

Not applicable.

Data Availability Statement

The air quality data presented in this study are openly available from the U.S. Environmental Protection Agency. This data can be found here: https://aqs.epa.gov/aqsweb/airdata/download_files.html#Raw, accessed on 1 March 2022. The meteorological data presented in this study are openly available the National Centers for Environmental Information dataset. This data can be found here: https://www.ncei.noaa.gov/products/land-based-station/automated-surface-weather-observing-systems, accessed on 1 March 2022.

Conflicts of Interest

The authors declare no conflict of interest.

References

  1. Grant, W.D.; Nacca, N.E.; Prince, L.A.; Scott, J.M. Mass-Gathering Medical Care: Retrospective Analysis of Patient Presentations over Five Years at a Multi-Day Mass Gathering. Prehospital Disaster Med. 2010, 25, 183–187. [Google Scholar] [CrossRef] [PubMed] [Green Version]
  2. Sanstead, E.; Basta, N.E.; Martin, K.; Cruz, V.; Ehresmann, K.; Kulasingam, S. Pertussis and the Minnesota State Fair: Demonstrating a Novel Setting for Efficiently Conducting Seroepidemiologic Studies. J. Community Health 2018, 43, 937–943. [Google Scholar] [CrossRef]
  3. Tennessee Association of Fairs: Tennessee Fairs. 2022. Available online: https://advancetn.com/member-fairs (accessed on 1 March 2022).
  4. Wang, Y.; Zhuang, G.; Xu, C.; An, Z. The air pollution caused by the burning of fireworks during the lantern festival in Beijing. Atmos. Environ. 2007, 41, 417–431. [Google Scholar] [CrossRef]
  5. Barman, S.C.; Singh, R.; Negi, M.P.S.; Bhargava, S.K. Ambient air quality of Lucknow City (India) during use of fireworks on Diwali Festival. Environ. Monit. Assess. 2007, 137, 495–504. [Google Scholar] [CrossRef]
  6. Seidel, D.J.; Birnbaum, A.N. Effects of Independence Day fireworks on atmospheric concentrations of fine particulate matter in the United States. Atmos. Environ. 2015, 115, 192–198. [Google Scholar] [CrossRef]
  7. Licudine, J.A.; Yee, H.; Chang, W.L.; Whelen, A.C. Hazardous metals in ambient air due to New Year fireworks during 2004–2011 celebrations in Pearl City, Hawaii. Public Health Rep. 2012, 127, 440–450. [Google Scholar] [CrossRef]
  8. Perry, K.D. Effects of Outdoor Pyrotechnic Displays on the Regional Air Quality of Western Washington State. J. Air Waste Manag. Assoc. 1999, 49, 146–155. [Google Scholar] [CrossRef] [PubMed]
  9. Moreno, T.; Querol, X.; Alastuey, A.; Minguillón, M.C.; Pey, J.; Rodriguez, S.; Miró, J.V.; Felis, C.; Gibbons, W. Coauthors: Recreational atmospheric pollution episodes: Inhalable metalliferous particles from firework displays. Atmos. Environ. 2007, 41, 913–922. [Google Scholar] [CrossRef]
  10. Camilleri, R.; Vella, A.J. Effect of fireworks on ambient air quality in Malta. Atmos. Environ. 2010, 44, 4521–4527. [Google Scholar] [CrossRef]
  11. Joly, A.; Smargiassi, A.; Kosatsky, T.; Fournier, M.; Dabek-Zlotorzynska, E.; Celo, V.; Mathieu, D.; Servranckx, R.; D’amours, R.; Malo, A.; et al. Characterization of particulate exposure during fireworks displays. Atmos. Environ. 2010, 44, 4325–4329. [Google Scholar] [CrossRef]
  12. Thakur, B.; Chakraborty, S.; Debsarkar, A.; Chakrabarty, S.; Srivastava, R. Air pollution from fireworks during festival of lights (Deepawali) in Howrah, India-a case study. Atmosfera 2010, 23, 347–365. [Google Scholar]
  13. Joshi, M.; Nakhwa, A.; Khandare, P.; Khan, A.; Sapra, B.K. Simultaneous measurements of mass, chemical compositional and number characteristics of aerosol particles emitted during fireworks. Atmos. Environ. 2019, 217, 116–925. [Google Scholar] [CrossRef]
  14. Singh, L.; Sonwani, S. Analysis of Atmospheric Pollutants during Fireworks Festival ‘Diwali’. In Measurement, Analysis and Remediation of Environmental Pollutants; Springer: Singapore, 2019; p. 91. [Google Scholar]
  15. Lin, C.-C. A review of the impact of fireworks on particulate matter in ambient air. J. Air Waste Manag. Assoc. 2016, 66, 1171–1182. [Google Scholar] [CrossRef] [Green Version]
  16. Ravindra, K.; Kumar, S.; Mor, S. Long term assessment of firework emissions and air quality during Diwali festival and impact of 2020 fireworks ban on air quality over the states of Indo Gangetic Plains airshed in India. Atmos. Environ. 2022, 285, 119223. [Google Scholar] [CrossRef]
  17. Fleischer, O.; Wichmann, H.; Lorenz, W. Release of polychlorinated dibenzo-p-dioxins and dibenzofurans by setting off fireworks. Chemosphere 1999, 39, 925–932. [Google Scholar] [CrossRef]
  18. World Health Organization. Health Aspects of Air Pollution with Particulate Matter, Ozone, and Nitrogen Dioxide: Report on a WHO Working Group, Bonn, Germany, 13–15 January 2003; WHO Regional Office for Europe: Copenhagen, Denmark, 2003. [Google Scholar]
  19. Laden, F.; Schwartz, J.; Speizer, F.E.; Dochery, D.W. Reduction in fine particulate air pollution and mortality: Extended follow-up of the Harvard Six Cities Study. Am. J. Respir. Crit. Care Med. 2006, 173, 667–672. [Google Scholar] [CrossRef] [Green Version]
  20. Shi, Y.; Zhang, N.; Gao, J.; Li, X.; Cai, Y. Effect of fireworks display on perchlorate in air aerosols during the spring festival. Atmos. Environ. 2011, 45, 1323–1327. [Google Scholar] [CrossRef]
  21. Shrey, K.; Suchit, A.; Deepika, D.; Shruti, K.; Vibha, R. Air pollutants: The key stages in the pathway towards the development of cardiovascular disorders. Environ. Toxicol. Pharmacol. 2011, 31, 1–9. [Google Scholar] [CrossRef]
  22. Pirker, L.; Gradisek, A.; Visic, B.; Remskar, M. Nanoparticle exposure due to pyrotech-nics during a football match. Atmos. Environ. 2020, 233, 117567. [Google Scholar] [CrossRef]
  23. Caramagna, A.; Famoso, F.; Lanzafame, R.; Monforte, P. Analysis of vertical profile of particulates dispersion in function of the aerodynamic diameter at a congested road in Catania. Energy Procedia 2015, 82, 702–707. [Google Scholar] [CrossRef] [Green Version]
  24. Abdel-Rahman, A.A. On the atmospheric dispersion and Gaussian plume model. In Proceedings of the 2nd International Conference on Waste Management, Water Pollution, Air Pollution, Indoor Climate, Corfu, Greece, 26–28 October 2008; Volume 26. [Google Scholar]
  25. EPA: Particulate Matter (PM) Standards—Table of Historical PM NAAQS. 2013. Available online: https://www3.epa.gov/ttn/naaqs/standards/pm/spmhistory.html (accessed on 1 March 2022).
  26. Collins, D.; Parsons, M.; Zinyemba, C. Air quality at outdoor community events: Findings from fine particulate (PM2.5) sampling at festivals in Edmonton, Alberta. Int. J. Environ. Health Res. 2014, 24, 215–225. [Google Scholar] [CrossRef] [PubMed]
  27. Tsai, Y.I.; Sopajaree, K.; Kuo, S.-C.; Yu, S.-P. Potential PM2.5 impacts of festival-related burning and other inputs on air quality in an urban area of southern Taiwan. Sci. Total Environ. 2015, 527, 65–79. [Google Scholar] [CrossRef] [PubMed]
  28. Chen, J.; Dietrich, F.; Maazallahi, H.; Forstmaier, A.; Winkler, D.; Hofmann, M.E.; van der Gon, H.D.; Röckmann, T. Methane emissions from the Munich Oktoberfest. Atmos. Chem. Phys. 2020, 20, 3683–3696. [Google Scholar] [CrossRef] [Green Version]
  29. Russell, M.S. The chemistry of fireworks. In Royal Society of Chemistry; RSC Publishing: Cambridge, UK, 2009. [Google Scholar]
  30. Federal Register: Federal Motor Carrier Safety Regulations: Hazardous Materials Safety Permits. 2004. Available online: https://www.federalregister.gov/documents/2004/06/30/04-14654/federal-motor-carrier-safety-regulations-hazardous-materials-safety-permits (accessed on 1 March 2022).
  31. Minnesota State Fair: Minnesota State Fair Annual Report 2018. 2018. Available online: https://www.leg.mn.gov/docs/2019/mandated/190741.pdf (accessed on 1 March 2022).
  32. City of Novi Council: City of Novi Agenda Minutes. 12 August 2019. Available online: https://www.cityofnovi.org/Agendas-Minutes/City-Council/2019/190812/ConsentJStateFairFireworksPermit.aspx (accessed on 1 March 2022).
  33. Iowa State Fair: Fair Dates and Attendance. 2020. Available online: https://www.iowastatefair.org/about/fair-dates-attendance/ (accessed on 1 March 2022).
  34. Minnesota State Fair: Attendance. 2020. Available online: https://www.mnstatefair.org/about-the-fair/attendance/ (accessed on 1 March 2022).
  35. Noble, C.A.; Vanderpool, R.W.; Peters, T.M.; McElroy, F.F.; Gemmill, D.B.; Wiener, R.W. Federal Reference and Equivalent Methods for Measuring Fine Particulate Matter. Aerosol Sci. Technol. 2001, 34, 457–464. [Google Scholar] [CrossRef]
  36. EPA: Air Quality System (AQS) Air Data. 2013. Available online: https://www.epa.gov/outdoor-air-quality-data (accessed on 1 March 2022).
  37. NOAA National Centers for Environmental Information. Global Hourly — Integrated Surface Database (ISD). 2001. Available online: https://www.ncei.noaa.gov/products/land-based-station/integrated-surface-database (accessed on 1 March 2022).
  38. Efron, B.; Tibshirani, R. An Introduction to the Bootstrap; Chapman & Hall/CRC: Boca Raton, FL, USA, 1993; p. 436. [Google Scholar]
  39. The Register: Print or Save this Iowa State Fair Guide Before You Go to the Fairgrounds. 2019. Available online: https://www.desmoinesregister.com/story/entertainment/2018/08/07/2018-iowa-state-fair-printable-guide-maps-events-schedule-new-foods/924832002/ (accessed on 1 March 2022).
  40. Krzyzanowski, M.; Cohen, A. Update of who air quality guidelines. Air Qual. Atmos. Health 2008, 1, 7–13. [Google Scholar] [CrossRef] [Green Version]
  41. Mirabelli, M.C.; Vaidyanathan, A.; Flanders, W.D.; Qin, X.; Garbe, P. Outdoor PM 2.5, ambient air temperature, and asthma symptoms in the past 14 days among adults with active asthma. Environ. Health Perspect. 2016, 124, 1882–1890. [Google Scholar] [CrossRef] [Green Version]
  42. Li, W.; Dorans, K.S.; Wilker, E.H.; Rice, M.B.; Ljungman, P.L.; Schwartz, J.D.; Coull, B.A.; Koutrakis, P.; Gold, D.R.; Keaney, J.F., Jr.; et al. Short-term exposure to ambient air pollution and biomarkers of systemic inflammation: The Framingham heart study. Arterioscler. Thromb. Vasc. Biol. 2017, 37, 1793–1800. [Google Scholar] [CrossRef]
Figure 1. Location of the (top) Iowa State Fair, (center) Minnesota State Fair, and (bottom) Tennessee Valley Fair. Air quality and meteorological monitoring sites are indicated.
Air 01 00001 g001
Figure 2. Box and whisker plots of hourly PM2.5 concentrations for Iowa (top row), Minnesota (middle row), and Tennessee (bottom row) fairs during festival and control days. The lower and upper boundaries of each box show the 25th and 75th percentiles; the lower and upper “whiskers” identify the 10th and 90th percentiles; the horizontal line within the box denotes the median; the ‘x’ represents the mean; blue and orange circles represent the individual hourly concentrations. Left column: unfiltered data. Right column: data filtered for CMV.
Air 01 00001 g002
Figure 3. Box and whisker plots of hourly PM2.5 concentrations during festival and control days for Iowa State Fair during individual years of unfiltered data: (a) 2019; (b) 2018; (c) 2017. The lower and upper boundaries of each box show the 25th and 75th percentiles; the lower and upper “whiskers” identify the 10th and 90th percentiles; the horizontal line within the box denotes the median; the ‘x’ represents the mean; blue and orange circles represent the individual hourly concentrations.
Air 01 00001 g003
Figure 4. MODIS satellite imagery of wildfire smoke from British Colombia being transported across the United States from NASA Worldview application on 17 August 2018, a control day for the Minnesota State Fair.
Air 01 00001 g004
Figure 5. Air pollution rose analysis depicting wind direction and associated PM2.5 concentrations frequencies for control (left) and festival (right) days for cumulative years at the Iowa (top) and Minnesota (bottom) State Fairs. Black arrows denote directional bearing toward state fair location.
Air 01 00001 g005
Table 1. Location and details of state fairs investigated during the study. The distance between state fair location and air quality sites (AQS) and automated surface observation stations (ASOS) are included.
FestivalApproximate Annual Attendance YearsAQS Distance (km) and Site IDASOS Distance (km) and Site IDDuration (Days)Fireworks Details
Iowa State Fair1,100,000 [33]2017–20197
Site ID:
19-153-0030
11
Site ID: 14933 DSM
10Nightly,
9–11 p.m.
Minnesota State Fair2,000,000 [34]2013–201910
Site ID:
27-123-0871
10
Site ID: 14927 STP
12Nightly,
9–11 p.m.
Tennessee
Valley Fair
130,000 [3]2018–20194
Site ID:
47-093-1013
3
Site ID: 13891 TYS
10Nightly
Table 2. The number of festival days (considering all years) that met the data completeness requirement for meteorological and air quality measurements for each fair. In parenthesis is the total number of festival days that met the CMV criteria at that hour (bolded values are hours that met the sample size requirement for statistical testing).
Hour (Local)Festival
IowaMinnesotaTennessee
032 (3)85 (14)20 (3)
132 (2)84 (8)20 (3)
231 (7)85 (8)20 (5)
331 (10)85 (7)20 (4)
432 (8)85 (8)20 (3)
531 (8)83 (7)20 (3)
632 (5)85 (6)20 (1)
732 (5)85 (8)20 (2)
832 (7)85 (5)20 (4)
932 (6)84 (7)20 (2)
1031 (4)84 (3)20 (1)
1132 (5)76 (4)20 (5)
1231 (6)77 (5)20 (4)
1332 (7)81 (5)20 (6)
1431 (6)84 (10)20 (5)
1532 (4)85 (8)20 (8)
1632 (3)85 (10)20 (5)
1731 (3)85 (10)20 (1)
1833 (3)85 (10)20 (1)
1932 (2)84 (14)20 (3)
2031 (0)84 (10)20 (3)
2132 (2)85 (14)20 (2)
2233 (1)83 (9)20 (2)
2333 (2)85 (10)20 (2)
Disclaimer/Publisher’s Note: The statements, opinions and data contained in all publications are solely those of the individual author(s) and contributor(s) and not of MDPI and/or the editor(s). MDPI and/or the editor(s) disclaim responsibility for any injury to people or property resulting from any ideas, methods, instructions or products referred to in the content.

