Article

The Effects of Fertilizer Sources and Site Location on Greenhouse Gas Emissions from Creeping Bentgrass Putting Greens and Kentucky Bluegrass Roughs

by
Katy E. Chapman
* and
Kristina S. Walker
Division of Agriculture, Natural Sciences, and Technology, University of Minnesota Crookston, Crookston, MN 56716-5001, USA
*
Author to whom correspondence should be addressed.
Grasses 2023, 2(2), 78-97; https://doi.org/10.3390/grasses2020008
Submission received: 14 March 2023 / Revised: 24 April 2023 / Accepted: 26 April 2023 / Published: 5 May 2023
(This article belongs to the Special Issue Advances in Sustainable Turfgrass Management)

Abstract

:
Understanding greenhouse gas (GHG) emissions from turfgrass allows managers to make cultural management decisions to reduce GHG emissions. The objective of this study was to evaluate fertilizer source [urea (URE), polymer-encapsulated urea (POL), and milorganite (MIL)] and site location (green, wet rough, and dry rough) on GHG [carbon dioxide (CO2), methane (CH4), and nitrous oxide (N2O)] emissions. Greenhouse gas data, soil temperature, soil moisture, canopy greenness, and turfgrass quality were collected. High soil temperature and moisture were correlated with soil CO2 and N2O flux. The wet rough fluxed more soil CH4 across the 2-year study. The POL fluxed the highest amount of soil CO2, while POL and MIL fluxed the largest amount of soil N2O on the wet rough. Milorganite and POL increased canopy greenness in both roughs during the spring. On the green, URE produced greater canopy greenness in the spring and fall. Our results indicate that when soil moisture and temperature are high, turfgrass managers should employ methods of reducing soil temperatures that do not increase soil moisture to reduce GHG emissions. Under warm and wet conditions, gaseous losses of GHGs are accelerated with slow-release fertilizers.

1. Introduction

The world is facing and will continue to face grand challenges in the coming century including climate change [1]. Much of the discussion around climate change is centered on carbon dioxide (CO2) as evidenced by the historic Paris Agreement where nations signed on to reduce carbon emissions in an effort to slow down climate change [2]. Methane (CH4) and nitrous oxide (N2O) are also important greenhouse gases (GHGs) to consider when mitigating climate change. These gases are found in relatively small amounts in the atmosphere, but they have a higher global warming potential (GWP: CO2 = 1; CH4 = 25; N2O = 298) per molecule than CO2 [3]. The dominant source of CH4 (50%) and N2O (60%) entry into the atmosphere through direct and indirect emissions is agricultural activities [4]. This underscores the importance of evaluating CH4 and N2O emissions from different systems for the purpose of developing strategies for their reduction.
Given the potential of these trace gases to contribute to global climate change, impacts of management and environmental factors on their efflux from soil has begun to receive more focused attention. Several authors [5,6] have found that no-tillage systems that enhance crop residue retention represent a land management practice that both protects atmospheric quality (reduced CO2 emissions) and increases soil quality [increased carbon (C) sequestration]. Over 20 years, the increased N2O emissions from agricultural systems offset C storage from 75–310% depending on the land management practice. Agriculture and other land uses have been shown to act as sources and sinks of these important GHGs. Because of this and their impact on the global climate, a need exists to evaluate fluxes of these gases under different land use and soil management practices.
The area of intensively managed turf on golf courses worldwide is estimated to be 2.56 million ha [7]. Emissions of N2O from agricultural lands including turfgrass largely has been driven by N applications [8,9,10,11,12,13,14], while CO2 emissions in agriculture are largely driven by organic soils being disturbed [15]. In turfgrass, the main contributors to GHG emissions come from mowing and fertilization practices [7]. This C release is due to different maintenance practices [16]. Fertilizer application, soil moisture, and other cultural management practices have the potential to contribute to emissions and mitigation. This leads to uncertainties in the net contribution of turfgrass ecosystems to climate change [17]. Golf course fairways could sequester soil organic carbon at a rate of 1.0 MG ha−1 yr−1 during the first 25 years of conversion from crop land [18]. Net GHG emissions across the golf course are a function of the intensity of management, area, and plant species. Intensively managed tees and greens comprise only 3% of a total golf course area but 16% of emissions [7]. Net sequestration was observed in this study in lower-intensity management areas such as the fairways and roughs.
Three slow-release forms of N fertilizer fluxed higher N2O than the unfertilized control in turfgrass [19]. This study did not include a fast-release fertilizer. In various agroecosystems, slow-release fertilizers have reduced N2O emissions compared to fast-release fertilizers [20,21,22,23,24]. There is some evidence that coatings on URE can reduce the hydrolysis rate, which reduces gaseous losses of nitrogen [25,26,27].
The focus of previous research in turfgrass has been predominately on N2O flux, where the use of multiple fertilizer sources and monthly applications is limited [28]. The purpose of the current study was to evaluate the flux of three GHGs (CO2, CH4, and N2O) and turfgrass color and quality from different site locations on a golf course (putting green and two rough locations with differing topography relative to a berm) maintained with varying N sources (fast and slow release) applied monthly throughout the growing season.

2. Materials and Methods

This two-year field study was conducted from June 2013 through October 2014 at Lincoln Golf Course in Grand Forks, ND, USA. The site is located adjacent to the Red River of the North. The golf course has two flood control dikes (berms) that run parallel to the river and fairways. Three site locations were selected based on cultural intensity, turfgrass species, and known differences in soil moisture (on berm vs. off berm) (Table 1): Site 1—80% Creeping bentgrass (Agrostis stolonifera L.) and 20% annual bluegrass (Poa annua L.) practice putting green (green) consisting of a sand-based root zone (80:20 sand:organic matter). Site 2—Kentucky bluegrass (Poa pratensis L.) rough located on the berm (dry rough). Site 3—Kentucky bluegrass (Poa pratensis L.) rough located off the berm (wet rough).
Fifteen soil samples (10.2 cm depth) were randomly taken per location at the beginning of the study and sent to AgVise (Harwood, ND, USA) for analysis. The practice putting green had a pH of 7.8, 39 kg ha−1 of P, 267 kg ha−1 of K, and 37 g kg−1 of organic matter. Both sites in the rough were on a silty clay loam soil (fine-silty, mixed, superactive, and frigid Aquolls) where the wet rough site had a pH of 7.8, 9 kg ha−1 of P, 656 kg ha−1 of K, and 81 g kg−1 of organic matter, and the dry rough site had pH of 8.0, 2 kg ha−1 of P, 511 kg ha−1 of K, and 37 g kg−1 of organic matter.

2.1. Environmental Conditions

Temperature (soil and air) and moisture were recorded weekly synchronously with greenhouse gas collection during the growing season using an HM digital TM-1 industrial-grade digital thermometer and a Dynamax TH300 TDR soil moisture probe, which takes the average soil moisture in the top 60 mm of soil. The only measurable difference between the two years was that soil moisture varied by location in 2013 (Table 1). This is a result of the 2014 growing season experiencing twice as much total precipitation than the 2013 growing season [45 cm (2014) vs. 23 cm (2013)].

2.2. Fertilizers Evaluated

Turfgrass plots were fertilized May through October with an annual nitrogen (N) rate of 221 kg of N ha−1 yr−1. For May, September, and October, a rate of 49 kg of N ha−1 was applied to each plot. For June, July, and August, 24.5 kg of N ha−1 was applied to each plot. Four sources of granular fertilizer were used: untreated control (UNT), urea (URE) (46-0-0), polymer-encapsulated urea (POL) (30-0-15), and milorganite (MIL) (5-2-0). URE is a fast-release N source, whereas both POL (synthetic) and MIL (natural organic) are slow-release N sources. Monthly applications were applied the first week of each month throughout the growing season.

2.3. Experimental Design

The plot size was 0.61 m × 0.61 m. Each treatment was replicated four times, and plots were arranged in a randomized, complete-block design. Each experimental site was treated as a block. Each block contained four replications and four fertilizer treatments for a total of 16 plots per block and a total of 48 plots in the experiment.

2.4. Greenhouse Gas Analysis

In the middle of each plot, a polyvinyl chloride (PVC) pipe with a diameter of 0.152 m and a height of 0.114 m was tamped into the ground until it was flush with the soil surface. These PVC pipes were then used as the bases for sample collection for the rest of the experiment. Samples were taken weekly in accordance with the methods of the United States Department of Agriculture-Agricultural Research Service Greenhouse Gas Reduction through Agricultural Carbon Enhancement network [29,30]. Briefly, gas samples (10 mL) were taken by tamping in a vented closed gas chamber over the base that was left in place for 40 min. Gas samples were taken at 0, 20, and 40 min post chamber closure. These samples were placed in gas-tight vials using a syringe.
The samples were then transported back to the laboratory and analyzed using a gas chromatograph to determine the concentration of CO2, CH4, and N2O in each sample. This was done using a Varian 350 gas chromatograph equipped with a thermal conductivity detector (TCD), an electron capture detector (ECD), and a flame ionization detector (FID). CO2 was detected using the TCD, CH4 was detected using the FID, and N2O was detected using the ECD. Gas concentrations were determined by interpolation using standards obtained from Scotty specialty gases (Plumsteadville, PA, USA). Standard curves were accepted for analysis if they have an r2 value greater than 0.99. Gas flux rates were determined by the change in concentration over the 40 min sampling period using linear regression.

2.5. Turfgrass Color and Quality

Turfgrass appearance was evaluated using visual ratings and quantifying canopy greenness. Turfgrass quality was visually rated (per plot) weekly throughout the growing season using a 1 to 9 scale, where 1 = completely brown dead turf, 6 = minimally acceptable turf, and 9 = optimum uniformity, density, and greenness [31]. Turfgrass greenness was determined using a chlorophyll meter that measured the normalized difference vegetation index (NDVI) of the turfgrass stand (FieldScout CM 1000 NDVI from Spectrum Technologies, Inc., Aurora, IL, USA). Three measurements were taken from approximately 90 cm above the turfgrass canopy using a diagonal grid pattern which measured the top, center, and bottom of each plot. The three measurements were averaged to produce a single plot rating and are reported as NDVI (−1 to 1).

2.6. General Plot Maintenance

The plots on the practice putting green were mowed at 0.36 cm, and both blocks of rough were mowed at 5 cm. All three areas did not receive any additional fertilization other than the fertilizer treatments during this two-year study. The plots in the rough only received moisture in the form of natural precipitation. For the green, in the absence of significant rainfall, irrigation was supplementally applied each week (no more than 0.38 cm) to promote growth and maintain the soil at or near field capacity during the growing season (Apr–Oct). The research plots were not aerated for the duration of the study due to ring location in the soil. Four applications of topdressing [United States Golf Association (USGA) rootzone mixture, 0.65 cm/application] were applied to the green during the growing period to maintain putting green uniformity. Herbicides and fungicides were not applied over the research plots for the duration of this study.

2.7. Statistical Analysis

Statistical analysis was conducted using the general linear model (GLM) for GHG data and turfgrass data and the regression model (REG) for moisture and temperature as predictors of greenhouse gas flux using Statistical Analysis Software [32]. Data points more than two standard deviations from the mean were identified as outliers and removed from the dataset. The assumptions of these models were checked, and appropriate transformations were applied as needed. The CO2 data were transformed using a λ of 0.25, CH4 was transformed using a λ of 3/2, and N2O data were transformed using a λ of −3. Treatment means were separated using Fisher’s protected LSD, and a significance level of α = 0.05 was established a priori. Throughout the results and discussion section, unless otherwise specified, statistical differences refer to the mean separation tests conducted at the 0.05 level. Figures and tables represent back-transformed means.

3. Results and Discussion

3.1. CO2 Emissions

Results show significant differences between soil CO2 emissions based on site location in 2013 (p < 0.0001) and 2014 (p < 0.0001) (Table 2, Table 3 and 
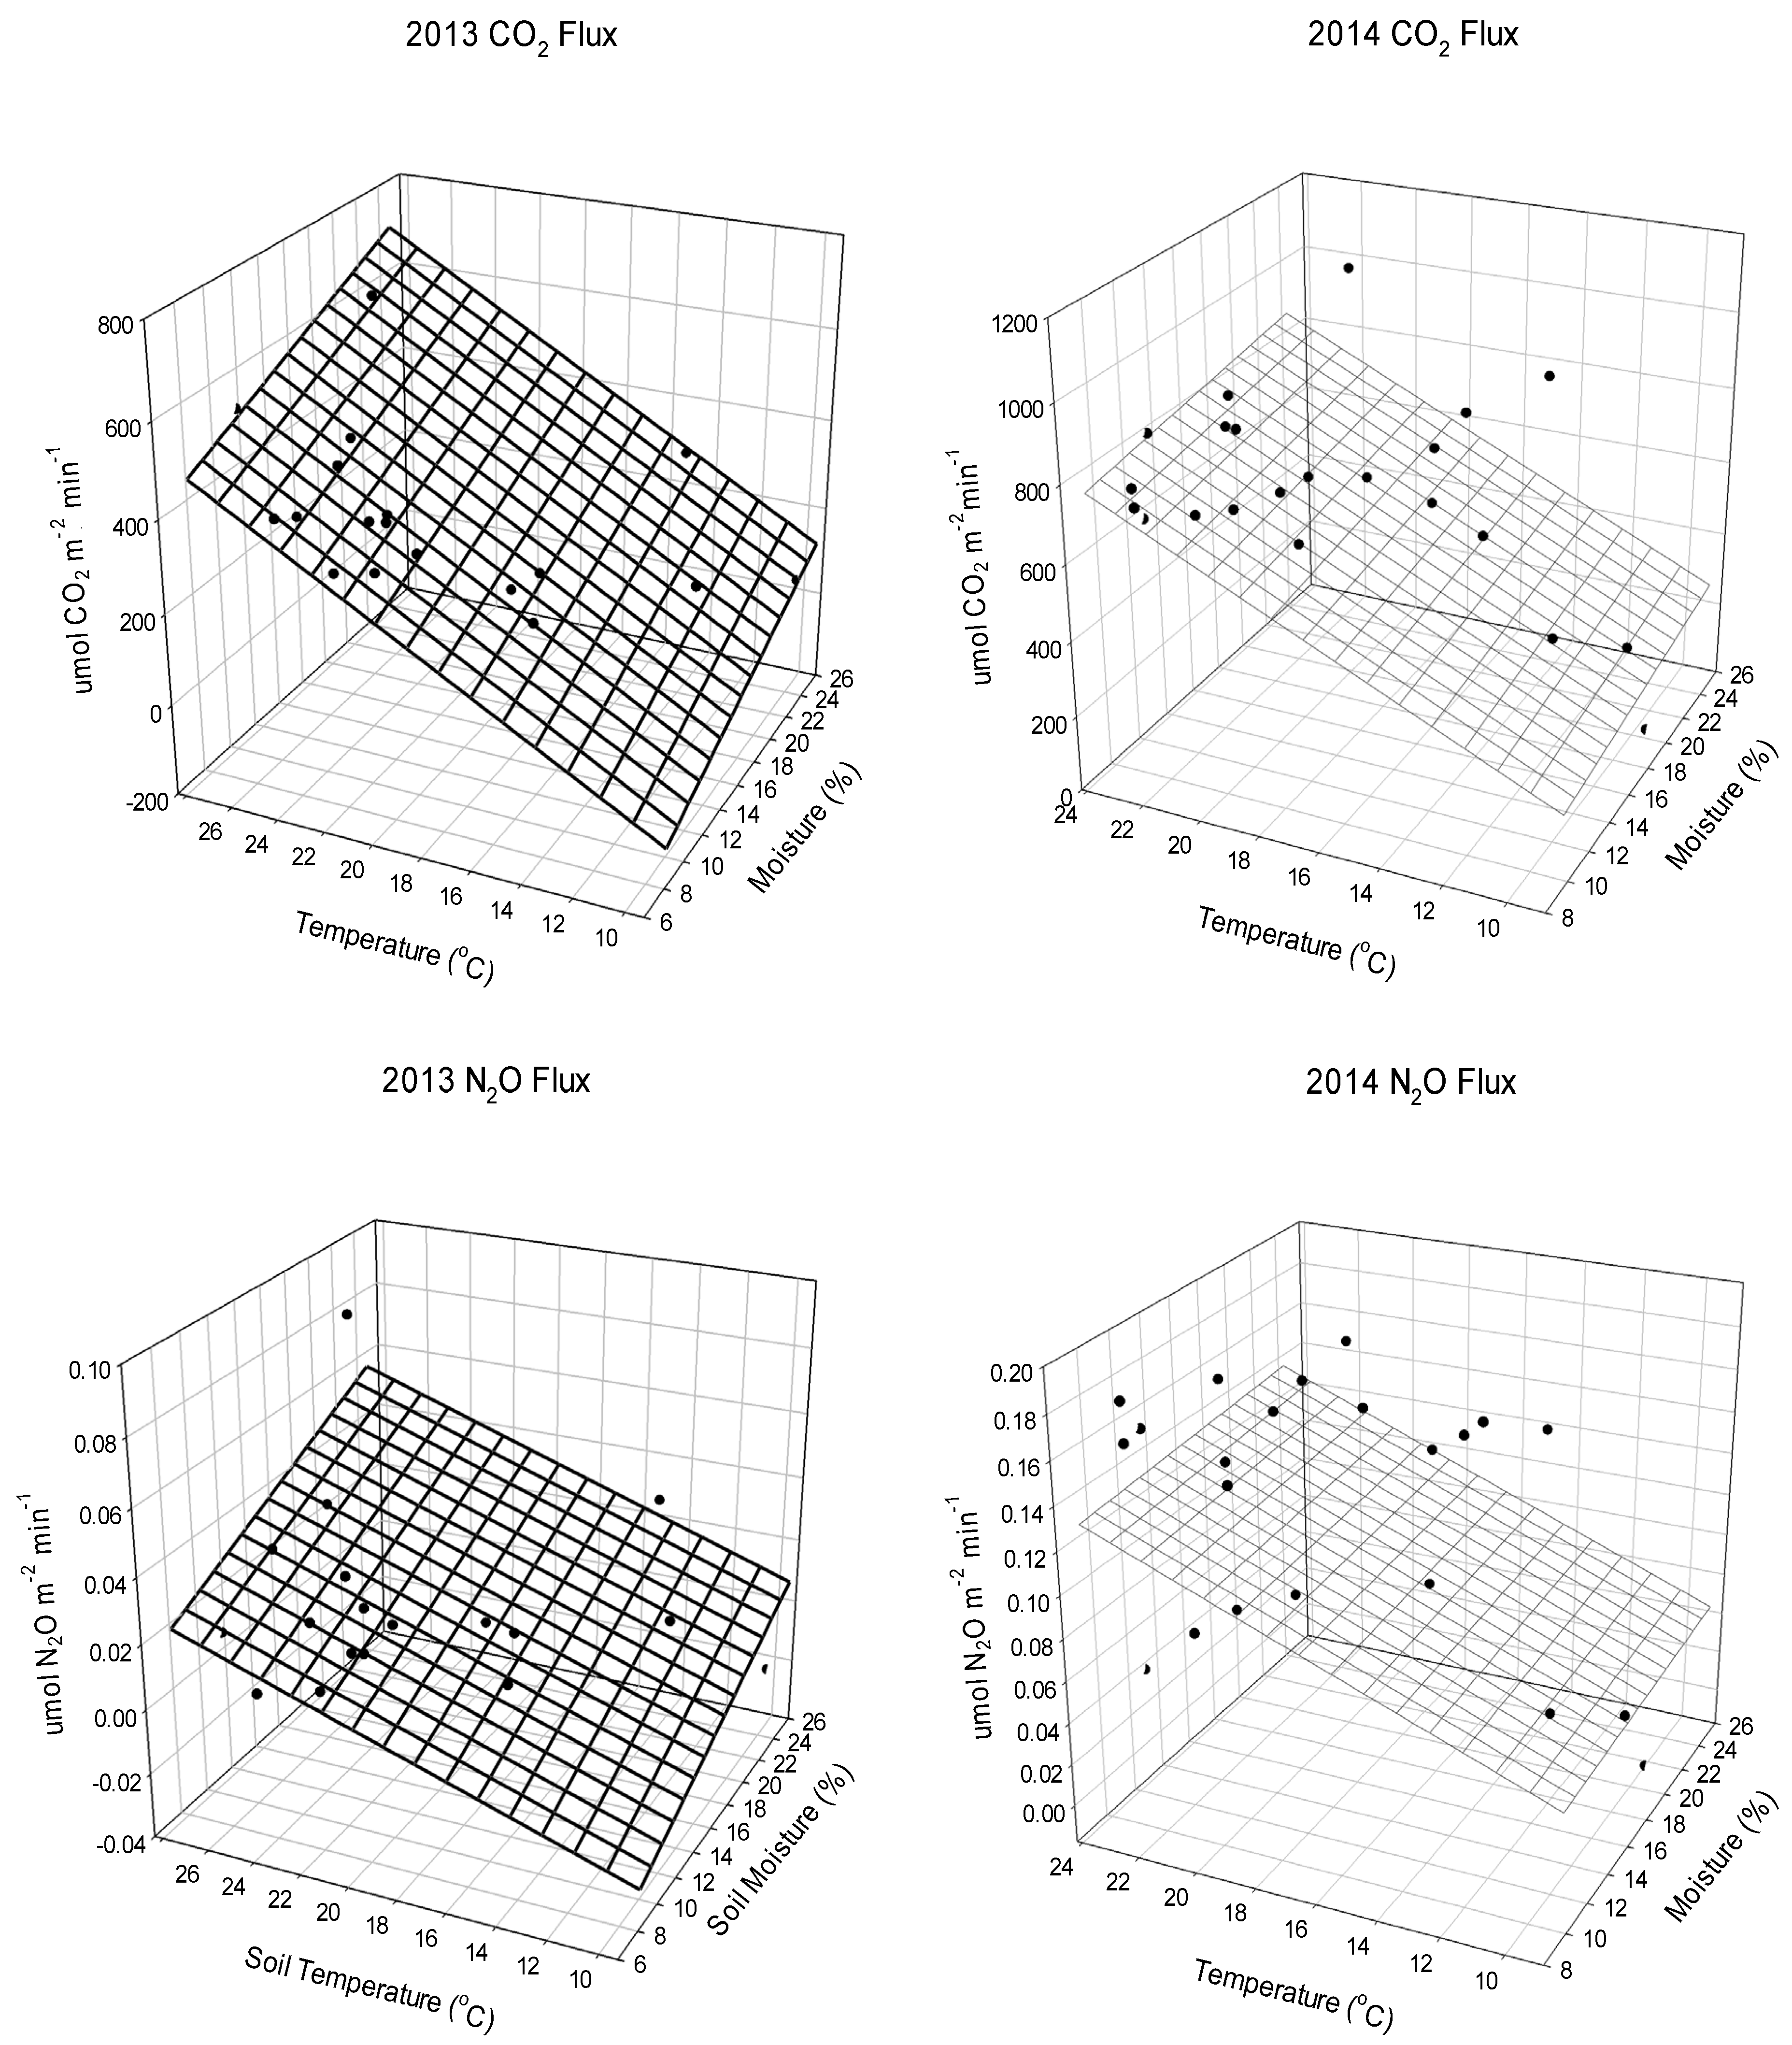
Table 4). The regression analysis showed that soil temperature and moisture are significant predictors (p < 0.0001) of soil CO2 flux (Figure 1). Wetter and warmer conditions were associated with higher soil CO2 flux across both growing seasons (Figure 1). When averaged across the entire two-year study, site location was the only significant difference noted for soil CO2 flux, with the green fluxing significantly more soil CO2 than either of the rough sites (Table 4). This makes sense, as the green receives more play and therefore is more intensely managed throughout the growing season.
Soil microorganisms are the dominant force influencing the flux of soil CO2 [33]. Factors that stimulate soil microbial activity will also result in higher soil CO2 flux. In general, soils that are extremely wet or extremely dry significantly restrict soil microorganisms’ activity [33]. Outside of those extremes, most microorganisms’ activity will increase as soil moisture and temperature increase, resulting in higher soil respiration and the higher levels of soil CO2 flux observed in the current study. While this is not new information, within the context of a highly managed and irrigated system such as turfgrass, it does lend itself to the question of how much irrigation is needed to maintain the quality of turf expected by golf course superintendents [33].
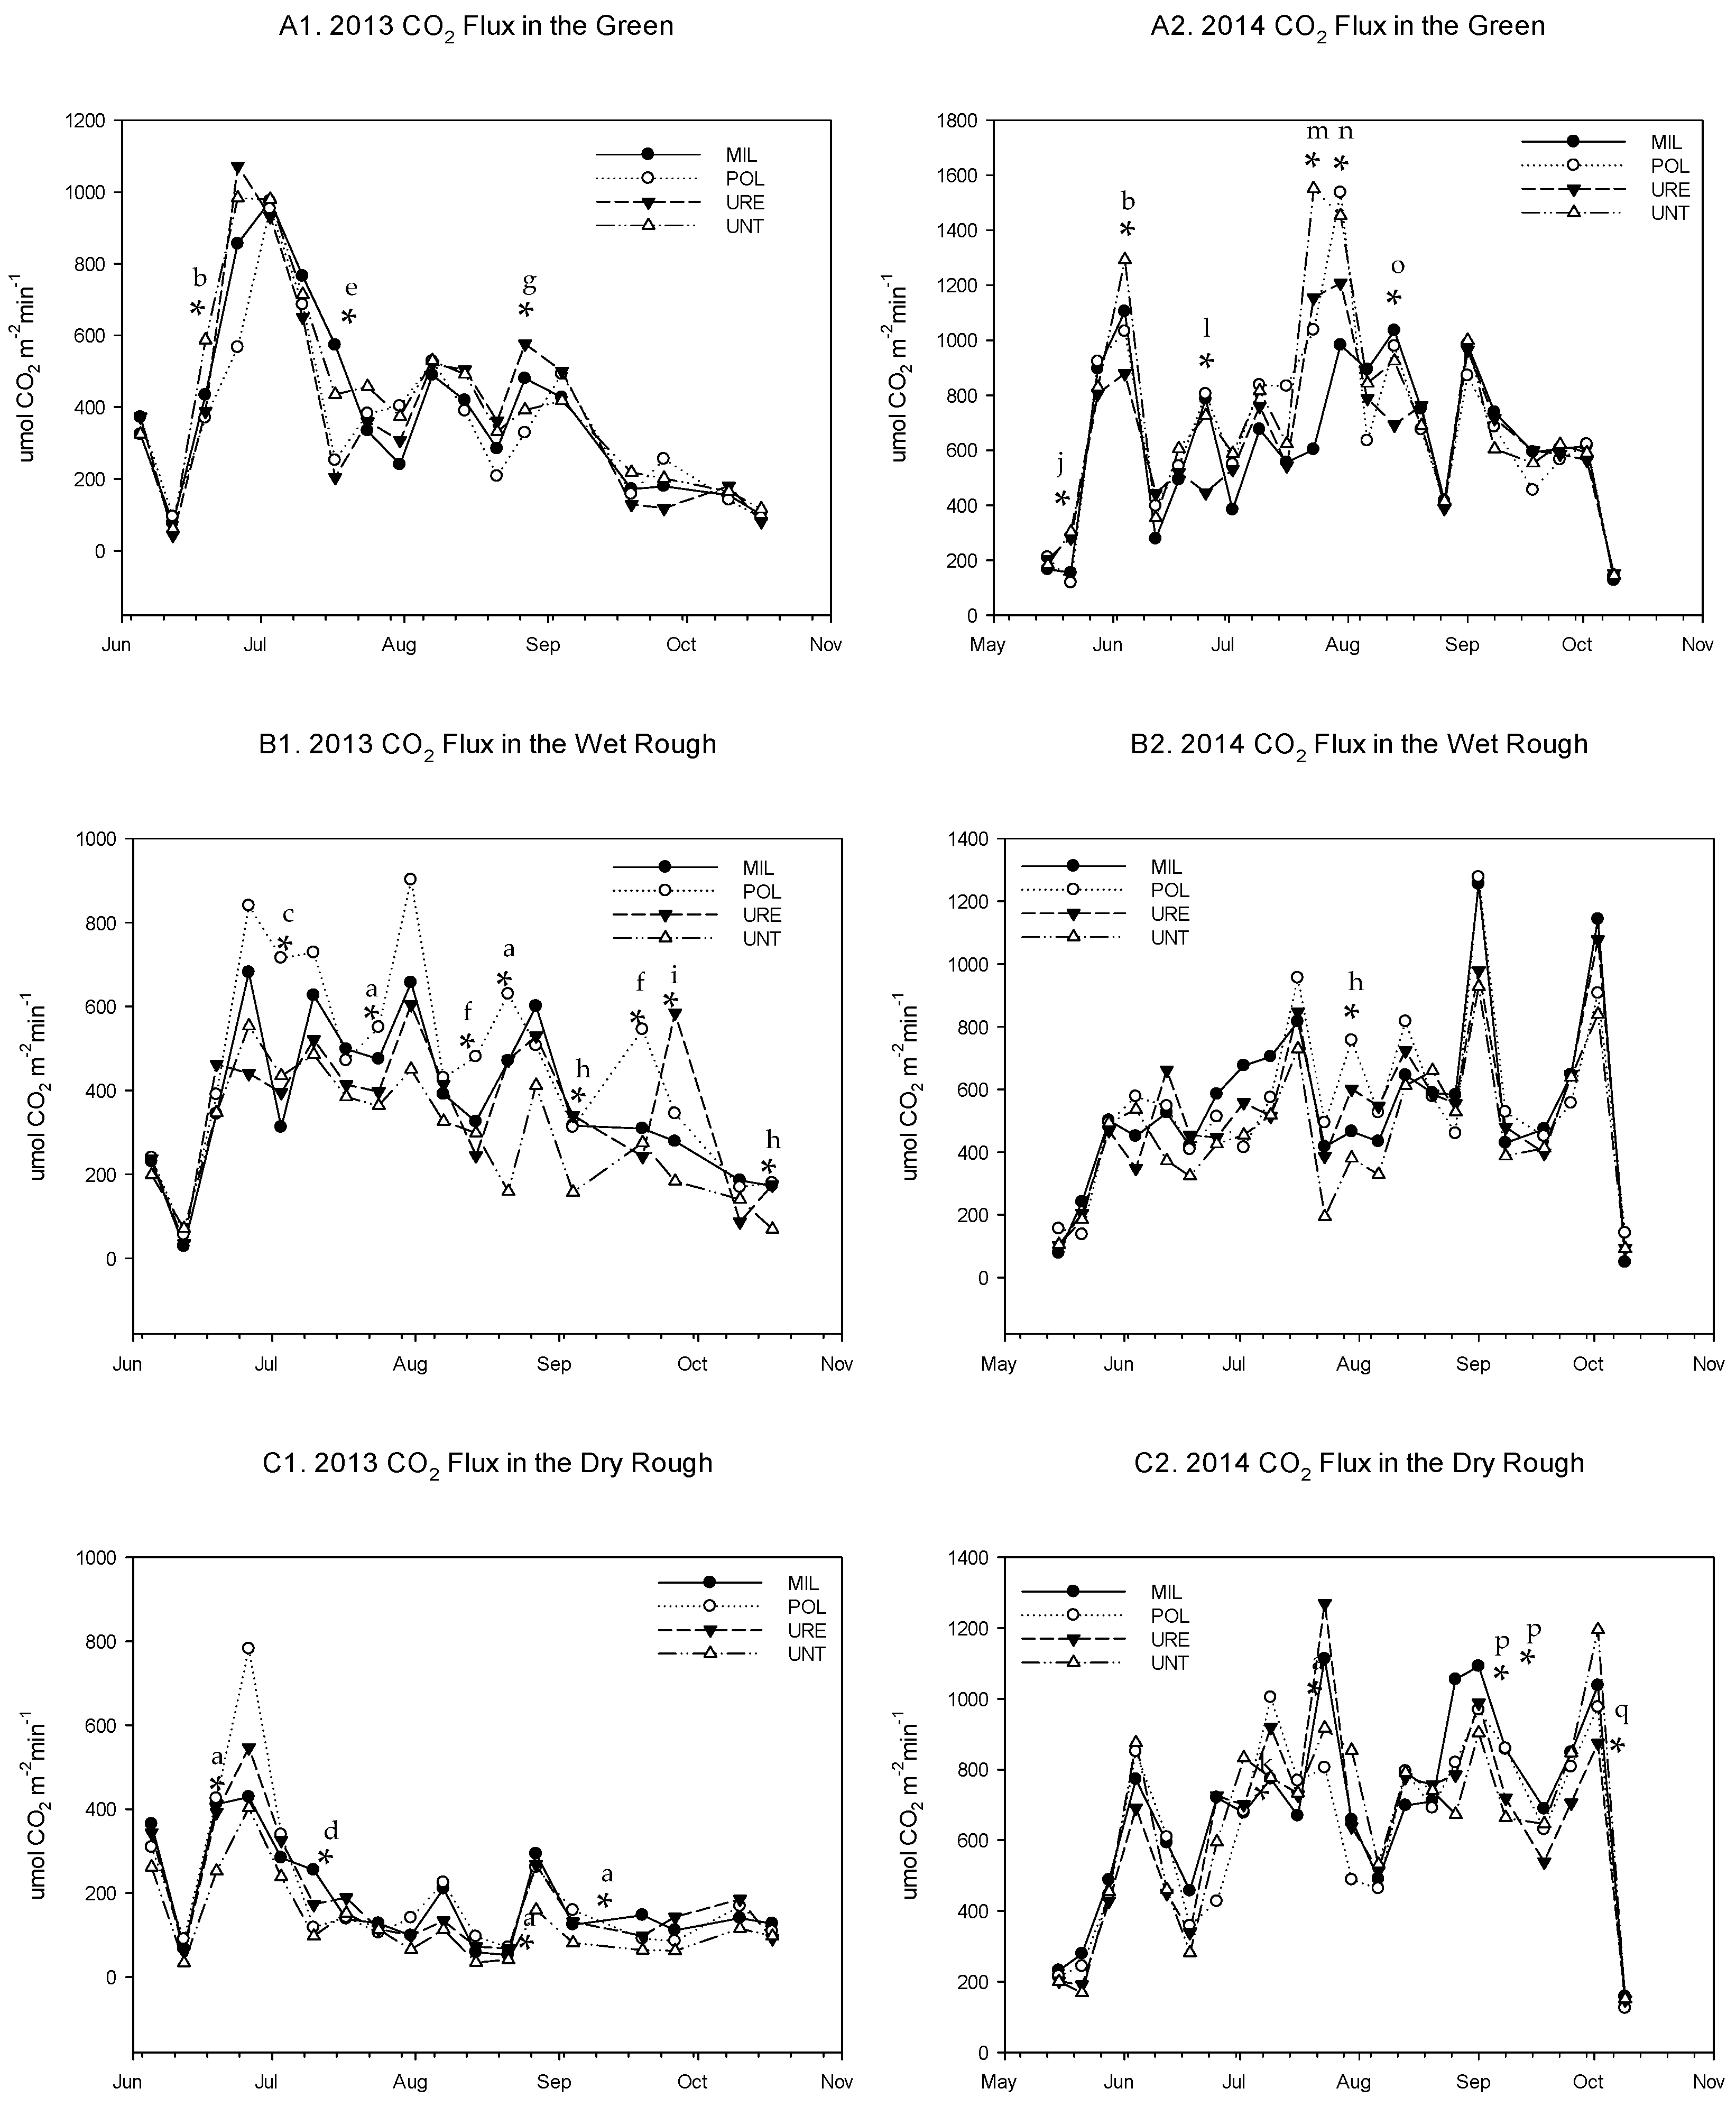
In addition to the large differences driven by temperature and moisture, there were some differences between fertilizer treatments by site location. The statistical differences by date throughout the 2013 growing season are detailed in Figure 2. When analyzed across the entire 2013 growing season, the POL and MIL fluxed significantly (p = 0.0140) more than the untreated control across all sites (Table 2). The interaction between site and fertilizer was significant (p = 0.0148). Details on which fertilizer treatments fluxed more on each of the sites can be found in Table 2. No differences between fertilizer treatments were observed during the 2014 growing season (Table 3) or when averaged across the two-year study period (Table 4).
Just as in 2013, there were a few dates in 2014 with significant differences between fertilizer treatments. The statistical differences by date throughout the 2014 growing season are detailed in Figure 2, but no consistent trend is present. However, the emissions in 2014 were generally higher than in 2013 (Figure 3), which is likely a result of the wetter conditions (Table 1).
There is strong evidence that the number of microorganisms has a significant effect on the fixation of organic carbon in soils. These organisms can take up and assimilate soluble low-molecular-weight compounds. By doing this, microorganisms can maintain the C gradient in the soil solution for a healthy soil community [34]. When looking at the fertilizer treatments that resulted in the lower CO2 fluxes, MIL is an organic-nutrient-rich fertilizer that comes with not only nitrogen and carbon but also a healthy microbial community [35]. The microbial community associated with MIL can grow and remove soluble low-molecular-weight compounds and thus does not disrupt any normal nutrient cycling in the soil [36,37] and instead promotes carbon fixation and storage in the soil. The unfertilized control also does not experience a flux of soluble nutrients without carbon to feed the microorganisms and so would not be expected to flux high levels of soil CO2. The two inorganic fertilizer treatments (fluxed highest in 2013) would provide additional nitrogen without additional carbon. Therefore, the microorganisms would be stimulated to grow and incorporate nitrogen but would need to access soil carbon to assimilate carbon into their growing bodies. This is supported in the literature as numerous studies have found that nitrogen fertilization increases rhizosphere respiration [34,38]. As the microorganisms break down the stored organic carbon, they will release some carbon into the atmosphere as a byproduct of these activities. In addition, without the additional input of carbon, only a limited number of microorganisms would be present to capture the carbon being lost because of these activities [39,40]. Caution must be taken, however, as there is also evidence that providing nitrogen fertilization stimulates overall plant growth, which would increase the carbon stored above ground and ultimately in the soil horizon [34,41]. This could lead to increased mowing frequency by golf course staff to maintain the turf at the desired level.

3.2. CH4 Emissions

When analyzed by year, no significant (p > 0.05) differences in CH4 emissions were observed by site location in either the 2013 or 2014 seasons (Table 2 and Table 3). However, when averaged across both years, the wet rough fluxed significantly (p = 0.0038) more soil CH4 than did the green (Table 4). In 2013, we did observe some differences between POL and URE on the wet rough and between POL and UNT on the green (Table 2). Soil CH4 flux is generally associated with wet conditions [42]; thus, it is not surprising that the wettest site (wet rough; Table 1) fluxed significantly higher soil CH4 than the other site locations throughout the study.

3.3. N2O Emissions

Results show significant (p < 0.0001) differences between N2O emissions based on site location in 2013 (Table 2). Across the season, the N2O emissions were highest on the wet rough (Table 2). As with CO2 emissions, N2O emissions are primarily driven by soil moisture and temperature throughout the growing season (Figure 1). Results in 2014 did not show significant differences between N2O emissions based on site location (Table 3). Across the season, soil moisture did not vary significantly between the different sites (Table 1). The pattern of N2O flux was similar across sites and was predictable based on the differences in soil moisture content and soil temperature (Figure 1) across the growing season. When averaged across both growing seasons, the wet rough fluxed significantly (p < 0.0001) more soil N2O than did the green (Table 4) and was associated with the highest soil moisture content (Table 1).
Soil temperature and moisture are strong predictors of soil N2O flux (Figure 1). In 2013, this effect was only evident on the wettest site (wet rough), and in 2014, we found no differences between the site locations, which is likely a result of the small differences in soil moisture (Table 1). This is similar to what others have found in that N2O emissions typically increase after N fertilizer application and precipitation or irrigation [11,12,43,44]. Although other researchers have found N fertilizer application to have a stronger effect [28], our results indicate that soil moisture and temperature are far more important than the fertilizer source. Given the role of soil moisture in accelerating denitrification rates, this is not surprising. This is further emphasized by the results across both growing seasons in which only site location had as significant impact on soil N2O flux (Table 4).
The general requirements for denitrification include the lack of O2, availability of N oxides (NO3, NO2, NO, or N2O), an available organic carbon source, and the presence of denitrifying microorganisms [11]. The lack of oxygen is likely the dominant factor limiting denitrification in soils, followed by NO3 and then organic C availability [45,46,47]. Thus, nitrogen fertilization and water (irrigation or precipitation) both affect nitrification and denitrification. N2O fluxes are likely driven by the concept of the limiting nutrient (O2 availability, NH4+ and NO3 availability, and availability of soluble organic carbon); as conditions become right for denitrification to occur, the fertilizer source and availability of N begins to have a stronger effect. It has been observed that elevated soil temperatures (30 °C or higher) coupled with saturated soil conditions increased denitrification rates [48] in Kentucky bluegrass (Poa pratensis L.), resulting in higher N2O emissions [49], and that irrigation with as little as 5 mm of water increased N2O emissions from a mix of ryegrass (Lolium perenne L.) and dallisgrass (Paspalum dilatatum Poir.) [50]. It is likely that in these studies and in our study, the lack of oxygen is the limiting factor in denitrification and any addition of water increases denitrification rates. Minor increases in fluxes after that point are due to differences in the availability of NH4+ and NO3 in the source of fertilizer applied versus how much the turfgrass utilized.
In addition to the large differences driven by soil temperature and moisture, there were some differences between fertilizer treatments in both years. The statistical (p < 0.05) differences by date throughout the 2013 growing season are detailed in Figure 3. When analyzed across the 2013 growing season and across site location, there were no significant differences between fertilizer treatments (Table 2). However, there were some significant differences between fertilizer treatments that occurred on the wet rough (Table 2). The POL fluxed significantly more than all other treatments except the MIL on the wet rough (Table 2). MIL in the wet rough fluxed significantly higher N2O than treatments on the green (URE, MIL, POL and UNT), on the dry rough (MIL, POL, and UNT), and on the wet rough (UNT) (Table 2).
The statistical differences by date throughout the 2014 growing season are detailed in Figure 3. Overall, in 2014, the differences between site location and fertilizer applications were not significant when analyzed across the entire growing season (Table 3), and most of the differences in soil N2O flux can be attributed to the differences in soil moisture and soil temperature (Figure 1).
In 2013, when assessing fertilizer treatments on the green, (Figure 3A1) there were four dates with significant differences, and on three of those dates, the URE or POL fluxed higher than all other treatments. This likely means that in the green, when the moisture conditions are right for denitrification, the limiting nutrient is NO3. On the wet rough (Figure 3B1), the differences between fertilizer treatments are stronger, and in general, the POL fluxes the highest across the growing season while the control fluxes the lowest. This means that on the wet rough when the conditions were right for denitrification to occur, the slow-release fertilizer was adding NO3 to the soil, which would be released quicker under the wet conditions present at this site, but it would be retained on the plots until the wet conditions exist [51]. There were two dates with statistical differences between fertilizer treatments on the dry rough (Figure 3C1) but no consistent trend, which means it rarely received enough moisture for denitrification to occur. In 2014, differences between fertilizer treatments were small, but there was one date in the green where the MIL fluxed the highest (Figure 3A2). On the wet rough (Figure 3B2), the only consistent trend was that the control fluxed the lowest, and in the dry rough (Figure 3C2), the MIL fluxed the highest on four of the five dates showing significant differences. Although the MIL more consistently fluxed higher than the other fertilizer treatments in 2014, the magnitude of those significant differences was not large in 2014. This suggests that the first two conditions (lack of oxygen and presence of NO3) where met during this year and that the presence of soluble organic carbon became the limiting nutrient for denitrification, and thus the addition of MIL with its organic carbon increased the rate of denitrification [52]. These data strongly support the idea that there is a hierarchy in terms of which soil conditions will affect N2O flux from soils. For N fertilizer source to have an effect, the soil moisture and temperature must be adequate, and for soil organic carbon to have an effect, the level of NO3 moisture and temperature must meet the conditions required for denitrification.
It is apparent that for differences in N2O flux to be observed between fertilizer treatments, the soil conditions need to have some level of moisture. In general, we observed that in a wet year (2014), the MIL fluxed the highest across the sites, although the magnitude of this flux was small. On the other hand, in the drier year (2013), the wettest of the sites showed consistently higher flux from POL, an inorganic slow-release fertilizer. In both cases, it was a slow-release form of nitrogen that generally fluxed the highest. This result is somewhat unexpected, although it is not inconsistent with the literature and generally makes sense considering what we know about the nitrogen cycle.
Controlled-release fertilizer (PCU) did not reduce N2O emissions in one study compared with URE in bermudagrass [44] (Cynodon dactylon × C. transvaalensis Burtt-Davy), and another study found this to be the case in Kentucky bluegrass (Poa pratensis L.) [53]. Other studies, however, reported lower N2O emissions by PCU compared with URE in Kentucky bluegrass (Poa pratensis L.), perennial ryegrass (Lolium perenne L.), and ‘Meyer’ zoysiagrass (Zoysia japonica Steud.) [13,54]. Perhaps a detailed analysis of soil moisture and temperature on these studies could explain the variation in the observed impacts of PCUs on N2O emissions.

3.4. Canopy Greenness and Turfgrass Quality

N fertilizer was not significant in 2013 for canopy greenness (Table 5). Golf course site location was significant (p < 0.001) during the summer (14 Jul–4 Sep) and the fall (26 Sep–26 Oct). The wet rough site had consistently higher canopy greenness readings during the summer compared to the dry rough and the green. This is likely a result of the higher soil moisture content on this site across the study (Table 1). The green had higher canopy greenness values than the dry rough due to regular irrigation during the summer on the green, whereas the dry rough site received full sunlight and only natural precipitation. Others have found that a separation in overall turfgrass color and quality between irrigation treatments was evident, with irrigation applications (72% evapotranspiration, ET0, replacement) occurring throughout the summer [13]. During the fall of 2013, the canopy greenness readings were highest in the rough areas due to the higher mowing height and higher amounts of precipitation in Sep–Oct (Table 5).
In 2014, N fertilizer was significant only 7 of the 24 sampling dates (Table 6) for canopy greenness. On the green, URE produced consistently greener turf during the spring (May) compared to MIL and POL due to the faster release rate of N for URE. All three fertilizers (MIL, POL, and URE) produced healthy green turf during the summer. URE also produced a greener turf in late fall due to its readily available N. On the two rough sites, MIL in early spring produced a greener turfgrass stand than URE. Turfgrass site location was significant for every sampling date in 2014, where the dry rough had the highest canopy greenness compared to the green due to greater amounts of precipitation for the 2014 growing season (Table 6). During the beginning and end of the growing season (May and Oct), the dry rough had significantly higher canopy greenness 57% of the time (4 of 7 dates) compared to the wet rough. There was an area-by-fertilizer-treatment interaction for 7 of the 24 sampling dates in 2014 (Table 6) on the green and predominantly on the dry rough. URE produced a significantly greener canopy on the green in the late spring and in the fall, whereas the slow-release N fertilizers (MIL and POL) produced a significantly greener canopy in the spring and summer on the dry rough.
N fertilizer had a significant effect on turfgrass quality, where monthly applications of MIL, POL, and URE greatly improved overall turfgrass quality in Jun, Jul, and Oct of 2013 (Table 7). Turfgrass area was significant four times in the summer (Jun–Aug) where turfgrass quality was lower on the green and on the dry rough, whereas in late fall (Oct), turfgrass quality was highest on the two rough sites (two of the three sampling dates). An interaction between area and fertilizer treatment occurred six times during 2013, where URE produced a higher turfgrass quality on the green in the summer and the fall (Table 7). This was due to regular irrigation on the green in addition to precipitation during the growing season.
In 2014, N fertilizer was significant on 8 out of 24 sampling dates (Table 8) for turfgrass quality. URE applications in spring resulted in higher turfgrass quality compared to the other treatments on the green. URE applications on the green improved turfgrass quality in the spring, where mild air temperatures and precipitation aided fertilizer breakdown and reduced the potential for fertilizer burn (Figure 1). In addition, the green received regular irrigation during the growing season when needed to supplement precipitation. It has been shown that a rapid increase in visual turfgrass quality of URE-treated turf occurs immediately after the June fertilization due to the quick release of available N [13]. Site location was significant on 18 of the 24 sampling dates. In the spring and early summer, the dry rough had higher turfgrass quality, whereas in the fall, the wet rough had higher turfgrass quality. An interaction between site and N fertilizer treatment occurred on 10 out of 24 sampling dates, where N fertility treatments on the irrigated green, especially with URE, greatly increased overall turfgrass quality in the spring (Table 8).

4. Conclusions

Soil temperature and moisture are the primary drivers of both soil CO2 and soil N2O flux (Figure 2). Across both years of the study, all three GHGs showed significant differences by site location (Table 4). CO2 fluxed the highest on the green, while N2O and CH4 fluxed the highest on the wet rough (Table 4). This site had the highest soil moisture content across the study (Table 1) and shows that soil moisture is an important driver of soil GHG flux, as the green and wet rough sites were significantly wetter than the dry rough (Table 1). On the wet rough, the POL fluxed the highest amount of soil CO2, while POL and MIL fluxed the largest amount of soil N2O (2013). The differences between N fertilizer treatments for soil N2O flux were only observed in the season with more soil moisture variability (Table 2, 2013). These results indicate that there is a hierarchy that must occur for denitrification to result in significant soil N2O flux. First, the soil temperature and moisture content must be right for denitrification to occur, and then there needs to be enough NO3 in the soil. If those conditions are met, then the availability of organic carbon becomes a limiting factor for soil N2O flux. These results suggest that cultural practices that manage soil temperature and soil moisture when using fast-release N fertilizers will reduce the flux of CO2, CH4, and N2O from the soil (Table 4).
All N fertilizer treatments, slow- and fast-release sources, increased canopy greenness and turfgrass quality on all golf course site locations. Slow-release fertilizers MIL and POL increased canopy greenness in both roughs, especially during the spring. On the green, URE applications produced greater canopy greenness in the spring and fall. All three N fertilizers (MIL, POL, and URE) improved canopy greenness during the summer. In 2013, when precipitation was limited, irrigation was required to maintain acceptable canopy greenness and turfgrass quality on the green. Extra care by the superintendent to water in the URE following application was instrumental in reducing fertilizer burn on the green. Milder climatic conditions and precipitation in the spring and summer (2014) prevented turf burn on the green following fertilizer applications.
Turfgrass managers need to assess soil moisture levels prior to fertilizing with N to decrease the potential for GHG emissions while maintaining turfgrass quality and greenness. High soil temperature in combination with high soil moisture results in high fluxes of CO2 and N2O; thus, methods of reducing soil temperature that do not increase the soil moisture are recommended (shade and fans). When the soil has a high moisture content (texture dependent), denitrification rates are accelerated, and N is lost to the atmosphere.

5. Future Directions

Because soil moisture demonstrated such a critical role in predicting GHG emissions from turfgrass site locations, traditional irrigation practices employed by golf course superintendents need to be evaluated to determine the effect on GHGs [55]. This would include environmentally friendly irrigation regimes that decrease overall water use while decreasing GHG emissions. Putting greens should be evaluated first, as they require the most irrigation to maintain turfgrass quality. Another factor that should be considered in GHG flux from managed turfgrass systems is shade provided by tree canopies. Shade would help to decrease soil temperatures without increasing soil moisture as opposed to some irrigation practices that would decrease soil temperature but also increase soil moisture.

Author Contributions

Conceptualization, K.E.C. and K.S.W.; methodology, K.E.C. and K.S.W.; resources, K.E.C. and K.S.W.; writing—original draft preparation, K.E.C. and K.S.W.; writing—review and editing, K.E.C. and K.S.W.; visualization, K.E.C. and K.S.W.; supervision, K.E.C. and K.S.W.; project administration, K.E.C. and K.S.W.; funding acquisition, K.E.C. and K.S.W. All authors have read and agreed to the published version of the manuscript.

Funding

This research was funded by the United States Golf Association (USGA), grant number 2013-22-483 and the Minnesota Turf and Grounds Association (MTGF).

Institutional Review Board Statement

Not applicable.

Informed Consent Statement

Not applicable.

Data Availability Statement

Not applicable.

Acknowledgments

This work could not have been completed without the hours of work by many undergraduate research students: Amber Koep, Wade Wallace, Andrea Ramponi, Gylatso Gurung, DeAndra Navratil, Constantin Adelakoun, Missy Carlson, Nathan Harthoom, and Mike Laurich.

Conflicts of Interest

The authors declare no conflict of interest.

References

  1. DeFries, R.S.; Ellis, E.C.; Chapin, I.I.I.F.S.; Matson, P.A.; Turner, B.L.; Agrawal, A.; Crutzen, P.J.; Field, C.; Gleick, P.; Kareiva, P.M.; et al. Planetary opportunities: A social contract for global change science to contribute to a sustainable future. BioScience 2012, 62, 603–606. [Google Scholar] [CrossRef] [Green Version]
  2. The Paris Agreement|UNFCCC. Available online: https://unfccc.int/process-and-meetings/the-paris-agreement/the-paris-agreement (accessed on 12 October 2022).
  3. U.S. Environmental Protection Agency. Inventory of U.S. Greenhouse Gas Emissions and Sinks: 1990–2009. 2016. Available online: https://www.epa.gov/ghgemissions/inventory-us-greenhouse-gas-emissions-and-sinks-1990-2009 (accessed on 23 January 2023).
  4. Bernstein, L.; Bosch, P.; Canziani, O.; Chen, Z.; Christ, R.; Riahi, K. IPCC, 2007: Climate Change 2007: Synthesis Report; IPCC: Geneva, Switzerland, 2008. [Google Scholar]
  5. Kessavalou, A.; Mosier, A.R.; Doran, J.W.; Drijber, R.A.; Lyon, D.J.; Heinemeyer, O. Fluxes of Carbon Dioxide, Nitrous Oxide, and Methane in Grass Sod and Winter Wheat-Fallow Tillage Management; Wiley Online Library: New York, NY, USA, 1998. [Google Scholar]
  6. Li, C.; Frolking, S.; Butterbach-Bahl, K. Carbon sequestration in arable soils is likely to increase nitrous oxide emissions, offsetting reductions in climate radiative forcing. Clim. Chang. 2005, 72, 321–338. [Google Scholar] [CrossRef]
  7. Bartlett, M.D.; James, I.T. A model of greenhouse gas emissions from the management of turf on two golf courses. Sci. Total Environ. 2011, 409, 1357–1367. [Google Scholar] [CrossRef] [PubMed]
  8. Ryden, J.C. N2O exchange between a grassland soil and the atmosphere. Nature 1981, 292, 235–237. [Google Scholar] [CrossRef]
  9. Maggiotto, S.R.; Webb, J.A.; Wagner-Riddle, C.; Thurtell, G.W. Nitrous and Nitrogen Oxide Emissions from Turfgrass Receiving Different Forms of Nitrogen Fertilizer; Wiley Online Library: New York, NY, USA, 2000. [Google Scholar]
  10. Kaye, J.P.; Burke, I.C.; Mosier, A.R.; Pablo Guerschman, J. Methane and nitrous oxide fluxes from urban soils to the atmosphere. Ecol. Appl. 2004, 14, 975–981. [Google Scholar] [CrossRef] [Green Version]
  11. Bremer, D.J. Nitrous oxide fluxes in turfgrass: Effects of nitrogen fertilization rates and types. J. Environ. Qual. 2006, 35, 1678–1685. [Google Scholar] [CrossRef] [Green Version]
  12. Lewis, J.D.; Bremer, D.J. Different nitrogen management regimes affect nitrous oxide emissions among one cool-season and two warm-season turfgrasses. Int. Turf. Soc. Res. J. 2013, 12, 31–38. [Google Scholar]
  13. Braun, R.C.; Bremer, D.J. Nitrous oxide emissions from turfgrass receiving different irrigation amounts and nitrogen fertilizer forms. Crop Sci. 2018, 58, 1762–1775. [Google Scholar] [CrossRef]
  14. Mosier, A.; Delgado, J.; Keller, M. Methane and nitrous oxide fluxes in an acid Oxisol in western Puerto Rico: Effects of tillage, liming and fertilization. Soil Biol. Biochem. 1998, 30, 2087–2098. [Google Scholar] [CrossRef]
  15. West, T.O.; Marland, G. A synthesis of carbon sequestration, carbon emissions, and net carbon flux in agriculture: Comparing tillage practices in the United States. Agric. Ecosyst. Environ. 2002, 91, 217–232. [Google Scholar] [CrossRef]
  16. Selhorst, A.; Lal, R. Net Carbon Sequestration Potential and Emissions in Home Lawn Turfgrasses of the United States. Environ. Manag. 2013, 51, 198–208. [Google Scholar] [CrossRef]
  17. Zhang, X.; Zhang, J.; Zheng, C.; Guan, D.; Li, S.; Xie, F.; Chen, J.; Hang, X.; Jiang, Y.; Deng, A.; et al. Significant residual effects of wheat fertilization on greenhouse gas emissions in succeeding soybean growing season. Soil Tillage Res. 2017, 169, 7–15. [Google Scholar] [CrossRef]
  18. Qian, Y.; Follett, R.F. Assessing soil carbon sequestration in turfgrass systems using long-term soil testing data. Agron. J. 2002, 94, 930–935. [Google Scholar] [CrossRef]
  19. Gillette, K.L.; Qian, Y.; Follett, R.F.; Del Grosso, S. Nitrous Oxide Emissions from a Golf Course Fairway and Rough after Application of Different Nitrogen Fertilizers. J. Environ. Qual. 2016, 45, 1788–1795. [Google Scholar] [CrossRef] [PubMed]
  20. Delgado, J.A.; Mosier, A.R. Mitigation Alternatives to Decrease Nitrous Oxides Emissions and Urea-Nitrogen Loss and Their Effect on Methane Flux; Wiley Online Library: New York, NY, USA, 1996. [Google Scholar]
  21. Shoji, S.; Delgado, J.; Mosier, A.; Miura, Y. Use OF Controlled Release Fertilizers and Nitrification Inhibitors to Increase Nitrogen Use Efficiency and to Conserve Air Andwater Quality. Commun. Soil Sci. Plant Anal. 2001, 32, 1051–1070. [Google Scholar] [CrossRef]
  22. Merchán Paniagua, S. Use of slow-release N fertilizer to control nitrogen losses due to spatial and climatic differences in soil moisture conditions and drainage in claypan soils. Ph.D. Thesis, University of Missouri–Columbia, Columbia, MO, USA, 2006. [Google Scholar]
  23. Halvorson, A.D.; Del Grosso, S.J.; Reule, C.A. Nitrogen, tillage, and crop rotation effects on nitrous oxide emissions from irrigated cropping systems. J. Environ. Qual. 2008, 37, 1337–1344. [Google Scholar] [CrossRef] [PubMed] [Green Version]
  24. Hyatt, C.R.; Venterea, R.T.; Rosen, C.J.; McNearney, M.; Wilson, M.L.; Dolan, M.S. Polymer-coated urea maintains potato yields and reduces nitrous oxide emissions in a Minnesota loamy sand. Soil Sci. Soc. Am. J. 2010, 74, 419–428. [Google Scholar] [CrossRef]
  25. Watts, D.B.; Runion, G.B.; Nannenga, K.W.S.; Torbert, H.A. Impacts of enhanced-efficiency nitrogen fertilizers on greenhouse gas emissions in a coastal plain soil under cotton. J. Environ. Qual. 2015, 44, 1699–1710. [Google Scholar] [CrossRef]
  26. Watts, D.B.; Runion, G.B.; Nannenga, K.W.S.; Torbert, H.A. Enhanced-efficiency fertilizer effects on cotton yield and quality in the coastal plains. Agron. J. 2014, 106, 745–752. [Google Scholar] [CrossRef] [Green Version]
  27. Smith, K.; Watts, D.; Way, T.; Torbert, H.; Prior, S. Impact of tillage and fertilizer application method on gas emissions in a corn cropping system. Pedosphere 2012, 22, 604–615. [Google Scholar] [CrossRef]
  28. Braun, R.C.; Bremer, D.J. Nitrous oxide emissions in turfgrass systems: A review. Agron. J. 2018, 110, 2222–2232. [Google Scholar] [CrossRef]
  29. GRACEnet Sampling Protocols: USDA ARS. Available online: https://www.ars.usda.gov/natural-resources-and-sustainable-agricultural-systems/soil-and-air/docs/gracenet-sampling-protocols/ (accessed on 12 October 2022).
  30. Mosier, A.R. Exchange of gaseous nitrogen compounds between agricultural systems and the atmosphere. Plant Soil 2001, 228, 17–27. [Google Scholar] [CrossRef]
  31. Morris, K.N.; Shearman, R.C. NTEP Turfgrass Evaluation Guidelines; NTEP Turfgrass Evaluation Workshop: Beltsville, MD, USA, 1998; pp. 1–5. [Google Scholar]
  32. Clark, V. SAS/STAT 9.1: User’s Guide; SAS Pub: Cary, NC, USA, 2004; p. 7. [Google Scholar]
  33. Clark, F.E.; Kemper, W.D. Microbial activity in relation to soil water and soil aeration. Irrig. Agric. Lands 1967, 11, 472–480. [Google Scholar]
  34. Nguyen, C.; Guckert, A. Short-term utilisation of 14C-[U]glucose by soil microorganisms in relation to carbon availability. Soil Biol. Biochem. 2001, 33, 53–60. [Google Scholar] [CrossRef]
  35. Pan, X.; Richardson, M.D.; Deng, S.; Kremer, R.J.; English, J.T.; Mihail, J.D.; Sams, C.E.; Scharf, P.C.; Veum, K.S.; Xiong, X. Effect of Organic Amendment and Cultural Practice on Large Patch Occurrence and Soil Microbial Community. Crop. Sci. 2017, 57, 2263–2272. [Google Scholar] [CrossRef] [Green Version]
  36. Lambers, H. Growth, respiration, exudation and symbiotic associations: The fate of carbon translocated to the roots. Root Dev. Funct. 1987, 30, 125–145. [Google Scholar]
  37. Tiquia, S.M.; Lloyd, J.; Herms, D.A.; Hoitink, H.A.; Michel, F.C., Jr. Effects of mulching and fertilization on soil nutrients, microbial activity and rhizosphere bacterial community structure determined by analysis of TRFLPs of PCR-amplified 16S rRNA genes. Appl. Soil Ecol. 2002, 21, 31–48. [Google Scholar] [CrossRef]
  38. Kaye, J.P.; Hart, S.C. Competition for nitrogen between plants and soil microorganisms. Trends Ecol. Evol. 1997, 12, 139–143. [Google Scholar] [CrossRef] [PubMed]
  39. Fierer, N.; Strickland, M.S.; Liptzin, D.; Bradford, M.A.; Cleveland, C.C. Global patterns in belowground communities. Ecol. Lett. 2009, 12, 1238–1249. [Google Scholar] [CrossRef]
  40. Serna-Chavez, H.M.; Fierer, N.; Van Bodegom, P.M. Global drivers and patterns of microbial abundance in soil. Glob. Ecol. Biogeogr. 2013, 22, 1162–1172. [Google Scholar] [CrossRef]
  41. Baligar, V.; Fageria, N.; Elrashidi, M. Toxicity and Nutrient Constraints on Root Growth. Hortscience 1998, 33, 960–965. [Google Scholar] [CrossRef] [Green Version]
  42. Vourlitis, G.; Oechel, W.; Hastings, S.; Jenkins, M. The effect of soil moisture and thaw depth on CH4 flux from wet coastal tundra ecosystems on the north slope of Alaska. Chemosphere 1993, 26, 329–337. [Google Scholar] [CrossRef]
  43. Bijoor, N.S.; Czimczik, C.; Pataki, D.E.; Billings, S. Effects of temperature and fertilization on nitrogen cycling and community composition of an urban lawn. Glob. Chang. Biol. 2008, 14, 2119–2131. [Google Scholar] [CrossRef] [Green Version]
  44. Lewis, J.D. Carbon, Nitrogen, and Water Fluxes from Turfgrass Ecosystems; Kansas State University: Manhattan, KS, USA, 2010. [Google Scholar]
  45. Tiedje, J.M.; Sexstone, A.J.; Myrold, D.D.; Robinson, J.A. Denitrification: Ecological niches, competition and survival. Antonie Van Leeuwenhoek 1983, 48, 569–583. [Google Scholar] [CrossRef]
  46. Myrold, D.D.; Tiedje, J.M. Diffusional Constraints on Denitrification in Soil. Soil Sci. Soc. Am. J. 1985, 49, 651–657. [Google Scholar] [CrossRef]
  47. Myrold, D.D.; Tiedje, J.M. Establishment of denitrification capacity in soil: Effects of carbon, nitrate and moisture. Soil Biol. Biochem. 1985, 17, 819–822. [Google Scholar] [CrossRef]
  48. Mancino, C.F.; Torello, W.A.; Wehner, D.J. Denitrification Losses from Kentucky Bluegrass Sod. Agron. J. 1988, 80, 148–153. [Google Scholar] [CrossRef] [Green Version]
  49. Firestone, M.K.; Davidson, E.A. Microbiological basis of NO and N2O production and consumption in soil. In Exchange of Trace Gases between Terrestrial Ecosystems and the Atmosphere; Wiley: New York, NY, USA, 1989; Volume 47, pp. 7–21. [Google Scholar]
  50. Denmead, O.T. Chamber Systems for Measuring Nitrous Oxide Emission from Soils in the Field. Soil Sci. Soc. Am. J. 1979, 43, 89–95. [Google Scholar] [CrossRef]
  51. Chen, L.; Xie, Z.; Zhuang, X.; Chen, X.; Jing, X. Controlled release of urea encapsulated by starch-g-poly(l-lactide). Carbohydr. Polym. 2008, 72, 342–348. [Google Scholar] [CrossRef]
  52. Firestone, M.K.; Firestone, R.B.; Tiedje, J.M. Nitrous Oxide from Soil Denitrification: Factors Controlling Its Biological Production. Science 1980, 208, 749–751. [Google Scholar] [CrossRef]
  53. Bergstrom, D.W.; Tenuta, M.; Beauchamp, E.G. Nitrous oxide production and flux from soil under sod following application of different nitrogen fertilizers. Commun. Soil Sci. Plant Anal. 2001, 32, 553–570. [Google Scholar] [CrossRef]
  54. LeMonte, J.J.; Jolley, V.D.; Summerhays, J.S.; Terry, R.E.; Hopkins, B.G. Polymer coated urea in turfgrass maintains vigor and mitigates nitrogen’s environmental impacts. PLoS ONE 2016, 11, e0146761. [Google Scholar] [CrossRef] [PubMed] [Green Version]
  55. Walker, K.S.; Chapman, K.E. Water Conservation Practices on the Reduction of Greenhouse Gas Emissions on Creeping Bentgrass Putting Greens. In Proceedings of the ASA, CSSA and SSSA International Annual, San Antonio, TX, USA, 23 October 2017. [Google Scholar]
Figure 1. 2013 Carbon dioxide (CO2) and Nitrous oxide (N2O) flux using soil temperature (°C) and soil moisture (%) as predictors of CO2 and N2O flux. The black dots represent the raw data and the grid represents the model relating soil temperature and moisture as predictors of CO2 and N2O flux using the parameter estimates from a regression analysis. Parameter estimates for CO2 were significant at the 0.0001 level. Parameter estimate for the 2013 CO2 flux Intercept is −510, Slope of Temperature is 29, Slope of Moisture is 15. Parameter estimate for the 2014 CO2 flux Intercept is −190, Slope of Temperature is 35, Slope of Moisture is 7.2. Parameter estimate for the 2013 N2O flux Intercept is −0.063, Slope of Temperature is 0.0022, Slope of Moisture is 0.0022. Parameter estimate for 2014 N2O flux is the Intercept is 0.50, Slope of Temperature is 0.0013, Slope of Moisture is 0.00013.
Grasses 02 00008 g001
Figure 2. 2013 and 2014 Carbon dioxide (CO2) flux for each site location by fertilizer treatment (A) Green (B) Wet Rough (C) Dry Rough (1) 2013 (2) 2014. MIL = Milorganite; POL = Polymer encapsulated urea; URE = Urea; UNT = unfertilized control. Notes: a POL > UNT; b UNT > URE; c POL > MIL = URE = UNT; d MIL > POL = UNT; e MIL > POL = URE; f POL > URE; g URE > POL; h MIL = POL = URE > UNT; i URE > UNT; j UNT = URE > POL = MIL; k MIL = URE > POL; l MIL = POL = UNT>URE; m UNT > POL = MIL; n POL = UNT > MIL; o MIL > URE; p POL > UNT = URE; q UNT > POL; letters do not represent LSD (least significant difference) notations. * Means are significantly different at the 0.05 according to the LSD.
Grasses 02 00008 g002
Figure 3. 2013 and 2014 Nitrous oxide (N2O) flux for each site location by Fertilizer treatment. (A) Green (B) Wet Rough (C) Dry Rough (1) 2013 (2) 2014. MIL=Milorganite; POL = Polymer encapsulated urea; URE = Urea; UNT = unfertilized control. Notes: a POL > UNT; b UNT > URE; c POL > MIL = URE = UNT; d MIL > POL = UNT; e MIL > POL = URE; f POL > URE; g URE > POL; h MIL = POL = URE > UNT; i URE > UNT; j UNT = URE > POL = MIL; k MIL = URE > POL; l MIL = POL = UNT > URE; m UNT > POL = MIL; n POL = UNT > MIL; o MIL > URE; p POL > UNT = URE; q UNT > POL; r MIL > UNT; s POL > MIL = URE > UNT; t POL > MIL > UNT; u URE > UNT = POL; v MIL > URE = UNT; w MIL > URE = POL = UNT; x MIL > POL; y URE > UNT = MIL; z POL > UNT = MIL; letters do not represent LSD (least significant difference) notations. * Means are significantly different at the 0.05 according to the LSD.
Grasses 02 00008 g003
Table 1. Average Soil Moisture Content (%) by Site Location.
Year
2013 2014 Overall
SitedfMean (%)Median (%)dfMean (%)Median (%)dfMean (%)Median (%)
Green 16.3 b16.6 17.5 a17.1 16.9 b16.9
Rough Dry 11.1 c8.3 17.8 a18.2 14.8 c15.7
Rough Wet 17.4 a16.9 18.2 a17.3 17.8 a17.2
ANOVA
Source of Variation
Site2*** 2 NS 2***
Note: within columns, means followed by the same letter are not significantly different according to LSD (0.05). Significantly more rainfall occurred in 2014. *** Significant at the 0.001 probability level. NS, nonsignificant.
Table 2. 2013 Mean and Median Soil CO2, N2O, and CH4 flux by Site, Fertilizer, and Site*Fertilizer.
CO2 N2O CH4
Site Location FertilizerMeanMedianMeanMedianMeanMedian
g CO2-C m−2 h−1µg N2O-N m−2 h−1µg CH4-C m−2 h−1
GreenAll0.39 a0.419.0 b4.76−0.26 a0.09
Wet RoughAll0.38 a0.4150.6 a39.6−8.09 a−2.38
Dry RoughAll0.17 b0.1719.2 b6.62−3.84 a−0.40
AllMIL0.31 a0.3127.1 a9.95−3.88 a−1.61
AllPOL0.33 a0.3532.5 a12.83.82 a2.50
AllURE0.30 ab0.2715.5 a7.89−7.90 a−1.69
AllUNT0.26 b0.3029.9 a8.39−8.30 a−3.09
GreenMIL0.39 ab0.393.97 d5.10−3.51 ab−3.34
POL0.37 bc0.3813.2 cd5.2921.8 a13.4
URE0.38 abc0.4417.4 cd4.35−12.0 b−0.74
UNT0.42 ab0.451.39 d3.26−7.42 b−3.78
Wet RoughMIL0.39 ab0.4361.1 ab43.5−2.05 ab−1.61
POL0.48 a0.5484.1 a64.5−4.38 ab0
URE0.37 bc0.4041.8 cd39.1−10.3 b−6.00
UNT0.30 c0.351.39 d3.26−15.6 b−2.80
Dry RoughMIL0.19 d0.1716.4 cd7.68−6.08 ab−0.42
POL0.20 d0.180.440 d6.96−6.01 ab−0.40
URE0.19 d0.1930.5 bcd5.77−1.46 b−0.74
UNT0.13 e0.1429.7 cd6.19−1.83 ab0.85
Source of Variationdf df df
Site (S)3* 3 *** 3 NS
Fertilizer (F)2*** 2 NS 2 NS
S*F6* 6**6 NS
MIL = milorganite; POL = polymer-encapsulated urea; URE = urea; UNT = unfertilized control. Note: within columns, means followed by the same letter are not significantly different according to LSD (0.05). * Significant at the 0.05 probability level; ** significant at the 0.01 probability level; *** significant at the 0.001 probability level. NS, nonsignificant. S*F is the interaction between Site (S) and Fertilizer (F).
Table 3. 2014 Mean and Median Soil CO2, N2O, and CH4 flux by Site, Fertilizer, and Site*Fertilizer.
CO2 N2O CH4
Site Location FertilizerMeanMedianMeanMedianMeanMedian
g CO2-C m−2 h−1µg N2O-N m−2 h−1µg CH4-C m−2 h−1
GreenAll0.64 a0.73299 a310143 a141
Wet RoughAll0.50 b0.57299 a311145 a141
Dry RoughAll0.65 a0.77300 a310144 a141
AllMIL0.59 a0.69311 a302144 a141
AllPOL0.60 a0.72311 a300144 a141
AllURE0.59 a0.66310 a299144 a141
AllUNT0.58 a0.67310 a300144 a140
GreenMIL0.60 abc0.71189 a222109 a35.7
POL0.64 ab0.81163 a22099.5 a22.8
URE0.64 ab0.69158 a220113 a25.9
UNT0.68 a0.78179 a228118 a13.6
Wet RoughMIL0.51 cd0.60180 a226216 a40.0
POL0.54 bcd0.57184 a226213 a53.0
URE0.51 cd0.57176 a224202 a35.0
UNT0.45 d0.50164 a219195 a32.7
Dry RoughMIL0.69 a0.76194 a231173 a43.2
POL0.63 ab0.79182 a229124 a28.8
URE0.63 ab0.78179 a218195 a32.7
UNT0.64 ab0.76175 a217195 a32.7
Source of Variationdf df df
Site (S)2*** 2 NS 2 NS
Fertilizer (F)3 NS 3 NS 3 NS
S*F6 NS 6 NS 6 NS
MIL = milorganite; POL = polymer-encapsulated urea; URE = urea; UNT = unfertilized control. Note: within columns, means followed by the same letter are not significantly different according to LSD (0.05). *** significant at the 0.001 probability level. NS, nonsignificant. S*F is the interaction between Site (S) and Fertilizer (F).
Table 4. Mean and Median Soil CO2, CH4, and N2O flux across all years separated out by site.
CO2N2OCH4
g CO2-C m−2 h−1µg N2O-N m−2 h−1µg CH4-C m−2 h−1
Site LocationMeanMedianMeanMedianMeanMedian
Green0.11 a0.1099.3 b20.241.5 b9.8
Wet Rough0.09 b0.09120.0 a88.273.4 a10.5
Dry Rough0.09 b0.07109.7 ab50.950.5 ab13.5
Source of VariationDf
Site (S)2*** * *
Fertilizer (F)3 NS NS NS
S*F6* NS NS
MIL = milorganite; POL = polymer-encapsulated urea; URE = urea; UNT = unfertilized control. Note: within columns, means followed by the same letter are not significantly different according to LSD (0.05). * Significant at the 0.05 probability level; *** significant at the 0.001 probability level. NS, nonsignificant. S*F is the interaction between Site (S) and Fertilizer (F).
Table 5. The effect of various nitrogen (N) fertility programs and turfgrass site location on canopy greenness, 2013.
Canopy Greenness
2013
Site Location17 Jul24 Jul31 Jul7 Aug14 Aug 21 Aug27 Aug4 Sep13 Sep19 Sep26 Sep10 Oct17 Oct26 Oct
NDVI
Green0.80 b0.81 b0.79 b0.79 b0.77 b0.75 b0.80 b0.75 b0.800.820.75 b0.79 b0.72 b0.74 c
Dry Rough0.66 c0.70 c0.72 c0.76 b0.73 c0.69 c0.71 c0.75 b0.780.840.91 a0.81 a0.83 a0.80 b
Wet Rough0.85 a0.87 a0.87 a0.86 a0.81 a0.82 a0.85 a0.88 a0.810.840.90 a0.75 c0.73 b0.82 a
ANOVA
RepNSNSNSNSNSNSNSNSNSNSNSNSNSNS
Site (S)************************NSNS************
N Fertilizer (F)NSNSNSNSNSNSNSNSNSNSNSNSNSNS
S*FNSNSNSNSNSNSNSNSNSNSNSNSNSNS
Canopy greenness—the normalized difference vegetation index (NDVI) measurements can range from −1 to 1, with higher values indicating greater plant health. Means in the same column for each turfgrass site (green, dry rough, and wet rough) followed by the same lowercase letter are not significantly different according to Fisher’s protected LSD t test (p = 0.05). ***, and NS refer to significance at 0.001, and nonsignificant, respectively. S*F is the interaction between Site (S) and Fertilizer (F).
Table 6. The effect of various nitrogen (N) fertility programs by turfgrass site location on canopy greenness, 2014.
Canopy Greenness
2014
Site Location and Fertilizer Treatment15 May21 May28 May4 Jun12 Jun18 Jun25 Jun2 Jul9 Jul16 Jul23 Jul30 Jul6 Aug13 Aug20 Aug26 Aug1 Sep8 Sep18 Sep25 Sep2 Oct9 Oct17 Oct23 Oct
NDVI
Green0.78 B0.79 B0.83 C0.81 C0.78 B0.81 B0.82 B0.81 B0.78 B0.77 B0.76 B0.77 C0.80 B0.79 B0.81 B0.80 C0.71 B0.72 B0.74 B0.77 C0.81 C0.78 B0.76 B0.76 C
MIL0.78 b0.79 b0.84 b0.82 0.79 0.81 0.84 a0.82 0.78 0.79 a0.78 0.78 a0.80 0.80 0.82 0.80 0.72 0.720.740.77 0.81 0.820.75 b0.75
POL0.79 b0.79 b0.84 b0.80 0.77 0.81 0.83 a0.81 0.79 0.79 a0.77 0.79 a0.81 0.79 0.81 0.80 0.70 0.730.730.76 0.80 0.760.77 b0.76
URE0.83 a0.84 a0.87 a0.85 0.80 0.83 0.84 a0.83 0.78 0.77 b0.78 0.78 a0.81 0.81 0.84 0.83 0.74 0.730.750.79 0.82 0.810.79 a0.79
UNT0.73 c0.75 c0.79 c0.78 0.75 0.78 0.78 b0.77 0.77 0.75 c0.73 0.73 b0.77 0.76 0.80 0.80 0.71 0.720.730.77 0.79 0.750.72 c0.72
Dry Rough0.74 B0.82 A0.91 A0.93 A0.87 A0.86 A0.89 A0.90 A0.86 A0.85 A0.86 A0.91 A0.90 A0.89 A0.86 A0.91 A0.91 A0.82 A0.90 A0.93 A0.86 B0.85 A0.88 A0.82 B
MIL0.78 a0.810.92 a0.930.89 0.87 0.89 a0.900.87 0.87 a0.860.910.900.90 0.850.920.910.820.890.93 0.880.860.890.83
POL0.74 ab0.820.91 ab0.930.88 0.87 0.89 a0.900.86 0.85 ab0.860.920.900.89 0.860.910.900.830.890.94 0.850.840.870.82
URE0.73 ab0.820.90 bc0.930.86 0.85 0.88 b0.900.84 0.84 b0.860.900.900.89 0.860.910.910.810.890.93 0.850.850.880.81
UNT0.70 b0.820.89 c0.920.85 0.87 0.89 a0.900.86 0.86 ab0.860.900.900.88 0.860.900.910.810.910.92 0.850.860.870.83
Wet Rough0.80 A0.81 AB0.86 B0.87 B0.70 C0.71 C0.82 B0.80 B0.66 C0.68 C0.74 B0.81 B0.75 C0.77 B0.85 A0.89 B0.89 A0.81 A0.75 B0.84 B0.90 A0.87 A0.87 A0.91 A
MIL0.82 a0.840.860.890.680.740.850.810.600.740.800.84 a0.780.720.870.900.910.86 0.78 0.86 0.880.900.880.93
POL0.79 ab0.790.860.870.710.690.810.760.620.640.660.82 ab0.720.780.840.880.880.83 0.75 0.83 0.890.850.860.89
URE0.81 ab0.840.860.860.720.710.820.820.670.640.710.79 b0.730.760.850.880.880.76 0.75 0.82 0.920.840.860.91
UNT0.77 b0.770.860.860.680.720.820.800.740.730.790.80 b0.780.810.850.880.900.77 0.74 0.85 0.920.900.870.91
ANOVA
RepNSNSNSNSNSNSNSNSNSNSNSNSNSNSNSNSNSNSNSNSNSNSNSNS
Site (S)**********************************************************************
N Fertilizer (F)********NSNSNS***NSNS*NS***NSNSNSNSNSNSNSNSNSNS*NS
S*FNSNS***NSNSNS**NSNS*NS*NSNSNSNSNSNSNS***NSNS**
Canopy greenness—the normalized difference vegetation index (NDVI) measurements can range from −1 to 1, with higher values indicating greater plant health. Means in the same column for each turfgrass site (green, dry rough, and wet rough) followed by the same uppercase letter are not significantly different according to Fisher’s protected LSD t test (p = 0.05). Means in the same column for each fertilizer treatment (MIL, POL, URE, and UNT) by turfgrass site followed by the same lowercase letter are not significantly different according to Fisher’s protected LSD t test (p = 0.05). *, **, ***, and NS refer to significance at 0.05, 0.01, 0.001, and nonsignificant, respectively. S*F is the interaction between Site (S) and Fertilizer (F).
Table 7. The effect of various nitrogen (N) fertility programs by turfgrass site location on turfgrass quality, 2013.
Turfgrass Quality
2013
Site Location and Fertilizer Treatment5 Jun12 Jun26 Jun3 Jul10 Jul17 Jul24 Jul31 Jul7 Aug14 Aug21 Aug27 Aug4 Sep13 Sep19 Sep26 Sep10 Oct17 Oct26 Oct
Visual Rating (1–9)
Green6.9 B7.87.87.37.97.9 AB8.07.8 B6.6 B7.97.37.9 AB7.2 B8.37.17.3 A7.3 B7.3 B8.0
MIL7.08.3 a7.3 6.9 ab7.0 7.3 7.57.5 6.0 7.5 7.57.57.07.8 7.37.0 7.0 7.0 b8.4 a
POL7.08.5 a8.3 8.0 a8.5 8.5 8.58.0 7.5 8.5 7.08.07.38.8 7.37.0 7.0 7.0 b8.0 a
URE7.38.0 a8.5 8.8 a9.0 8.8 8.58.5 7.5 8.5 7.58.57.08.3 7.08.0 8.0 8.0 a8.8 a
UNT6.56.5 b7.3 5.5 b6.5 7.0 7.57.0 5.5 7.3 7.07.87.58.3 6.87.0 7.0 7.0 b7.0 b
Dry Rough7.4 A7.87.47.87.87.4 B7.97.6 B6.9 B7.67.37.5 B7.1 B7.87.47.9 A7.8 A7.8 A8.3
MIL7.58.0 a7.38.38.07.88.37.87.07.87.57.87.38.37.88.08.08.08.5
POL7.58.3 a7.37.37.36.87.57.16.87.57.57.67.37.67.58.07.87.88.3
URE7.57.8 a7.58.08.07.57.57.56.37.57.37.37.07.87.08.07.57.88.3
UNT7.37.0 b7.57.87.87.58.08.07.87.57.07.57.07.67.37.88.07.88.4
Wet Rough7.4 A7.77.87.68.08.3 A8.38.4 A8.1 A7.47.68.1 A8.0 A8.37.37.6 B7.9 A7.8 A8.4
MIL7.88.38.07.68.08.58.38.58.3 7.58.0 8.58.08.8 7.58.08.08.08.8
POL7.37.87.56.97.38.08.38.58.3 7.57.5 7.88.08.0 7.07.57.87.58.3
URE7.87.88.08.58.58.58.88.87.3 7.57.8 8.08.08.1 7.37.38.08.08.5
UNT7.07.07.87.38.38.08.08.08.5 7.37.3 8.38.08.1 7.57.87.87.88.3
ANOVA
RepNSNSNSNSNSNSNSNSNSNSNSNSNSNSNSNSNSNSNS
Site (S)*NSNSNSNS*NS******NSNSNS*NSNS*********NS
N Fertilizer (F)NS***NS**NSNSNSNSNSNSNSNSNSNSNSNSNS***
S*FNSNSNS***NSNSNS***NSNSNSNSNSNS******NS
Turfgrass quality is a visual rating of 1–9, where 1 = bare soil, 6 = minimally acceptable turf, and 9 = optimum uniformity, density, and greenness. Means in the same column for each turfgrass site (green, dry rough, and wet rough) followed by the same uppercase letter are not significantly different according to Fisher’s protected LSD t test (p = 0.05). Means in the same column for each fertilizer treatment (MIL, POL, URE, and UNT) by turfgrass site followed by the same lowercase letter are not significantly different according to Fisher’s protected LSD t test (p = 0.05). *, **, ***, and NS refer to significance at 0.05, 0.01, 0.001, and nonsignificant, respectively. S*F is the interaction between Site (S) and Fertilizer (F).
Table 8. The effect of various nitrogen (N) fertility programs by turfgrass site location on turfgrass quality, 2014.
Turfgrass Quality
2014
Site Location and Fertilizer Treatment15 May21 May28 May4 Jun12 Jun18 Jun25 Jun2 Jul9 Jul16 Jul23 Jul30 Jul6 Aug13 Aug20 Aug26 Aug1 Sep8 Sep18 Sep25 Sep2 Oct9 Oct17 Oct23 Oct
Visual Rating (1–9)
Green7.06.6 B6.9 C7.3 B7.2 C7.07.1 B7.5 B6.9 B6.9 7.2 C6.9 B6.9 B6.8 7.1 B7.1 B7.26.8 B6.6 B6.9 C6.9 B7.75.6 B7.0 B
MIL7.0 b6.9 b6.8 b7.3 b7.0 b7.3 7.37.8 a7.0 7.0 7.5 7.0 a7.0 7.07.0 7.0 7.4 a7.0 6.57.37.0 8.0 a5.87.0
POL6.9 b6.6 b7.0 b7.0 b7.0 b7.0 7.07.8 a7.0 7.0 7.3 7.0 a7.0 7.07.0 7.0 7.1 ab6.8 6.87.07.0 8.0 a6.07.0
URE8.0 a7.5 a8.0 a8.0 a8.0 a7.5 7.07.8 a7.0 7.0 7.5 7.0 a7.0 6.87.5 7.5 8.0 a7.0 6.56.87.0 8.0 a5.57.5
UNT6.0 c5.5 c6.0 c7.0 b6.8 b6.3 7.36.8 b6.5 6.5 6.5 6.5 b6.5 6.56.8 6.8 6.3 b6.3 6.56.86.5 6.8 b5.36.5
Dry Rough6.87.1 A8.0 A8.0 A8.0 A7.48.0 A8.0 A8.0 A7.0 8.0 A7.1 AB7.7 A7.0 8.0 A7.9 A7.37.9 A7.9 A7.7 B7.9 A7.86.9 A7.9 A
MIL7.3 a7.48.08.08.07.58.08.08.07.08.07.0 ab8.07.08.08.07.38.08.07.88.08.07.38.0
POL7.0 ab7.18.08.08.07.38.08.08.07.08.07.5 a7.57.08.07.87.58.08.07.87.87.86.87.8
URE7.0 ab7.18.08.08.08.08.08.08.07.08.07.3 ab8.07.08.07.87.57.88.37.88.07.86.87.8
UNT6.0 b6.68.08.08.07.08.08.08.07.08.06.8 b7.37.08.08.06.87.87.57.58.07.86.88.0
Wet Rough6.96.9 AB7.7 B7.9 A7.5 B7.17.5 B7.9 A6.8 B6.9 7.5 B7.3 A7.6 A7.1 7.9 A7.6 A7.47.8 A8.4 A8.0 A8.0 A7.87.2 A8.0 A
MIL7.0 ab7.17.87.87.87.37.88.07.07.08.0 ab7.3 ab8.07.38.08.07.88.08.38.08.08.07.58.0
POL7.0 ab6.87.88.07.37.07.58.07.06.87.3 ab7.0 b7.57.07.87.57.37.88.38.08.07.87.38.0
URE7.3 a7.37.87.87.57.07.38.06.56.87.0 b7.0 b7.37.07.87.57.57.58.58.08.07.87.38.0
UNT6.3 b6.67.58.07.57.07.57.87.07.07.8 ab7.8 a7.87.38.07.57.07.88.58.08.07.86.88.0
ANOVA
RepNSNSNSNSNSNSNSNSNSNSNSNSNSNSNSNSNSNSNSNSNSNSNSNS
Site (S)NS**********NS*********NS*******NS******NS************NS******
N Fertilizer (F)************NSNS*NSNSNSNSNSNSNSNS**NSNSNSNS**NSNS
S*FNSNS********NSNS****NS****NSNSNSNSNSNSNSNS**NS**
Turfgrass quality is a visual rating of 1–9, where 1 = bare soil, 6 = minimally acceptable turf, and 9 = optimum uniformity, density, and greenness. Means in the same column for each turfgrass site (green, dry rough, and wet rough) followed by the same uppercase letter are not significantly different according to Fisher’s protected LSD t test (p = 0.05). Means in the same column for each fertilizer treatment (MIL, POL, URE, and UNT) by turfgrass site followed by the same lowercase letter are not significantly different according to Fisher’s protected LSD t test (p = 0.05). *, **, ***, and NS refer to significance at 0.05, 0.01, 0.001, and nonsignificant, respectively. S*F is the interaction between Site (S) and Fertilizer (F).
Disclaimer/Publisher’s Note: The statements, opinions and data contained in all publications are solely those of the individual author(s) and contributor(s) and not of MDPI and/or the editor(s). MDPI and/or the editor(s) disclaim responsibility for any injury to people or property resulting from any ideas, methods, instructions or products referred to in the content.

