Article

Population Dynamics of Digitaria sanguinalis and Effects on Soybean Crop under Different Glyphosate Application Timings

by
Fernando H. Oreja
*,
Mateo Stempels
and
Elba B. de la Fuente
Faculty of Agronomy, University of Buenos Aires, Buenos Aires C1417DSE, Argentina
*
Author to whom correspondence should be addressed.
Grasses 2023, 2(1), 12-22; https://doi.org/10.3390/grasses2010002
Submission received: 29 August 2022 / Revised: 14 November 2022 / Accepted: 11 January 2023 / Published: 3 February 2023

Abstract

:
Large crabgrass (Digitaria sanguinalis) is one of the most problematic weeds in summer crops in Argentina. Emergence throughout the season of several cohorts allows the weed to escape postemergence control. Demographic models are useful tools to understand and compare the effect of different agronomic management decisions on weed population growth, as well as to identify critical functional stages that affect population growth rates. The objectives of this work were (i) to study population dynamics of D. sanguinalis in soybean, (ii) to determine the effect of glyphosate application timing on weed demographic parameters and soybean yield losses, and (iii) to evaluate the effect of weed density on soybean yield loss. A field experiment was conducted in two locations, in a completely randomized design with three replicates. Treatments included a control without glyphosate and glyphosate applied at soybean stages V4 or R1. The demographic stages (initial seedbank, seedlings, and adult plants) and parameters (establishment, survival, and fecundity) were estimated. Reproductive organs were evaluated in each cohort, including raceme per plant, spikelets per raceme, and seeds per spikelet. Weed and crop biomass and yield crop were assessed at harvest. Three cohorts were identified, the first of which emerged in November and contributed 93% of the total seedlings and 71% of the total adults. Glyphosate applied at V4 reduced the survival rate of the first cohort, as well as the total shoot biomass and the fecundity rate, increasing the biomass and crop grain yield. Both application timings affected tillers per plant, racemes per tiller, and fertile spikelets per raceme. Glyphosate at R1 did not effectively reduce weed competition, but reduced seed production as application at V4. Yield losses estimated with the model of the rectangular hyperbola according to weed density showed a yield loss at low densities (I) of 18%, and a maximum yield loss (A) of 82%. To avoid yield losses, herbicide applications targeting the first cohort are more effective than later applications targeting subsequent cohorts. However, at both times glyphosate applications reduced the number of seeds entering the seedbank, and therefore the population growth rate.

1. Introduction

Large crabgrass (Digitaria sanguinalis (L) Scop., family Poaceae), is an annual grass that is native to Europe and distributed throughout all tropical and temperate regions around the world [1]. In Argentina, it was considered one of the 10 most important weeds when conventional tillage was the main system used [2]. Since the mid-1990s, the adoption of no-tillage systems increased steadily, occupying over 90% of the country’s agriculture area due to simplicity and the low cost of genetically modified glyphosate-resistant soybean production [3]. Despite the fact that glyphosate is 98–100% effective at controlling D. sanguinalis [4,5], large crabgrass has maintained or even increased its abundance and constancy in no-tillage systems [6,7,8,9]. In addition, a survey showed that it was the only non-herbicide resistant or glyphosate-tolerant species considered among the 10 most important weeds in Argentina [2]. However, recently, the first glyphosate resistant biotype was registered in the country [10].
Some characteristics of large crabgrass could explain the success of this weed; for example, its high seed production [11] and the preference of broadleaf seeds over grass seeds by seed predators in no-tillage systems [12]. Probably the most important characteristic is an emergence distributed throughout the season in three to five cohorts [13,14], which allows the weed to escape control. The use of residual herbicides, such as metolachlor, acetochlor, and pendimethalin, showed control levels of 100%, 91%, and 83%, respectively [15,16]. However, herbicide efficacy is highly dependent on soil characteristics and environmental conditions during post application [17,18], which are extremely variable from spring to mid-summer, during the emergence window of this species [13,14,19].
Identifying the critical period for weed control (CPWC) is important for integrated weed management (IWM) [20]. The CPWC is the period in the crop life cycle when weed control is necessary to prevent yield loss. In soybean, this period is approximately V2–V4, and sometimes R3, which is too short to consider the use of residual herbicides [21]. On the other hand, the presence of those weeds emerging after the CPWC could have no effect on the yield, but can contribute to renewal of the seedbank to maintain weed populations [22]. However, sequential postemergence applications to control every single cohort as it emerges is not recommended due to the increasing crop costs, higher risk of environmental pollution [23], and evolution of herbicide-resistant biotypes [24], as well as selection of a few species that become dominant and difficult to manage [25].
Demographic models are useful tools to understand and compare the effect of different agronomic management decisions on weed population growth rates [26], and to identify critical demographic processes that have more impact on population growth rates [27]. Therefore, to make successful weed management decisions, it is necessary to know not only the biology and ecology of the weeds, but also the effects of management practices on population dynamics and demographic processes such as emergence, survival, and fecundity [28,29]. The objectives of this work were (i) to study D. sanguinalis population dynamics in soybean, (ii) to determine the effect of glyphosate application timing on weed demographic parameters and soybean yield losses, and (iii) to evaluate the effect of weed density on soybean yield loss.

2. Materials and Methods

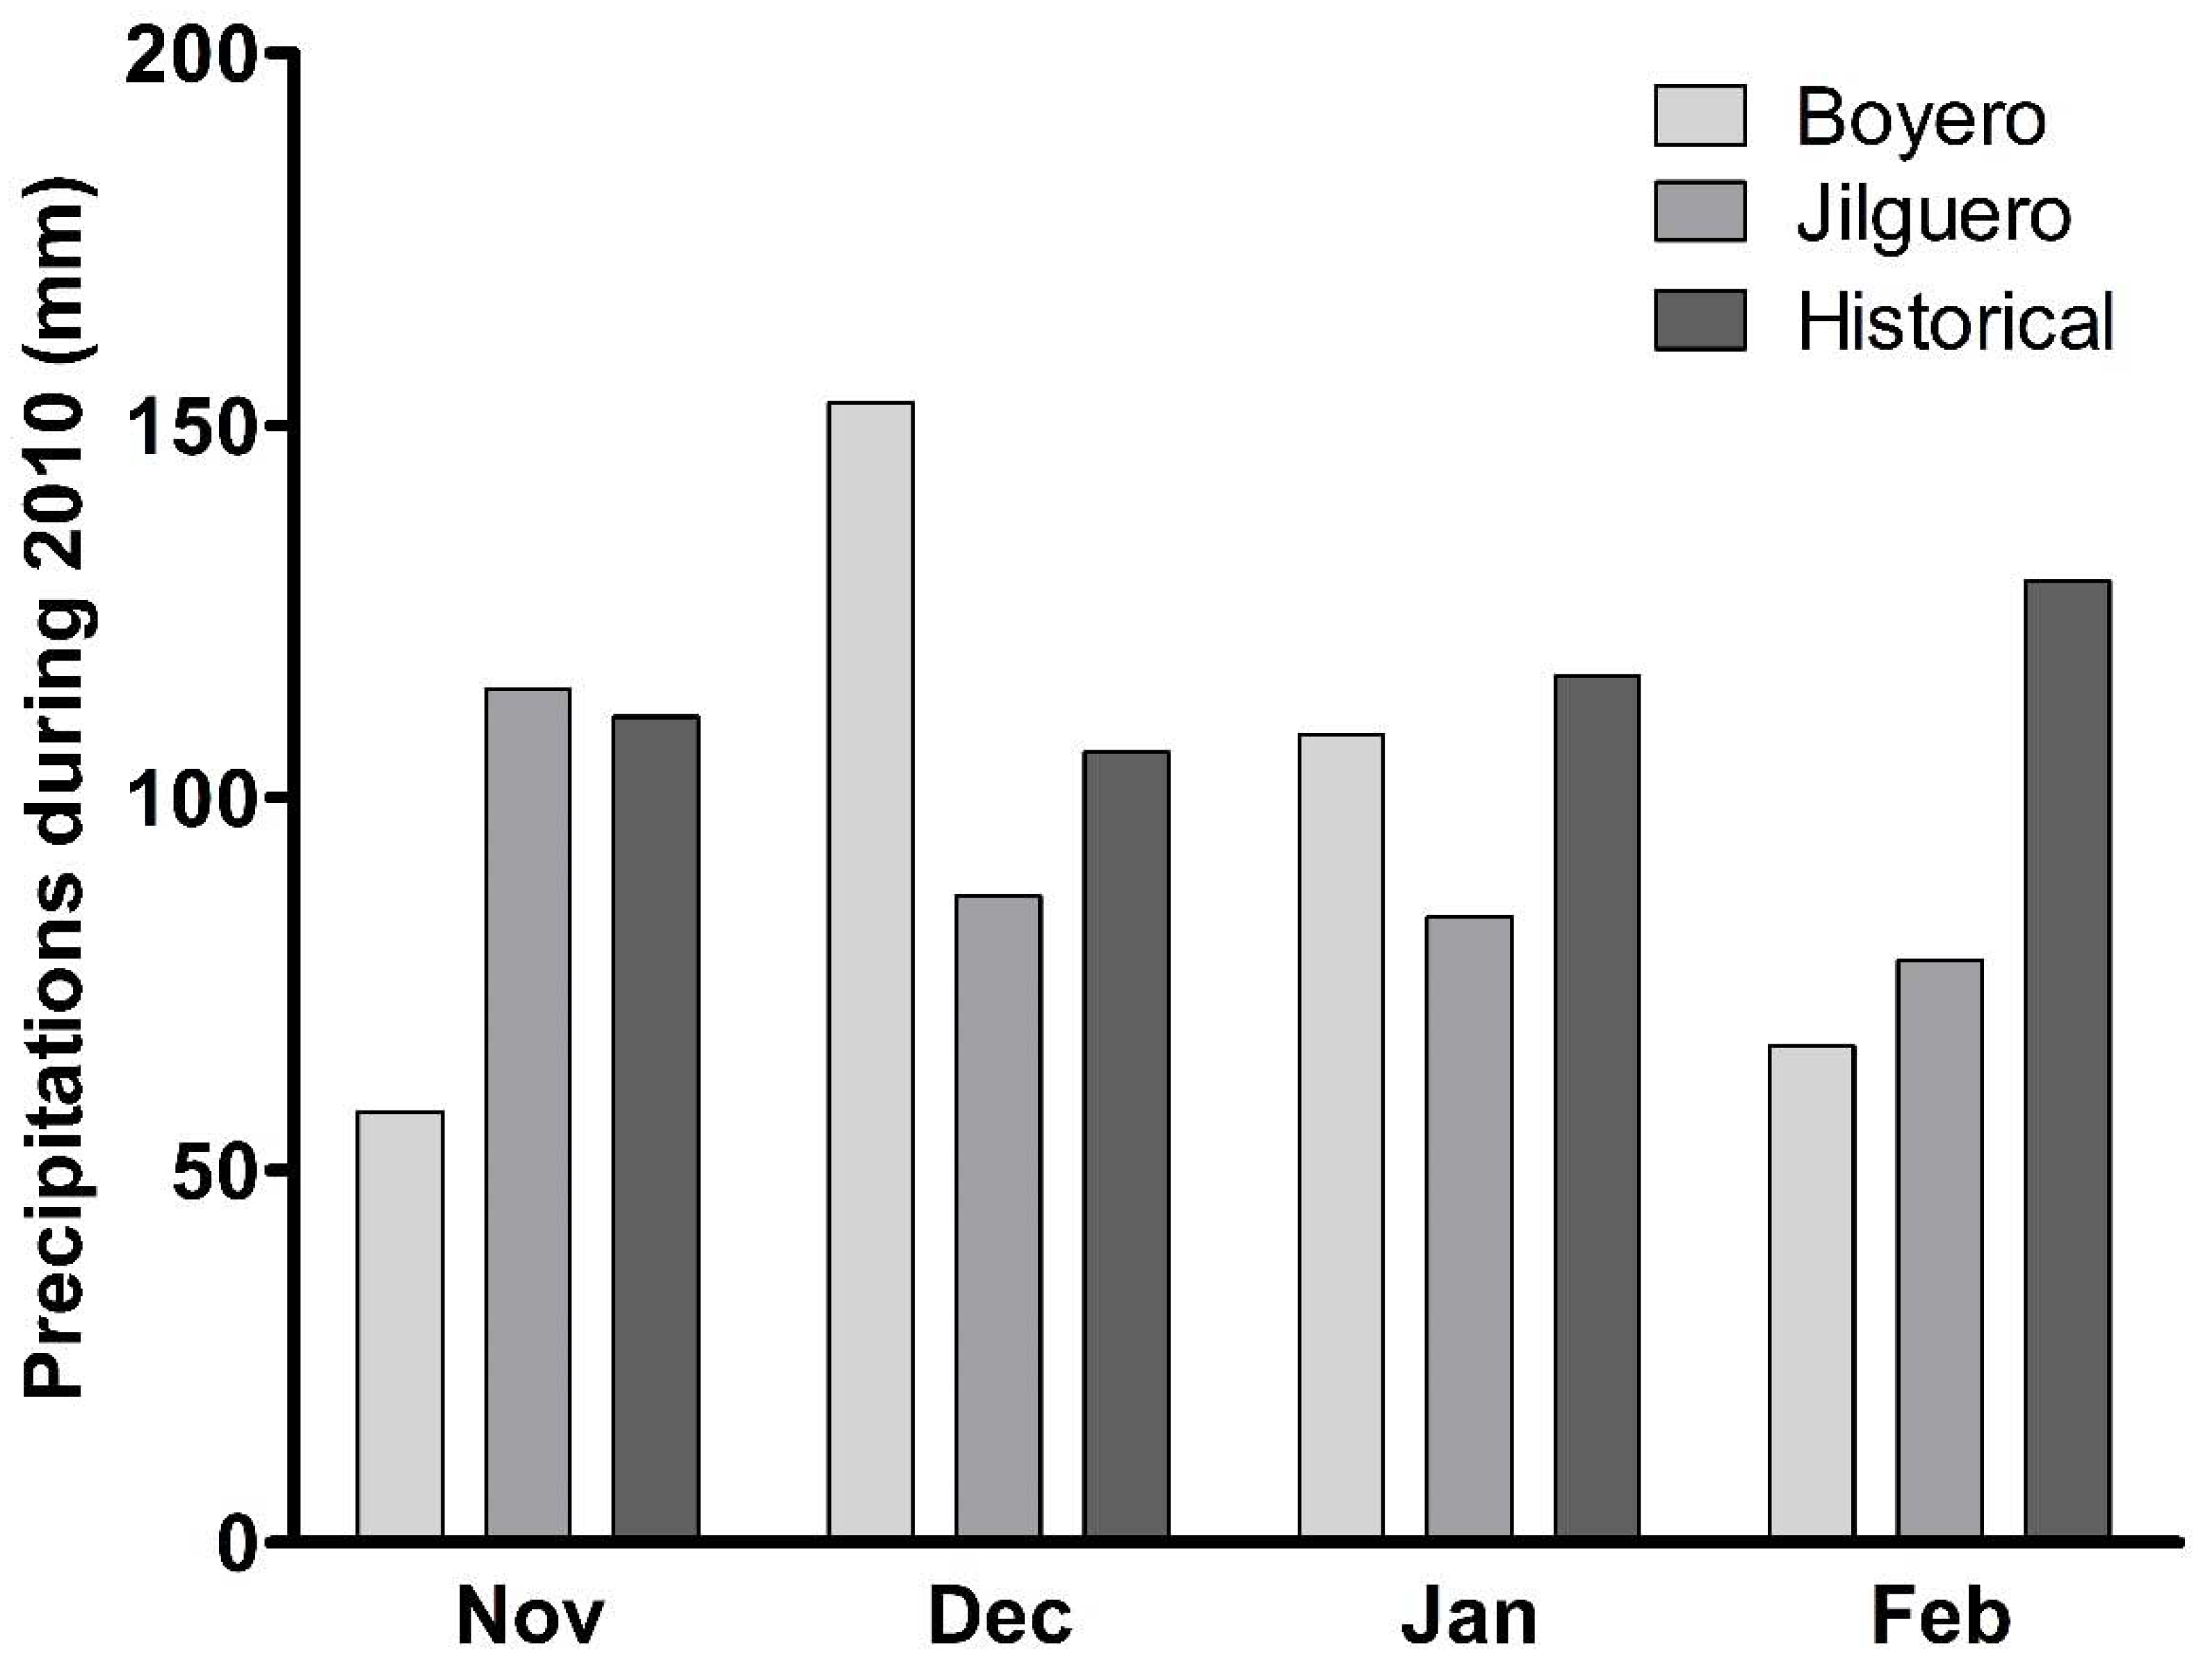
2.1. Experimental Site

The study was conducted in two commercial soybean fields (Boyero and Jilguero), in 2010, naturally and homogeneously infested with D. sanguinalis, under no-tillage systems, separated by 5 km in the district of Salto, province of Buenos Aires (34°25′ S, 60°15′ W), in the centre of the Rolling Pampas. This region has a temperate-humid climate with hot summers, an average annual rainfall of 950 mm, and a mean annual temperature of 17 °C [30]. The soil in both locations was Argiudol. Before the experiment, a 0–20 cm layer of the soil was analysed; Boyero had 2.82% organic matter, 6.24 pH, and 3.64 NO3 kg−1 (total by Kjeldahl), and Jilguero had 3.14% organic matter, 6.03 pH, and 5.54 NO3 kg−1 (total by Kjeldahl). Rainfall was registered monthly at each location (Figure 1).

2.2. Experiments

A completely randomized experimental design, with three replicates, was established in each location. Treatments were: (i) control without glyphosate, (ii) application of glyphosate at soybean stage V4, and (iii) application of glyphosate at soybean stage R1. The main plot had a size of 16 m × 16 m (256 m²).
Glyphosate-resistant (Roundup Ready®) soybean cultivar (“Don Mario 4800®”) (Don Mario Semillas, Chacabuco, Buenos Aires, Argentina) was planted at 42 plant m−2 and 52 cm interrow spacing. The sowing date was 3 November in Boyero and 25 November in Jilguero. Seeds were inoculated with Bradyrhizobium japonicum (Nitragin Optimize®, 3 mL kg−1 seed, 753 10th Street, Pilar, Buenos Aires, Argentina). Glyphosate was applied at 2000 g ae ha−1 in the entire field before sowing.
Three sub-samples of soil per treatment and replicate were taken randomly to evaluate the number of seeds in the seedbank. These samples were taken using an aluminium cylinder with a 5 cm diameter buried at a depth of 5 cm. The samples were aerated to remove excess moisture, then sieved, and D. sanguinalis seeds were identified and counted. Glyphosate was applied (1000 g ae ha−1) using ground-based spraying equipment with flat-fan nozzles (AIXR 11002 TeeJet®) calibrated to deliver 80 L ha−1 at 152 kPa. The application at V4 occurred 14 days after the first cohort was registered (33 and 29 days after crop emergence in Boyero and Jilguero, respectively), and the application at R1 occurred 14 days after the second cohort was registered (65 and 55 days after crop emergence in Boyero and Jilguero, respectively).

2.3. Measurements

Every 30 days, seedling density was evaluated in three quadrats (20 cm × 20 cm) randomly located in each plot. Seedlings were marked with wires of different colours for each cohort and counted. At harvest, plants were classified into dead and alive adult plants, with and without seeds, in every cohort. The number of individuals per category, tillers per plant, and fertile spikelets per tiller were registered for each cohort. Finally, total aerial biomass of the weed was collected and dried at 70 °C until constant weight was achieved, after which samples were weighed.
At harvest, weed density, crop total aboveground biomass, and yield were also evaluated by collecting three random samples per plot, equivalent to 1 m2. The samples were placed in an oven at 70 °C until weight was constant, and then weighed.
A demographic approach was used to study the population dynamics of D. sanguinalis in soybean crops [31,32], and a life table corresponding to each treatment was made. The demographic stages (initial seedbank, seedlings, and adult plants) and parameters (establishment, survival, and fecundity) were estimated.
The rate of emergence was estimated according to Equation (1), where Er is the emergence rate:
Er = (Total seedlings emerged)/(Seeds in the seedbank)
The rate of survival was estimated for each cohort according to Equation (2), where Sr is survival rate:
Sr = Adult plants/Emerged seedlings
The fecundity rate (number of seeds per plant) was estimated for each cohort according to Equation (3), where Fr is fecundity rate:
Fr = Tillers per plant × raceme per tiller × fertile spikelets per raceme
To evaluate crop performance as a function of D. sanguinalis density (D), the yield values were transformed into percentage values relative to the average value from plots with glyphosate applied at V4 without weeds, and adjusted to the nonlinear regression model of the rectangular hyperbola proposed by [33] Equation 5:
Yl = (I.D)/((1 + I/A.D))
where Yl is yield loss (%), D is weed density, I is the yield loss per unit of weed when weed density approaches zero, and A is yield loss when weed density tends to infinity, respectively.

2.4. Data Analysis

The results of each treatment were assessed separately by analysis of variance (ANOVA), with a significance level of 95%. The number of seeds in the initial seed bank, the number of seedlings in each cohort, the number of adult plants in each cohort, the number of total tillers per adult, the number of racemes per tiller, the number of fertile spikelets per raceme, weed biomass, soybean biomass, and yield were registered and subjected to ANOVA followed by Tukey’s multiple comparison test using a general linear model procedure in R [34]. The data were square root transformed when ANOVA assumptions were not met (random sampling, homoscedasticity, and normal distribution of residuals). No differences were observed in demographic data (initial seed bank, number of seedlings in each cohort, and number of adult plants) or the respective rates between locations (Boyero and Jilguero) (Table 1). Therefore, data were merged and analysed together. The same was observed for aboveground biomass and crop yield. In plant characteristics, such as total tillers per plant, racemes per tiller, and fertile spikelets per raceme, there were some differences between locations. Therefore, data were presented separately.

3. Results

3.1. Digitaria Sanguinalis Population Dynamics

In both locations (Jilguero and Boyero), three cohorts were identified, and peak seedling emergence was registered during November. At this time, 75–96% of the total seedlings had emerged in all treatments, except for plots where glyphosate was applied at R1 in Boyero, where only 63% had emerged. The rest of the cohorts emerged in late December and January, and both were significantly lower (p < 0.05) than the first cohort. No differences were observed among treatments and locations in emergence rates or the number of seeds in the seedbank at the beginning of the experiment. However, the emergence rates tended to be higher without controls than with glyphosate applications, and in Boyero than in Jilguero, independently of the treatment (Table 1).
There were no differences among treatments in the number of seedlings from the same cohort in any location. However, there were differences (p < 0.05) among cohorts depending on the treatment. Independent of location, without glyphosate or with glyphosate applied at R1, the number of seedlings was higher in the first cohort than in cohort three, and with glyphosate at V4 the first cohort had more seedlings (p < 0.001) than the other two (Table 1). For the first cohort, the survival rate was lower (p < 0.001) with glyphosate at V4 than without glyphosate in both locations, but no differences among treatments were observed in the other cohorts. In addition, no differences were observed among cohorts for the same treatment in any location. In all the treatments, the number of adult plants in the first cohort tended to be higher than the rest of the cohorts, and no differences were observed among treatments and cohorts in both locations.
There was a higher (p < 0.0001) fecundity rate without glyphosate than with glyphosate in both locations. Without glyphosate, the first cohort had a higher number of seeds per plant than the second and third cohorts. In both treatments with glyphosate, no differences were observed among cohorts in either location (Table 1).
In the first cohort, a higher number of total tillers per plant was observed without glyphosate than with glyphosate at V4 in Boyero, which was also higher than the application at V4 and R1 in Jilguero (p < 0.05). In Jilguero, without glyphosate, the second cohort had more tillers per plant than with glyphosate (p < 0.001). No differences were observed in the second and third cohorts in Boyero, or in the third cohort of Jilguero (Table 2).
In Jilguero, the first and second cohort had a higher number of racemes per tiller without than with glyphosate (p < 0.001). In Boyero, differences were observed only in the first cohort, with a higher number of racemes per tiller without glyphosate at V4 (p < 0.01) (Table 2). As for the rest of the reproductive structures, a lower (p < 0.001) number of spikelets due to the herbicide application was observed in the first cohort, both for Boyero and Jilguero (Table 2). In both locations, there was a reduction (p < 0.05) of shoot biomass when glyphosate was applied at V4 and R1 (Figure 2a).

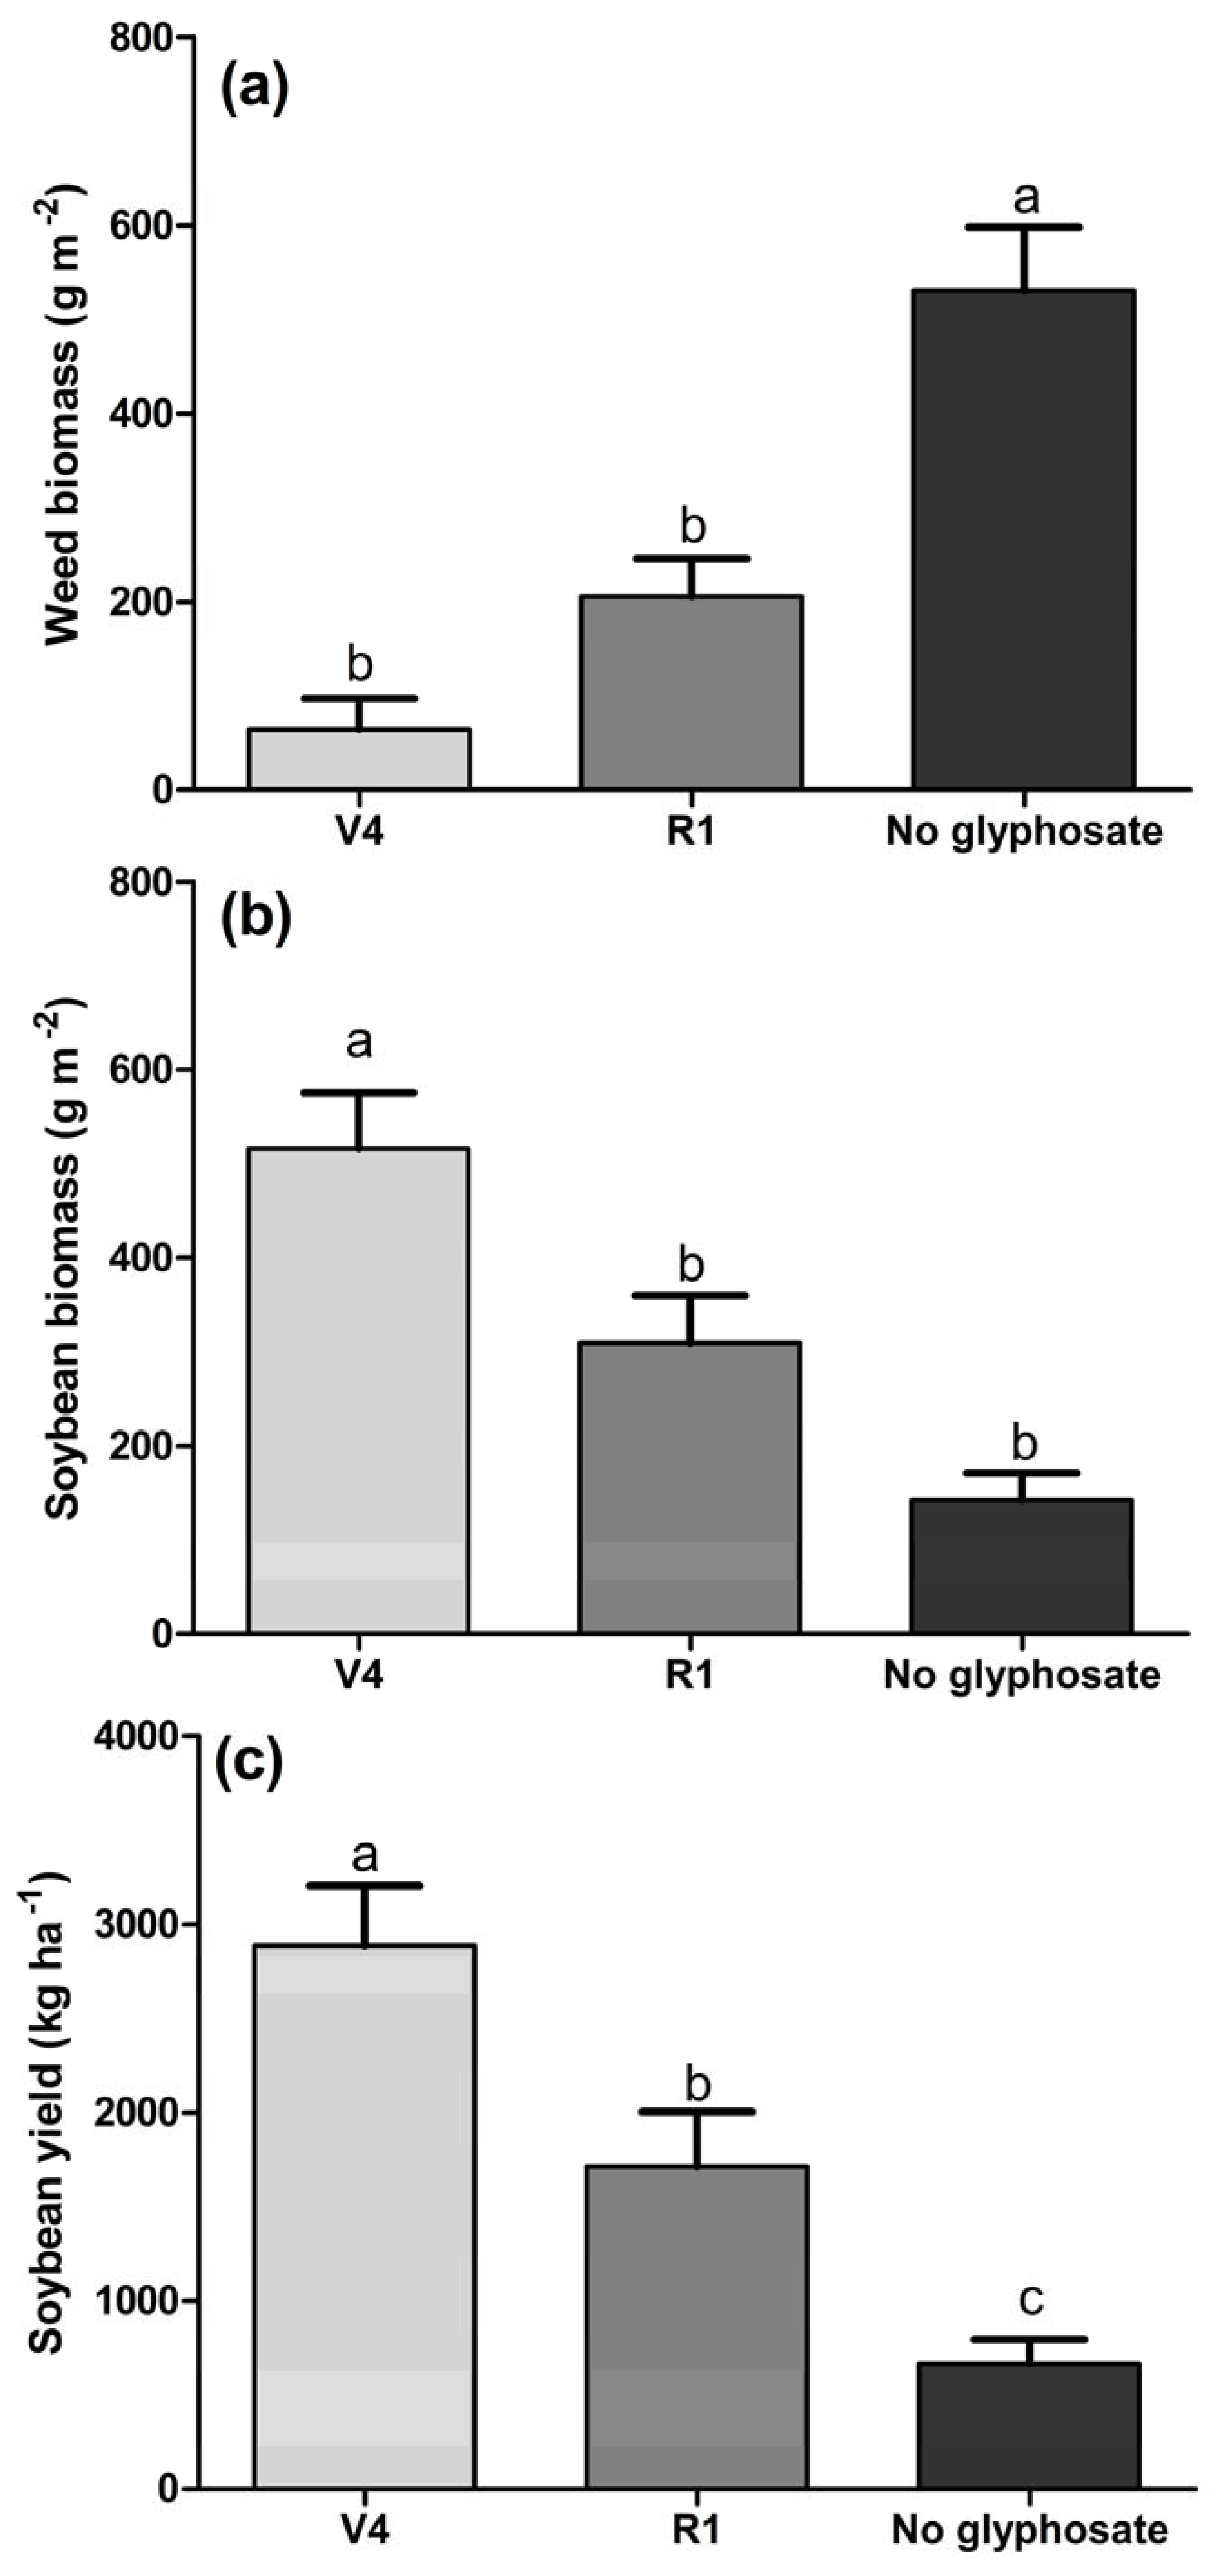
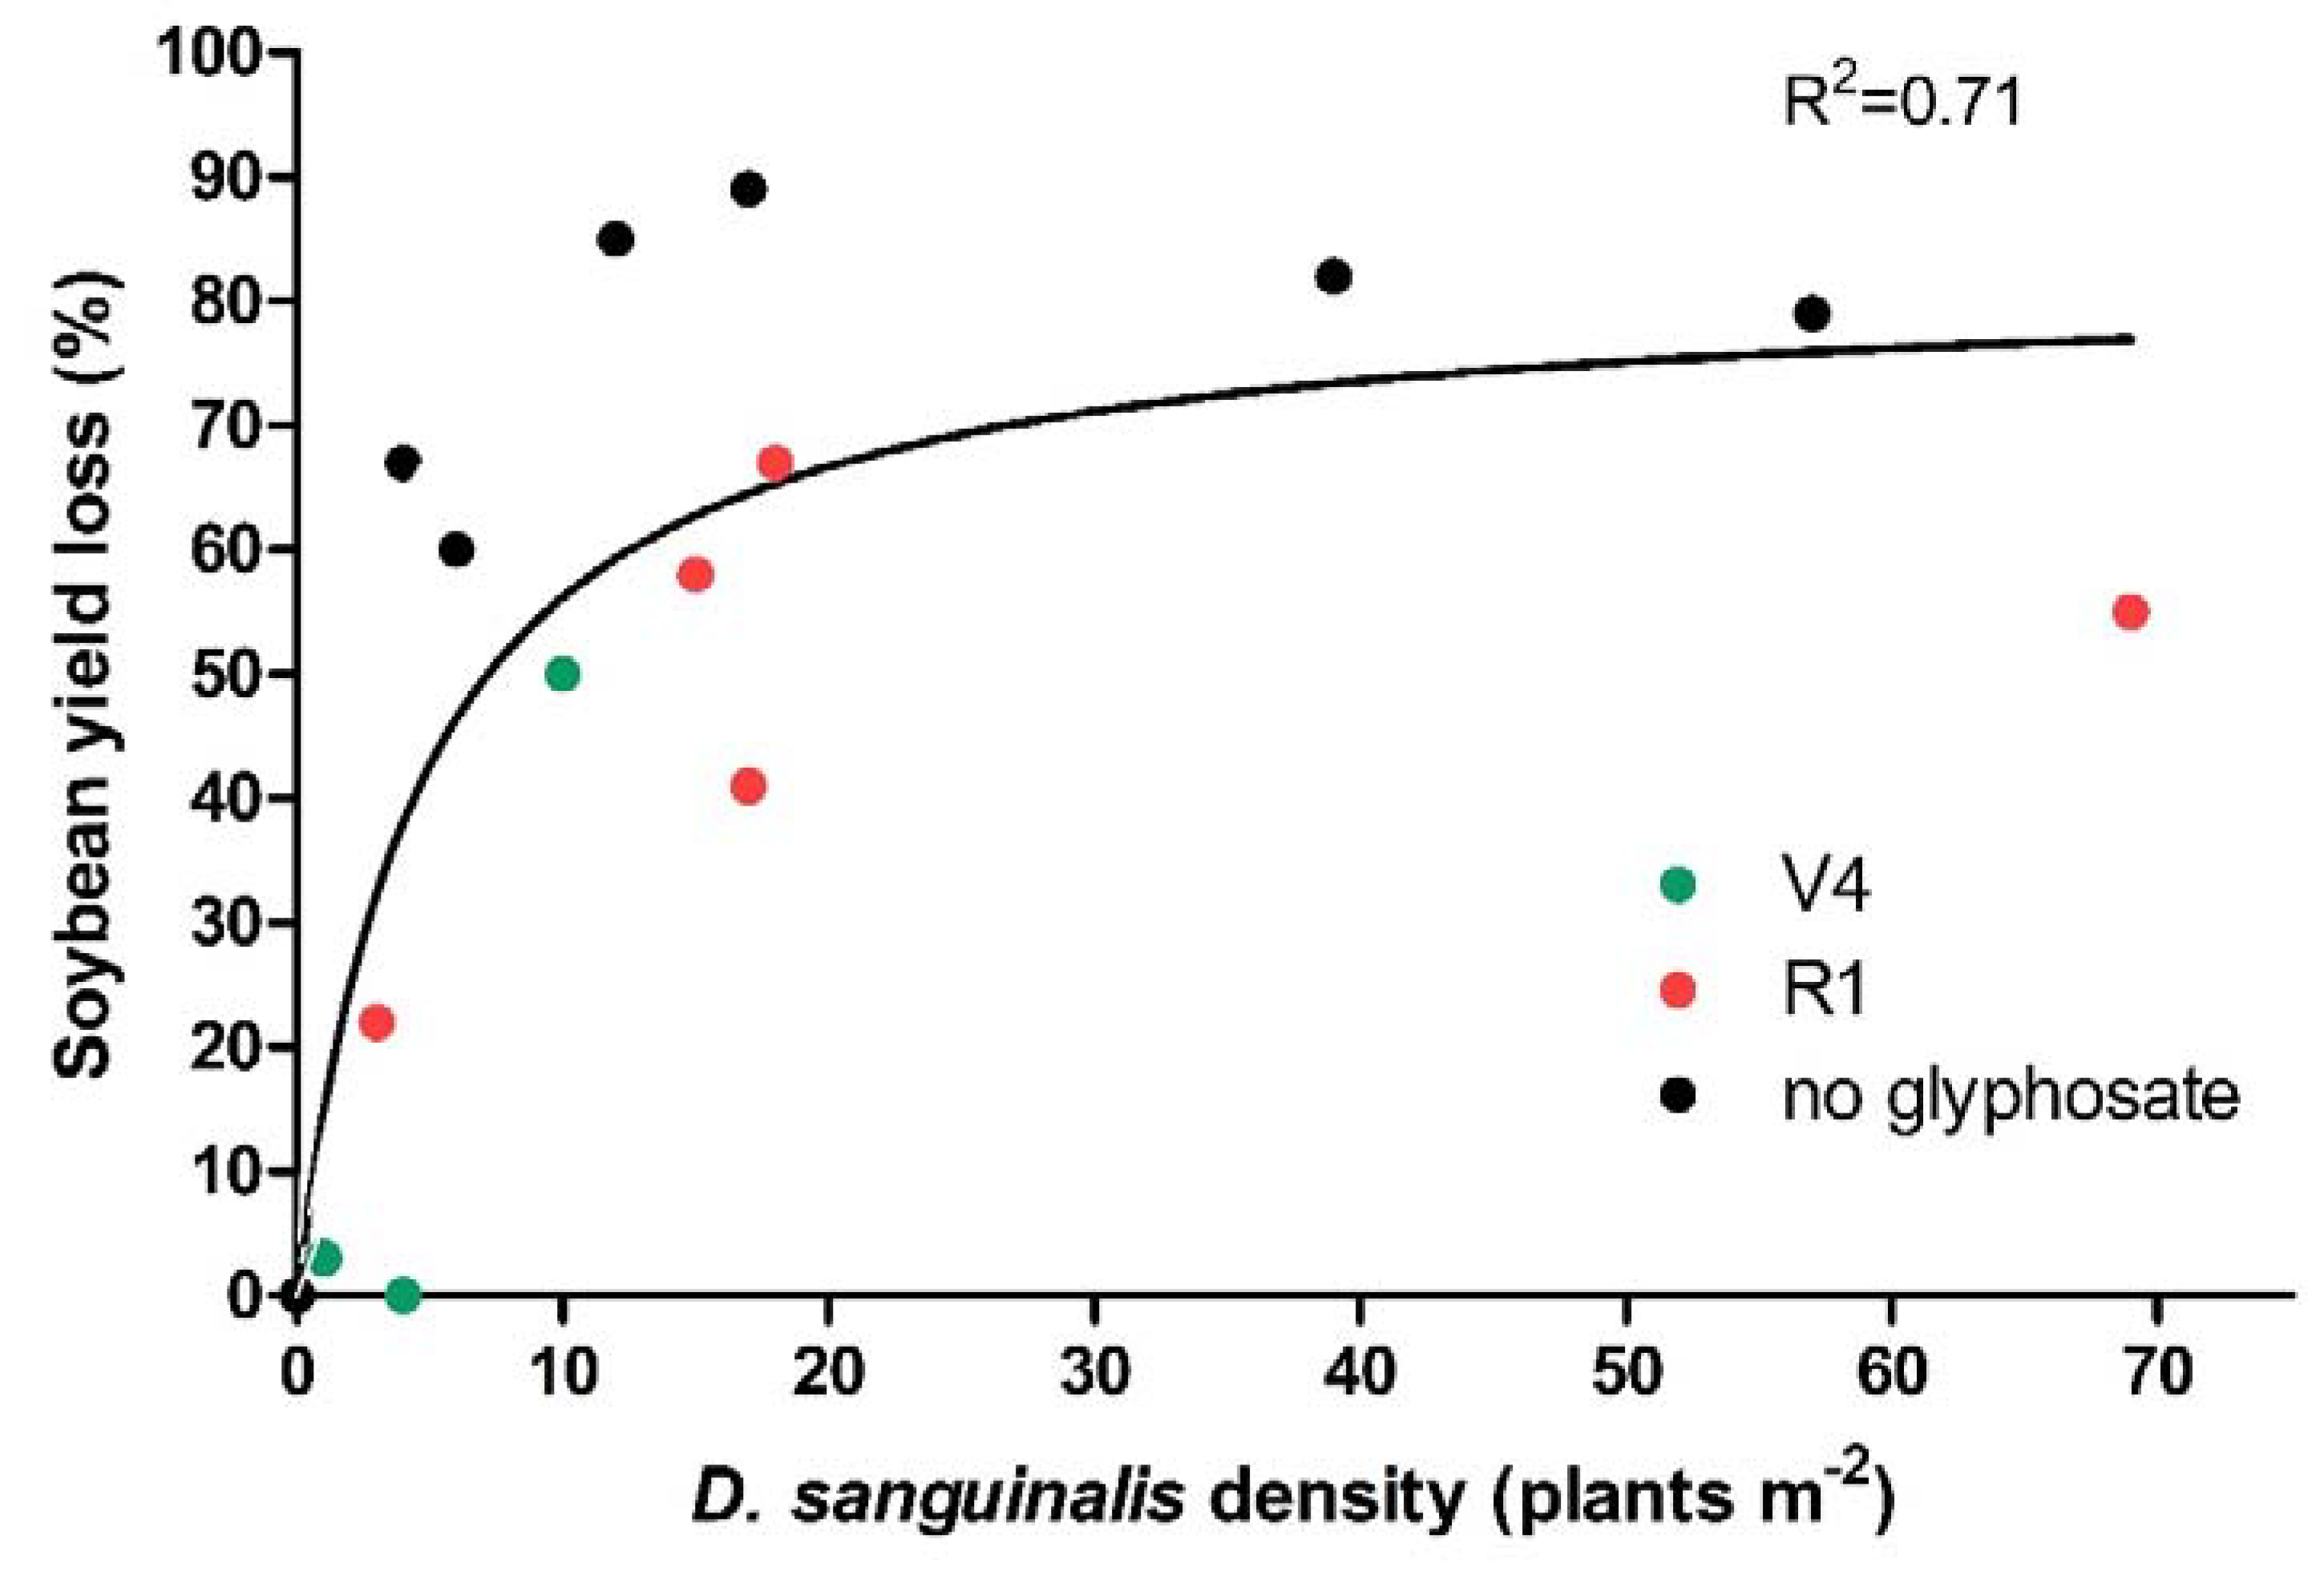
3.2. Effects on Soybean

In both locations, soybean biomass production was higher (p < 0.001) when glyphosate was applied at V4 than at R1 or without glyphosate (Figure 2b). The application of glyphosate at V4 showed higher yield than at R1 and without glyphosate (p < 0.05), and glyphosate applied at R1 had a higher yield than without glyphosate (Figure 2c). Soybean yield loss increased asymptotically (R2 = 0.68) as the weed density (plants m−2) increased (Figure 3). The parameters of the model were estimated as 18% yield loss when density approaches zero (I), and as 82% maximum yield loss at higher densities (A).

4. Discussion

The life table of D. sanguinalis is similar to others described for all annual species that reproduce by seed [31], and results in a model similar to that presented for Avena sterilis and Lolium rigidum [28,34]. Despite the large number of seeds present in the seedbank (around 6130 seeds m−2), a very low proportion of them (between 8 and 35%) reached the seedling stage, regardless of the location or treatment. This is probably the result of crop and stubble presence in no-till systems, which have been shown to modify the environmental conditions surrounding the seeds, such as reducing temperature fluctuation and increasing far-red light [19]. D. sanguinalis seeds require fluctuating temperatures to terminate dormancy [35], and environments enriched with far-red light can reduce germination percentage [35]. In addition, as was observed in previous works from no-till systems with summer crops such as maize [36] or late soybean [37], there were three cohorts emerging in the season, which allowed the species to escape the postemergence applications and produce seeds. Among these cohorts, the first was the most relevant, and had the highest number of seedlings. This was the result of crop growth that reduced the solar radiation reaching the soil and the light quality as the season advanced [38,39], as well as D. sanguinalis plants themselves that had previously emerged, especially in the treatment without glyphosate.
The survival rate of the first cohort was reduced by glyphosate, especially when the herbicide was applied at the V4 stage, which reduced the number of adult plants. This early control of the first cohort allowed the crop to capture resources and increase its competitive ability against the next cohorts. Typically, the last cohorts are less competitive, and produce less biomass and seeds, than cohorts emerging earlier in the season [40,41]. When glyphosate was applied at R1, the survival rate and number of adults tended to be lower, but no differences were observed compared with no application. During the glyphosate application at R1, some of the plants from the first cohorts were in advanced stages of growth, which reduced glyphosate efficacy [42,43]. In addition, at R1, the interrow is more covered by the crop canopy than at V4 [39], which intercepts the herbicide and reduces its control efficacy [44]. Without glyphosate, later cohorts are not only exposed to crop competition, but also to intraspecific competition with D. sanguinalis plants that emerged earlier and are more competitive [45,46].
Glyphosate applications reduce seed production in D. sanguinalis not only by reducing the potential plants that can produce new seeds, but also by reducing the growth and fecundity of surviving plants. These surviving plants are less competitive in capturing resources that are taken by the crop, as they generate less biomass, allocate fewer resources to reproductive organs, and reduce their fecundity [47]. This generates a lower number of tillers per plant, racemes per tiller, and fertile spikelets per raceme produced by plants in treatments with glyphosate compared the controls. As a result, fewer plants produce seeds, and surviving plants produce fewer seeds. The application at V4 produced very few new seeds to enter to the seedbank, but the application at R1 had some escapes that produced new seeds in Boyero.
As the use of herbicides increased the competitive ability of the crop [48], this allowed the crop to capture more resources and produce more biomass. Biomass accumulation in soybean is essential for allocating grain production and filling [49]. When glyphosate was applied at V4, the soybeans captured enough resources to maintain crop growth rate during the reproductive stage to achieve high yields [50]. However, the application at R1 was not as effective as the application at V4 in reducing weed competition. Therefore, crop biomass accumulation was lower, as well as yield. Weed presence was enough to cause competition with soybean and therefore limit crop biomass production. The application at R1 may have been beyond the critical timing for weed removal, although this is highly variable between years and locations, and depends on several crop management factors [51]. For soybean, this period is around V2–V4 [21,52,53,54].
As most individuals in weed populations belong to the first cohort, they are similar in size and likely have similar potential for acquiring resources [55]. Therefore, estimating crop yield loss according to weed density could also be useful for estimating weed crop competition. The soybean yield in the absence of weeds was 2.9 tn ha−1, and the yield losses estimated with the model of the rectangular hyperbola had an adjustment of 0.71, reaching a minimum yield loss of 18% and a maximum yield loss of 82%. The I value was lower than those obtained for the same species in snap beans [56] and bell pepper [57], and much lower than that reported in sweet potato (61%) [58]. This is likely due to the competitiveness of soybean crop compared to other crops. However, the A value was higher than those reported in snap beans, bell pepper [56,57], and sweet potato [58].
Glyphosate application at the V4 stage is the optimal timing for short-term weed management due to the reduction of weed survival and prevention of yield loss. It is also the best timing for mid-term management because it lowers fecundity, which, together with the reduced number of reproductive plants, reduces the seeds entering the seedbank. A single glyphosate application in the range of 14 to 28 days after soybean emergence provided effective weed control [59]. However, this technique is more likely to be useful in narrow-row soybeans under favourable growth conditions. In wide-row crops, application timing is more critical and may need a second glyphosate application to control late-emerging weeds [46], or the use of residual herbicides. However, those late-emerging weeds could be harmless to the yield and contribute to the maintenance of a diverse weed community. In the long term, a more diverse weed community could be less competitive to crops and indicate agronomic and environmental sustainability [60,61].

Author Contributions

F.H.O., data collection, analysis, visualization, and writing; E.B.d.l.F., conceptualization, experimental design, and writing—review and editing; M.S., writing and visualization. All authors have read and agreed to the published version of the manuscript.

Funding

This research received no external funding.

Institutional Review Board Statement

Not applicable.

Informed Consent Statement

Not applicable.

Data Availability Statement

The data presented in this study are available on request from the corresponding author.

Acknowledgments

The author thanks April Dobbs for critical reading of the manuscript.

Conflicts of Interest

The authors declare no conflict of interest.

References

  1. Jones, E.A.; Contreras, D.J.; Everman, W.J. Digitaria ciliaris, Digitaria ischaemum, and Digitaria sanguinalis. In Biology and Management of Problematic Crop Weed Species; Chauhan, B.S., Ed.; Academic Press: San Diego, CA, USA, 2021; pp. 173–195. [Google Scholar]
  2. Scursoni, J.A.; Vera, A.C.D.; Oreja, F.H.; Kruk, B.C.; de la Fuente, E.B. Weed management practices in Argentina crops. Weed Technol. 2019, 33, 459–463. [Google Scholar] [CrossRef]
  3. Gianessi, L.P. The increasing importance of herbicides in worldwide crop production. Pest Manag. Sci. 2013, 69, 1099–1105. [Google Scholar] [CrossRef] [PubMed]
  4. Culpepper, A.S.; Gimenez, A.E.; York, A.C.; Batts, R.B.; Willcut, J.W. Morningglory (Ipomoea spp.) and Large Crabgrass (Digitaria sanguinalis) control with glyphosate and 2,4-DB mixtures in glyphosate-resistant soybean (Glycine max). Weed Technol. 2001, 15, 56–61. [Google Scholar] [CrossRef]
  5. Van Gessel, M.J.; Ayeni, A.O.; Majek, B.A. Glyphosate in full-season in no-till glyphosate-resistant soybean: Role of pre-plant applications and residual herbicides. Weed Technol. 2001, 15, 714–724. [Google Scholar] [CrossRef]
  6. Puricelli, E.; Tuesca, D. Weed density and diversity under glyphosate-resistant crop sequences. Crop Prot. 2005, 24, 533–542. [Google Scholar] [CrossRef]
  7. De la Fuente, E.B.; Suárez, S.A.; Ghersa, C.M. Soybean weed community composition and richness between 1995 and 2003 in the Rolling Pampas (Argentina). Agric. Ecosyst. Environ. 2006, 115, 229–236. [Google Scholar] [CrossRef]
  8. Scursoni, J.A.; Satorre, E.H. Glyphosate management strategies, weed diversity and soybean yield in Argentina. Crop Prot. 2010, 29, 957–962. [Google Scholar] [CrossRef]
  9. De la Fuente, E.B.; Oreja, F.H.; Lenardis, A.E.; Torcat Fuentes, M.; Agosti, M.B.; Barrio, A.; Barberis, S.; Robredo, J.; Gil, A.; Marzetti, M.; et al. Intensification of crop rotation affecting weed communities and the use of herbicides in the rolling Pampa. Heliyon 2021, 7, e06089. [Google Scholar] [CrossRef]
  10. Yanniccari, M.; Vázquez-García, J.G.; Gigón, R.; Palma-Bautista, C.; Vila-Aiub, M.; Prado, R.D. A novel EPSPS Pro-106-His mutation confers the first case of glyphosate resistance in Digitaria sanguinalis. Pest Manag. Sci. 2022, 78, 3135–3143. [Google Scholar] [CrossRef]
  11. Norris, R.F. Weed fecundity: Current status and future needs. Crop Prot. 2007, 26, 182–188. [Google Scholar] [CrossRef]
  12. Harrison, S.K.; Regnier, E.E.; Schmoll, J.T. Postdispersal predation of giant ragweed (Ambrosia trifida) seed in no-tillage corn. Weed Sci. 2003, 51, 955–964. [Google Scholar] [CrossRef]
  13. Gallart, M.; Mas, M.T.; Verdu, A.M.C. Demography of Digitaria sanguinalis: Effect of the emergence time on survival, reproduction and biomass. Weed Biol. Manag. 2010, 10, 132–140. [Google Scholar] [CrossRef]
  14. Cardina, J.; Herms, C.P.; Herms, D.A. Phenological indicators for emergence of Large and Smooth Crabgrass (Digitaria sanguinalis and D. ischaemun). Weed Technol. 2011, 25, 141–150. [Google Scholar] [CrossRef]
  15. Everman, W.J.; Clewis, S.B.; York, A.C.; Wilcut, J.W. Weed control and yield with flumioxazin, fomesafen, and S-metolachlor systems for glufosinate-resistant cotton residual weed management. Weed Technol. 2009, 23, 391–397. [Google Scholar] [CrossRef]
  16. Cahoon, C.W.; York, A.C.; Jordan, D.L.; Everman, W.J.; Seagroves, R.W.; Braswell, L.R.; Jennings, K.M. Weed control in cotton by combinations of microencapsulated acetochlor and various residual herbicides applied preemergence. Weed Technol. 2015, 29, 740–750. [Google Scholar] [CrossRef]
  17. Stewart, C.L.; Nurse, R.E.; Hamill, A.S.; Sikkema, P.H. Environment and soil conditions influence pre-and postemergence herbicide efficacy in soybean. Weed Technol. 2010, 24, 234–243. [Google Scholar] [CrossRef]
  18. Farha, W.; AM, A.E.A.; Rahman, M.D.; Shin, H.C.; Shim, J.H. An overview on common aspects influencing the dissipation pattern of pesticides: A review. Environ. Monit. Assess. 2016, 188, 693. [Google Scholar] [CrossRef] [PubMed]
  19. Oreja, F.H.; Batlla, D.; de la Fuente, E.B. Digitaria sanguinalis seed dormancy release and seedling emergence are affected by crop canopy and stubble. Weed Res. 2020, 60, 111–120. [Google Scholar] [CrossRef]
  20. Swanton, C.J.; Mahoney, K.J.; Chandler, K.; Gulden, R.H. Integrated weed management: Knowledge-based weed management systems. Weed Sci. 2008, 56, 168–172. [Google Scholar] [CrossRef]
  21. Van Acker, C.R.; Swanton, C.J.; Weise, S.E. The critical period of weed control in soybean [Glycine max (L.) Merr.]. Weed Sci. 1993, 41, 194–200. [Google Scholar] [CrossRef]
  22. Bagavathiannan, M.V.; Norsworthy, J.K. Late-season seed production in arable weed communities: Management implications. Weed Sci. 2012, 60, 325–334. [Google Scholar] [CrossRef]
  23. Soltani, N.; Stewart, C.L.; Nurse, R.E.; Van Eerd, L.L.; Vyn, R.J.; Sikkema, P.H. Weed control, environmental impact and profitability of weed management strategies in glyphosate-resistant corn. Am. J. Plant Sci. 2012, 3, 1594. [Google Scholar] [CrossRef]
  24. Beckie, H.J. Herbicide-resistant weed management: Focus on glyphosate. Pest Manag. Sci. 2011, 67, 1037–1048. [Google Scholar] [CrossRef] [PubMed]
  25. Oreja, F.H.; Inman, M.D.; Jordan, D.L.; Leon, R.G. Population growth rates of weed species in response to herbicide programme intensity and their impact on weed community. Weed Res. 2021, 61, 509–518. [Google Scholar] [CrossRef]
  26. Davis, A.S.; Liebman, M. Cropping system effects on giant foxtail (Setaria faberi) demography, I: Green manure and tillage timing. Weed Sci. 2003, 51, 919–929. [Google Scholar] [CrossRef]
  27. Caswell, H. Matrix Population Models: Construction, Analysis and Interpretation; Sinauer: Sunderland, MA, USA, 2001; pp. 133–174. [Google Scholar]
  28. González-Andújar, J.L.; Fernández-Quintanilla, C. Modelling the population dynamics of annual ryegrass (Lolium rigidum) under various weed management systems. Crop Prot. 2004, 23, 723–729. [Google Scholar] [CrossRef]
  29. Bussan, A.J.; Boerboom, C.M.; Stoltenberg, D.E. Response of Setaria faberi demographic processes to herbicide rates. Weed Sci. 2000, 48, 445–453. [Google Scholar] [CrossRef]
  30. De la Fuente, E.B.; Suárez, S.A.; Lenardis, A.E.; Oreja, F.H.; Torcat Fuentes, M. Cambios en las comunidades de malezas en los cultivos de maíz de la pampa ondulada (Argentina) entre 1960 y 2019. Agron. Y Ambiente Rev. Fac. Agron. Univ. Buenos Aires 2021, 41, 169–178. [Google Scholar]
  31. Fernández-Quintanilla, C. Studying the population dynamics of weeds. Weed Res. 1988, 28, 443–447. [Google Scholar] [CrossRef]
  32. Sagar, G.R. An approach to the study of the population dynamics of plants with special reference to weeds. Ann. Appl. Biol. 1976, 1, 1–47. [Google Scholar]
  33. Cousens, R. An empirical model relating crop yield to weed and crop density and a statistical comparison with other models. J. Agric. Sci. 1985, 105, 513–521. [Google Scholar] [CrossRef]
  34. R Core Team. R: A Language and Environment for Statistical Computing; R Foundation for Statistical Computing: Vienna, Austria; Available online: https://www.R-project.org/ (accessed on 10 July 2022).
  35. González-Andújar, J.L.; Fernández-Quintanilla, C. Modelling the population dynamics of Avena sterilis under dry-land cereal cropping systems. J. Appl. Ecol. 1991, 28, 16–27. [Google Scholar] [CrossRef]
  36. Oreja, F.H.; de la Fuente, E.B.; Batlla, D. Role of seed environment and covering structures on large crabgrass germination. S. Afr. J. Bot. 2017, 111, 170–175. [Google Scholar] [CrossRef]
  37. Mohler, C.L.; Callaway, M.B. Effects of tillage and mulch on weed seed production and seed banks in sweet corn. J. Appl. Ecol. 1995, 32, 627–639. [Google Scholar] [CrossRef]
  38. Scursoni, J.; Gastaldi, E. Demografía de Pasto cuaresma (Digitaria sanguinalis) en cultivos de soja de segunda, sembrados en sistema de siembra directa. In Proceedings of the XIII Congreso Latinoamericano de Malezas, Buenos Aires, Argentina, 17–19 September 1997. [Google Scholar]
  39. Norsworthy, J.K. Soybean canopy formation effects on pitted morningglory (Ipomoea lacunosa), common cocklebur (Xanthium strumarium), and sicklepod (Senna obtusifolia) emergence. Weed Sci. 2004, 52, 954–960. [Google Scholar] [CrossRef]
  40. Oreja, F.H.; Batlla, D.; de la Fuente, E.B. Effect of soybean crop structure on large crabgrass (Digitaria sanguinalis) growth and seed dormancy. Weed Sci. 2021, 69, 372–378. [Google Scholar] [CrossRef]
  41. Knezevic, S.Z.; Weise, S.F.; Swanton, C.L. Interference of redroot pigweed (Amaranthus retroflexus) in corn (Zea mays). Weed Sci. 1994, 42, 568–573. [Google Scholar] [CrossRef]
  42. Steckel, L.E.; Sprague, C.L. Late-season common waterhemp (Amaranthus rudis) interference in narrow- and wide-row soybean. Weed Technol. 2004, 18, 947–952. [Google Scholar] [CrossRef]
  43. Norsworthy, J.K.; Jha, P.; Bridges, W., Jr. Sicklepod survival and fecundity in wide- and narrow-row glyphosate-resistant soybean (Glycine max). Weed Sci. 2007, 55, 252–259. [Google Scholar] [CrossRef]
  44. Hoss, N.E.; Al-Khatib, K.; Peterson, D.E.; Loughin, T.M. Efficacy of glyphosate, glufosinate, and imazethapyr on selected weed species. Weed Sci. 2003, 51, 110–117. [Google Scholar] [CrossRef]
  45. DeGreeff, R.D.; Varanasi, A.V.; Dille, J.A.; Peterson, D.E.; Jugulam, M. Influence of plant growth stage and temperature on glyphosate efficacy in common lambsquarters (Chenopodium album). Weed Technol. 2018, 32, 448–453. [Google Scholar] [CrossRef]
  46. Mulugeta, D.; Boerboom, C.M. Critical time of weed removal in glyphosate-resistant Glycine max. Weed Sci. 2000, 48, 35–42. [Google Scholar] [CrossRef]
  47. Jha, P.; Norsworthy, J.K.; Bridges, W.; Riley, M.B. Influence of glyphosate timing and row width on Palmer amaranth (Amaranthus palmeri) and pusley (Richardia spp.) demographics in glyphosate-resistant soybean. Weed Sci. 2008, 56, 408–415. [Google Scholar] [CrossRef]
  48. Weiner, J. Allocation, plasticity and allometry in plants. Perspect. Plant Ecol. Evol. Syst. 2004, 6, 207–215. [Google Scholar] [CrossRef]
  49. Williams, M.M.; Boydston, R.A.; Davis, A.S. Crop competitive ability contributes to herbicide performance in sweet corn. Weed Res. 2008, 48, 58–67. [Google Scholar] [CrossRef]
  50. Green-Tracewicz, E.; Page, E.R.; Swanton, C.J. Shade avoidance in soybean reduces branching and increases plant-to-plant variability in biomass and yield per plant. Weed Sci. 2011, 59, 43–49. [Google Scholar] [CrossRef]
  51. Board, J.E.; Harville, B.G. Soybean yield component responses to a light interception gradient during the reproductive period. Crop Sci. 1993, 33, 772–777. [Google Scholar] [CrossRef]
  52. Knezevic, S.Z.; Evans, S.P.; Blankenship, E.E.; Van Acker, R.C.; Lindquist, J.L. Critical period for weed control: The concept and data analysis. Weed Sci. 2002, 50, 773–786. [Google Scholar] [CrossRef]
  53. Halford, C.; Hamill, A.S.; Zhang, J.; Doucet, C. Critical period of weed control in no-till soybean (Glycine max) and corn (Zea mays). Weed Technol. 2001, 15, 737–744. [Google Scholar] [CrossRef]
  54. Eyherabide, J.J.; Cendoya, M.G. Critical periods of weed control in soybean for full field and in-furrow interference. Weed Sci. 2002, 50, 162–166. [Google Scholar] [CrossRef]
  55. Keramati, S.; Pirdashti, H.; Esmaili, M.A.; Abbasian, A.; Habibi, M. The Critical Period of Weed Control in Soybean (Glycine max (L.) Merr.). Pak. J. Biol. Sci. 2008, 11, 463–467. [Google Scholar] [CrossRef] [PubMed]
  56. Goldberg, D.E.; Landa, K. Competitive effect and response: Hierarchies and correlated traits in the early stages of competition. J. Ecol. 1991, 79, 1013–1030. [Google Scholar] [CrossRef] [Green Version]
  57. Aguyoh, J.N.; Masiunas, J.B. Interference of large crabgrass (Digitaria sanguinalis) with snap beans. Weed Sci. 2003, 51, 171–176. [Google Scholar] [CrossRef]
  58. Fu, R.; Ashley, R.A. Interference of large crabgrass (Digitaria sanguinalis), redroot pigweed (Amaranthus retroflexus), and hairy galinsoga (Galinsoga ciliata) with bell pepper. Weed Sci. 2006, 54, 364–372. [Google Scholar] [CrossRef]
  59. Basinger, N.T.; Jennings, K.M.; Monks, D.W.; Jordan, D.L.; Everman, W.J.; Hestir, E.L.; Waldschmidt, M.D.; Smith, S.C.; Brownie, C. Interspecific and intraspecific interference of Palmer amaranth (Amaranthus palmeri) and large crabgrass (Digitaria sanguinalis) in sweetpotato. Weed Sci. 2019, 67, 426–432. [Google Scholar] [CrossRef]
  60. Sartorato, I.; Berti, A.; Zanin, G.; Dunan, C.M. Modeling of glyphosate application timing in glyphosate-resistant soybean. Weed Sci. 2011, 59, 390–397. [Google Scholar] [CrossRef]
  61. Storkey, J.; Neve, P. What good is weed diversity? Weed Res. 2018, 58, 239–243. [Google Scholar] [CrossRef]
Figure 1. Monthly rainfall in locations Jilguero and Boyero, and historical rainfall during the months that the experiment was performed in the field.
Grasses 02 00002 g001
Figure 2. (a) D. sanguinalis biomass (g m−2), (b) soybean biomass (g m−2), and (c) crop yield (kg ha−1) with glyphosate applied when soybean crop was at V4 stage (vegetative with 4 leaves) and R1 stage (reproductive stage with 1 flower), and without glyphosate application (no glyphosate). Values are the means, and vertical bars are SEM. Columns with the same letters are not significantly different according to Tukey’s multiple comparison test (p < 0.05).
Grasses 02 00002 g002
Figure 3. Soybean yield loss (%) related to D. sanguinalis density (plants m−2) at different treatments, with glyphosate applied when soybean crop was at V4, at R1, and without glyphosate application (no glyphosate). The slope (I) represents the percentage yield loss as density approaches zero, and the asymptote (A) represents the percentage yield loss as density approaches infinity. Equation Yl = 17.88 × D/[1 + (17.88/82.06) × D]; R2 = 0.71; SS = 5156; df = 15.
Grasses 02 00002 g003
Table 1. Data of demographic stages (seeds in the seedbank, seedlings, and adult plants per m2) and parameters (emergence, survival, and fecundity rates) of D. sanguinalis for the different treatments, no glyphosate, glyphosate applied in V4, and in R1. Emergence rate (Er), survival rate (Sr), and fecundity rate (Fr). Values are the average from both locations (Jilguero and Boyero). Uppercase letters in the same rows mean significant differences among treatments according to Tukey’s multiple comparison test (p < 0.05). Lowercase letters in the same rows mean significant differences among each cohort (p < 0.05).
No Glyphosate Glyphosate at V4 Glyphosate at R1
Initial seedbank 7037A 5961A 6893A
Er 0.17A 0.11A 0.15A
Cohort1st2nd3rd1st2nd3rd1st2nd3rd
Seedlings1175Aa167Aab0Ab621Aa17Ab25Ab721Aa200Aab88Ab
Sr0.42Aa0.22Aa0Aa0Ba0Aa0.5Aa0.19Aba0.42Aa0.40Aa
Adult plants388Aa29Ab0Ab0Ba0Aa17Aa150Aba113Aa63Aa
Fr1556.2Aa0.5Ab0Ab0Ba0Aa1.7Aa3.4B0.25A0.5A
Table 2. Number of total tillers per plant, racemes per tiller, and fertile spikelets per raceme of D. sanguinalis, in Boyero and Jilguero for the different treatments; no glyphosate, glyphosate applied at V4, and at R1. Different letters indicate significant differences among treatments for each location according to Tukey’s multiple comparison test (p < 0.05).
Boyero Treatments
No Glyphosate Glyphosate at V4 Glyphosate at R1
Cohort1st2nd3rd1st2nd3rd1st2nd3rd
Tillers per plant7.03b0.5a0a0a0a0.67a1.58ab0.5a0.67a
Racemes/tiller4.06b0.5a0a0a0a1a1ab0.42a0.5a
Spikelets/raceme30.89b3a0a0a0a5a4.25a2.42a3a
Jilguero Treatments
No Glyphosate Glyphosate in V4 Glyphosate in R1
Cohort1st 2nd 3rd1st 2nd3rd1st2nd3rd
Tillers/plant14.25b2.67b2.67a0a0a0a0a0a0a
Racemes/tiller4.75b2.67a1.33a0a0a0a0a0a0a
Spikelets/raceme33.25b14.67a9.33a0a0a0a0a0a0a
Disclaimer/Publisher’s Note: The statements, opinions and data contained in all publications are solely those of the individual author(s) and contributor(s) and not of MDPI and/or the editor(s). MDPI and/or the editor(s) disclaim responsibility for any injury to people or property resulting from any ideas, methods, instructions or products referred to in the content.

