

Evaluation of Monitoring Data in Foods


1
Doctoral School of Nutrition and Food Sciences, University of Debrecen, 4032 Debrecen, Hungary
2
Freelancer Food Safety Adviser, 1116 Budapest, Hungary
3
Southern Pesticide Control and Testing Center, Plant Protection Department, Ho Chi Minh City 71007, Vietnam
4
National Food Chain Safety Office, Food Chain Safety Laboratory Directorate, 1095 Budapest, Hungary
*
Author to whom correspondence should be addressed.
Agrochemicals 2023, 2(1), 69-95; https://doi.org/10.3390/agrochemicals2010006
Submission received: 16 November 2022
/
Revised: 9 January 2023
/
Accepted: 12 January 2023
/
Published: 18 January 2023
(This article belongs to the Special Issue Feature Papers to Celebrate the Inaugural Issue of Agrochemicals)
Abstract
:Pesticide residue monitoring data reflect the actual residues in foods as traded and are suitable for estimating consumers’ exposure, evaluating compliance with maximum residue limits, MRLs, and refining future risk-based sampling programmes. The long-term exposure (daily intake) is calculated from the national or regional food consumption data and average residues in the edible portions of food. The non-detected residues may be counted as LOQ, 0.5 LOQ, or 0. The short-term intake is calculated from the large portion consumption of individual foods multiplied by the highest residue concentration found in them and the relevant variability factor. Dietary exposure to a pesticide residue may be characterised by the hazard quotient (HQ) and the hazard index (HI). Cumulative exposure should only be assessed for those compounds having the common mechanism of toxicity (cumulative assessment group, CAG). The number of residue data required for these assessments should be calculated with distribution-free statistics at the targeted confidence level. The proper evaluation of the numerous results can only be completed if they are electronically recorded and can be retrieved in specific formats. Our objectives are to present methods for consumer risk assessment, testing compliance with MRLs, and ranking commodities for risk-based sampling and to give examples of electronic processing of residue data.
1. Introduction
Currently pesticides are needed to produce sufficient and good quality food for the world′s constantly growing population [1]. The pesticides are deliberately applied, and in most cases, their residues should remain in/on the target objects to deliver the desired functions. This raises food and environmental safety concerns. According to the survey conducted by the European Food Safety Authority (EFSA), pesticide residues in food (40%) and antibiotic, hormone or steroid residues in meat (39%) top the list of food safety-related concerns among Europeans [2].
The experts of the FAO/WHO Joint Meeting on Pesticide Residues (JMPR) evaluate the experimental data and establish toxicological endpoints [e.g., no-effect levels, acceptable daily intake (ADI), acute reference dose (ARfD)] on the basis of all known facts at the time of the evaluation, perform initial exposure assessment and recommend maximum residue levels for consideration by the delegates of Codex Committee on Pesticide Residues (CCPR) [3]. The JMPR recommendations are further evaluated within a stepwise procedure to establish CODEX MRLs by the Codex Alimentarius Commission (CAC) [4,5]. EFSA and some national authorities also evaluate the toxicological and residue data and derive the ADI, ARfD, MRL values that may be somewhat different from those established by the JMPR due to specific national circumstances.
To control the safe and efficient use of pesticides, their residues are regularly monitored in food and environmental samples in many countries. The samples are typically taken randomly based on the priorities reflecting the national risk assessment [6,7]. The monitoring programmes generally include raw and a limited number of processed commodities (e.g., wine and juice). Composite samples are usually taken according to the Codex sampling guidelines [8] in food stores and food distribution centres [6], while imported foods are collected at the point of entry in the country. Therefore, the monitoring data represent the actual residue that can be expected in the distributed foods. The evaluation of the results of monitoring programmes enables the national authorities, for instance, to:
- (i)
- Identify the commodities with an incidence of high residues and initiate corrective actions;
- (ii)
- Prevent the sale of food containing unacceptable residues;
- (iii)
- Perform quantitative dietary exposure assessment; and
- (iv)
- Manage the risk of chemical residues [6].
The number and the scope of the analyses vary among countries. Likewise, the format and details reported are different. Some examples are given in Table 1.
Specific studies covering selected crops and limited sampling targets have been reported in combination with modified sample preparation procedures in numerous publications, reflecting world-wide activities from Argentina to Vietnam. Some references are given as examples [14,15,16,17,18,19,20,21,22,23,24,25,26,27,28,29,30,31,32,33,34,35,36,37,38,39,40,41].
The objectives of our article are to show the internationally accepted methods for estimating of the consumers’ exposure to pesticide residues, testing compliance with national and export market MRLs and considering the level and frequency of residues for setting the priority of commodities in national monitoring programmes. However, we do not deal with the procedures used for estimation/establishing maximum residue limits because they are not based on monitoring data. Moreover, we present the data analysis system which we found useful for the evaluation of the very large number of monitoring results.
2. Methods and Results
The petitioners submit experimental data for supporting their claim for the registration of their pesticide products. The supervised trial data provided with the application can be used for the evaluation of international (IEDI) or national (NEDI) daily intake at the time or shortly after the registration of a pesticide when monitoring data are not yet available. Once a pesticide is regularly applied, the initial dietary intake estimate can be refined based on the results of the monitoring data. However, it should be noted that the monitoring data are normally obtained with multi-residue methods (MRM) determining the parent compound and/or its stable metabolite and do not cover all residues defined for risk assessment purposes [42]. Therefore, an appropriate correction factor should be used that accounts for the ratio of total toxicologically significant residues and the analyte detected by the MRM [43].
The daily intake can be estimated with deterministic and probabilistic methods. However, for the latter, a much larger database is required to obtain realistic results.
2.1. Deterministic Method for the Estimation of Long-Term (Chronic) Exposure
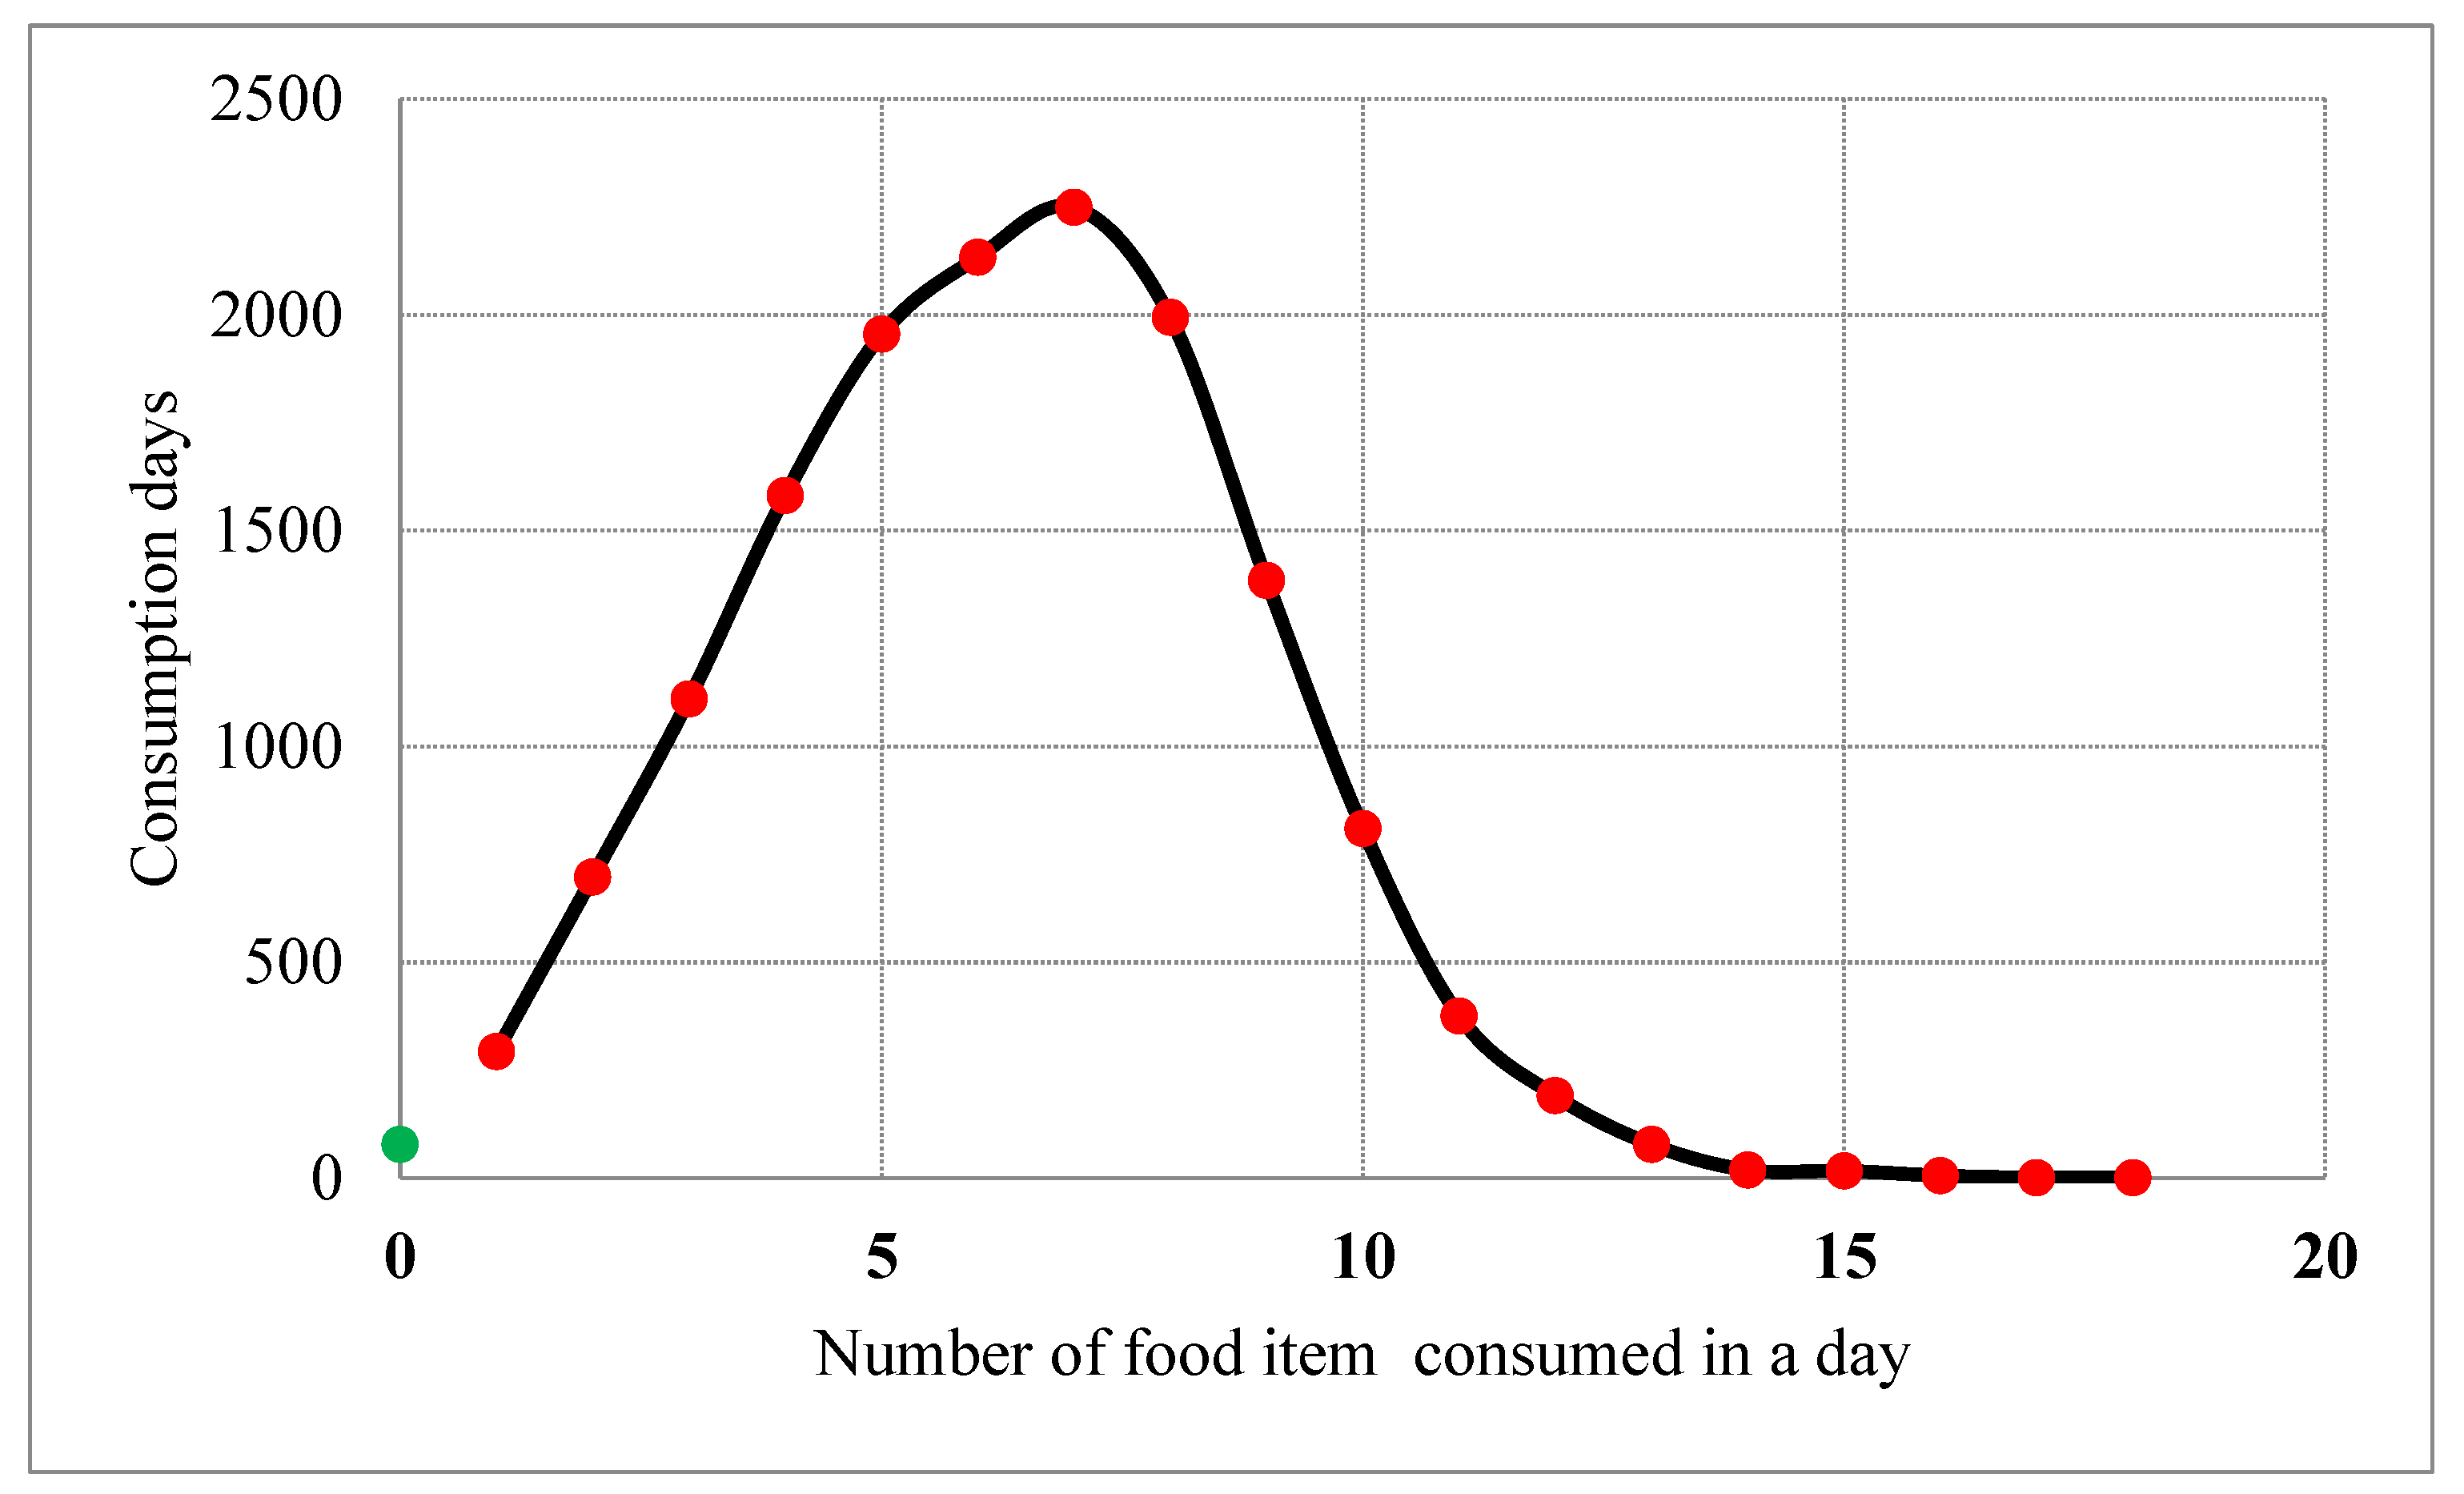
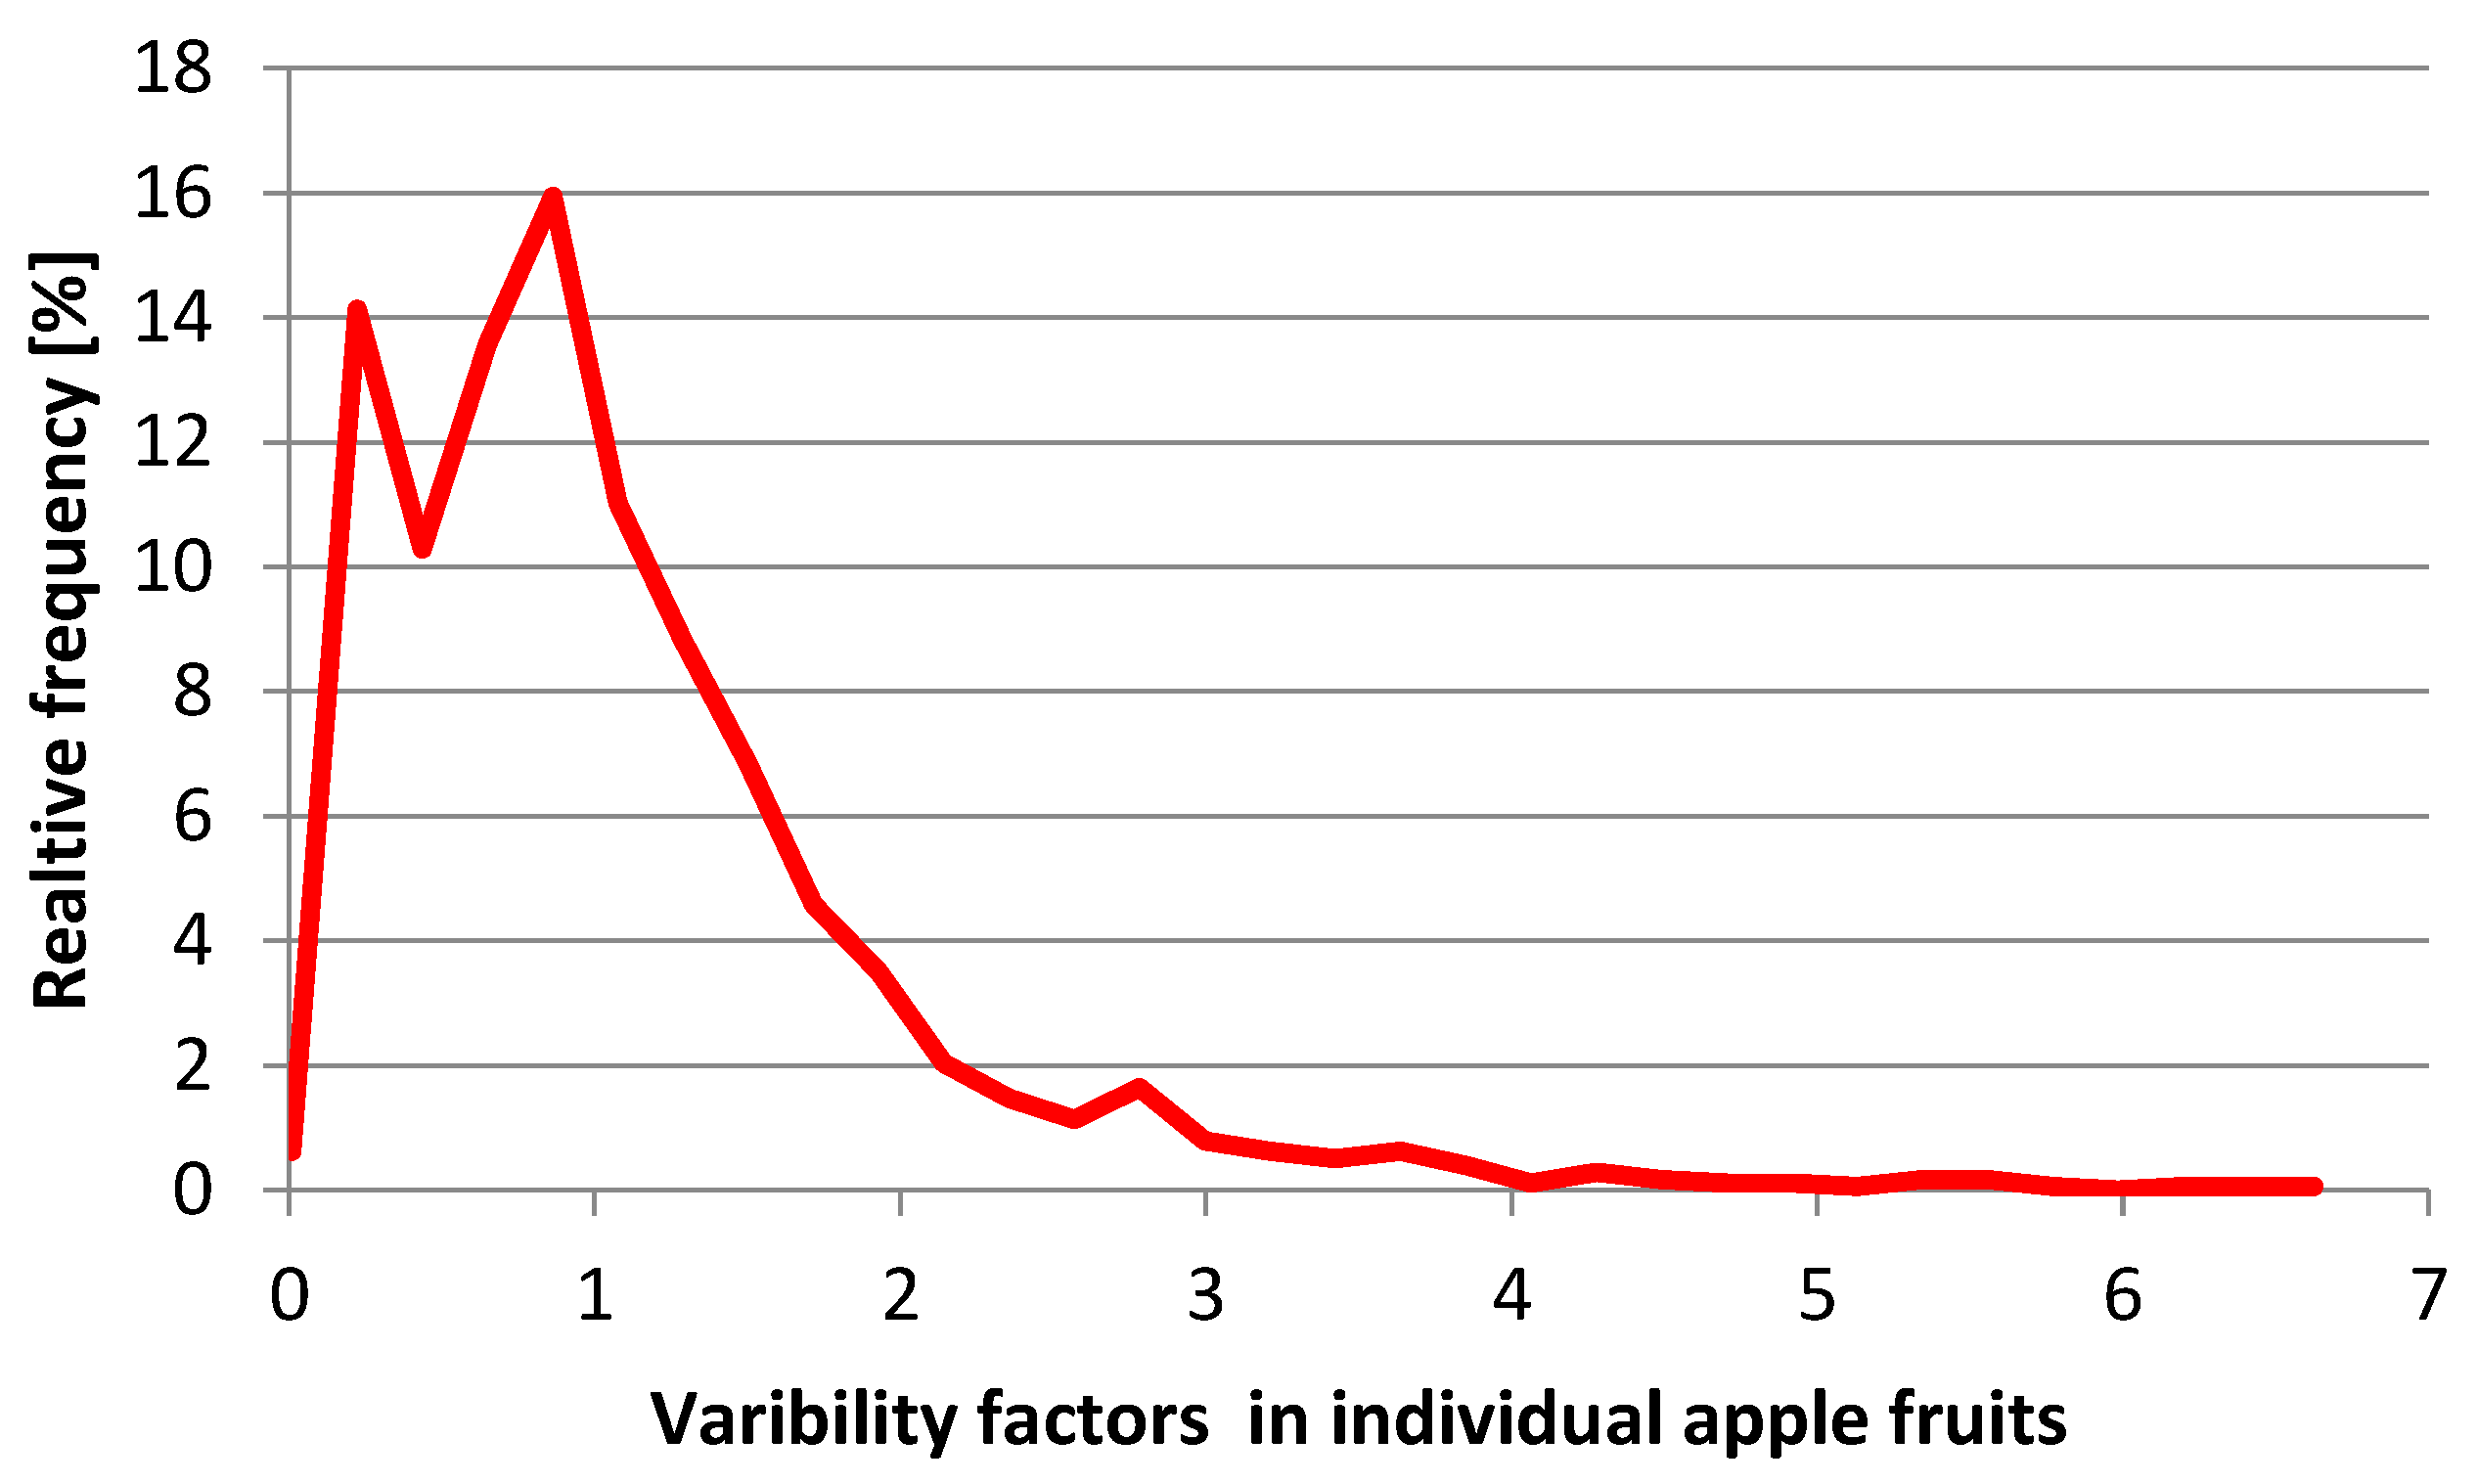
The daily intake is calculated as the product of the average food consumption (Ci, kg food/kg body weight, (bw) and the median or average pesticide residue concentration (Ri, mg/kg). The total dietary exposure (estimated daily intake, EDI, in mg residue/kg bw) is obtained by adding up all intakes from ‘n’ food consumed on a given day for which residue data are available. For instance, the food consumption survey conducted in Hungary revealed (Figure 1) that most frequently 5–8 different fruits and vegetable were eaten by a single person within a day [44].
The median residue obtained from supervised trials (STMR) or the average residue concentration (Ri) from the monitoring programmes are expected to represent the long-term average of actual residue concentrations in the edible portion of the ith food item. The average consumption (Ci) is obtained by taking into account consumers and non-consumers of a food by a given population cluster but does not account for the seasonal products or certain preferences for a food product group. The long-term dietary exposure reflects the average of eaters and possibly includes non-eaters over a lifetime [47].
For the correct use of Equation (1), the following preconditions should be observed [43]:
- The Ri should include all metabolites and degradation products of toxicological concern according to the residue definition for risk assessment purposes. The definition of residues can be found for instance in the list of the Codex MRLs, EC Pesticide database, and USA Pesticide registration documents [48,49,50];
- In case of supervised trials, Ri is the median of residues in the edible portion of the crop [51] obtained from all trials performed according to the maximum dosage and the shortest pre-harvest interval (PHI) registered (the so-called maximum GAP);
- The median residue should be estimated with the reported LOQ values, except when evidence from trials and supporting studies suggests that the residues are essentially zero;
- For evaluation of monitoring data, the nondetectable residues may be counted with LOQ, 0.5 LOQ or 0 leading to upper bound, middle bound and lower bound estimates that are used by EFSA to frame the boundaries of an exposure estimate to pesticide residues [10];
- Since a typically large proportion of samples contain non-detectable residues, the calculation of EDI with 0.5 LOQ values provides a conservative but not exaggerated estimate of the exposure of consumers. In the cases when a relatively large number of random monitoring residue data (>100) are available for a crop, the middle-bound calculation of the average residue can be best applied;
- The residues should be measured in the edible portion of the tested food in contrast to the portion of commodity to which the MRL applies [51];
- Where data are available, the effect of processing and cooking practices should also be accounted for.
The NEDI should be based on the same factors as the IEDI, but the following additional aspects related to the national use pattern of the pesticides and food consumption data can also be considered [46], which would allow a refinement of the NEDI:
- Proportion of crop or food commodity treated;
- Proportion of crop domestically produced and imported (they may contain different kinds of residues);
- Total diet or market basket studies;
- Food consumption data, including subgroups of the population.
The JMPR estimates the international daily intake (IEDI) [52] based on the 17 GEMS/Food Consumption Cluster Diets [53]. Despite many uncertainties and limitations [42], they represent the best available source of data for predicting long-term intake of pesticides on an international level [46]. This model is especially useful for countries where information about national food consumption data is rather meagre [54]. If the national consumption figures are inserted into the template instead of the cluster diet, it will calculate the nation-specific dietary intake provided that no other alterations are made in the template. If consumer age group specific food consumption data are available at a national level, different EDI estimates can also be obtained for different age groups. EFSA developed the PRiMO model based on similar principles [55], incorporating the national food consumption data of member and partner countries collected, applying the uniform methodology [56].
2.2. Deterministic Estimation of Short-Term Intake (STI)
In addition to the average intake—the exposure of consumers occasionally eating large portions of food (LP) containing high residues—the STI should also be part of food safety risk assessment. The short-term intake may be estimated by multiplying the large portion of food consumption with the highest pesticide residue concentration in those foods. The estimated short-term intake (ESTI) is always expressed on a body weight basis for comparison with the ARfD [45]. In the current IESTI-equations, the body weight is normally expressed as the arithmetic mean body weight of the target population. The large portion food consumption (LP, in kg edible portion of food/person) is obtained by taking the 97.5th percentile of a ‘consumer-only’ distribution of the food in question [45,46]. Each food commodity is assessed individually, because it is unlikely that one person consumes large portions from two or more different foods in one day.
During the pre-registration of a pesticide, the highest residue concentration from supervised field trials (HR, in mg/kg) is used to represent the actual high residue concentration. Where the results of monitoring programmes are used, the 97.5th percentile of residues can be applied to represent the HR provided that over 120 samples have been analysed [47]. In this case the 97.5th percentile (the second highest residue value) can be estimated with 95% confidence level. If fewer results are available, the confidence level of the estimation would be lower.
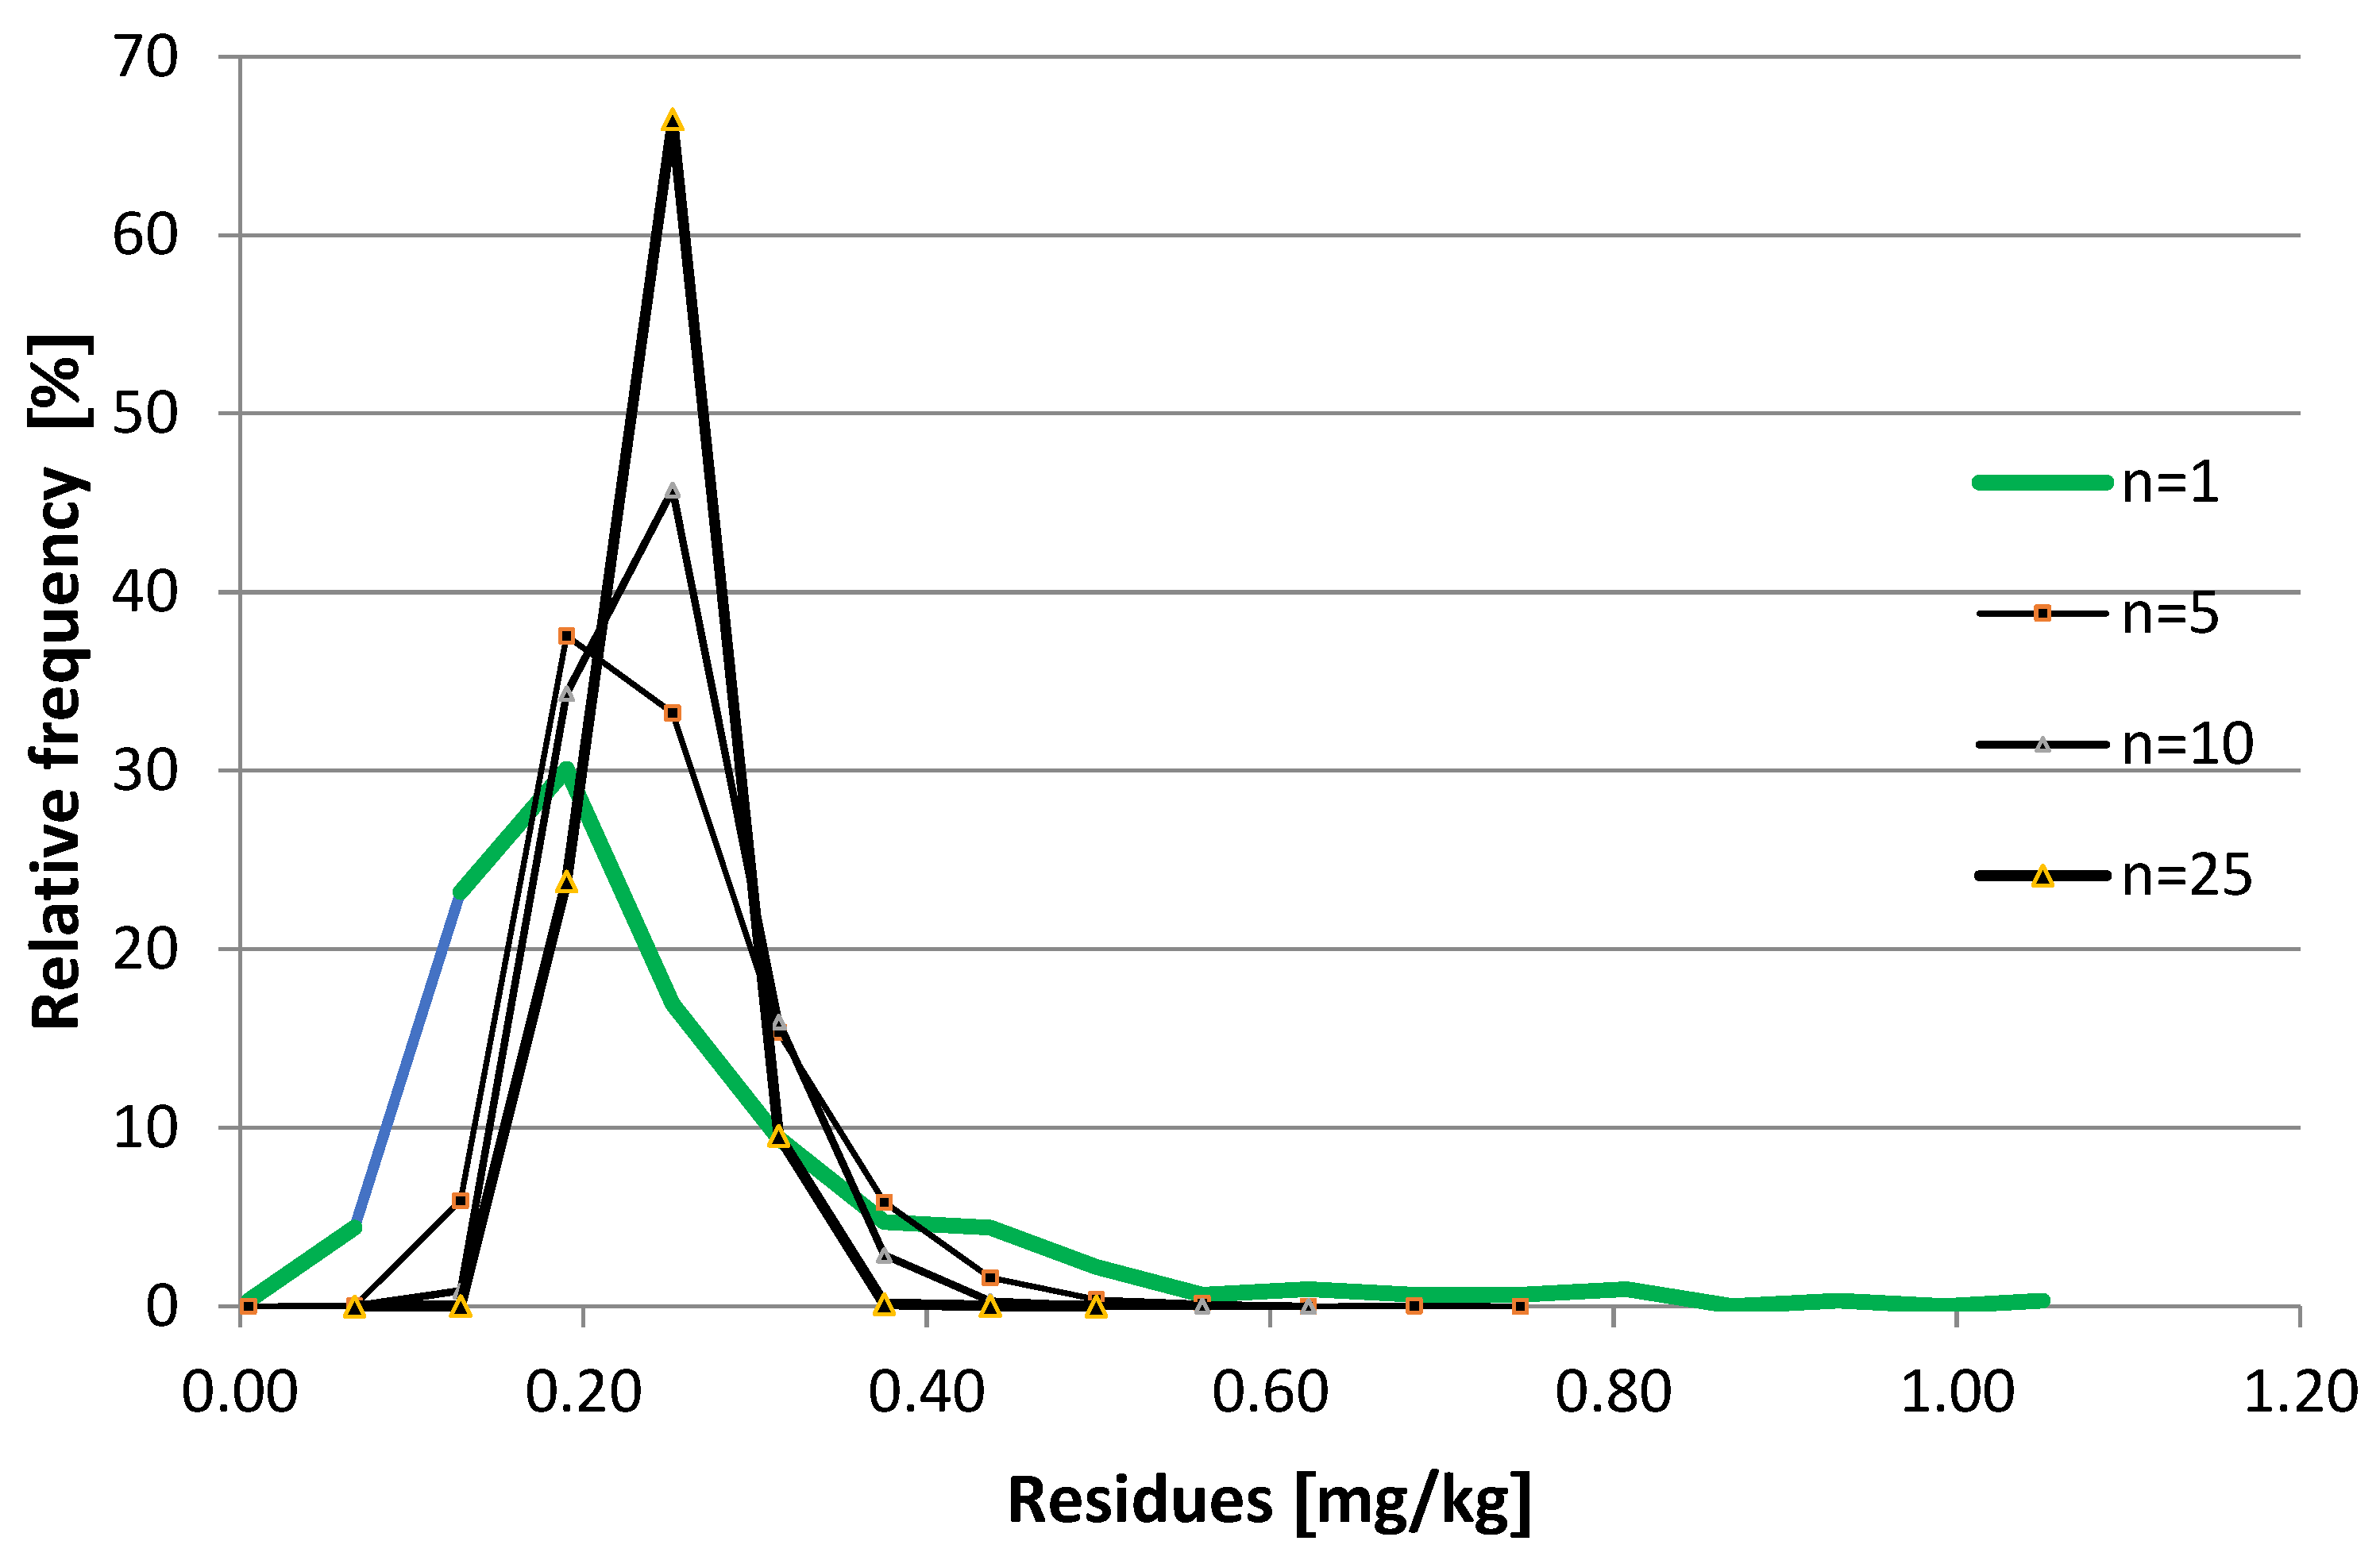
The concentration of residues in individual crop units derived from one lot may vary a hundred-fold, and it can be quite different from the average residue measured in the composite sample [57,58]. In the ESTI calculation, this variability is reflected by the so-called ‘variability’ factor (ν) that gives the ratio between the 97.5th percentile of the residues in crop units and the average residue in the sampled lot of the commodity represented by the average residue in the composite sample taken from that lot. The composite samples derived from supervised trials, usually consist of 12–25 individual units [43] and therefore provide a robust estimate for the average residue concentration of the lot under investigation. An example of the distribution of residues in primary and composite samples is shown in Figure 2. The distribution of residues in primary samples is obtained from random sampling the crop units or single increments from a single field [57]. The composite samples are obtained from repeated random sampling with replacement from the primary residue population [59,60].
Based on over 20,000 residue data in various crop units, the JMPR decided to use the rounded average of 3 as the variability factor [61]. EFSA evaluated a portion of the same residue dataset and concluded that the upper tail of the distribution of variability factors should be used [62]. In the EFSA evaluations a variability factor of 5 is applied for food commodities with a unit weight (Ue) of more than 250 g (i.e., cauliflower). For mid-sized products (i.e., carrots, kiwi fruits (green, red, yellow), onions, orange, pears and potatoes) with a unit mass anywhere between 25 and 250 g, a variability factor of 7 is applied; no variability factor is used for commodities with unit masses less than 25 g and composite or animal products (i.e., dried beans, rice, rye, bovine fat or poultry fat) [10,62].
Considering the size of individual crop units, the IESTI is calculated for three different cases [43,45,46].
In Case 1, the residue in a composite sample (raw or processed) reflects the residue level in a meal-sized portion of the commodity (unit weight of the raw agricultural commodity is below 25 g). It also applies to meat, edible offal and eggs, and for grains, oilseeds, and pulses treated post-harvest.
In Case 2a, the unit size of the edible portion, Ue, is less than the LP. The first unit contains the high residue (HR) multiplied by the variability factor, while the other units making up the LP contain the average residue measured in the composite sample.
In Case 2b, the mass of edible portion of the raw crop unit, Ue, exceeds the large portion weight. The variability factor (ν) is applied to the average residue in the composite sample to estimate the residue level in a high-residue unit.
Case 3 is used for processed commodities and those products that are likely bulked or blended before food portions are taken, such as flour, vegetable oils and fruit juices, milk and dairy products. It also applies to grains, oil seeds, and pulses treated pre-harvest. In such cases, the median residues obtained from the supervised trials or the average residues derived from monitoring programmes should be used.
Attention is drawn to the general limitations of the monitoring data that is normally obtained with multi residue methods determining the parent compound or its stable metabolite and not the residues defined for risk assessment purposes. Consequently, the estimated EDI or STI are lower than the real figures. For instance, the JMPR reports [63], the list of Codex MRLs [48] and some national regulatory agencies [64,65] provide the residue definitions for monitoring as well as for risk assessment purposes.
2.3. Probabilistic Modelling of Exposure of Consumers
In principle, the IEDI/NEDI concept for long-term dietary exposure could also address multiple compounds, but the variation in the co-occurrence of residues cannot be described by using only mean concentrations as the input parameter. Similarly, the IESTI-equation can be used for the assessment of multiple compounds found in one specific sample. However, the whole range of food items consumed within one day and the possible residue combinations exceeds the IESTI-concept dealing with the consumption of only one food commodity. Such situations can be addressed with probabilistic methods [47]. The major advantage of probabilistic methodology is the consideration of all available data, including the full range of values and the variability of each parameter.
For the probabilistic calculation, random samples are taken with replacement from the whole datasets of food consumption [kg edible portion of food/kgbw], the residues detected in the given food [mg/kg], the mass of crop units and the distribution of variability factors (ESTI only). From each of the randomly selected values, an intake [mg residue/kg bw] is calculated. The random sampling is repeated many times to obtain the distribution of intakes. The upper percentile 97.5–99.9% of intakes [66] are compared to the corresponding toxicological reference values (ADI, ARfD).
In the USA, the first probabilistic methods [67] and guidance to assess the cumulative dietary risk were established in 2002 [68]. In Europe, the Dutch National Institute for Public Health and the Environment (RIVM) developed the Monte-Carlo Risk Assessment tool (MCRA) [69,70,71].
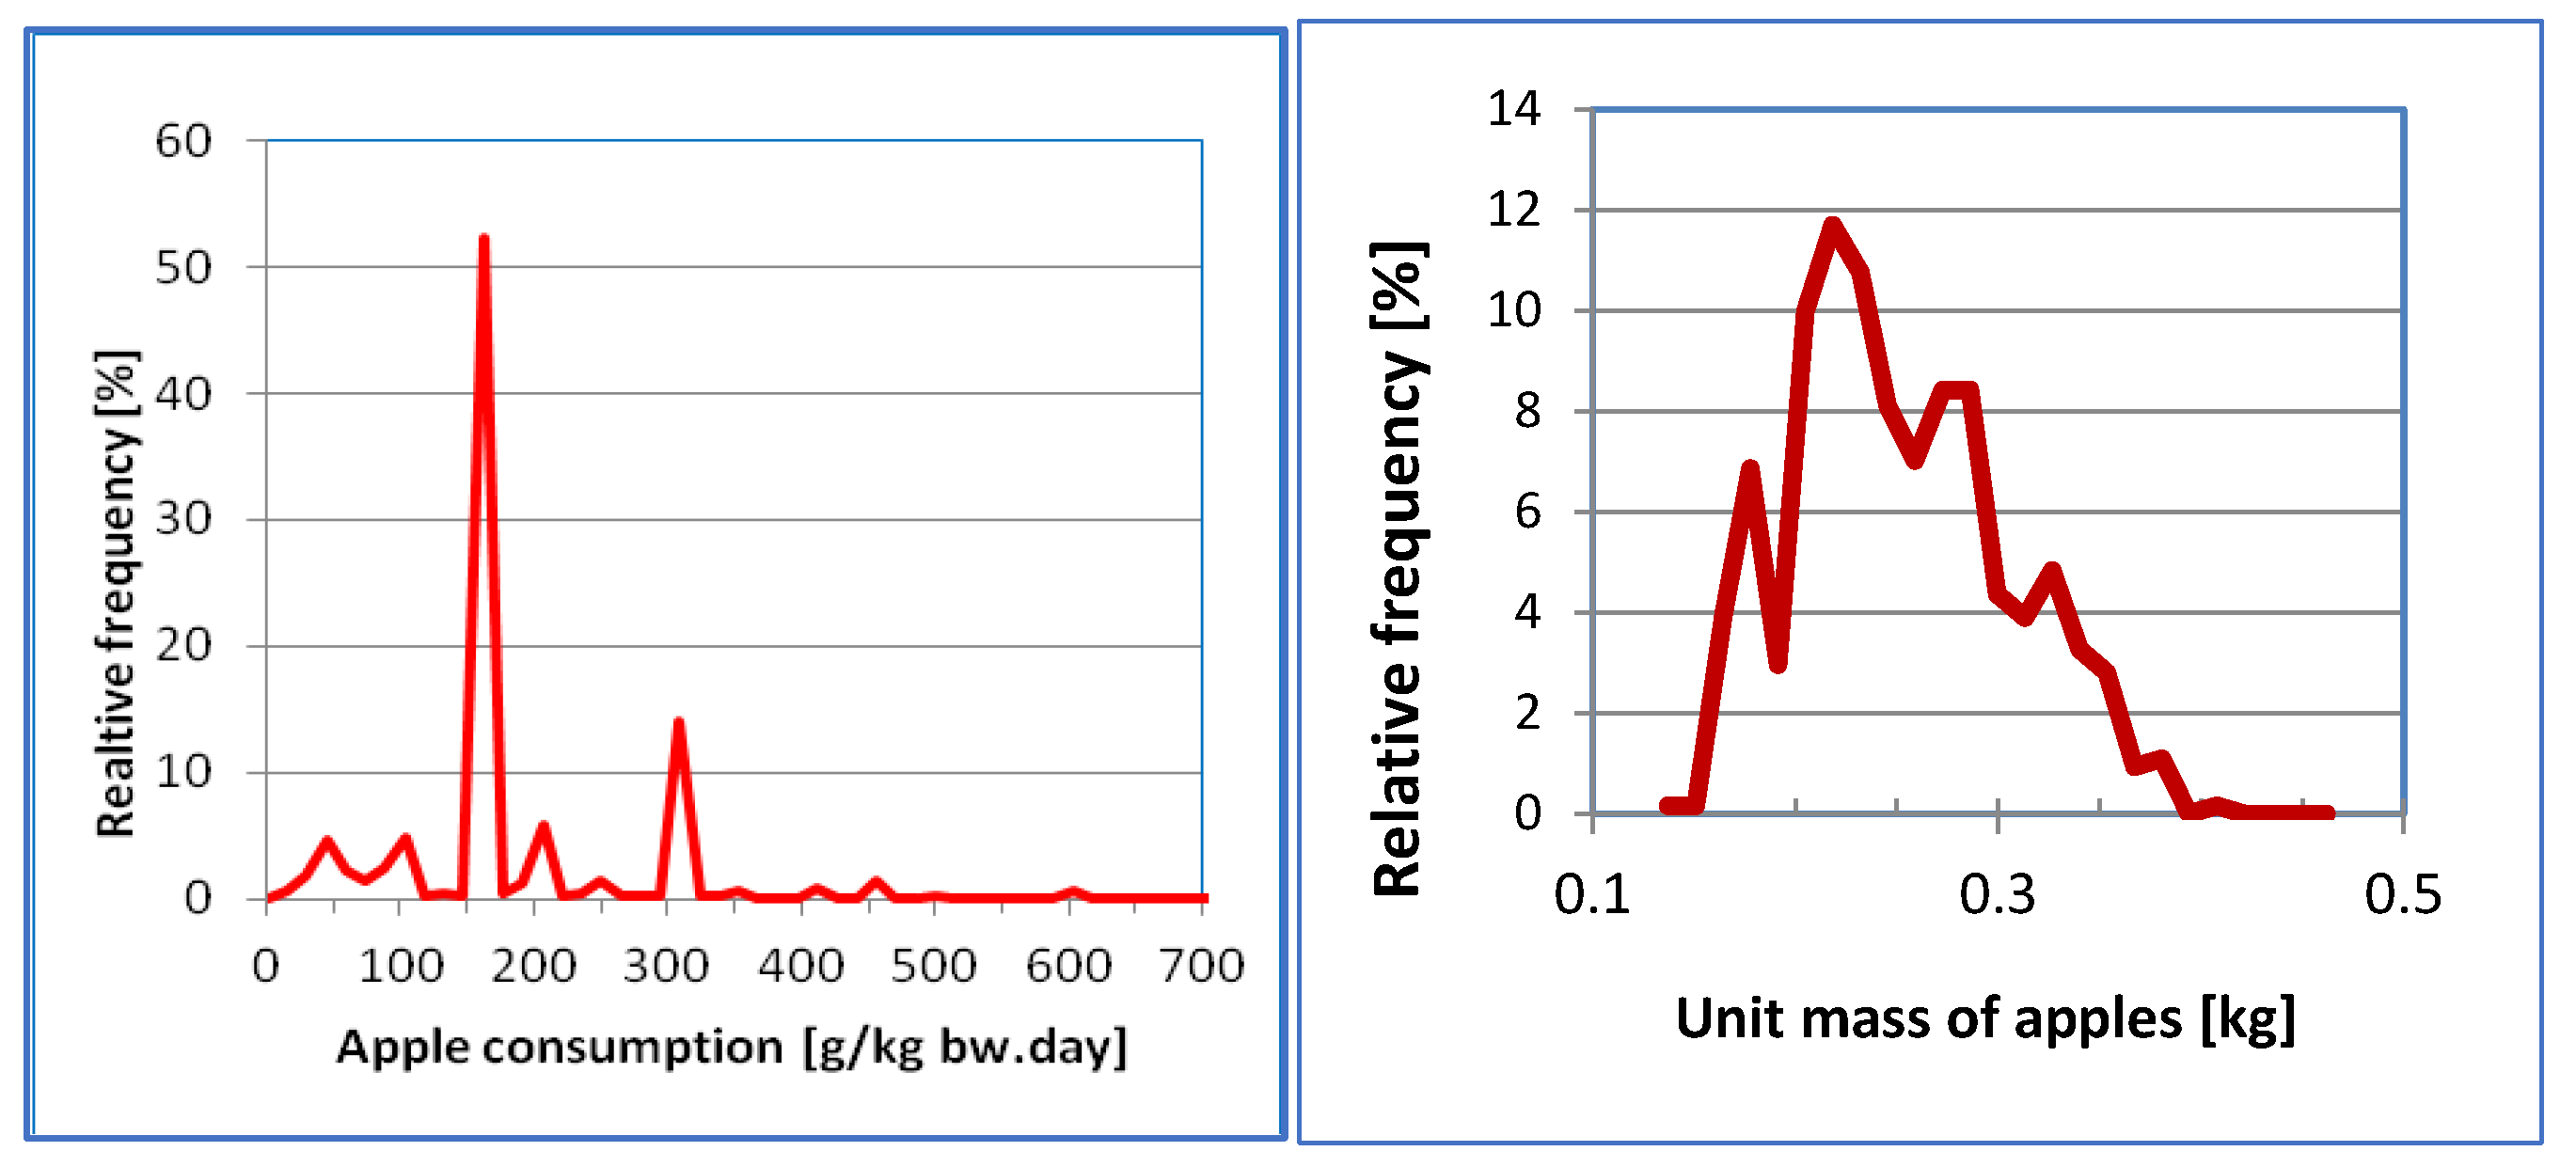
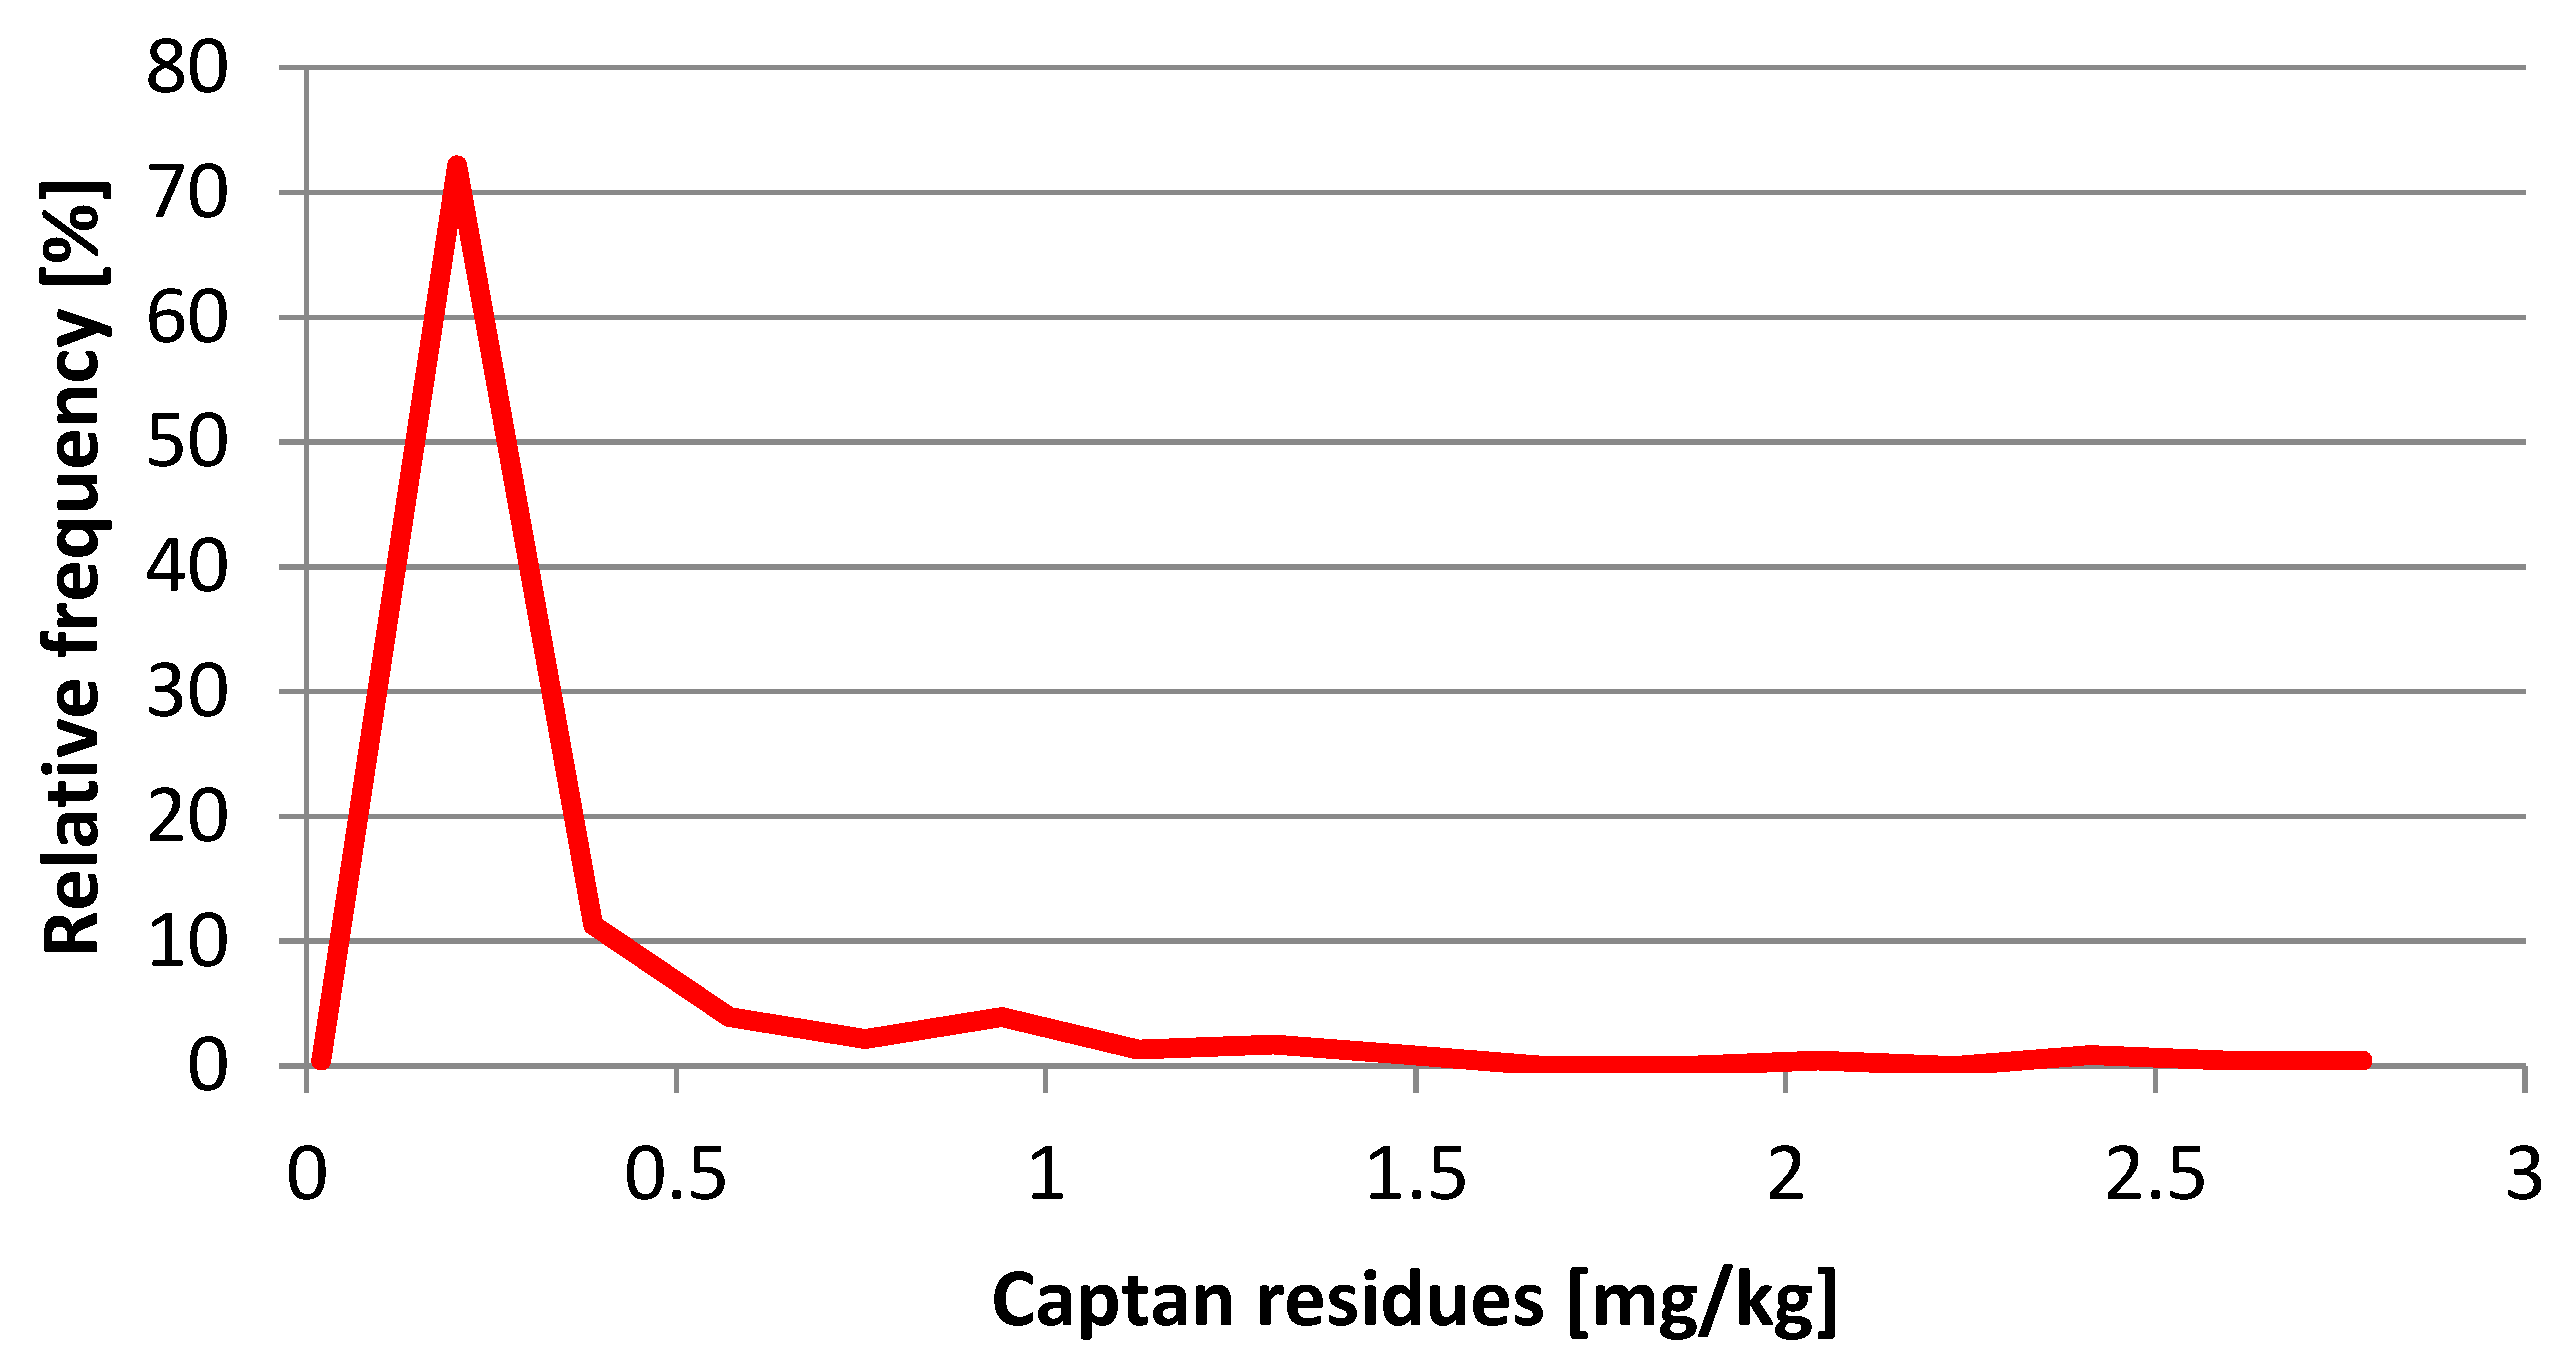
Zentai [72] illustrated the procedure with the captan exposure resulted from apple consumption. The acute reference dose had been established for women of childbearing age, therefore the exposure calculation for this population was performed. The relative frequency distributions of input parameters are shown in Figure 3, Figure 4 and Figure 5.
The apple consumption data were obtained from the national food consumption survey, including 3-day records of 4992 people [73]. The individual mass of food items was measured in the central stores of large supermarket chains [72,74]. The captan residues were derived from the Hungarian monitoring programme during 2005–2011 (unpublished). The variability factors were calculated from the results of a targeted sampling programme [57,58].
The estimated short term captan intake of the nth consumption day of a consumer eating an apple purchased at one time from the same lot was calculated according to Equation (6). Under this condition, the residue content of apples is represented by the mean residue in composite samples analysed:
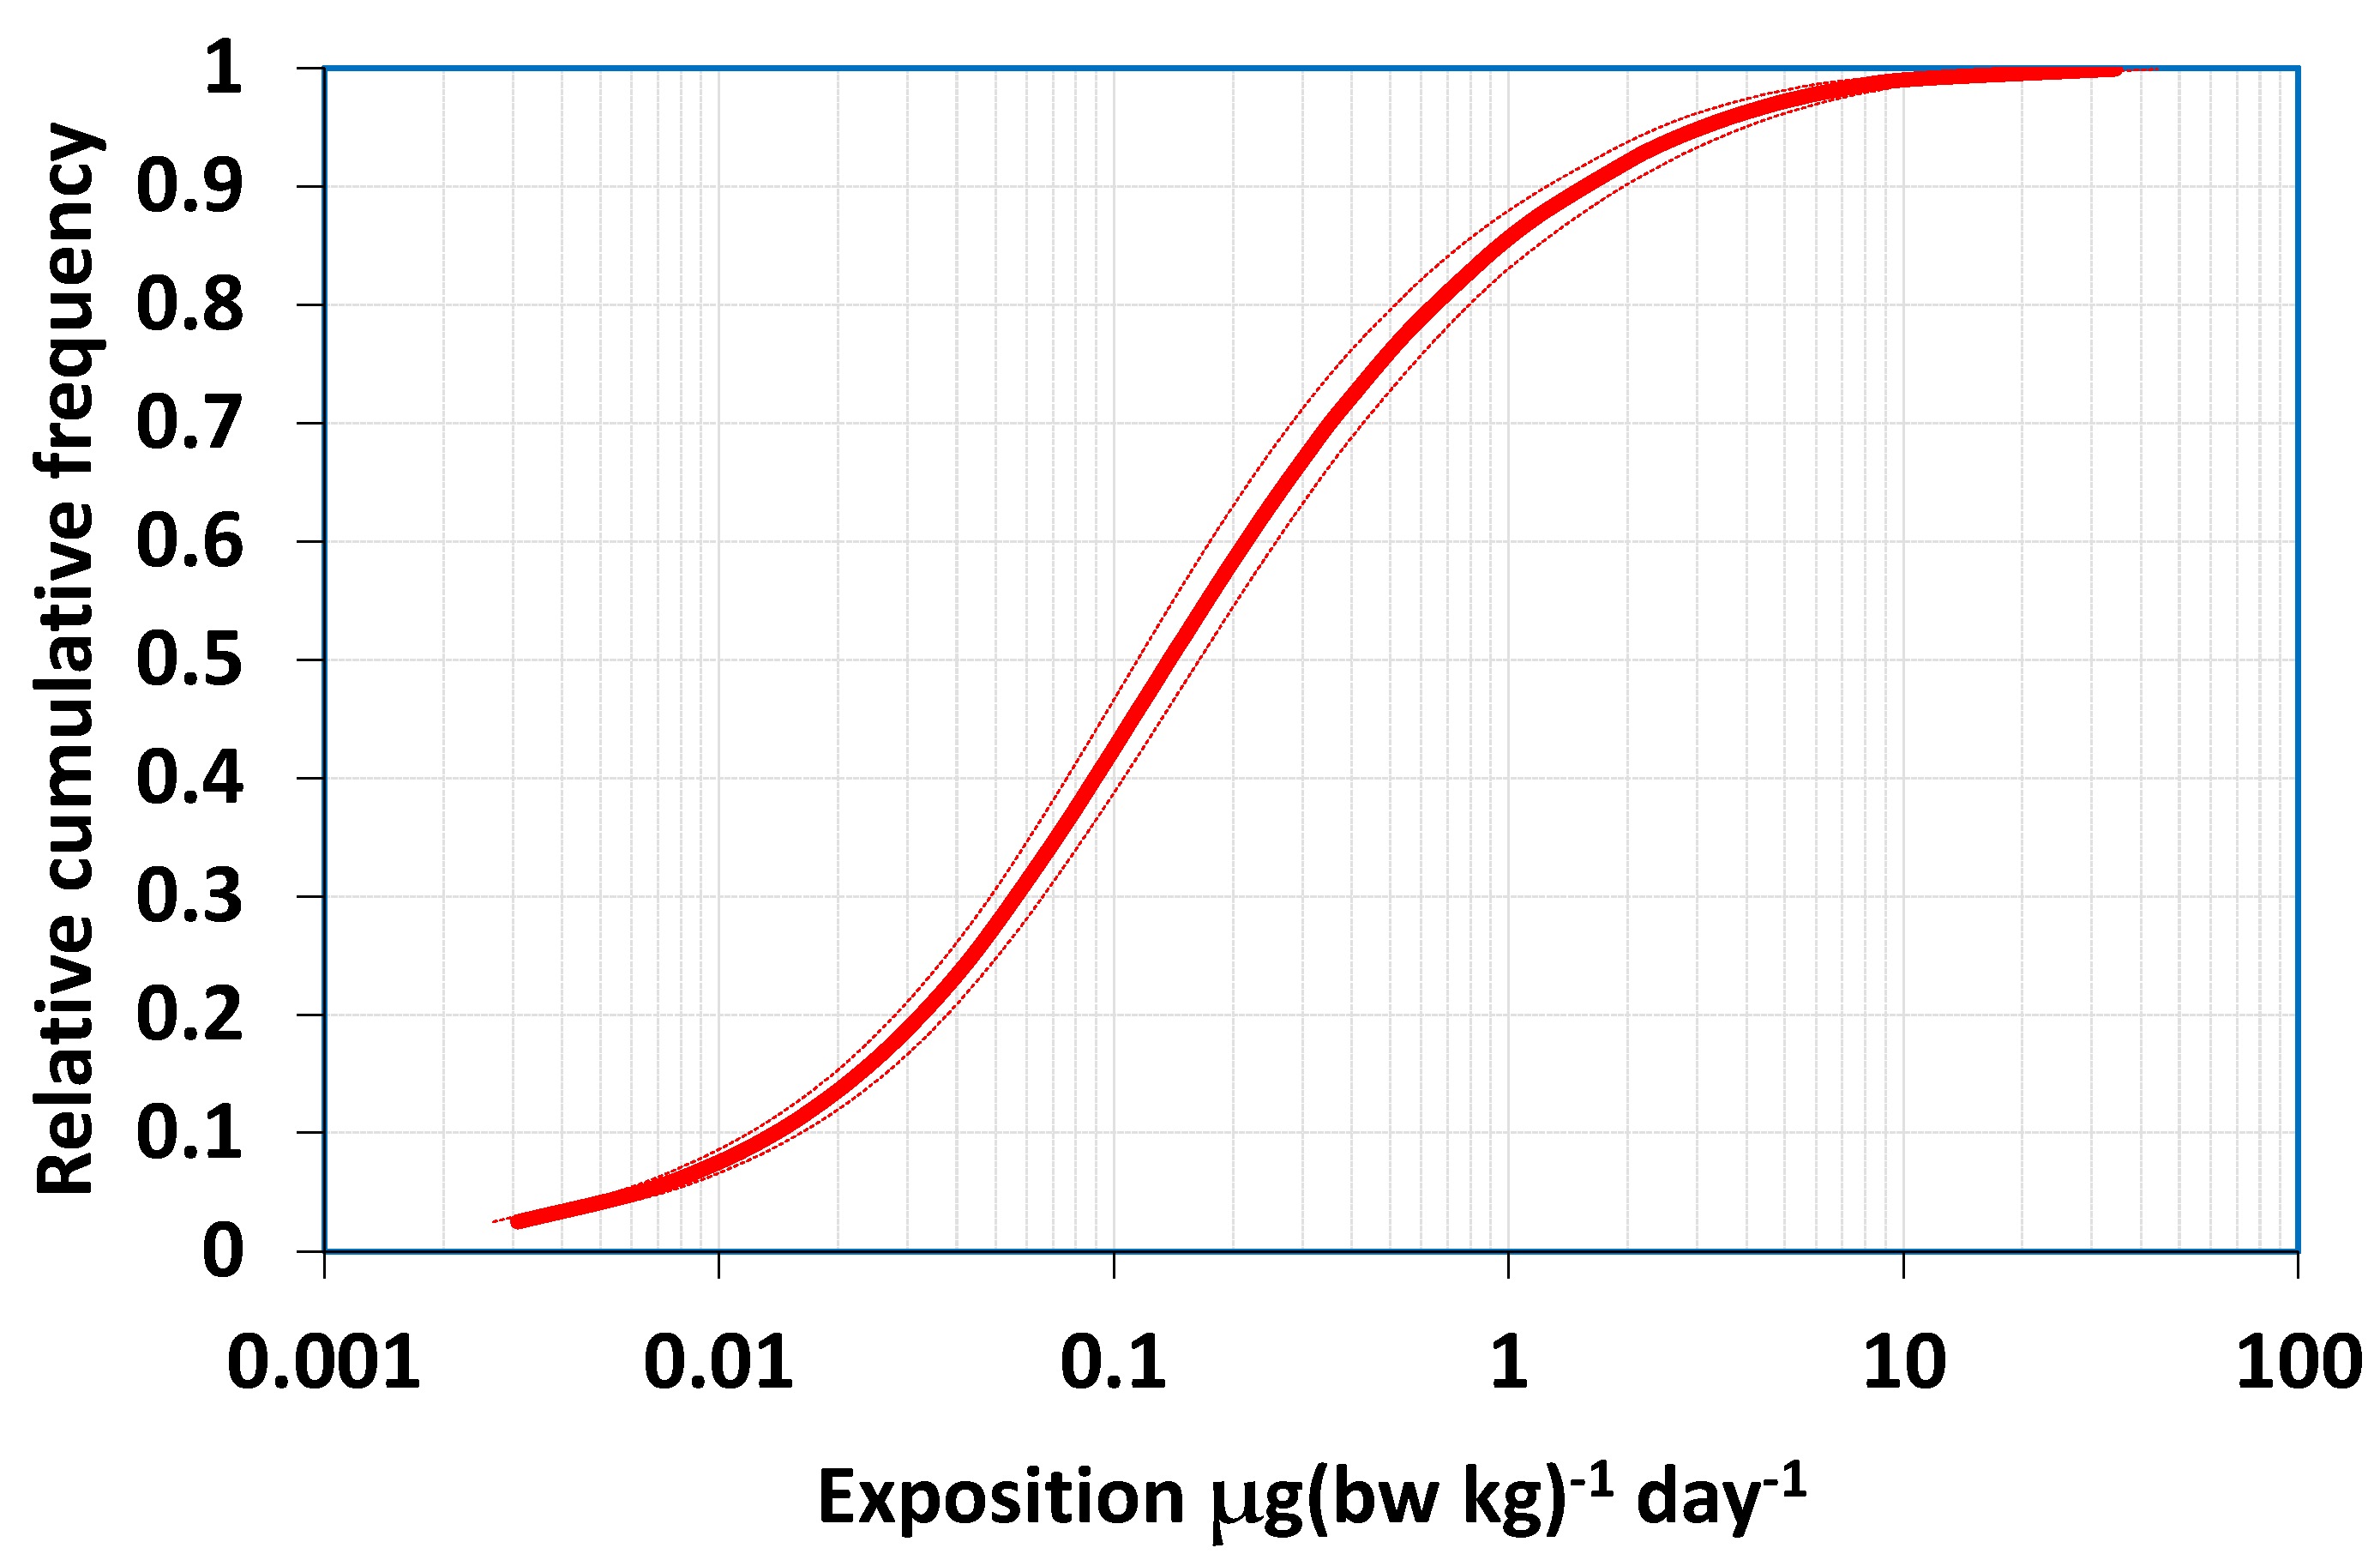
In Equation (6), the Rk is the captan residue in the kth element of the apple composite samples consisting of K fruits, νi is the variability factor randomly selected from the 1769 variability values, and m1 is the unit mass of the first apple that the nth consumer had eaten on the given day. The m1 +…mL is equal to the daily apple consumption on the nth consumption day. The last apple portion (mL) can be a fraction of a whole apple for the calculation. The random sampling was carried out from the populations of the input parameters with replacement 500.000 times. Sampling with replacement is necessary to keep the size of the dataset constant. The cumulative frequency distribution of calculated intakes is presented in Figure 6, which also shows the 95% confidence intervals around the intake.
The mathematical relationships are also given for the calculation of ‘refined’ probabilistic exposure estimation [74], which can also take into consideration the raw material proportions of complex foods, the effect of processing operations on the pesticide residue concentrations in the raw product, and the pesticide residue concentrations in the portion of consumed produce.
2.4. Cumulative Exposure Assessment
The monitoring data reported by 30 countries within the coordinated and national monitoring programmes in 2020 [10] revealed that multiple residues were detected in 27.2% of the samples, while 30%, 22.3%, 4.1%, 0.5%, 0.02% of samples contained 0, 1, 5, 10 and 15 different residues, respectively. In total, 18 and 31 residues were detected in 1 strawberry [10] and honeysuckle sample [75]. Multiple residues in one single sample may result from:
- The application of different types of pesticides (e.g., application of fungicides or insecticides against different pests or diseases);
- The use of different active substances for repeated treatments aiming at avoiding the development of resistant pests or diseases;
- The uptake of persistent residues from soil treatments used in previous seasons;
- Spray/dust drift to fields adjacent to the treated fields.
In addition to multiple residues resulting from agricultural practice, multiple residues may also occur because of mixing or blending of products with different treatment histories at different stages of the supply chain and contamination during food processing. It should be noted that when lots containing different residues are mixed prior to sampling and multiple residues are detected in a composite sample, it does not mean that every crop unit contains all detected pesticide residues. According to the present EU legislation, a sample containing multiple residues remains compliant if each individual residue concentration detected conforms to the corresponding MRL [76].
Those pesticides that have the same mechanism of toxicological action may have a cumulative effect that should be accounted for in the correct evaluation of the exposure of pesticide residues. For addressing the mixture toxicity of multiple compounds, US-EPA started with an approach to group substances according to their chemical classes [67]. EPA considered the 99.9th percentile of acute exposure from food, estimated by probabilistic analysis, as a threshold for a safety standard [68]. EFSA applied a different concept by defining cumulative assessment groups (CAG) based on their toxicological effect, irrespective of chemical similarity. Altogether, 400 active substances were screened and organophosphates, N-methyl carbamates, organochlorines, macrocyclic lactones, pyrethroids, neonicotinoids or phenylpyrazoles were divided into 7 subgroups [77]. The different toxicities of compounds are accounted for by their relative potency factors. The relative potency is defined as the ratio between the toxicological relevant dose of the index compounds (IC) and each compound within the group.
Due to the nature of the residue levels and food consumption data, probabilistic methods are generally used for the cumulative exposure assessment. The major advantage compared to the deterministic methodology is the consideration of all available data, including the full range of values and variability of each parameter. Caldas [78] applied MCRA 3.6 system developed by RIKILT-Institute of Food Safety in The Netherlands [69,70,71] for assessing the cumulative exposure of consumers. The relative potency factors were reported for 25 organophosphorus compounds. Zentai [44] used the relative potency factors reported by Caldas et al. [78] and Boon et al. [79] for the exposure assessment of a Hungarian population. The residue values of the 24 organophosphorus pesticides were expressed in acephate equivalents as the reference compound. The cumulative residue content of a sample expressed as acephate equivalent (Equation (7)) was calculated by summing up the adjusted residue values of acephate, azinphos-methyl (am), chlorpyriphos (cp), etc…:
Racephate,eq = Racephate × 1 + Ram × RPFam + Rcp × RPFch + …
Up to 5 million residue food consumption combinations were calculated with an ordinary laptop, applying a self-developed random sampling programme. The findings of this study confirm that probabilistic modelling can also be performed with minimum hardware capacity [74].
3. Risk Characterization
A hazard quotient (HQ) for a single chemical and the hazard index (HI) for a mixture of chemicals were first described as approaches for risk characterization by the EPA [67]. The hazard quotient (HQ) is defined as the ratio of exposure to an appropriate reference dose, such as the ADI or ARfD.
The hazard index, HI, is defined as the sum of the hazard quotients of the individual components of an assessment group. Each of the hazard quotient is calculated as the ratio of the exposure to a chemical and the respective reference value (i.e., ADI, theoretical daily intake, TDI).
When the HQ or HI exceeds 1, a dietary risk may arise from a single substance or a mixture of compounds. When the results are interpreted, the inevitable uncertainties in the estimated EDI and ESTI values should always be considered [42]. If reference values are not available for all components, the lowest available reference value (i.e., for the most potent chemical in the assessment group) can be used, assuming that all of the components with missing reference values are equally potent [80]. HQ and HI have been used to characterize risk after various exposure scenarios [30,36,37]. However, both approaches have a significant limitation in the way they are used. On the other hand, the advantages of the HI approach include its relatively easy and rapid application, its comparatively broad empirical foundation, and the fact that it often provides a conservative risk estimate for combined exposures [81].
There are several limitations in the accurate estimation of the HQ and EDI:
- If it is calculated from the residues measured in a single or a few food items, the calculated EDI may underestimate the real intake because the same pesticide can be applied in many crops;
- During the monitoring programs the residues are usually measured in the specified portion of the commodity taken from the market or treated fields, while its edible portion may contain substantially lower residues;
- If specific field treatments are carried out to generate residue data, the samples should always be taken at the authorized pre-harvest interval following the treatment with the maximum permitted dosage;
- Summing up the HQ values of different pesticide residues measured in different samples can only be justified if they come from the same CAG and therefore they have the same toxic effects (e.g., cholinesterase inhibition, triazole group of pesticides, phthalates). In this case, their cumulative effect can be taken into account [80,81,82,83,84], otherwise the sum of HQ-s would lead to wrong conclusions [85];
- To define the boundaries of the uncertainty of the estimated median residue, a minimum of eight trials should be performed [42].
If any of the previously listed preconditions are not satisfied, the limitations of HQ or EDI calculations should be pointed out in the evaluation of the results.
4. Quality Assessment of Marketed Products
For the evaluation of the quality of a tested commodity considering the presence of multiple residues, the quality index (IqR) was introduced by Arienzo and co-workers [88]. The quality index is calculated for one commodity as the sum of the ratios between the residue concentrations measured in the tested sample and the corresponding MRLs.
The authors suggested to use IqR to subdivide fruits, vegetables and cereals into four classes of quality: excellent (IqR: 0), good (0–0.6), adequate (0.6–1) and inadequate (>1). Moreover, they underlined that the IqR is not a toxicological criterion, but it must be related to the quality of the product with respect to pesticide residues. The quality index was used to characterize the tested vegetables for instance by Mac Loughlin et al. [16], Ramadan [18], Ngabirano [40], and Gad Alla [54].
5. Number of Samples Required for Food Safety Risk Assessment
There is no optimum number of samples to be taken. The frequency of violation rate of pesticide residues, the production volume and value/quantity of exported commodities can be primarily considered. There are several methods for the calculation of the number of samples to be taken. However, most of them are only applicable for (assumed) normal distribution. Extensive studies [59,86,87] on the field-to-field variation of pesticide residues based on the analyses of composite samples revealed that it is strongly skewed and cannot be properly described with parametric functions. Therefore, the sample size calculation based on the principle of binominal distribution is the best choice, as it does not assume any distribution. The EU Coordinated monitoring programme [89] specifies 642 samples for each commodity pesticide residue combination, which allows for the detection of a sample containing pesticide residues above the limit of determination (LOD), with a certainty of more than 99%, provided that not less than 1% of the products contain residues above that limit. The samples, divided among member states, should be analysed within 3 years. Sieke and co-workers [90] applied the same principle and suggested analysing 188 samples, aiming for the 98% double-sided coverage of the 97.5th percentile with 95% confidence. The authors estimated a sample size of 94 to characterise a mean value with a ratio of 1:2 of mean and standard deviation and a certainty of 95% with a relative estimation error of 35%. The Codex Sampling Guideline [8] and the USDA GLs [91] provide a simpler calculation that can be more easily understood and applied. The principle is briefly described hereunder.
Let βv be the probability that a random sample contains a residue above the allowed limit (e.g., MRL). Then, the proportion of samples at or below the selected limit, βp, is 1-βv. The number of random samples (n) required for finding at least one value above a selected percentile (βp) of the parent population (e.g., residues in mango samples taken in packing houses) with a specified probability level (βt) is calculated with the following equations:
It is important to note that Equation (11) provides correct information only if the following preconditions are satisfied:
- The sampling target is accurately defined, and all of its elements can be the subject of sampling (e.g., all packing houses dealing with mango in the targeted area are accounted for in advance);
- Before sampling starts at a given day, the available individual lots in the packing house can be accessed and counted;
- The individual lots can be identified (lots are not mixed) and one composite sample represents one lot;
- The lots to be sampled are selected by drawing random numbers without replacement, that is, one lot shall be sampled only once; it also means that the produce of the same farm shall not be sampled at the next sampling occasion but may be sampled during different sampling periods (main season, off-season);
- The number of lots to be sampled (N) during the sampling period is much larger than the number of samples (n) calculated with Equation (10).
The violation rate (βv) is equal to 1 − βp. For example, the number of samples required for detecting a residue above a specified concentration at least in one sample at various violation rates is given in Table 2 for large N. Table 2 indicates, if we target verifying that 98% of our lots would comply with the MRLs of pesticide residues being in the samples with a 95% probability, we would need to analyse 149 samples. Moreover, if we would like to be 99% sure that no more than 2% of our lots contain residues above the MRL, we should analyse 228 samples and detect residues exceeding the MRL in only one sample.
The same principle can be applied [92] for testing the presence of unauthorized pesticide residue. If we want to be sure that no more than 5% of the samples contain that substance above the LOD with 95% confidence, 59 samples must be analysed in a range of matrices, and detectable residue must not be any of them.
6. Testing Compliance with the MRLs
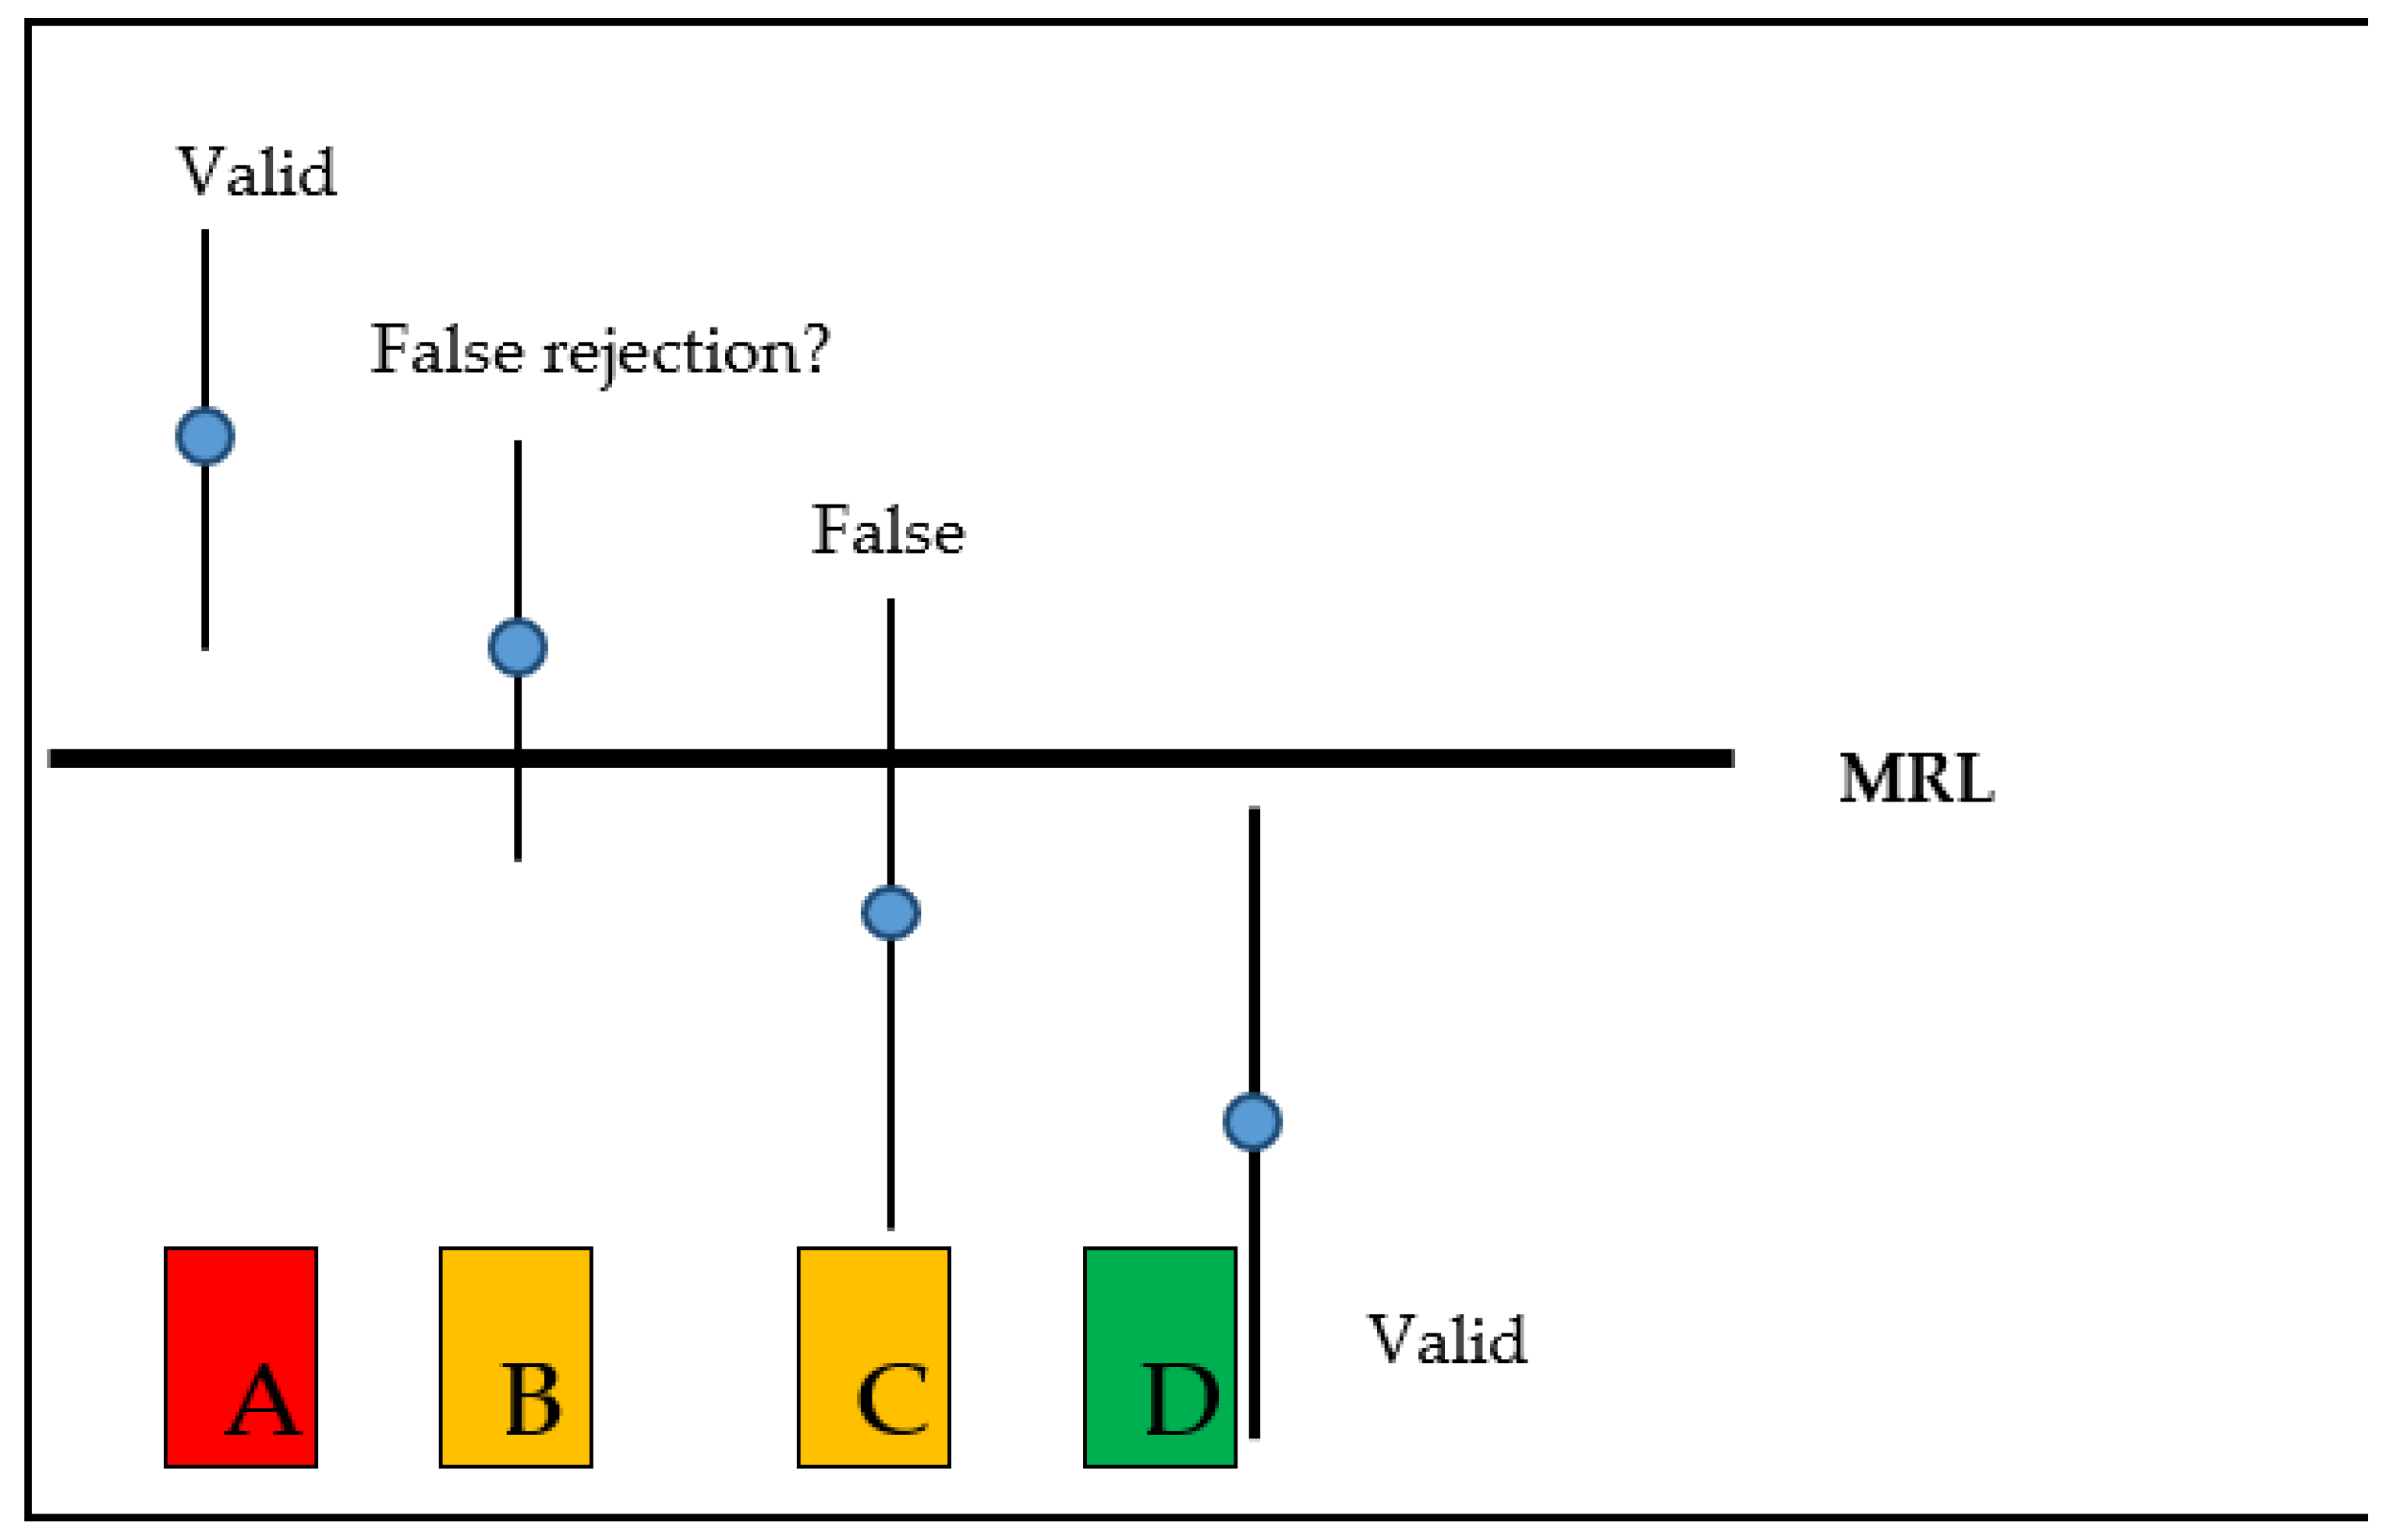
A correct assessment of compliance with legal limits can only be made if the uncertainty of the measured residue concentrations is taken into account. The uncertainty of measured residues shall be considered both in the cases of controlling the residues in marketed commodities and in products intended for export. However, the two situations are entirely different [92,93]. The basic situations are illustrated in Figure 7 [94].
Case A: the measured residue and the lower limit of 95% uncertainty range are above the legal limit. The sampled product is non-compliant.
Case B: the measured residue is above the legal limit, but the lower limit of 95% uncertainty range is below the legal limit; the situation is uncertain.
Case C: the measured residue is below the legal limit, but the upper limit of 95% uncertainty range is above the legal limit; the situation is uncertain.
Case D: the measured residue and the upper limit of 95% uncertainty range are below the legal limit. The sampled product is clearly compliant.
For cases B and C, a decision can only be made if the decision rules are pre-defined. In the absence of a decision rule for such cases, the conclusion must be in doubt. In these cases, the acceptance or rejection depends on the national legislation because there is no Codex guidance values for such cases. The Codex Guidelines for settling disputes suggests that the trading partners should agree in advance on the acceptance criteria [95,96].
6.1. Testing Commodities in the Local Market Either Locally Produced or Imported
The same procedure is applied for both the locally produced and imported commodities. It should be noted that the maximum residue limit (MRL) [97] refers to the average residue in the specified portion [51] of the composite sample. The mass of the sample and the number of primary samples included in it should comply with the Codex Standard [8] or Commission Directive 2002/63 [97] (which is practically equal to the Codex Standard). The locally produced or imported product complies with the MRL if the following inequality stands:
where CR is the residue measured in the composite sample taken from the inspected lot and MRL is the maximum residue limit for the given pesticide-commodity combination. Among laboratories, the reproducibility default CVL in the EU is 25% (0.25) [98]. It means that EU laboratories will reject a lot if the residue concentration is >2*MRL. This is a correct practical principle to consider the uncertainty of measurement results as it will lead to the rejection of a lot that contains residues at the EU MRL only in 2.5% of the cases. However, the laboratories monitoring the pesticide residues in the local market should apply their own inter-laboratory reproducibility, CVL, value which should not be larger than 25% when deciding on the compliance of locally marketed products if they want to apply the R > 2*MRL criterion.
6.2. Testing Commodities before Export or Placing Them on the Local Market
Due to the large, often hundredfold [57], within field (lot) variation of residues in crop units or primary samples, the measured residues will inevitably vary when composite samples complying with relevant standards [8,97] are taken repeatedly from a single lot. The detected residues would be similar in very rare cases in independently taken replicate samples.
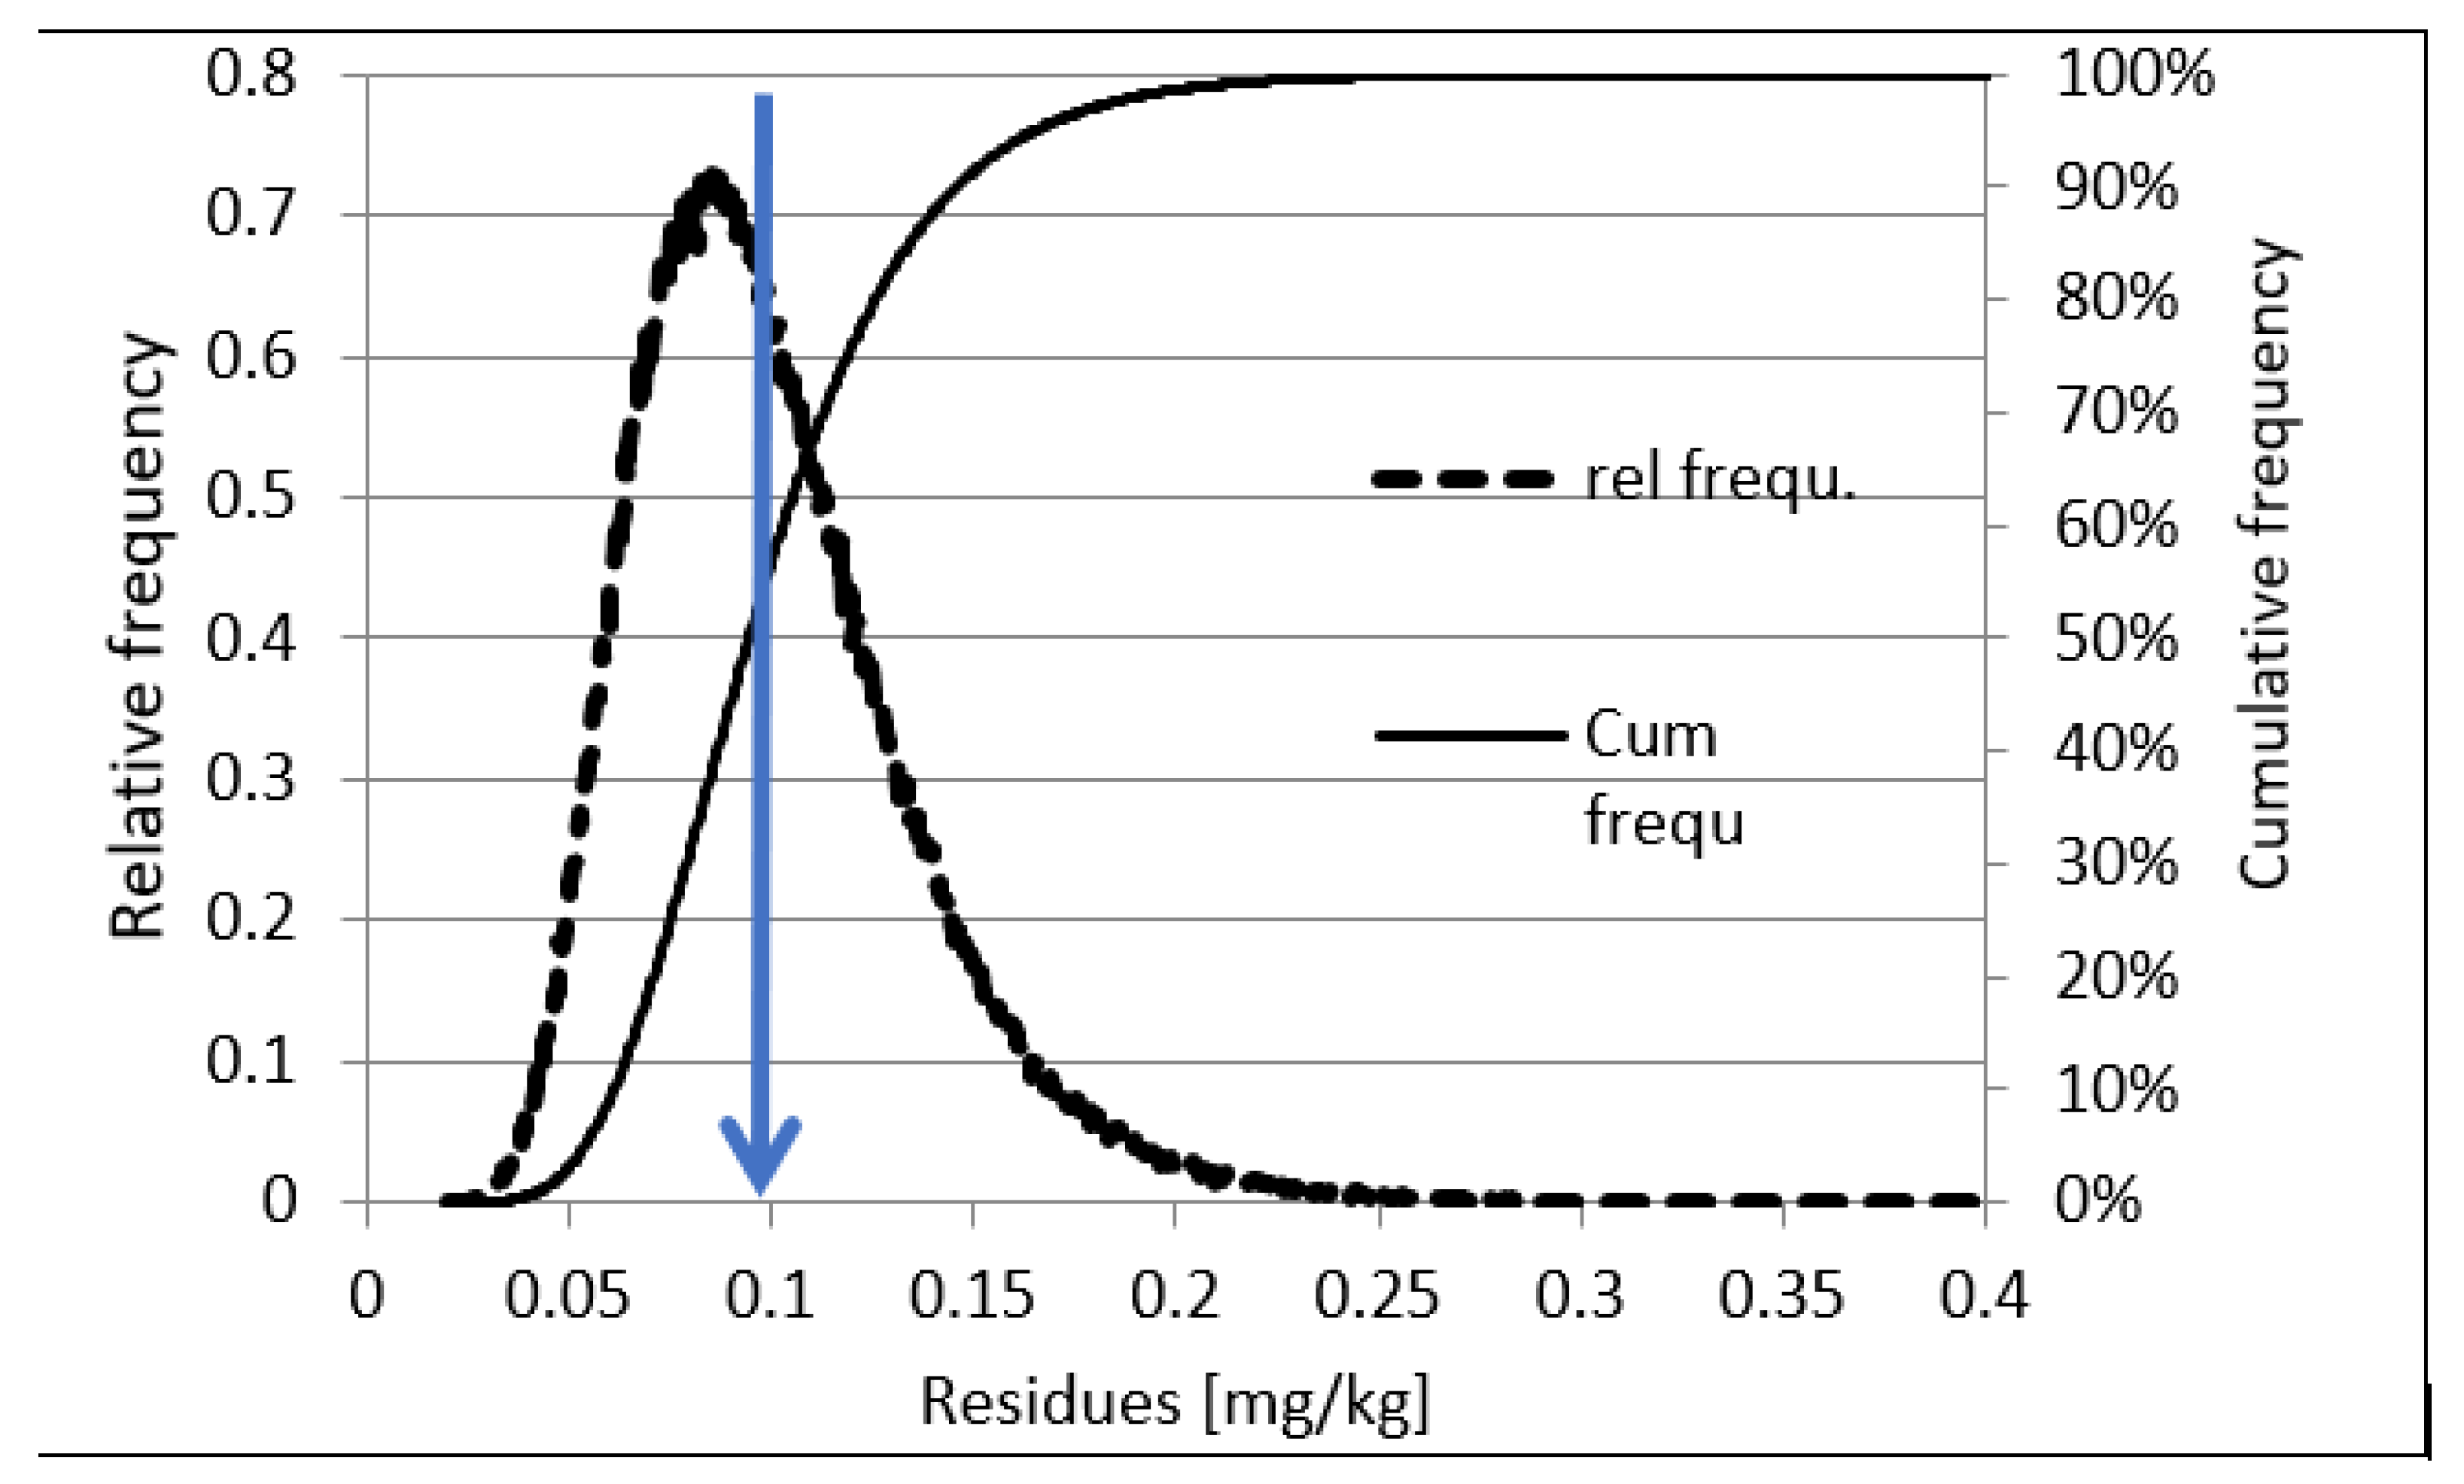
When the compliance of residue content of commodities with MRLs shall be checked before they are placed on the local market or exported, it should be verified with acceptable certainty that any further sample taken from that given lot will not contain residues above the MRL. In such cases, the combined uncertainty of results including the sampling uncertainty should be considered. Farkas and co-workers published the best estimates of sampling uncertainty for 107 individual crops and 24 crop groups [87,97]. Since the sampling uncertainty is inversely proportional to the number of primary samples making up the composite sample, it is advisable to take composite samples containing up to 25 primary samples for checking compliance of commodities with MRLs before export or placing them on the market provided that the large sample can be effectively homogenized in the laboratory. Figure 8 shows the typical relative frequency distribution of pesticide residues in composite samples taken from a single lot. The shape of the curves is very similar in fruits (shown for example in the case of apple) and vegetables irrespective of the pesticide residue present. The sampling distribution shown in the figure was obtained by drawing random composite samples of size 10 with replacement from the primary residue population in individual apples. The probability of taking a sample containing residue below the 0.1 mg/kg MRL is approximately 56% as shown by the cumulative distribution line. Moreover, finding a sample containing a given residue concentration is directly proportional to the corresponding relative frequency.
In this situation, if we compare the residue measured in the composite sample to the MRL value of 0.1 mg/kg, we would decide that the sampled product complies with the MRL in 56% of the cases, while the export partner may take another sample from the same lot containing residue above the MRL in 44% of the cases and can reject the lot. Making wrong decision in 44% of the cases is obviously too high to assure safe export. Therefore, the combined uncertainty (CVR) of measurement results should always be used for deciding on the compliance of the residues measured in composite samples with the MRLs. Moreover, a residue concentration level lower than the MRL should be chosen as the action limit (AL) [87]. The sampled lot should only be declared compliant if the residue measured does not exceed the calculated AL. The concept of action limit is relatively new. In addition to pesticide residues [92,93,99], it was recently applied for mycotoxins [100] and gluten in oat groats [101]. Therefore, it is considered generally applicable for evaluation of results during pre-marketing control.
Considering the specific sampling uncertainty (CVS) estimated from a large number of supervised trials, it was found [87,99,102] that a default AL of 0.3–0.4*MRL would provide a safe starting point in most cases without the need for complicated calculations. Therefore, its application is recommended for the control of pesticide residues in commodities before their export or placing them on the local market. To save time, it is also advisable to take two independent replicate samples in case of pre-export control and to analyse the second sample if the residue concentration exceeds the action limit in the first. In this case, neither of the samples can contain residues above 0.5 MRL to have an approximately 95% probability that the lot would be accepted by the importing country based on a 3rd sample taken from the same lot.
Further on, it is pointed out that the correct utilization of this principle will require rigorous ongoing quality control in the testing laboratories especially in case of default MRLs of 0.01* mg/kg established in the EU, which means practically no detectable residue can be present in the tested crop.
7. Model for Ranking Commodities to Be Included in Monitoring Programmes
The national monitoring data are also used to estimate the frequency of occurrence and the level of pesticide residues in food items selected based on their consumption and/or importance for export [6,7]. The results are also used to initiate the necessary corrective actions. Details of the principles of ranking the importance of commodities and targeted pesticide residues are not given in the summary reports.
The number of samples that can be taken annually as part of the monitoring programmes depends on the laboratory testing capacity and the financial resources available. There is no need to test all commodities with equal frequency. Horváth and Ambrus elaborated a three-level tiered model to assist planning risk-based monitoring programmes considering the available information [103]. The selection of commodity-pesticide combinations for freshly registered pesticides may be completed based on the supervised trial results in the first tier, the combination of supervised trials and limited monitoring data in the second and third tier depending on the number of monitoring data. In the latter case, the frequency of the occurrence and concentration levels (fp) of the residues in a given commodity is calculated as:
where Ri–s are the measured (and not the reported) residues in samples derived from the monitoring programmes. MRL is the corresponding maximum residue limit of ‘i’ pesticide in the sampled commodity, and n is the number of samples taken during the period considered (normally one or two years). In Equation (13), if Ri< LOQ then Ri is counted with 0. We calculate the frequency of occurrence (fp) of pesticide residues (Equation (13)) for a specified commodity and period of time with the built-in template (Table A7) of the Hungarian residue data processing system.
The authors recommended selecting the number of samples to be taken, if sufficient resources are available, by considering the calculated fp. The pesticide-commodity combinations, which indicate the short-term intake problem or residues exceeding the MRL over 2% require special attention. In case of large-scale production, these commodities should preferably be included in the random monitoring programme and tested with an approximately 95% probability of finding defective lots.
Where the potential risk from pesticide residues is lower, then a lower probability of detection may be acceptable, which can be achieved with the analysis of fewer samples.
Table 3 contains the guidance values for the number of samples to be taken from a commodity according to the corresponding fp values.
In view of the total number of samples that can be included in the monitoring programme, the final allocation of the number of samples for each commodity can be made proportionally to the corresponding fp values unless special reasons over-rule the ranked order. Where sufficient testing capacity or financial resources are not available, the most critical commodity-pesticide combinations should be given priority and the samples should be proportionally allocated to other commodities according to their importance.
To clarify high residue situations targeted field surveys are recommended by taking random samples from commodities with known pesticide treatment records, including the problematic pesticides. Since the pesticide treatment history is known in these cases, if limited laboratory testing capacity is available, a lower probability of detection of defective lots may be acceptable by taking a minimum of 40–60 samples.
8. Electronic Database for Evaluation of Monitoring Data
In view of the large number of samples, the wide scope of the analytical methods, and the supplementary information that should be attached to each sample, millions of data should be recorded for the multi-purpose evaluation of the monitoring data.
For instance, Australia [7], EFSA [10], EU member states [10,104,105], US FDA [9,106,107], and many other countries maintain certain electronic databases that serve as a central data repository. The records captured and stored in the databases include, for instance, sample collection and product information, residue concentrations for each sample analysed, and QA/QC records.
The EU Multiannual Control Programme (EU MACP) [104] is complemented with the national annual monitoring programmes [10]. The results of both programmes are electronically reported to EFSA. The information to be provided to EFSA for each sample is shown in Table A1. The data processed by EFSA are available on a dedicated website [105]. For the evaluation of national data, a less complex summary of the results can be sufficient.
The statistical analysis of the monitoring data can be used at the national level to decide which pesticides and food products should be targeted in risk-based monitoring programmes. The results can provide information for the necessary risk management measures, including but not limited to the review or adjustment of existing use recommendations and advisory actions for the farmers, etc. All of these actions have the aim of high-level consumer protection.
In the 1970s there were 20 small regional pesticide residue laboratories employing 3–5 analysts in Hungary. For the evaluation of their results an electronic data processing system was developed and introduced in 1978. The electronically stored results were used for the assessment of the performance of laboratories and the evaluation of the residue situation in the country. The residue data processing system was gradually updated and expanded, utilizing the development of personal computers. The current ‘Food Safety Information System (FSIS) was elaborated in 2004 and since then has been operated with minor changes and regular updates of the code dictionaries. It operates on the PostgreAQL (4 cpu core, 12 GB RAM, 500 GB) database server and the KFŐNIX (Wildfly 24 (4 cpu core, 12 GB RAM, 250 GB) application server. It consists of five main modules:
- The sampling module is used to record the details of sampling and to directly transfer them to the laboratory module, eliminating double recording of data;
- The laboratory module provides the platform for inputting and retrieving all sampling, analyses and quality control data;
- The data storage module processes the data and prepares the reports in pre-defined formats that can be specified according to the main parameters (sample, residue, test period purpose of tests, etc.);
- Master data and the bilingual code dictionary module;
- The permission module for entry and recall data and to modify the content of code dictionary, etc.
The recorded data can be accessed and retrieved in specified formats by authorized persons except the quality control data which is only available for the selected staff of the laboratory. The access rights to FSIS are strictly regulated to assure protection of individual rights, data integrity and compliance with quality system provisions. For instance, sample administrators, laboratory analysts, responsible analyst, had or directors of the laboratory, programme coordinators, code directory administrators, system administrators, officials of National Food Chain Safety Office and Ministry of Agriculture have only access to specific parts of the data and the workflow.
The measurement results and supplementary data can only be entered by the authorized users in the laboratories applying specific unique codes, which are allocated by the system administrator. Keeping the code directories up-to-date is essential for the accurate operation of the system. Table 4 provides an example of the date specific MRL records that makes it possible to retrieve and evaluate historical data by applying the MRLs which were valid for the examined period.
The expanded active substance, product and residue components code dictionaries are the basis of data entry. They provide information on the actual MRLs for commodity groups and individual commodities (Table A2 and Table A3).
Another code dictionary includes the mathematical expression of the calculation of the sum of residues included in the residue definition. The analysts enter the measured residue components. The programme automatically calculates the sum of residues and gives the residue value to be reported (Table A4).
9. Conclusions
Monitoring programmes are implemented to various extents in many countries, for instance, with the aim of obtaining information on:
- The pesticide residue distribution in raw agricultural commodities, their compliance to the MRLs specified in the national and major export countries’ legislations;
- The potential problems concerning the registered or illegal use of pesticides;
- The background data for calculation of percentiles of residue population to estimate the long and short-term intakes.
To obtain reliable and accurate information that fits to the purpose of the programme:
- The number of samples to be taken from each commodity should be decided by considering the desired confidence level of the decision based on the results;
- The sampling schedule should be carefully planned and prioritized based on the available laboratory capacity and resources;
- The sampling target should be cautiously defined to cover all growing fields, growing seasons, commercialized lots, etc., for which information is sought;
- Each unit of the sampling target should be accessible and have equal probability of being selected during sampling;
- All stakeholders benefiting from the results can or should be involved in the planning and cost-sharing;
- The laboratories should be equipped with suitable instruments (preferably LC-MS/MS and GC-MS/MS) and provided with well-trained analysts as well as an operational budget that is sufficient;
- The management of the laboratory should put in place and implement the appropriate internal quality control;
- The analysts should feel responsible for the results produced, continuously expand the scope of the methods applied and assure that the sensitivity of detection enables identifying the residues lower than the corresponding MRLs or action limits.
The monitoring programmes can only produce the expected benefits and justify the implementation cost if their results are systematically recorded in an easily retrievable form for which an electronic data storage and management system should be adapted and operated. The recorded data should be regularly evaluated together with the stakeholders and published, as it would increase trust in the results and facilitate the cooperation of all concerned parties. In addition, the periodic evaluation of the results obtained in previous years makes it possible to identify trends and helps to define future directions and actions.
Author Contributions
Conceptualization, original draft preparation, manuscript finalization, Á.A.; methodology, V.V.N.D. and A.V.; review, Á.A., J.S.-C. and A.V.; editing, J.S.-C. All authors have read and agreed to the published version of the manuscript.
Funding
This research received no external funding.
Institutional Review Board Statement
Not applicable.
Informed Consent Statement
Not applicable.
Data Availability Statement
Not applicable.
Conflicts of Interest
The authors declare no conflict of interest.
Abbreviations
| ADI | Acceptable daily intake |
| AL | Action limit |
| ARfD | Acute reference dose |
| CAC | Codex Alimentarius Commission |
| CAG | cumulative assessment group |
| CCPR | Codex Committee on Pesticide Residues |
| EDI | Estimated daily intake |
| EFSA | European Food Safety Authority |
| ESTI | Estimated short-term intake |
| FAO | Food and Agriculture Organization |
| GAP | Good Agricultural Practices |
| HI | Hazard index |
| HQ | Hazard quotient |
| HR | High residue |
| IEDI | International estimated daily intake |
| IESTI | International estimated short-term intake |
| JMPR | Joint Meeting on Pesticide Residues |
| LOD | Limit of detection |
| LOQ | Limit of quantification |
| LP | Large portion |
| MACP | EU Multiannual Control Programme |
| MCRA | Monte Carlo Risk Assessment |
| MRL | Maximum Residue Limit |
| MRM | multi-residue methods |
| NEDI | National estimated daily intake |
| PHI | pre-harvest interval |
| ν | variability factor |
| STI | Short-term intake |
| TDI | Tolerable daily intake |
| Ue | Unit mass of edible portion |
| US FDA | United States Food and Drug Administration |
| WHO | World Health Organization |
Appendix A

Table A1.
Information to be provided to EFSA on results of residue analyses 1.
| Sample | Sample code | Accred. code | Accred. status | Type of test | Detection method | Sampling method code | Sampling method | Parameter typ. | Result type | Programme type | Type of results | Programme name | Position in food chain | Code of sampling position | MRL | Relation of R-LOQ | LOQ |
| Expanded uncertainty | Result | Reported value | Exponent | Lab. Code | Labour short name | Detection method | Measured value | Exponent of measured value | Detected analyte, code | Detected analyte, name | Dimension | Sample lab. Code | Date of sampling | Objective of sampling | Sampling method | Location of sampling | |
| Relative uncertainty of results | Relation sign | Country of origin | Name of lot | Typical recovery% | Date of analyses | Test method, code | Name of test method |
Notes: 1: This table indicates the headings of the columns. The original table lists the parameters in one row; however, it is presented here in three rows to fit in the page; the listed parameters should be provided for each sample; the codes are used for unique identification of the parameters.
Table A2.
Example for the active substance code dictionary (condensed for presentation).
| Creation Date 1 | R-code 2 | Name | Entry force 3 | Directive 4 | Product name | Product Code | MRL | Application Date 5 | Footnotes MRL | Application Date 6 | New MRL |
|---|---|---|---|---|---|---|---|---|---|---|---|
| Bromide ion | SUGAR PLANTS | 900000 | |||||||||
| Bromide ion | Sugar beet roots | 900010 | 20 | ||||||||
| Bromide ion | Chicory roots | 900030 | 5 | ||||||||
| Bromide ion | Others (2) | 900990 | 5 | ||||||||
| Acetamiprid (R) | Fruits, Fresh or frozen; Tree Nuts | 100000 | |||||||||
| Acetamiprid (R) | Citrus fruits | 110000 | 0.9 | ||||||||
| Acetamiprid (R) | Others (2) | 110990 | 0.9 | ||||||||
| Acetamiprid (R) | Tree nuts | 120000 | 0.07 | ||||||||
| Acetamiprid (R) | Almonds | 120010 | 0.07 | ||||||||
| Acetamiprid (R) | Coconuts | 120050 | 0.07 | ||||||||
| Acetamiprid (R) | Hazelnuts/cobnuts | 120060 | 0.07 | ||||||||
| Acetamiprid (R) | Macadamias | 120070 | 0.07 | ||||||||
| Acetamiprid (R) | Pome fruits | 130000 | |||||||||
| Acetamiprid (R) | Apples | 130010 | 0.4 | ||||||||
| Acetamiprid (R) | Pears | 130020 | 0.4 | ||||||||
| Acetamiprid (R) | Quinces | 130030 | 0.8 | ||||||||
| Acetamiprid (R) | Others (2) | 130990 | 0.8 | ||||||||
1: Creation date: entry date for the code (month/day/year hour: 10/27/2022 10:06:39 pm). 2: R-code: code of active substance. 3:Effective from: (year-month-day hour: 2008-09-01 00:00:00). 4:EU Regulation number e.g., Reg. (EC) No 839/2008. 5,6: Date of national adaption: (year-month-day hour 2008-09-01 00:00:00).
Table A3.
Products of plant and animal origin referred to in Article 2(1) to which MRLs apply 1.
| Code Number (FSIS) | Product Name (HU) | Product Name (EN) | Code Number (Regulation) | Category |
|---|---|---|---|---|
| 118725 | alma | apples | 0130010 | pome fruits |
| 118743 | birsalma | quinces | 0130030 | pome fruits |
| 101057 | birskörte | quince-pear | 0130030 | pome fruits |
| 118770 | gyümölcs, almatermésű, egyéb | pome fruits other than apple | 0130990 | pome fruits |
| 118761 | japán naspolya | loquat | 0130050 | pome fruits |
| 118734 | körte | pears | 0130020 | pome fruits |
| 118752 | naspolya | medlars | 0130040 | pome fruits |
| 102995 | alma (aszalt) | apples, dried | 1300000 | processed product |
| 100449 | almakocka | apple, cubes | 1300000 | processed product |
| 100256 | almakocka (fagyasztott) | apple cubes, frozen | 1300000 | processed product |
| 103374 | alma (bébiétel) | apple, baby food | 1300000 | processed product |
1: Article 2 (1) of this regulation shall apply to products of plant and animal origin or parts thereof covered by Annex I to be used as fresh, processed and/or composite food or feed in or on which pesticide residues may be present (Regulation (EC) No 396/2005 of the European Parliament and of the Council).
Table A4.
Example for recording residues included in the definition of residues.
| ELB Param Code | Extended Name 1 | Param Type Code | SSD Param Code | EFSA CAS Number | Mode of Action | Molecular Weight |
|---|---|---|---|---|---|---|
| 218902 | phorate (sum of phorate, its oxygen analogue and their sulfones expressed as phorate) | P005A | RF-0336-001-PPP | - | insecticide | - |
| 301273 | phorate | P002A | RF-0336-003-PPP | 298-02-2 | insecticide | 260.38 |
| 301260 | phorate-oxon | P002A | RF-0336-005-PPP | 2600-69-3 | insecticide | 244.3 |
| 315717 | phorate-oxon-sulfone | P002A | RF-0336-006-PPP | 2588-06-9 | insecticide | 276.3 |
| 315720 | phorate-oxon-sulfoxide | P002A | RF-0336-007-PPP | 2588.05.08 | insecticide | 260.3 |
| 217262 | phorate sulfone | P002A | RF-0336-002-PPP | 2588-04-7 | insecticide | 292.38 |
| 315733 | phorate-sulfoxide | P002A | RF-0336-004-PPP | 2588-03-6 | insecticide | 276.38 |
Notes 1: Calculation of reported residue: R = {301273} * 1.00 + {301260} * 1.06 + {217262} * 0.89 + {315720} * 1.00 + {315717} * 0.94 + {315733} * 0.94; SSD: code for data submission to EFSA.
Table A5.
Summary of results according to type and origin of sampled lots.
| Type of sample | Year of sampling | Origin of sampled lot | Code of origin | Sampling (month) | Objective of sampling | Site of sampling (county) | No. of a.i-s tested | No. of samples |
Table A6.
Distribution of residues in MRL ranges 1.
| Sample | Alanyt | # of samples | R > T & T > 0 | R > T & T | # of R = T &T > 0 | # of T ≥ R > 0.5T | # of 0.5T ≥ R > LOQT > 0 | # R ≥ LOQ &T > 0 | # of LOQ > R &T > 0 | # of LOQ>R = T | T [mg/kg] |
1: Explanation: Sample: description of sample; analyte: residues searched for; #: number; T = MRL; T > 0 = MRL > 0; LOQ: reported limit of quantification.
Table A7.
Calculation of national short-term intake.
| Commodity | Variability | Residue | ARfD | P0.975 of Large portion | MRL | LOQ | Reported value | Relation sign | HI % | Date of sampling | Country of origin |
Table A8.
Distribution of individual residue values.
| Commodity | Residues | LOQ range 1 | # of samples | # of tests | #, R≥LOQ | #, R<LOQ | MRL | #, R>T | Rmax/T | Fp 2 | Sum of residues 3 | Median of residues | Reported résiden 4 |
Notes: 1: Minimum-maximum LOQ values reported. 2: fp: calculated with Equation (12). 3: The sum and median of residues is calculated with the reported concentrations, LOQ or LOD values. 4: Residues are recorded as (a) R ≥ LOQ: normal fonts; (b) R < LOQ, R ≠ 0: Italics; R < LOD: Italics underlined. The residues are listed in rows under each other in groups of 50.
Table A9.
Distribution [%] of samples according to origin.
| Commodity | Total # of samples | Domestic samples | Samples from EU MS | Samples from TC 1 | Samples of unknown origin | Samples with R < LOQ | Sample with R < T | Sample with R > T |
1: TC: third countries.
Table A10.
Details of multiple residues (≥2) in single samples.
| Commodity | Origin | Sample Code | # of Residues | Residues [mg/kg] | Conc. [mg/kg] |
|---|---|---|---|---|---|
| Apple | POL | 962799 | 4 | acetamiprid | 0.044 |
| boscalid | 0.05 | ||||
| fludioxonil | 0.086 | ||||
| methoxyfenozide | 0.062 | ||||
| Apple | ITA | 962997 | 3 | acetamiprid | 0.051 |
| difenoconazole | 0.011 | ||||
| boscalid | 0.084 |
Table A11.
Details of residues exceeding EU/HU-MRLs.
| Pesticide | Food Item | Point of Sampling 1 | Country of Origin 2 | Residue in mg/kg | EU-MRL (mg/kg) |
|---|---|---|---|---|---|
| chlorpyrifos | apples | M | HUN | 0.046 | 0.01 |
Notes 1: Gives the location of sampled commodity; e.g., market, growing field, border, etc.; 2: Use 3-letter codes for the countries.
References
- FAO/WHO Synthesis Report on the Environmental and Health Impacts of Pesticides and Fertilizers and Ways to Minimize Them. Available online: www.fao.org/pest-and-pesticide-management/resources/en/ (accessed on 9 November 2022).
- EFSA Eurobarometer 2022. Available online: www.efsa.europa.eu/sites/default/files/2022-09/EB97.2-food-safety-in-the-EU_report.pdf (accessed on 30 October 2022).
- Hamilton, D.; Yoshida, M.; Wolterink, G.; Solecki, R. Evaluation of pesticide residues by FAO/WHO JMPR. In Food Safety Assessment of Pesticide Residues, 1st ed.; Ambrus, Á., Hamilton, D., Eds.; World Scientific Publishing Europe Ltd.: London, UK, 2017; pp. 113–196. [Google Scholar]
- Yamada, Y. Importance of codex maximum residue limits for pesticides for the health of consumers and international trade. In Food Safety Assessment of Pesticide Residues, 1st ed.; Ambrus, Á., Hamilton, D., Eds.; World Scientific: Hackensack, NJ, USA, 2017; pp. 269–282. [Google Scholar]
- FAO Codex Alimentarius Pesticide Index. Available online: www.fao.org/fao-who-codexalimentarius/codex-texts/dbs/pestres/pesticides/en/ (accessed on 9 November 2022).
- Zhang, M.; Zeiss, M.R.; Geng, S. Agricultural pesticide use and food safety: California’s model. J. Integr. Agric. 2015, 14, 2340–2357. [Google Scholar] [CrossRef]
- Australian National Residue Survey. Available online: www.awe.gov.au/agriculture-land/farm-food-drought/food/nrs (accessed on 30 October 2022).
- FAO Recommended Methods of Sampling for the Determination of Pesticide Residues for Compliance with MRLs CXG33-1999. Available online: www.fao.org/fao-who-codexalimentarius/sh-proxy/en/?lnk=1&url=https%253A%252F%252Fworkspace.fao.org%252Fsites%252Fcodex%252FStandards%252FCXG%2B33-1999%252FCXG_033e.pdf (accessed on 31 July 2022).
- USDA (1992–2020): PDP Databases and Annual Summaries. Available online: www.ams.usda.gov/datasets/pdp/pdpdata (accessed on 30 October 2022).
- Cabrera, L.C.; Pastor, P.M. The 2020 European Union Report on Pesticide Residues in Food. EFSA J. 2022, 20, 7215. [Google Scholar] [CrossRef]
- Austrian Agency for Health and Food Safety National Pesticide Residue Control Programmes. Available online: https://www.ages.at/en/plant/pesticides/pesticide-residues#c5252 (accessed on 30 October 2022).
- German Federal Office of Consumer Protection Tables for the National Reporting of Pesticide Residues in Food 2020. Available online: www.bvl.bund.de/DE/Arbeitsbereiche/01_Lebensmittel/01_Aufgaben/02_AmtlicheLebensmittelueberwachung/07_PSMRueckstaende/01_nb_psm_2020_tabellen/nbpsm_2020_tabellen_node.html (accessed on 30 October 2022).
- Report of the Hungarian National Chief Veterinary Officer. Available online: https://portal.nebih.gov.hu/aktualitasok/hirek/friss-hirek/hirek2/-/asset_publisher/4ndba0yRXvQX/content/ofa (accessed on 30 October 2022).
- Jardim, A.N.O.; Caldas, E.D. Brazilian monitoring programs for pesticide residues in food-results from 2001 to 2010. Food Control 2012, 25, 607–616. [Google Scholar] [CrossRef] [Green Version]
- Gebremichael, S.; Birhanu, T.; Tessema, D.A. Analysis of organochlorine pesticide residues in human and cow’s milk in the towns of Asendabo, Serbo and Jimma in South-Western Ethiopia. Chemosphere 2013, 90, 1652–1657. [Google Scholar] [CrossRef]
- Mac Loughlin, T.M.; Peluso, L.; Etchegoyen, A.; Alonso, L.L.; de Castro, C.; Percudani, C.; Marino, D.J.G. Pesticide residues in fruits and vegetables of the Argentine domestic market: Occurrence and quality. Food Control 2018, 93, 129–138. [Google Scholar] [CrossRef]
- Pang, G.F.; Fan, C.L.; Chang, Q.Y.; Li, J.X.; Lu, J.K.L.M. Screening of 485 pesticide residues in fruits and vegetables by liquid chromatography-quadrupole-time-of-flight mass spectrometry based on TOF Accurate Mass Database and QTOF Spectrum Library. J. AOAC Int. 2018, 101, 1156–1182. [Google Scholar] [CrossRef]
- Ramadan, M.F.A.; Abdel-Hamid, M.M.A.; Altorgoman, M.M.F.; AlGaramah, H.A.; Alawi, M.A.; Shati, A.A.; Shweeta, H.A.; Awwad, N.S. Evaluation of pesticide residues in vegetables from the Asir Region Saudi Arabia. Molecules 2020, 25, 205. [Google Scholar] [CrossRef] [Green Version]
- Mozzaquatro, J.O.; Mello, D.C.; Oliveira, R.C.S.; Rosa, R.C.C.; Costa, A.M.; Caldas, E.D. Dithiocarbamate residues in fruits and leaves of passion fruit (Passiflora edulis) from different Brazilian Regions. J. Braz. Chem. Soc. 2019, 30, 1834–1840. [Google Scholar] [CrossRef]
- Galani, Y.J.H.; Houbraken, M.; Wumbei, A.; Djeugap, J.F.; Fotio, D.; Gong, Y.Y.; Spanoghe, P. Monitoring and dietary risk assessment of 81 pesticide residues in 11 local agricultural products from the 3 largest cities of Cameroon. Food Control 2020, 118, 107416. [Google Scholar] [CrossRef]
- Vu-Duc, N.; Nguyen-Quang, T.; Le-Minh, T.; Nguyen-Thi, X.; Tran, T.M.; Vu, H.A.; Chu, D.B. Multiresidue pesticides analysis of vegetables in Vietnam by ultrahigh-performance liquid chromatography in combination with high-resolution mass spectrometry (UPLC-Orbitrap MS). J. Anal. Methods Chem. 2019, 2019, 3489634. [Google Scholar] [CrossRef]
- Zhang, Y.; Wang, M.; Silipunyo, T.; Huang, H.; Yin, Q.; Han, B.; Wang, M. Risk Assessment of Triflumezopyrim and Imidacloprid in rice through an evaluation of residual data. Molecules 2022, 27, 5685. [Google Scholar] [CrossRef]
- Osaili, T.M.; Al Sallagi, M.; Dhanasekaran, D.; Odeh, W.B.; Al Ali, H.; Al Ali, A.; Radwan, H.; Obaid, R.; Holley, R. Pesticide residues in fresh vegetables imported into the United Arab Emirates. Food Control 2022, 133, 108663. [Google Scholar] [CrossRef]
- Wang, F.; Li, S.; Feng, H.; Yang, Y.; Xiao, B.; Chen, D. An enhanced sensitivity and cleanup strategy for the nontargeted screening and targeted determination of pesticides in tea using modified dispersive solid-phase extraction and cold-induced acetonitrile aqueous two-phase systems coupled with liquid chromatography-high resolution mass spectrometry. Food Chem. 2019, 275, 530–538. [Google Scholar] [CrossRef] [PubMed]
- Geissen, V.; Silva, V.; Lwanga, E.H.; Beriot, N.; Oostindie, K.; Bin, Z.; Pyne, E.; Busink, S.; Zomer, P.; Mol, H.; et al. Cocktails of pesticide residues in conventional and organic farming systems in Europe–Legacy of the past and turning point for the future. Environ. Pollut. 2021, 278, 116827. [Google Scholar] [CrossRef] [PubMed]
- Khazaal, S.; El Darra, N.; Kobeissi, A.; Jammoul, R.; Jammoul, A. Risk assessment of pesticide residues from foods of plant origin in Lebanon. Food Chem. 2022, 374, 131676. [Google Scholar] [CrossRef]
- Boudebbouz, A.; Boudalia, S.; Boussadia, M.I.; Gueroui, Y.; Habila, S.; Bousbia, A.; Symeon, G.K. Pesticide residues levels in raw cow’s milk and health risk assessment across the globe: A systematic review. Environ. Adv. 2022, 9, 100266. [Google Scholar] [CrossRef]
- Pham, U.T.; Phan, Q.H.T.; Nguyen, L.P.; Luu, P.D.; Doan, T.D.; Trinh, H.T.; Dinh, C.T.; Nguyen, T.V.; Tran, T.Q.; Le, D.X.; et al. Rapid quantitative determination of multiple pesticide residues in mango fruits by surface-enhanced Raman spectroscopy. Processes 2022, 10, 442. [Google Scholar] [CrossRef]
- Philippe, V.; Neveen, A.; Marwa, A.; Basel, A.Y.A. Occurrence of pesticide residues in fruits and vegetables for the Eastern Mediterranean Region and potential impact on public health. Food Control 2021, 119, 107457. [Google Scholar] [CrossRef]
- Tripathy, V.; Sharma, K.K.; Sharma, K.; Gupta, R.; Yadav, R.; Singh, G.; Aggarwal, A.; Walia, S. Monitoring and dietary risk assessment of pesticide residues in brinjal, capsicum, tomato, and cucurbits grown in Northern and Western regions of India. J. Food Compos. Anal. 2022, 110, 104543. [Google Scholar] [CrossRef]
- Nguyen, N.T.; Huynh Nguyen, K.; Duong, T.; Tran, V.D.; Kim, K.H.; Pham, L.T. Evaluation of pesticide residues in vegetables from Mekong, Delta, Vietnam using LC-MS/MS. Trop. J. Pharm. Res. 2021, 20, 1497–1504. [Google Scholar] [CrossRef]
- Pang, G.-F.; Fan, C.-L.; Liu, Y.-M.; Cao, Y.-Z.; Zhang, J.-J.; Fu, B.-L.; Li, X.-M.; Li, Z.-Y.; Wu, Y.-P. Multi-residue method for the determination of 450 pesticide residues in honey, fruit juice and wine by double-cartridge solid-phase extraction/gas chromatography-mass spectrometry and liquid chromatography-tandem mass spectrometry. Food Addit. Contam. 2006, 23, 777–810. [Google Scholar] [CrossRef] [PubMed]
- Le, L.H.T.; Tran-Lam, T.T.; Cam, T.Q.; Nguyen, T.N.; Dao, Y.H. Pesticides in edible mushrooms in Vietnam. Food Addit. Contam. Part B 2021, 14, 139–148. [Google Scholar] [CrossRef] [PubMed]
- Murcia-Morales, M.; Heinzen, H.; Parrilla-Vázquez, P.; Gómez-Ramosa, M.M.; Fernández-Alba, A.R. Presence and distribution of pesticides in apicultural products: A critical appraisal. TrAC Trends Anal. Chem. 2022, 146, 116506. [Google Scholar] [CrossRef]
- Calderon, R.; García-Hernández, J.; Palma, P.; Leyva-Morales, J.B.; Zambrano-Soria, M.; Bastidas-Bastidas, P.J.; Godoy, M. Assessment of pesticide residues in vegetables commonly consumed in Chile and Mexico: Potential impacts for public health. J. Food Compos. Anal. 2022, 108, 104420. [Google Scholar] [CrossRef]
- Kottadiyil, D.; Mehta, T.; Thasale, R.; Sivaperumal, P. Determination and dietary risk assessment of 52 pesticide residues in vegetable and fruit samples by GC-MS/MS and UHPLC-QTOF/MS from Gujarat, India. J. Food Compos. Anal. 2023, 115, 104957. [Google Scholar] [CrossRef]
- Fatunsin, O.T.; Oyeyiola, A.O.; Moshood, M.O.; Akanbi, L.M.; Fadahunsi, D.E. Dietary risk assessment of organophosphate and carbamate pesticide residues in commonly eaten food crops. Sci. Afr. 2020, 8, e00442. [Google Scholar] [CrossRef]
- Petrarca, M.H.; Fernandes, J.O.; Marmelo, I.; Marques, A.; Cunha, S.C. Multi-analyte gas chromatography-mass spectrometry method to monitor bisphenols, musk fragrances, ultraviolet filters, and pesticide residues in seafood. J. Chromatogr. A 2022, 1663, 462755. [Google Scholar] [CrossRef]
- Rahman, M.; Hoque, M.S.; Bhowmik, S.; Ferdousi, S.; Kabiraz, M.P.; van Brakel, M.L. Monitoring of pesticide residues from fish feed, fish and vegetables in Bangladesh by GC-MS using the QuEChERS method. Heliyon 2021, 7, e06390. [Google Scholar] [CrossRef]
- Ngabirano, H.; Birungi, G. Pesticide residues in vegetables produced in rural south-western Uganda. Food Chem. 2022, 370, 130972. [Google Scholar] [CrossRef]
- Sang, C.; Sørensen, P.B.; An, W.; Andersen, J.H.; Yang, M. Chronic health risk comparison between China and Denmark on dietary exposure to chlorpyrifos. Environ. Pollut. 2019, 257, 113590. [Google Scholar] [CrossRef]
- Szenczi-Cseh, J.; Ambrus, Á. Uncertainty of exposure assessment of consumers to pesticide residues derived from food consumed. J. Environ. Sci. Health Part B 2017, 52, 658–670. [Google Scholar] [CrossRef] [PubMed]
- FAO Manual on the Submission and Evaluation of Pesticide Residues Data, 3rd ed.; FAO: Rome, Italy, 2016; Available online: https://www.fao.org/3/i5452e/i5452e.pdf (accessed on 9 November 2022).
- Zentai, A.; Szabó, I.J.; Kerekes, K.; Ambrus, Á. Risk assessment of the cumulative acute exposure of Hungarian population to organophosphorus pesticide residues with regard to consumers of plant based foods. Food Chem. Toxicol. 2016, 89, 67–72. [Google Scholar] [CrossRef] [PubMed]
- Hamilton, D.; Ambrus, Á.; Dieterle, R.; Felsot, A.; Harris, C.; Petersen, B.; Racke, K.; Wong, S.-S.; Gonzales, R.; Tanaka, K.; et al. Pesticide residues in food—Acute dietary exposure. Pest Manag. Sci. 2004, 60, 311–339. [Google Scholar] [CrossRef] [PubMed]
- Dutra-Caldas, E.; van der Velde-Koerts, T. Dietary exposure and risk characterization for pesticide residues in food. In Food Safety Assessment of Pesticide Residues, 1st ed.; Ambrus, Á., Hamilton, D., Eds.; World Scientific: Hackensack, NJ, USA, 2017; pp. 404–466. [Google Scholar]
- Heinemeyer, G.; Jantunen, M.; Hakkinen, P. The Practice of Consumer Exposure Assessment; Springer Nature Switzerland AG: Cham, Switzerland, 2020; p. 620. [Google Scholar] [CrossRef]
- CAC Pesticide Index; FAO: Rome, Italy, 2022; Available online: https://www.fao.org/fao-who-codexalimentarius/codex-texts/dbs/pestres/pesticides/en/ (accessed on 5 November 2022).
- European Commission Download MRLs Data. Available online: https://ec.europa.eu/food/plant/pesticides/eu-pesticides-database/start/screen/mrls/download (accessed on 5 November 2022).
- USEPA Regulation of Pesticide Residues on Food. Available online: https://www.epa.gov/pesticide-tolerances (accessed on 5 November 2022).
- FAO Portion of Commodities to which Codex MRLs Apply and Which is Analyzed (CAC/GL 41-1993); FAO: Rome, Italy, 1994; Available online: http://www.fao.org/fao-who-codexalimentarius/sh-proxy/en/?lnk=1&url=https%253A%252F%252Fworkspace.fao.org%252Fsites%252Fcodex%252FStandards%252FCXG%2B41-1993%252FCXG_041e.pdf (accessed on 5 November 2022).
- FAO/WHO IEDI Calculation Template 17-Cluster Diet; FAO: Rome, Italy, 2022; Available online: https://cdn.who.int/media/docs/default-source/food-safety/gems-food/iedi-calculation-vs04-17clusters.xlsx (accessed on 5 November 2022).
- WHO Cluster Diets; FAO: Rome, Italy, 2022; Available online: https://www.who.int/data/gho/samples/food-cluster-diets (accessed on 5 November 2022).
- Gad Alla, S.A.; Loutfy, N.M.; Shendy, A.H.; Ahmed, M.T. Hazard index, a tool for a long term risk assessment of pesticide residues in some commodities, a pilot study. Regul. Toxicol. Pharmacol. 2015, 73, 985–991. [Google Scholar] [CrossRef] [PubMed]
- EFSA; Anastassiadou, M.; Brancato, A.; Carrasco Cabrera, L.; Ferreira, L.; Greco, L.; Jarrah, S.; Kazocina, A.; Leuschner, R.; Magrans, J.O.; et al. Pesticide Residue Intake Model-EFSA PRIMo revision 3.1 (update of EFSA PRIMo revision 3). EFSA J. 2019, 16, 1605E. [Google Scholar] [CrossRef]
- Ioannidou, S.; Horváth, Z.; Arcella, D. Harmonised collection of national food consumption data in Europe. Food Policy 2020, 96, 101908. [Google Scholar] [CrossRef]
- Ambrus, Á. Variability of pesticide residues in crop units. Pest Manag. Sci. 2006, 62, 693–714. [Google Scholar] [CrossRef]
- Horváth, Z.; Ambrus, Á.; Mészáros, L.; Braun, S. Characterization of distribution of pesticide residues in crop units. J. Environ. Sci. Health B 2013, 48, 615–625. [Google Scholar] [CrossRef]
- Ambrus, A. Within and between field variability of residue data and sampling implications. Food Addit. Contam. 2000, 17, 519–537. [Google Scholar] [CrossRef]
- Ambrus, Á.; Soboleva, E. Contribution of sampling to the variability of pesticide residue data. J. AOAC Int. 2004, 87, 1368–1379. [Google Scholar] [CrossRef] [Green Version]
- FAO Short-Term Dietary Intake Assessment: Uncertainties in the International Estimated Short-Term Intake (IESTI) calculation and its interpretation. In Pesticide Residues in Food–Report 2006; FAO Plant Production and Protection Paper: Rome, Italy, 2006; pp. 8–12. Available online: http://www.fao.org/agriculture/crops/thematic-sitemap/theme/pests/jmpr/jmpr-rep/en/ (accessed on 9 November 2022).
- EFSA. Opinion of the Scientific Panel on Plant Health, Plant Protection Products and their Residues on a request from the Commission related to the appropriate variability factor(s) to be used for acute dietary exposure assessment of pesticide residues in fruit and vegetables. EFSA J. 2005, 177, 1–61. [Google Scholar] [CrossRef]
- FAO/WHO JMPR Reports and Evaluations; FAO: Rome, Italy, 2022; Available online: https://www.fao.org/agriculture/crops/core-themes/theme/pests/jmpr/jmpr-rep/en/ (accessed on 9 November 2022).
- The Japan Food Chemical Research Foundation Maximum Residue Limits Search Engine for MRLs of Agricultural Chemicals in Foods. Available online: Ffcr.or.jp (accessed on 9 November 2022).
- Government of Canada Maximum Residue Limits for Pesticides. Available online: Chttps://www.canada.ca/en/health-canada/services/consumer-product-safety/reports-publications/pesticides-pest-management/corporate-plans-reports.html (accessed on 9 November 2022).
- US EPA Choosing a Percentile of Acute Dietary Exposure as a Threshold of Regulatory Concern. Available online: https://www.epa.gov/sites/default/files/2015-07/documents/trac2b054_0.pdf (accessed on 9 November 2022).
- US EPA Guidelines for the Health Risk Assessment of Chemical Mixtures. Available online: https://www.epa.gov/sites/default/files/2014-11/documents/chem_mix_1986.pdf (accessed on 9 November 2022).
- US EPA Guidance on Cumulative risk Assessment of Pesticide Chemicals that Have a Common Mechanism of Toxicity. Washington, USA, 2002. Available online: https://www.epa.gov/sites/default/files/2015-07/documents/guidance_on_common_mechanism.pdf (accessed on 9 November 2022).
- Boer, W.J.; Voet, H.; Boon, P.E.; Donkersgoed, G.; Klaveren, J.D. MCRA a Web-Based Program for Monte Carlo Risk Assessment. User Manual. Release 3.5; Biometris and RIKILT: Wageningen, The Netherlands, 2005; Available online: https://library.wur.nl/WebQuery/wurpubs/fulltext/42878 (accessed on 9 November 2022).
- Boon, P.E.; van der Voet, H.; Ruprich, J.; Turrini, A.; Sand, S.; van Klaveren, J.D. Computational tool for usual intake modelling workable at the European level. Food Chem Toxicol 2014, 74, 279–288. [Google Scholar] [CrossRef] [PubMed]
- van der Voet, H.; de Boer, W.J.; Kruisselbrink, J.W.; Goedhart, P.W.; van der Heijden, G.W.A.M.; Kennedy, M.C.; Boon, P.E.; van Klaveren, J.D. The MCRA model for probabilistic single-compound and cumulative risk assessment of pesticides. Food Chem. Toxicol. 2015, 79, 5–12. [Google Scholar] [CrossRef]
- Zentai, A.; Kerekes, K.; Szabó, I.; Ambrus, Á. Refining customer exposure due to pesticide residues–Part 1. J. Food Investig. 2015, 41, 681–719. Available online: http://epa.oszk.hu/03100/03135/00261/pdf/EPA03135_elelmiszervizsgalati_kozlemenyek_2015_03.pdf (accessed on 5 November 2022).
- Szeitz-Szabó, M.; Bíró, L.; Bíró, G.; Sali, J. Dietary survey in Hungary, 2009. Part I. Macronutrients, alcohol, caffeine, fibre. Acta Aliment. 2011, 40, 142–152. [Google Scholar] [CrossRef]
- Zentai, A.; Kerekes, K.; Szabó, I.; Ambrus, Á. Refining customer exposure due to pesticide residues–Part 2. J. Food Investig. 2015, 41, 801–845. [Google Scholar]
- Wu, P.; Wang, P.; Gu, M.; Xue, J.; Wu, X. Human health risk assessment of pesticide residues in honeysuckle samples from different planting bases in China. Sci. Total Environ. 2021, 759, 142747. [Google Scholar] [CrossRef]
- European Commission Regulation No 396/2005 of the European Parliament and of the Council of 23 February 2005 on Maximum Residue Levels of Pesticides in or on Food and Feed of Plant and Animal Origin and Amending Council Directive 91/414/EEC. Available online: https://eur-lex.europa.eu/legal-content/EN/ALL/?uri=celex%3A32005R0396 (accessed on 5 November 2022).
- Crivellente, F.; Hart, A.; Hernandez-Jerez, A.F.; Hougaard Bennekou, S.; Pedersen, R.; Terron, A.; Wolterink, G.; Mohimont, L. Establishment of cumulative assessment groups of pesticides for their effects on the nervous system. EFSA J. 2017, 17, e05800. [Google Scholar] [CrossRef] [Green Version]
- Caldas, E.D.; Boon, P.E.; Tressou, J. Probabilistic assessment of the cumulative acute exposure to organophosphorus and carbamate insecticides in the Brazilian diet. Toxicology 2006, 222, 132–142. [Google Scholar] [CrossRef] [PubMed]
- Boon, P.E.; Van der Voet, H.; Van Raaij, M.T.M.; Van Klaveren, J.D. Cumulative risk assessment of the exposure to organophosphorus and carbamate insecticides in the Dutch diet. Food Chem. Toxicol. 2008, 46, 3090–3098. [Google Scholar] [CrossRef] [PubMed]
- More, S.J.; Bampidis, V.; Benford, D.; Bennekou, S.H.; Bragard, C.; Halldorsson, T.I.; Hernández-Jerez, A.F.; Koutsoumanis, K.; Naegeli, H.; Schlatter, J.R.; et al. Guidance on harmonised methodologies for human health, animal health and ecological risk assessment of combined exposure to multiple chemicals. EFSA J. 2019, 17, e05634. [Google Scholar] [CrossRef] [PubMed]
- Meek, M.E.; Boobis, A.R.; Crofton, K.M.; Heinemeyer, G.; Van Raaij, M.; Vickers, C. Risk assessment of combined exposure to multiple chemicals: A WHO/IPCS framework. Regul. Toxicol. Pharmacol. 2011, 60, S1–S14. [Google Scholar] [CrossRef] [Green Version]
- Chang, J.W.; Yan, B.R.; Chang, M.H.; Tseng, S.H.; Kao, Y.M.; Chen, J.C.; Lee, C.C. Cumulative risk assessment for plasticizer-contaminated food using the hazard index approach. Environ. Pollut. 2014, 189, 77–84. [Google Scholar] [CrossRef] [PubMed]
- Heinemeyer, G.; Sommerfeld, C.; Springer, A.; Heiland, A.; Lindtner, O.; Greiner, M.; Conrad, A. Estimation of dietary intake of bis(2-ethylhexyl)phthalate (DEHP) by consumption of food in the German population. Int. J. Hyg. Environ. Health 2013, 216, 472–480. [Google Scholar] [CrossRef]
- Sieke, C. Principles of consumer exposure assessment for pesticide residues. In The Practice of Consumer Exposure Assessment, 1st ed.; Heinemeyer, G., Ed.; Springer Nature Switzerland AG: Cham, Switzerland, 2020; pp. 315–322. [Google Scholar]
- Mahdavi, V.; Eslami, Z.; Molaee-Aghaee, E.; Peivasteh-Roudsari, L.; Sadighara, P.; Thai, V.N.; Ravanlou, A.A. Evaluation of pesticide residues and risk assessment in apple and grape from western Azerbaijan Province of Iran. Environ. Res. 2022, 203, 111882. [Google Scholar] [CrossRef]
- Farkas, Z.; Horváth, Z.; Szabó, I.J.; Ambrus, Á. Estimation of sampling uncertainty of pesticide residues based on supervised residue trial data. J. Agric. Food Chem. 2015, 63, 4409–4417. [Google Scholar] [CrossRef]
- Farkas, Z.; Cook, J.M.; Ambrus, Á. Estimation of uncertainty of measured residues and testing compliance with MRLs. In Food Safety Assessment of Pesticide Residues, 1st ed.; Ambrus, Á., Hamilton, D., Eds.; World Scientific: Hackensack, NJ, USA, 2017; pp. 404–466. [Google Scholar]
- Arienzo, M.; Cataldo, D.; Ferrara, L. Pesticide residues in fresh-cut vegetables from integrated pest management by ultra performance liquid chromatography coupled to tandem mass spectrometry. Food Control 2013, 31, 108–115. [Google Scholar] [CrossRef]
- European Commission Regulation No 1213/2008 of 5 December 2008 Concerning a Coordinated Multiannual Community Control Programme for 2009, 2010 and 2011 to Ensure Compliance with Maximum Levels of and to Assess the Consumer Exposure to Pesticide Residues in and on Food of Plant and Animal Origin. Available online: https://eur-lex.europa.eu/legal-content/HR/TXT/?uri=CELEX:32008R1213 (accessed on 5 November 2022).
- Sieke, C.; Lindtner, O.; Banasiak, U. Pflanzenschutzmittelrückstände. Nationales Monitoring, Abschätzung der Verbraucherexposition: Teil 2. Dtsch Leb. Rundsch 2008, 104, 336–342. [Google Scholar]
- US FDA Guidelines for the Validation of Chemical Methods in Food, Feed, Cosmetics, and Veterinary Products 3rd Edition. 2009. Available online: https://www.fda.gov/media/121751/download (accessed on 5 November 2022).
- Farkas, Z.; Slate, A.; Whitaker, T.; Kötelesné Suszter, G.; Ambrus, Á. Use of combined uncertainty information for testing compliance with MRLs. J. Agric. Food Chem. 2015, 63, 4418–4428. [Google Scholar] [CrossRef]
- Ambrus, Á.; Szenczi-Cseh, J.; Griff, T.; Kerekes, K.; Miklós, G.; Szigeti, T.; Vásárhelyi, A. Élelmiszereink mikotoxin és növényvédőszer-maradék szennyezettségének élelmiszerbiztonsági megítélése 1. rész növényvédőszer-maradékok; Food safety assessment of the mycotoxin and pesticide residue contamination of our foods, Part 1. Pesticide residues. J. Food Investig. 2020, 66, 2773–2801. Available online: https://eviko.hu/Portals/0/ujsagok/Arcivum/2020/1_szam/EVIK2020-1.pdf (accessed on 5 November 2022).
- FAO CAC GL 59-2006 Guidelines on Estimation of Uncertainty of Results; FAO: Rome, Italy, 2006; Available online: http://www.codexalimentarius.net/web/standard_list.do?lang=en (accessed on 5 November 2022).
- FAO CAC/GL 70-2009 Guidelines for Settling Disputes on Analytical (Test) Results; FAO: Rome, Italy, 2009.
- Codex Alimentarius Commission Procedural Manual, 24th ed.; FAO: Rome, Italy, 2015; Available online: https://www.fao.org/3/i5079e/i5079e.pdf (accessed on 5 November 2022).
- Commission Directive 2002/63/EK. Establishing community methods of sampling for the official control of pesticide residues in and on products of plant and animal origin and repealing Directive 79/700/EEC. 2002. Available online: https://eur-lex.europa.eu/legal-content/EN/ALL/?uri=celex%3A32002L0063 (accessed on 5 November 2022).
- European Commission Analytical Quality Control and Method Validation Procedures for Pesticide Residues Analysis in Food and Feed 11312/2021. Available online: https://food.ec.europa.eu/system/files/2022-02/pesticides_mrl_guidelines_wrkdoc_2021-11312.pdf (accessed on 5 November 2022).
- Ambrus, Á.; Farkas, Z.; Horváth, Z.; Kötelesné-Suszter, G. Principles and practices of control of pesticide residues in food. J. Food Investig. 2014, 60, 8–32. [Google Scholar]
- Ambrus, Á.; Szenczi-Cseh, J.; Griff, T.; Kerekes, K.; Miklós, G.; Szigeti, T.J.; Vásárhelyi, A. Food safety assessment of the mycotoxin and pesticide residue contamination of our foods, Part 2. Mycotoxins. J. Food Investig. 2020, 66, 2923–2949. [Google Scholar]
- Sharma, G.M.; Pereira, M.; Wang, S.S.; Chirtel, S.J.; Whitaker, T.B.; Wehling, P.; Williams, K.M. Evaluation of sampling plans for measurement of gluten in oat groats. Food Control 2020, 114, 107241. [Google Scholar] [CrossRef]
- Kötelesné-Suszter, G.; Ambrus, Á. Distribution of pesticide residues in the treated fields and uncertainty of sampling. J. Environ. Sci Health 2017, 52, 557–563. [Google Scholar] [CrossRef] [PubMed]
- Horváth, Z.; Ambrus, Á. Principles of control of small-scale production of fruits and vegetables and planning risk-based monitoring programmes. In Food Safety Assessment of Pesticide Residues, 1st ed.; Ambrus, Á., Hamilton, D., Eds.; World Scientific: Hackensack, NJ, USA, 2017; pp. 467–506. [Google Scholar]
- European Commission Implementing Regulation (EU) 2019/533 of 28 March 2019 Concerning a Coordinated Multiannual Control Programme of the Union for 2020, 2021 and 2022 to Ensure Compliance with Maximum Residue Levels of Pesticides and to assess the Consumer Exposure to Pesticide Residues in and on Food of Plant and Animal Origin. Available online: https://eur-lex.europa.eu/legal-content/EN/TXT/?uri=CELEX%3A32019R0533 (accessed on 5 November 2022).
- The 2020 European Union Report on Pesticide Residues. Available online: https://multimedia.efsa.europa.eu/pesticides-report-2020/ (accessed on 5 November 2022).
- US FDA Pesticide Residue Monitoring Program Reports and Data; FSA: Washington, DC, USA,, 2022. Available online: https://www.fda.gov/food/pesticides/pesticide-residue-monitoring-program-reports-and-data (accessed on 5 November 2022).
- Lombardo, P. The FDA Pesticides Program: Goals and New Approaches. J. AOAC Int. 1989, 72, 518–520. [Google Scholar] [CrossRef]
Figure 1.
Number of food item(s) consumed in one day by one consumer [44].
Figure 1.
Number of food item(s) consumed in one day by one consumer [44].

Figure 2.
Relative frequency distribution of chlorpyrifos-methyl residues in apples 1 day after the pesticide treatment. Notes: sample size is indicated with ‘n’. 1 for primary samples (single apple) n = 10 is a composite sample consisting of 10 apples. Sampling standards require a composite sample of size 10 for testing compliance with MRLs [8], sample size 25 often collected in supervised field trials [43].

Figure 3.
Relative frequency distribution of apple consumption [g/kgbw day] in 4720 days and unit mass (922) of apples [kg].
Figure 3.
Relative frequency distribution of apple consumption [g/kgbw day] in 4720 days and unit mass (922) of apples [kg].

Figure 4.
Captan residues (271) in composite samples of size 10–12.

Figure 5.
Variability factors (1769) for captan residues in individual apples.

Figure 6.
Captan exposure from apple consumption. Taken with permission from [72].
Figure 6.
Captan exposure from apple consumption. Taken with permission from [72].

Figure 7.
Evaluation of measurement results, taking into consideration of measurement uncertainty for testing compliance with MRLs.
Figure 7.
Evaluation of measurement results, taking into consideration of measurement uncertainty for testing compliance with MRLs.

Figure 8.
Distribution of residues in apple composite samples taken from a lot with mean residue of 0.11 mg/kg and CVR of 0.35. The MRL of 0.1 mg/kg is indicated by the blue arrow.
Figure 8.
Distribution of residues in apple composite samples taken from a lot with mean residue of 0.11 mg/kg and CVR of 0.35. The MRL of 0.1 mg/kg is indicated by the blue arrow.

Table 1.
Examples for the reported results of national pesticide residue monitoring programmes conducted in 2020.
Table 1.
Examples for the reported results of national pesticide residue monitoring programmes conducted in 2020.
| Number of | Distribution of Residues [%] | |||||
|---|---|---|---|---|---|---|
| Country | Samples | Residues 1 | >MRL | R 1 > LOQ | R < LOD | No MRL |
| USA [9] | 9600 | 584 | 0.49 | 66.7 | 30 | 3.2 |
| EU [10] | 88141 | 659 | 3.6 | 40.3 | 54.6 | |
| Austria [11] | 809 | 671 | 3 | |||
| Germany [12] | 18461 | 626 | 3.1 | 62.9 | 37.1 | |
| Hungary [13] | 4667 | 526 | 0.68 | 51.5 | 35.9 | 11.8 |
Notes: 1: various residues/metabolites searched for in different samples. >MRL: number of samples containing residues above the MRL; R > LOQ: number of samples containing residues in a quantifiable concentration; R < LOD: number of samples containing non-detectable residues; No MRL: residues that have no MRL established in the tested commodity.
Table 2.
Minimum number of samples required to detect at least one residue above a specified concentration (e.g., MRL) at the selected violation rates (βv) with pre-defined probability (βt).
Table 2.
Minimum number of samples required to detect at least one residue above a specified concentration (e.g., MRL) at the selected violation rates (βv) with pre-defined probability (βt).
| βt [%] | 80 | 90 | 95 | 98 | 99 | 99.9 |
|---|---|---|---|---|---|---|
| βv [%] | Number of Samples to Be Taken | |||||
| 0.1 | 1609 | 2302 | 2995 | 3911 | 4603 | 6905 |
| 1 | 161 | 230 | 299 | 390 | 459 | 688 |
| 2 | 80 | 114 | 149 | 194 | 228 | 342 |
| 2.5 | 64 | 91 | 119 | 155 | 182 | 273 |
| 5 | 32 | 45 | 59 | 77 | 90 | 135 |
| 10 | 16 | 22 | 29 | 38 | 44 | 66 |
Table 3.
Recommended number of samples depending on the calculated weighting factor (fp).
| fp | n | βt% 1 |
|---|---|---|
| ≥100 | 149 | 95 |
| ≥75 | 115 | 90 |
| ≥50 | 100 | 87 |
| ≥40 | 60 | 70 |
| ≥30 | 45 | 60 |
| ≥20 | 30 | 45 |
| ≥15 | 15 | 26 |
| ≥10 | 10 | 18 |
| < 10 | 0 | 0 |
1: Probability of detecting at least one value above 98th percentile of residues.
Table 4.
Example for the MRLs included in the code dictionary of the central database.
| Crops | Code | Pesticides | Code | Type of Legislation | Legislation | MRL (mg/kg) | Valid From | End of Validity |
|---|---|---|---|---|---|---|---|---|
| Apples | 118725 | chlorpyrifos | 219095 | EU | Regulation (EC) No 396/2005 | 0.01 | 13.11.2020 | |
| 118725 | chlorpyrifos | 219095 | EU | Regulation (EC) No 396/2005 | 0.5 | 10.08.2016 | 12.11.2020 | |
| 118725 | chlorpyrifos | 219095 | EU | Regulation (EC) No 396/2005 | 0.5 | 01.09.2008 | 09.08.2016 | |
| 118725 | chlorpyrifos | 219095 | National | Regulation 5/2002 FVM | 0.5 | 01.01.1989 | 31.08.2008 |
Disclaimer/Publisher’s Note: The statements, opinions and data contained in all publications are solely those of the individual author(s) and contributor(s) and not of MDPI and/or the editor(s). MDPI and/or the editor(s) disclaim responsibility for any injury to people or property resulting from any ideas, methods, instructions or products referred to in the content. |
© 2023 by the authors. Licensee MDPI, Basel, Switzerland. This article is an open access article distributed under the terms and conditions of the Creative Commons Attribution (CC BY) license (https://creativecommons.org/licenses/by/4.0/).
Share and Cite
MDPI and ACS Style
Ambrus, Á.; Szenczi-Cseh, J.; Doan, V.V.N.; Vásárhelyi, A. Evaluation of Monitoring Data in Foods. Agrochemicals 2023, 2, 69-95. https://doi.org/10.3390/agrochemicals2010006
AMA Style
Ambrus Á, Szenczi-Cseh J, Doan VVN, Vásárhelyi A. Evaluation of Monitoring Data in Foods. Agrochemicals. 2023; 2(1):69-95. https://doi.org/10.3390/agrochemicals2010006
Chicago/Turabian StyleAmbrus, Árpád, Júlia Szenczi-Cseh, Vy Vy N. Doan, and Adrienn Vásárhelyi. 2023. "Evaluation of Monitoring Data in Foods" Agrochemicals 2, no. 1: 69-95. https://doi.org/10.3390/agrochemicals2010006