Article

Effect of the N501Y Mutation on Ligands Complexed with SARS-CoV-2 RBD: Insights on Potential Drug Candidates for COVID-19

by
Camila Fonseca Amorim da Silva
1,
Samanta Omae Camalhonte
1,
Michell de Oliveira Almeida
2,
Sheila Cruz Araujo
3,
Miriam Sannomiya
1,
João Henrique Ghilardi Lago
3 and
Kathia Maria Honorio
1,3,*
1
School of Arts, Sciences and Humanities, University of Sao Paulo, Sao Paulo 03828-000, Brazil
2
Department of Chemistry and Molecular Physics, Chemistry Institute of Sao Carlos, University of Sao Paulo, Sao Carlos 13566-590, Brazil
3
Natural and Human Sciences Center, Federal University of A.B.C., Santo Andre 09210-580, Brazil
*
Author to whom correspondence should be addressed.
Drugs Drug Candidates 2023, 2(2), 433-458; https://doi.org/10.3390/ddc2020022
Submission received: 12 April 2023 / Revised: 8 May 2023 / Accepted: 22 May 2023 / Published: 30 May 2023
(This article belongs to the Section Biologics)

Abstract

:
Bioactive compounds against SARS-CoV-2 targets could be potential treatments for COVID-19. Inhibitors of the receptor-binding domain (RBD) on the viral spike protein can block its binding to the human angiotensin-converting enzyme type II (ACE2) receptor. This study presents ligands based on natural products and synthetic compounds, targeting multiple N501/Y501 RBDs, besides RBD-ACE2, over different regions. The selected compounds were evaluated by docking using consensus scoring, pharmacokinetics/toxicological analyses, and molecular dynamics. Additionally, N501/Y501 RBD-ACE2 interaction properties and RBD–ligand complexes were compared. We identified that coenzyme Q10, 1-stearoyl-2-arachidonoylglycerol, and palmitone showed the greatest RBD interactions. Targeting specific residues (in particular, tyrosine) in the C-, N-terminal, and central RBD sites promoted more stable protein–ligand interactions than in the N-terminal region only. Our results indicate that the molecules had more energetically favorable interactions with residues from distinct RBD regions rather than only interacting with residues in the N-terminal site. Moreover, the compounds might better interact with mutated N501Y than N501 RBDs. These hits can be optimized to leads and investigated through QSAR models and biological assays to comprehend mechanisms better. Altogether, such strategies may anticipate antiviral strategies if or when future variants and other CoVs arise.

1. Introduction

The pandemic involving the SARS-CoV-2 virus has escalated to over 765 million confirmed cases and approximately seven million deaths due to the COVID-19 disease [1], exceeding the outbreaks of SARS-CoV, MERS-CoV, and other human CoVs (HCoVs) [2,3]. From the emergence of atypical pneumonia cases around December 2019 linked to a seafood market in Wuhan, China [4,5,6], to the worldwide viral spread, there has been an urgency to tackle this beta-coronavirus.
Zoonotic origins are common in HCoVs and other viruses, characterized by a cross-species spillover [7]. Certain anthropic activities, such as the expansion of animal agriculture, habitat destruction, consumption of wild animals, and/or trade of living species in wet markets, are primary risks for zoonosis [8]. Furthermore, SARS-CoV-2 has been compared and contrasted to bat and pangolin-derived CoVs [9], animals that could be the initial and potentially intermediate hosts, although this remains inconclusive [10]. Regarding infection, after SARS-CoV-2 enters the human body mainly through an oronasal route, the viral spike (S) transmembrane glycoprotein binds to the angiotensin-converting enzyme type II (ACE2) receptor from the host [11]. Then, S is cleaved into S1 and S2 subunits. S1 contains the receptor-binding domain (RBD), which binds to the peptidase domain (PD) of ACE2, whereas S2 is involved in cell entry via membrane fusion or endocytosis, exposing a functional polybasic cleavage site (RRAR) between S1 and S2, which is processed by host proteases, noticeably furin. In addition, S2 exposes a fusion peptide with the S2′ site, resulting in a viral envelope and cellular membranes fused [12]. Inside the cell is a release of viral RNA and translation of its proteins, followed by exocytosis of viral particles [13].
Due to the relevance of RBD at the beginning and the progression of the disease, targeting key residues has been one of the strategies for drug repurposing and discovery, as well as vaccine development. It has been reported that RBD inhibition can block its interaction with ACE2 [14,15] and may prevent viral entry in cells. Otherwise, SARS-CoV-2 entrance would be favored by the extensively glycosylated S protein—a feature that promotes immune evasion [16], among S preactivation by furin, higher RBD-ACE2 binding affinity than in SARS-CoV, and a less exposed RBD [17].
Regarding drugs to mitigate this disorder, certain therapeutics are being administered according to the disease severity or not being recommended at all (e.g., hydroxychloroquine) [18,19,20,21,22]. For example, there is a recommendation for systemic corticosteroids such as dexamethasone for severe or critical patients. However, dexamethasone was not beneficial for milder cases, and concerns have been addressed [18,23,24,25,26]. Conversely, Molnupiravir has been recommended for some non-severe COVID-19 patients, but its long-term effects remain uncertain [18]. Thus, identifying safer and more effective drugs to be used in broader contexts remains to be accomplished.
Although several vaccines have been approved, there are certain hindrances and uncertainties: availability of supplies, production scalability, mass distribution, risks of the insufficient adaptive immune response, waning immunity, immune evasion [27], emerging variants [28], etc. Namely, alpha, beta, gamma, and omicron Variants of Concern (VoC) share the N501Y mutation in RBD, which could diminish viral neutralization by vaccines [29].
Amid scientific breakthroughs and concerns, drug repurposing and discovery play a substantial role. The larger the variety of safe and effective approaches, the greater the possibilities; it could circumvent the risks of a procedure not being available, expand the options better suited for a patient, and provide alternatives if or when there is drug resistance. In this scope, computational techniques offer powerful tools for the virtual screening of proteins and ligands from databases, molecular docking, insights on protein–ligand interactions, mutation effects, absorption/distribution/metabolism/excretion/toxicity (ADMET) properties of molecules, molecular dynamics (MD), and beyond [30,31]. In this study, we have employed these resources to evaluate potential SARS-CoV-2 RBD inhibitors under various circumstances.

2. Results and Discussion

2.1. Validation of Docking and ADMET Results

A precision–recall curve of control molecules enabled validation of the docking results (see “Section 3” and Figure 1). The curve resulted in 78.95% for both precision and recall, which suggests relatively low false positive and false negative rates, respectively. Moreover, there was a moderate accuracy of 66.67%, considering the overall prediction of true positives, true negatives, false positives, and false negatives. The ECR method performed better when ranking the most active ligands (positive controls) than when ranking the least active ones (negative controls). The most active control molecule (according to IC50 data in Supplementary Information—Table S2) was correctly ranked above the others. On the other hand, the least active molecules tended to occupy intermediate or lower positions of the rank, but not necessarily ordered by their IC50 values. Therefore, the docking algorithm identified the best-ranked active compounds quantitatively and the inactive ones qualitatively. Hence, the most reliable results are within the best-ranked compounds. Nevertheless, it should be considered that experimental settings not within the researchers’ control and variations in methods from different studies might affect IC50 values. Another limitation was the sample size of the controls relative to the other datasets because of the availability of data found at the time of this study and considering specified conditions (see Section 3).
To validate the ADMET results, the ADMET properties of control molecules were predicted using SwissADME, AdmetSAR 2.0, and eMolTox servers and compared to their available data in the scientific literature. After verifying the predicted results, they were used as a reference for the ADMET results of natural and synthetic molecules, enabling comparisons among the analyzed properties.

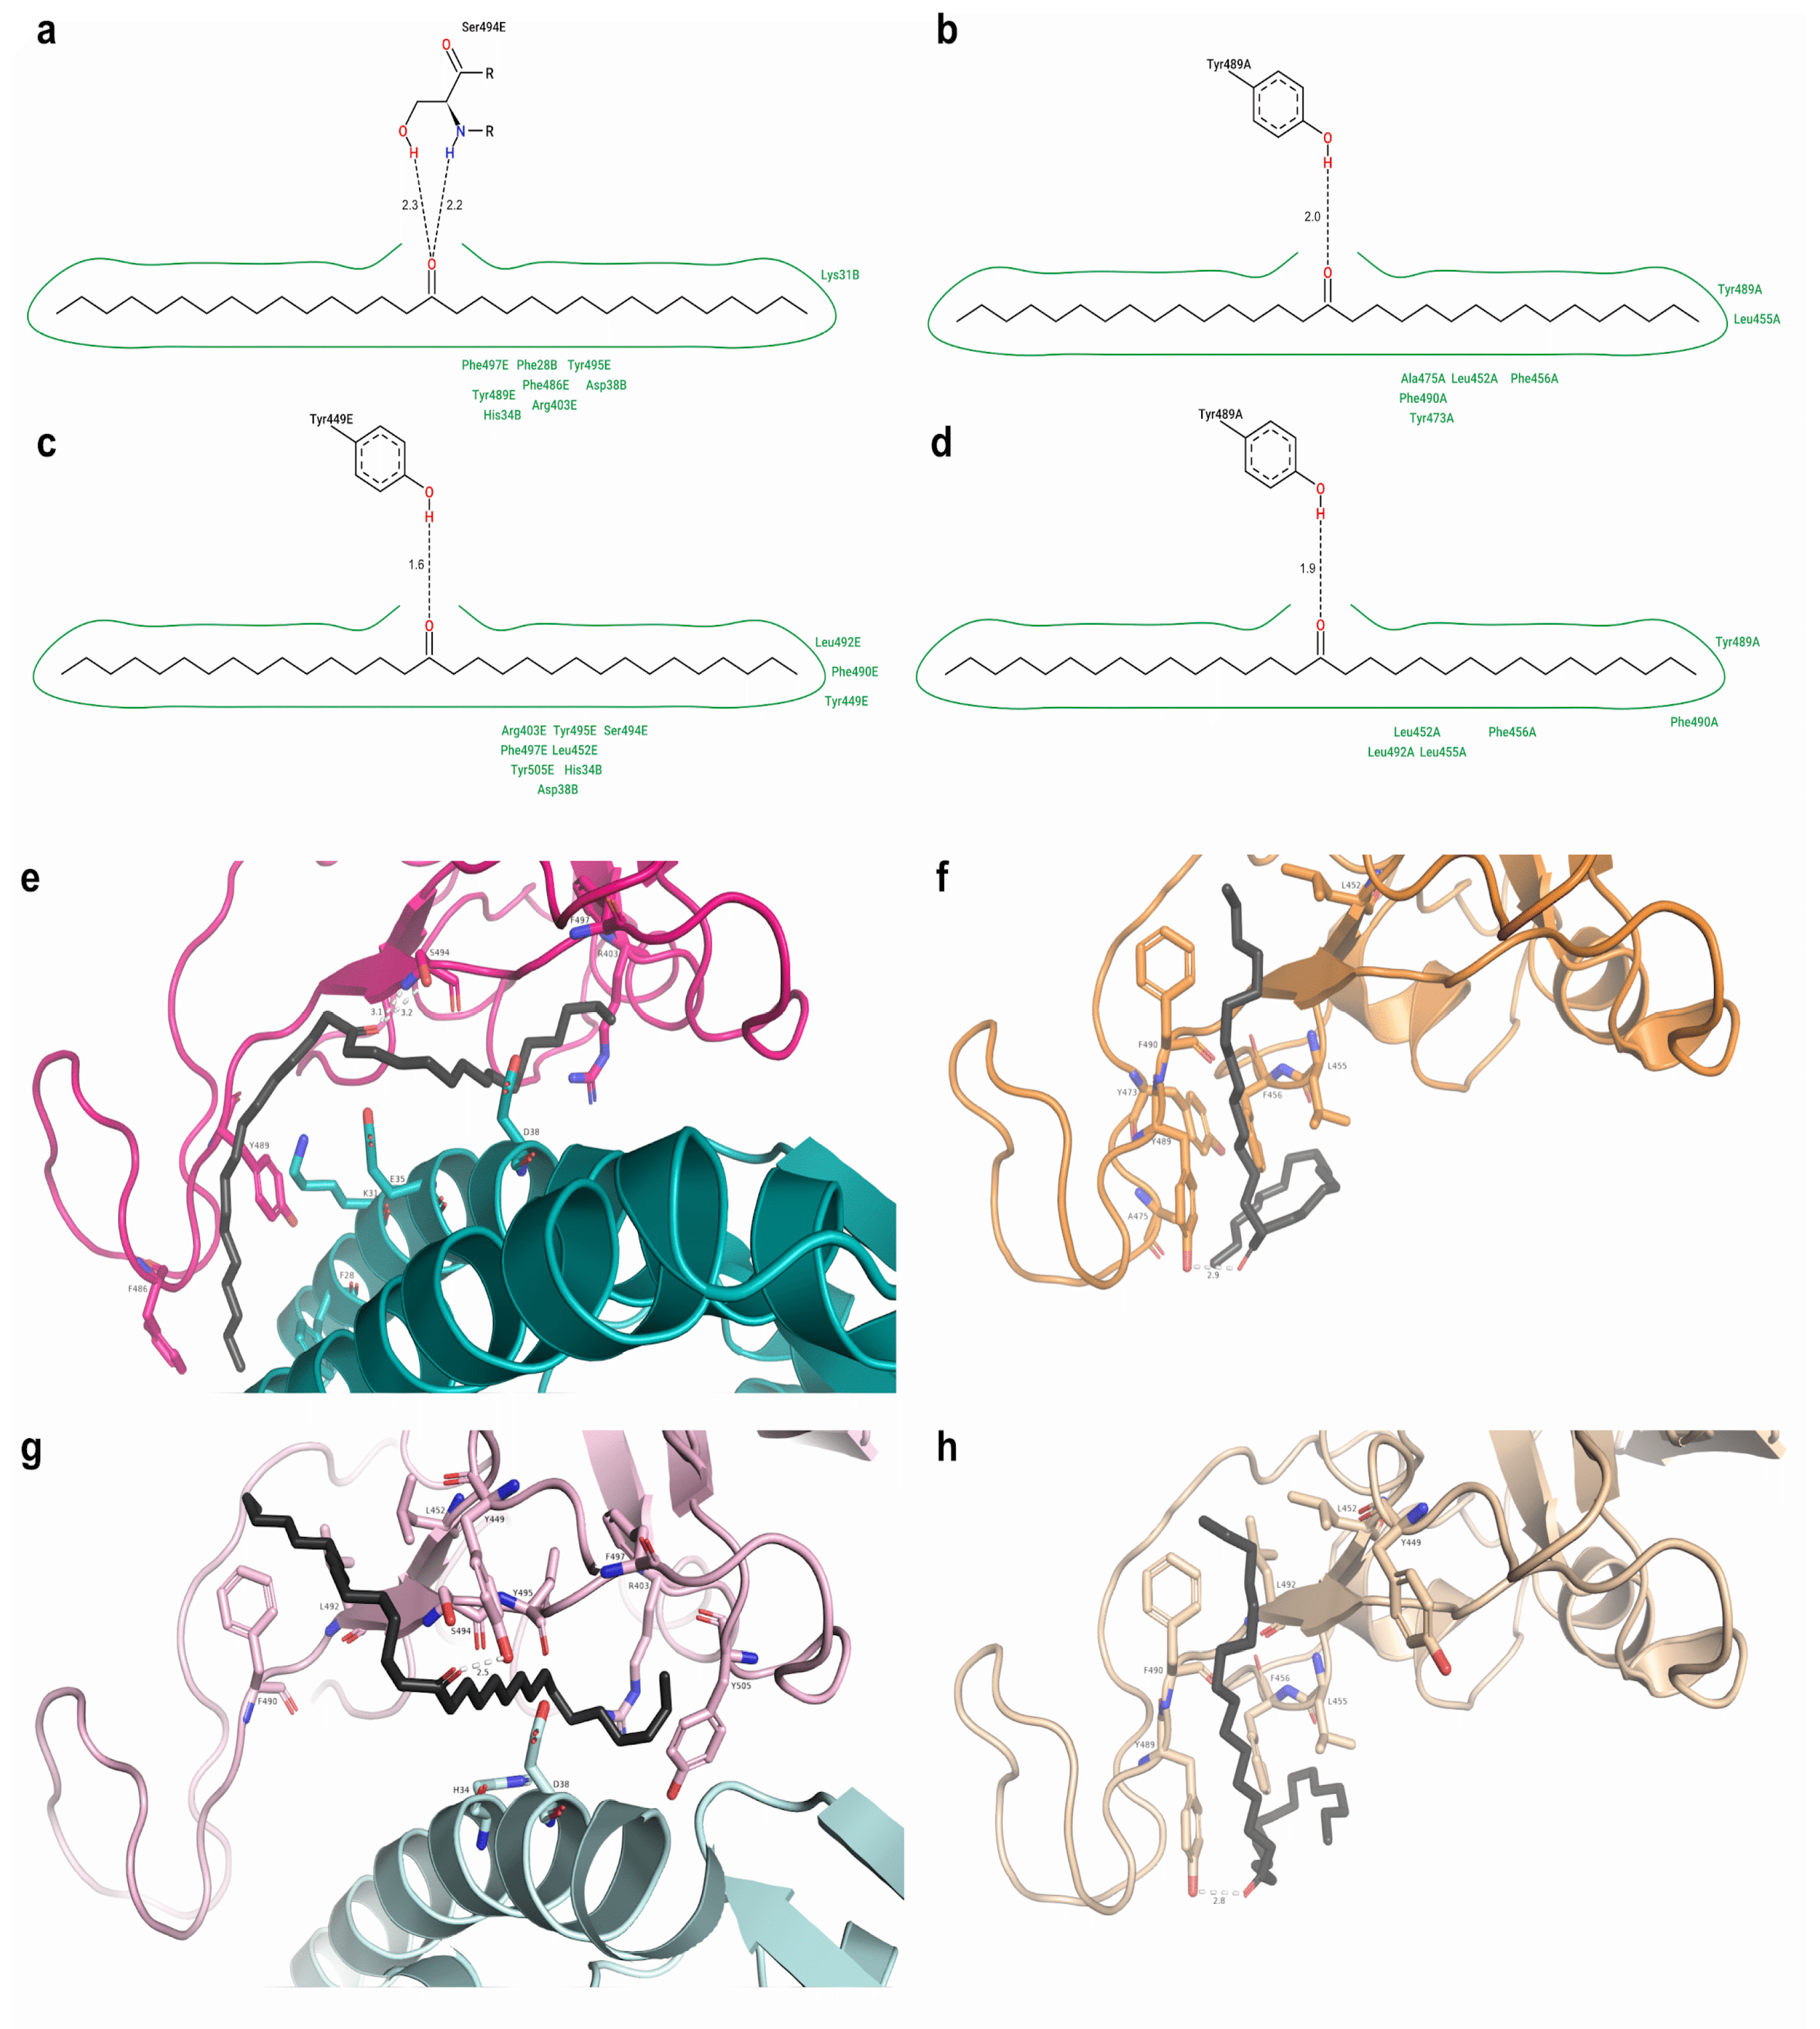
2.2. Protein–Ligand Docking

To assess if RBD has a more suitable region that interacts with potential inhibitors, we investigated whether there were significant differences between the docking results of the compounds on the broad and specific regions. Besides assessing how the results diverged according to the RBD region, we compared them by the absence or presence of mutation, analyzing if there were such differences for wild-type (N501) and mutated (N501Y) RBDs (see Figures S10 and S11). This analysis was possible using scoring functions (ChemScore and ChemPLP) and a function term (ChemScore’s ΔG) to assign a score to each docking analysis.
We found a significant difference between the results for the compounds in the wide and specific regions when comparing their Chemscore, ΔG, and ChemPLP values (Supplementary Information—Figures S1 and S2). Similarly, N501 and N501Y results were significantly different (paired Wilcoxon test, Supplementary Information—Tables S4–S6). Ligands docked on the broad region and/or N501Y RBDs performed better than on the specific region and/or N501 RBDs. This finding suggests that the wide region could be a better target than the particular site when repurposing or designing drugs that inhibit RBD. This finding could also imply that molecules would have a greater binding affinity to the mutated RBD than to the wild-type version.
A consensus ranking (see Section 3) with ChemScore, ΔG, and ChemPLP values for each compound allowed screening of the three best-ranked compounds, taking into account all compound sets (top three control, natural, and synthetic molecules) for each RBD version (N501 or N501Y) in the broad region (since it was the site where the compounds had greater scores). This analysis shows that the three best-ranked molecules in each compound category (Table 1) can be considered hits (the top 10 best-ranked molecules are available in Figure 2).
After performing these docking simulations (with the entire compound sets in all the circumstances described) and identifying the ten hits, repetitions of dockings were performed only with them (see Section 3). As previously presented, Chemscore, ΔG, and ChemPLP values were significantly greater in N501Y than in N501 RBD-containing structures. However, this was not seen for ECRs (Figure 3). This could be expected since Chemscore, ΔG, and ChemPLP represent values and ECRs are related to rankings. Therefore, N501/N501Y differences are more noticeable in the Chemscore, ΔG, and ChemPLP, but not in ECR, whereas differences among the ligand scores (and rankings in ECR) were noticed in all of them. The top three from the ten hits, s131, s443, and n115, had a better performance in the Chemscore, ΔG, and ChemPLP values and ECRs than the hit controls (Figure 3).

2.3. Top Three Hit Compounds from Docking Simulations

Coenzyme Q10 (s131) established two hydrogen bonds with S494 and one with Y449 and Q493 (RBD) on N501 RBD-ACE2; there were hydrophobic interactions with E484, F486 (RBD), L39, and F72 (ACE2). In N501Y RBD-ACE2, there were mostly shorter or similar-length H bonds with the same aforementioned residues, but different atoms. Instead of two hydrogen bonds among a ketone oxygen on coenzyme Q10, Q493, and S494, there were two shorter H bonds between a carbonyl and S494, strengthening the interactions—but the ketone group H bond with Q493 was weaker. Hydrophobic interactions were found with Y449, Y489 (RBD), F28, K31, E35, L39, F72, and L79 (ACE2), indicating an increase in this interaction type (Figure 4). N501 and N501Y RBDs from 6XE1 were the best-ranked in the docking simulations with s131. In N501 RBD, s131 formed a hydrogen bond with G502 and Y505; it interacted hydrophobically with Y421, Y453, L455, F456, Y473, A475, Y489, Q493, Y495, F497, and Y505—notably with several tyrosine residues. In N501Y RBD, s131 had a H bond with Y501, and hydrophobic interactions with K417, Y421, L455, F456, Y473, A475, E484, Y489, F497, and Y505 (Figure 4).
When docked with N501 RBD-ACE2, 1-stearoyl-2-arachidonoylglycerol (s443) formed three hydrogen bonds with S494 and one with Y449 (RBD); a similar situation was noticed between s443 and N501Y RBD-ACE2, except having one less hydrogen bond than with Y449 (RBD). This molecule interacted hydrophobically with K31, L39, and L79 (ACE2) from N501 and N501Y RBD-ACE2. There were hydrophobic interactions promoted by F490 (RBD) uniquely from N501 RBD-ACE2, and Y489, L492 (RBD), F28, F72, and K68 (ACE2) solely from N501Y RBD-ACE2, which had nearly twice the number of residues contributing to hydrophobic interactions (Figure 5). N501 and N501Y RBDs with the most favorable interactions were both from 7JMP. In N501 RBD, the s443 ligand had a hydrogen bond with Y489 and another with N487. In N501Y RBD, there were two hydrogen bonds with S494 and one with Y449. Both RBDs established hydrophobic interactions due to L455 and F456 (RBD). In contrast, L452, Y489, and F490 were only found in N501 RBD, whereas Y449 and Y505 promoted these interactions solely in N501Y RBD (Figure 5).
In N501 RBD-ACE2, palmitone (n115) established two hydrogen bonds with S494 (RBD); in the N501Y complex, it formed a hydrogen bond with Y449 (RBD) within a shorter distance. Both complexes had hydrophobic interactions with R403, Y495 and F497 (RBD), and H34 and D38 (ACE2). Only the N501 complex interacted hydrophobically with Y489 and F486 (RBD), and F28 and K31 (ACE2), whereas N501Y RBD-ACE2 presented a greater number of hydrophobic interactions—as s131 at such complex—and exclusive ones with Y449, L452, F490, L492, S494, and Y505 (RBD) (Figure 6). On N501 and N501Y RBDs with the most favorable interactions (7JMP), palmitone formed a hydrogen bond with Y489. It also presented hydrophobic interactions with Y489, L452, L455, F456, and F490, in both N501 and N501Y 7JMP RBDs. Conversely, A475 and Y473 were only found on N501 7JMP, whereas L492 was solely in N501Y 7JMP, which interacted less hydrophobically (Figure 6).
A protein–ligand interaction map was obtained (Supplementary Information—Figure S4). We observed more overall (hydrophobic and H bond) interactions in the mutated RBD-containing structures than in those not mutated, and the hydrophobic type prevailed over H bonds. The selected hits interacted mostly with Y489, F456, and L455 (hydrophobic contacts) and Y489, S494, and Q493 (H bonds) in not mutated RBD-containing structures; in the mutated case, Y505, Y489, L455 (hydrophobic), S494, Y449, and Y501 were noticeable (H bonds). Interestingly, several other tyrosine residues appeared among interactions, namely Y453, Y449, Y505, Y495, Y501, Y489, Y453, Y473, Y421, and Y351, forming hydrophobic contacts and/or H bonds. Unlike the docking figures and for simplification reasons, we would like to stress that the charts considered the number of interactions a ligand established per residue, not per atom of residue (some ligands established multiple contacts with the same residue). Thus, the differences between overall interactions in not mutated versus mutated RBD-containing structures and H bonds versus hydrophobic interactions may be even greater.

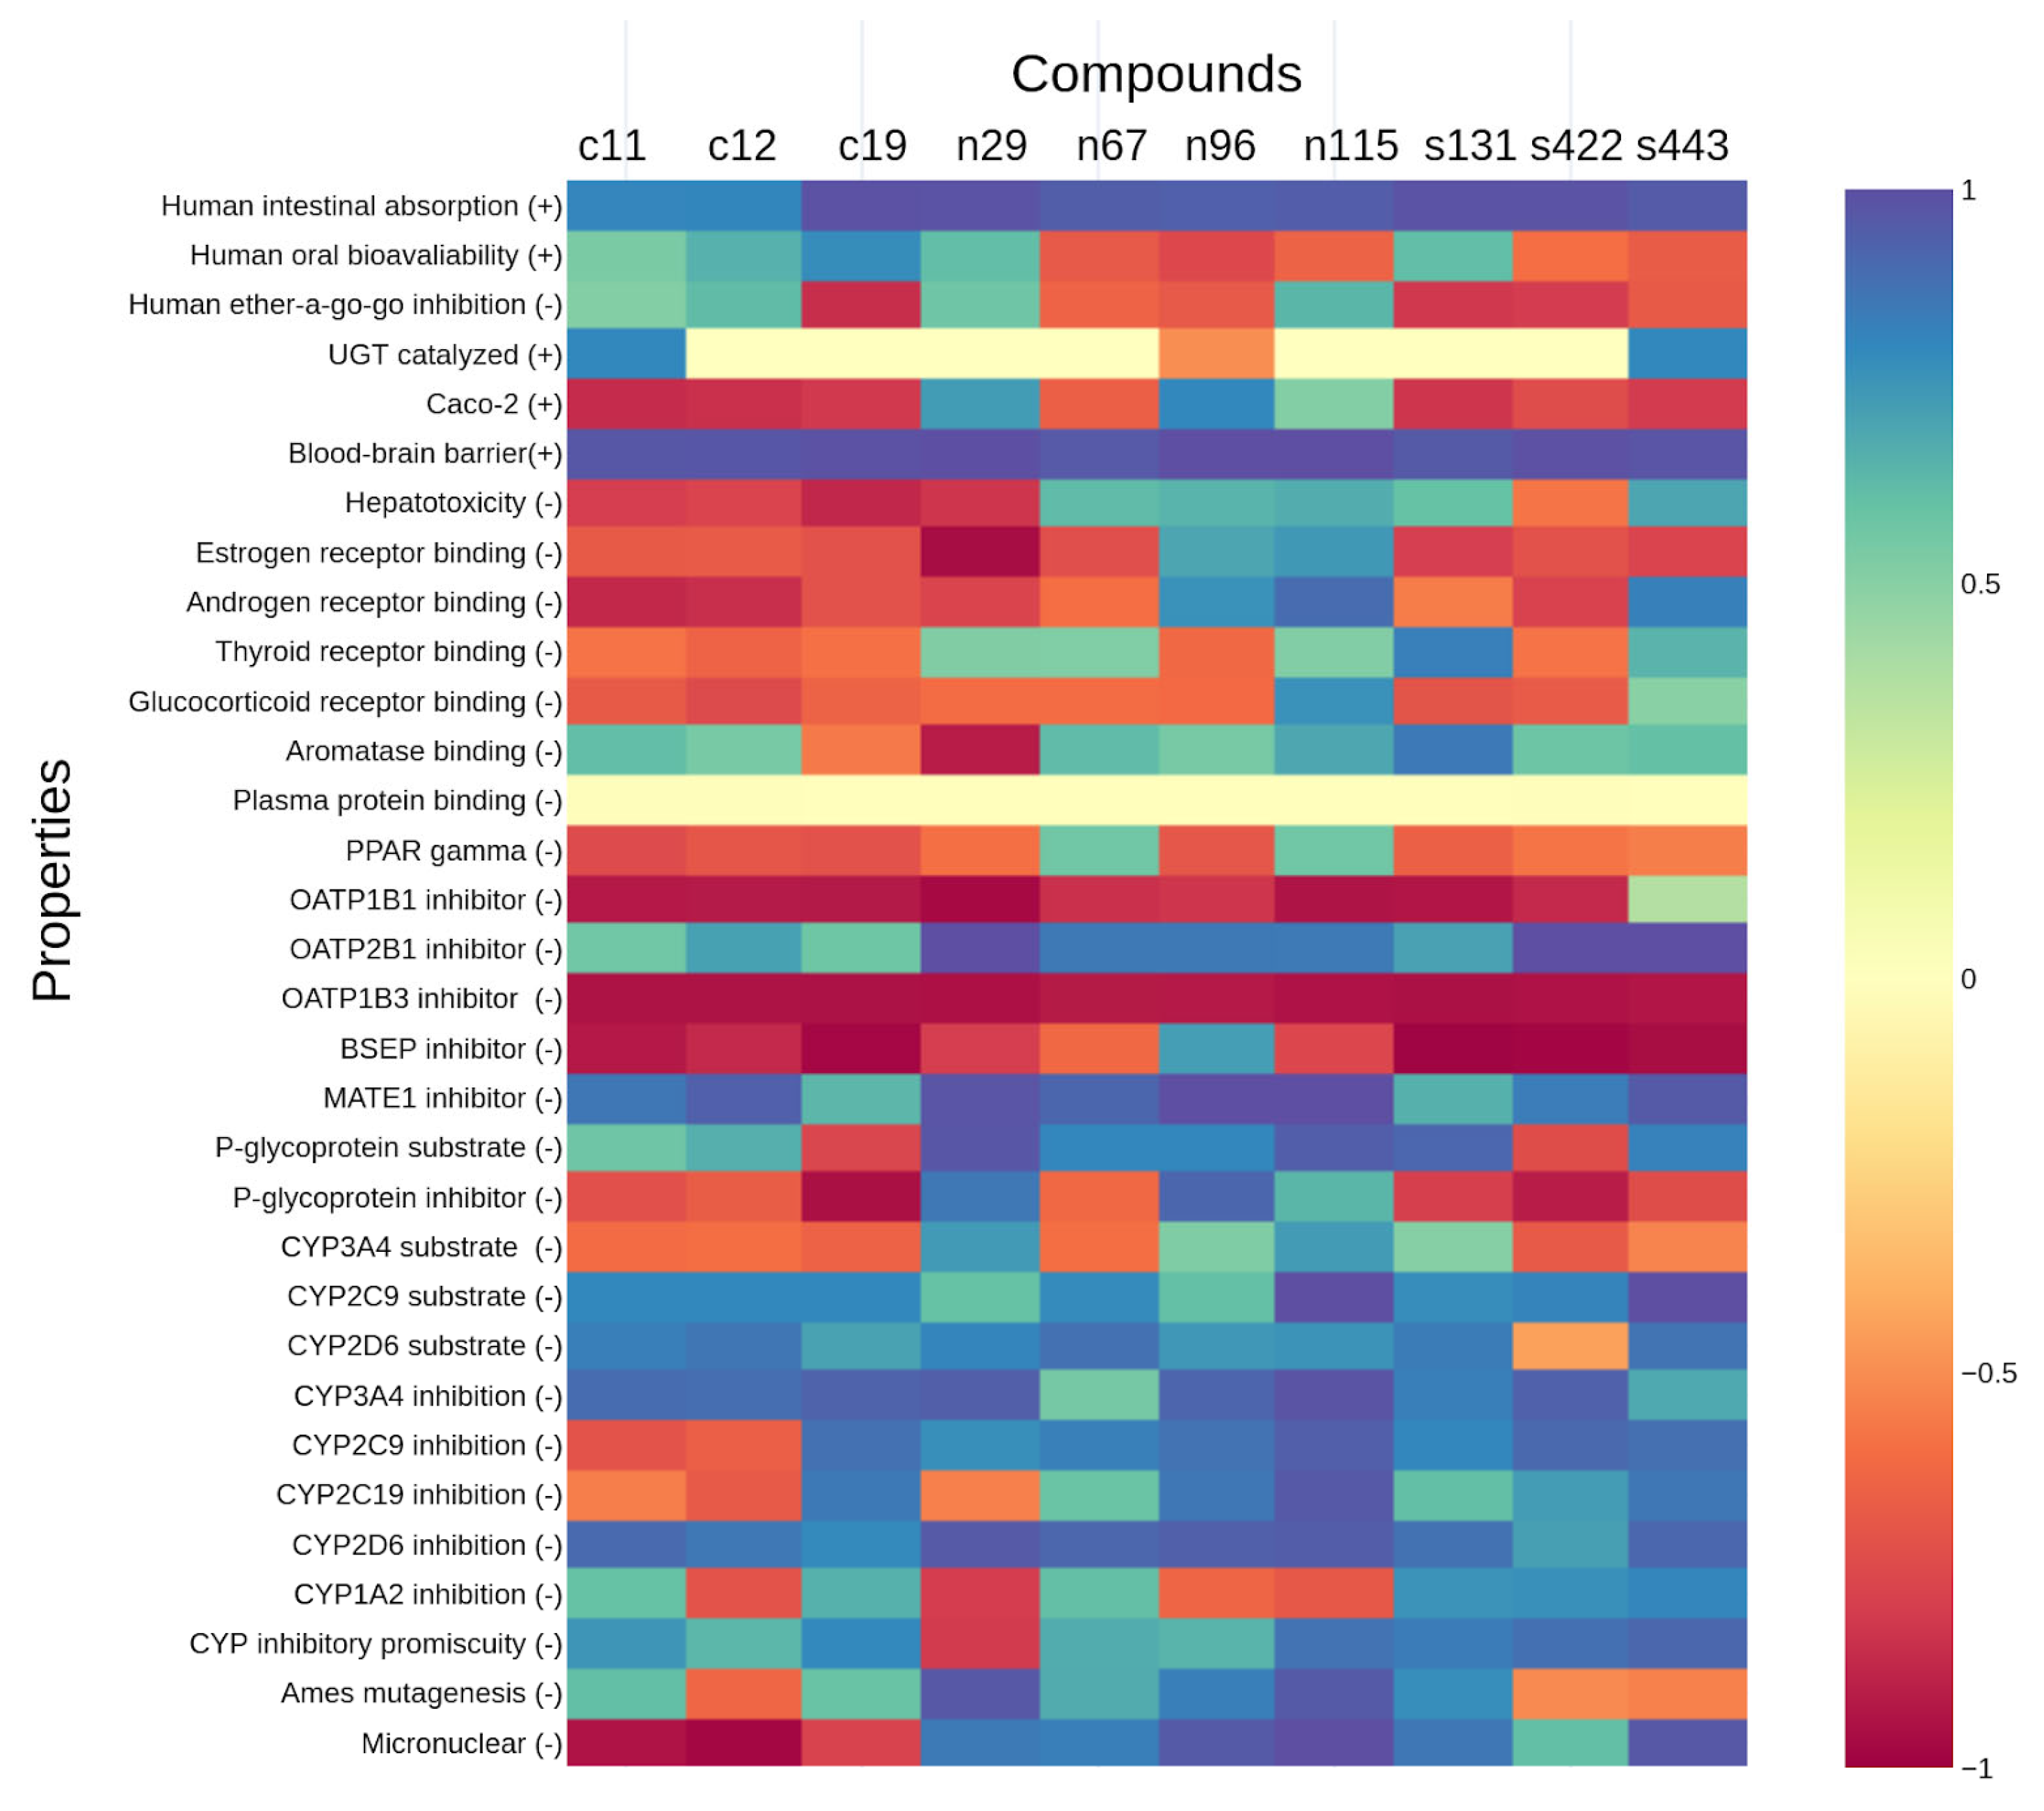
2.4. Analyses of ADMET Properties

SwissADME retrieved ADME properties for all the datasets, including the hit compounds (see Figure S3). Among the hits, the top three had unsaturation and polarity (minimal to moderate, which does not imply the molecule is polar, instead suggesting an acceptable value in the bioavailability radar) within the ideal range. On the other hand, they were deemed highly flexible, lipophilic, and insoluble in water; s131 and s443 were larger (size) than n115—hence optimizing the hits to leads is essential. However, c11 and c12 either minimally surpassed or were on the verge of reaching flexibility, lipophilicity, insolubility, and size intervals, so this could minimize the needed changes during the optimization phase. Concerning other natural and synthetic hits, n96 had a within-range bioavailability radar as c19 did, and n29 only had the number of unsaturation exceeding the optimal interval. This finding was not necessarily an issue since c11 and c12 also exceeded the range of that property (Supplementary Information—Figure S8). Using the AdmetSAR 2.0 tool, we observed that all of the hits have high intestinal absorption, the ability to cross the blood–brain barrier, and possibly do not act as MATE1 or OATP2B1 inhibitors; most of them do not portray CYP-inhibitory promiscuity (but they can be inhibitors or substrates in specific cases), aromatase binding, or mutagenic potential (s422 and s443 did test positive for Ames mutagenesis test). However, since one of the controls tested positive, this property requires cautious interpretation. In addition, hepatotoxicity and thyroid receptor binding are unlikely for most natural and synthetic hits. Some control hits (n29 and s131) seem to have adequate oral bioavailability; unlike the controls and others, only n29, n96, and n115 presented positive results for Caco-2 permeability, and n67 and n115 were negative for PPARγ inhibition.
In general, results for compounds involved in UGT-catalyzed reactions or plasma protein binding were inconclusive. Moreover, most natural and synthetic hits were classified as OATPB1, OATP1B3, BSEP, P-glycoprotein inhibitors, and/or disruptors of PPARγ, estrogen, androgen, and glucocorticoid receptors. Despite this concern, it is worth mentioning that the control hits also presented these properties, thus suggesting the other hits might present a similar profile. Nevertheless, among the top three hits, n115 did not appear to bind to any of the endocrine receptors assessed (estrogen, androgen, thyroid, glucocorticoid, PPARγ, and aromatase receptors), but s131 and s443 did present positive results for some of them (Figure 7).
From the eMolTox server, we verified that some results diverged in some instances, partly because (1) this web server works with a significance level chosen by the user (thus, it is susceptible to returning inconclusive outputs when the result exceeds the error threshold), and (2) there may be some differences in the applicability domain. None of the selected hits were predicted to modulate angiotensin-converting enzyme; neither did they modulate angiotensin II type 1 or 2 receptors (only s131 presented one inconclusive result for the latter ones). Since uncertainty remains on whether modulating these components is ideal against COVID-19, these outputs are desirable. They also appeared not to interfere as modulators of several receptors and related components. Conversely, most of the analyzed hits either were inconclusive or positive for cytotoxicity, even though this was the case for the control hits, which also had other toxicities predicted (Supplementary Information—Table S9).
Finally, using the PathwayMap server, we assessed if there was any association between metabolic pathways and each molecule from all datasets (Supplementary Information—Figure S9). Focusing on the top three hits and taking all of their ADMET results into account, we can observe that there are improvements and assessments to be made in these compounds: (1) to explore drug-delivery media and bioisosteres to enhance water solubility to obtain better oral bioavailability; (2) to test changes in flexibility, size, and unsaturation; (3) to investigate if and how they and their analogs could or could not interfere on hERG channels and/or endocrine receptors, also assessing cytotoxicity, mutagenicity, genotoxicity, etc.; and (4) to compare the bioisosteres using other ADMET properties, as well as performing molecular docking and molecular dynamics simulations of the fittest, which could be submitted for bioassays (along comparisons with their original counterparts).

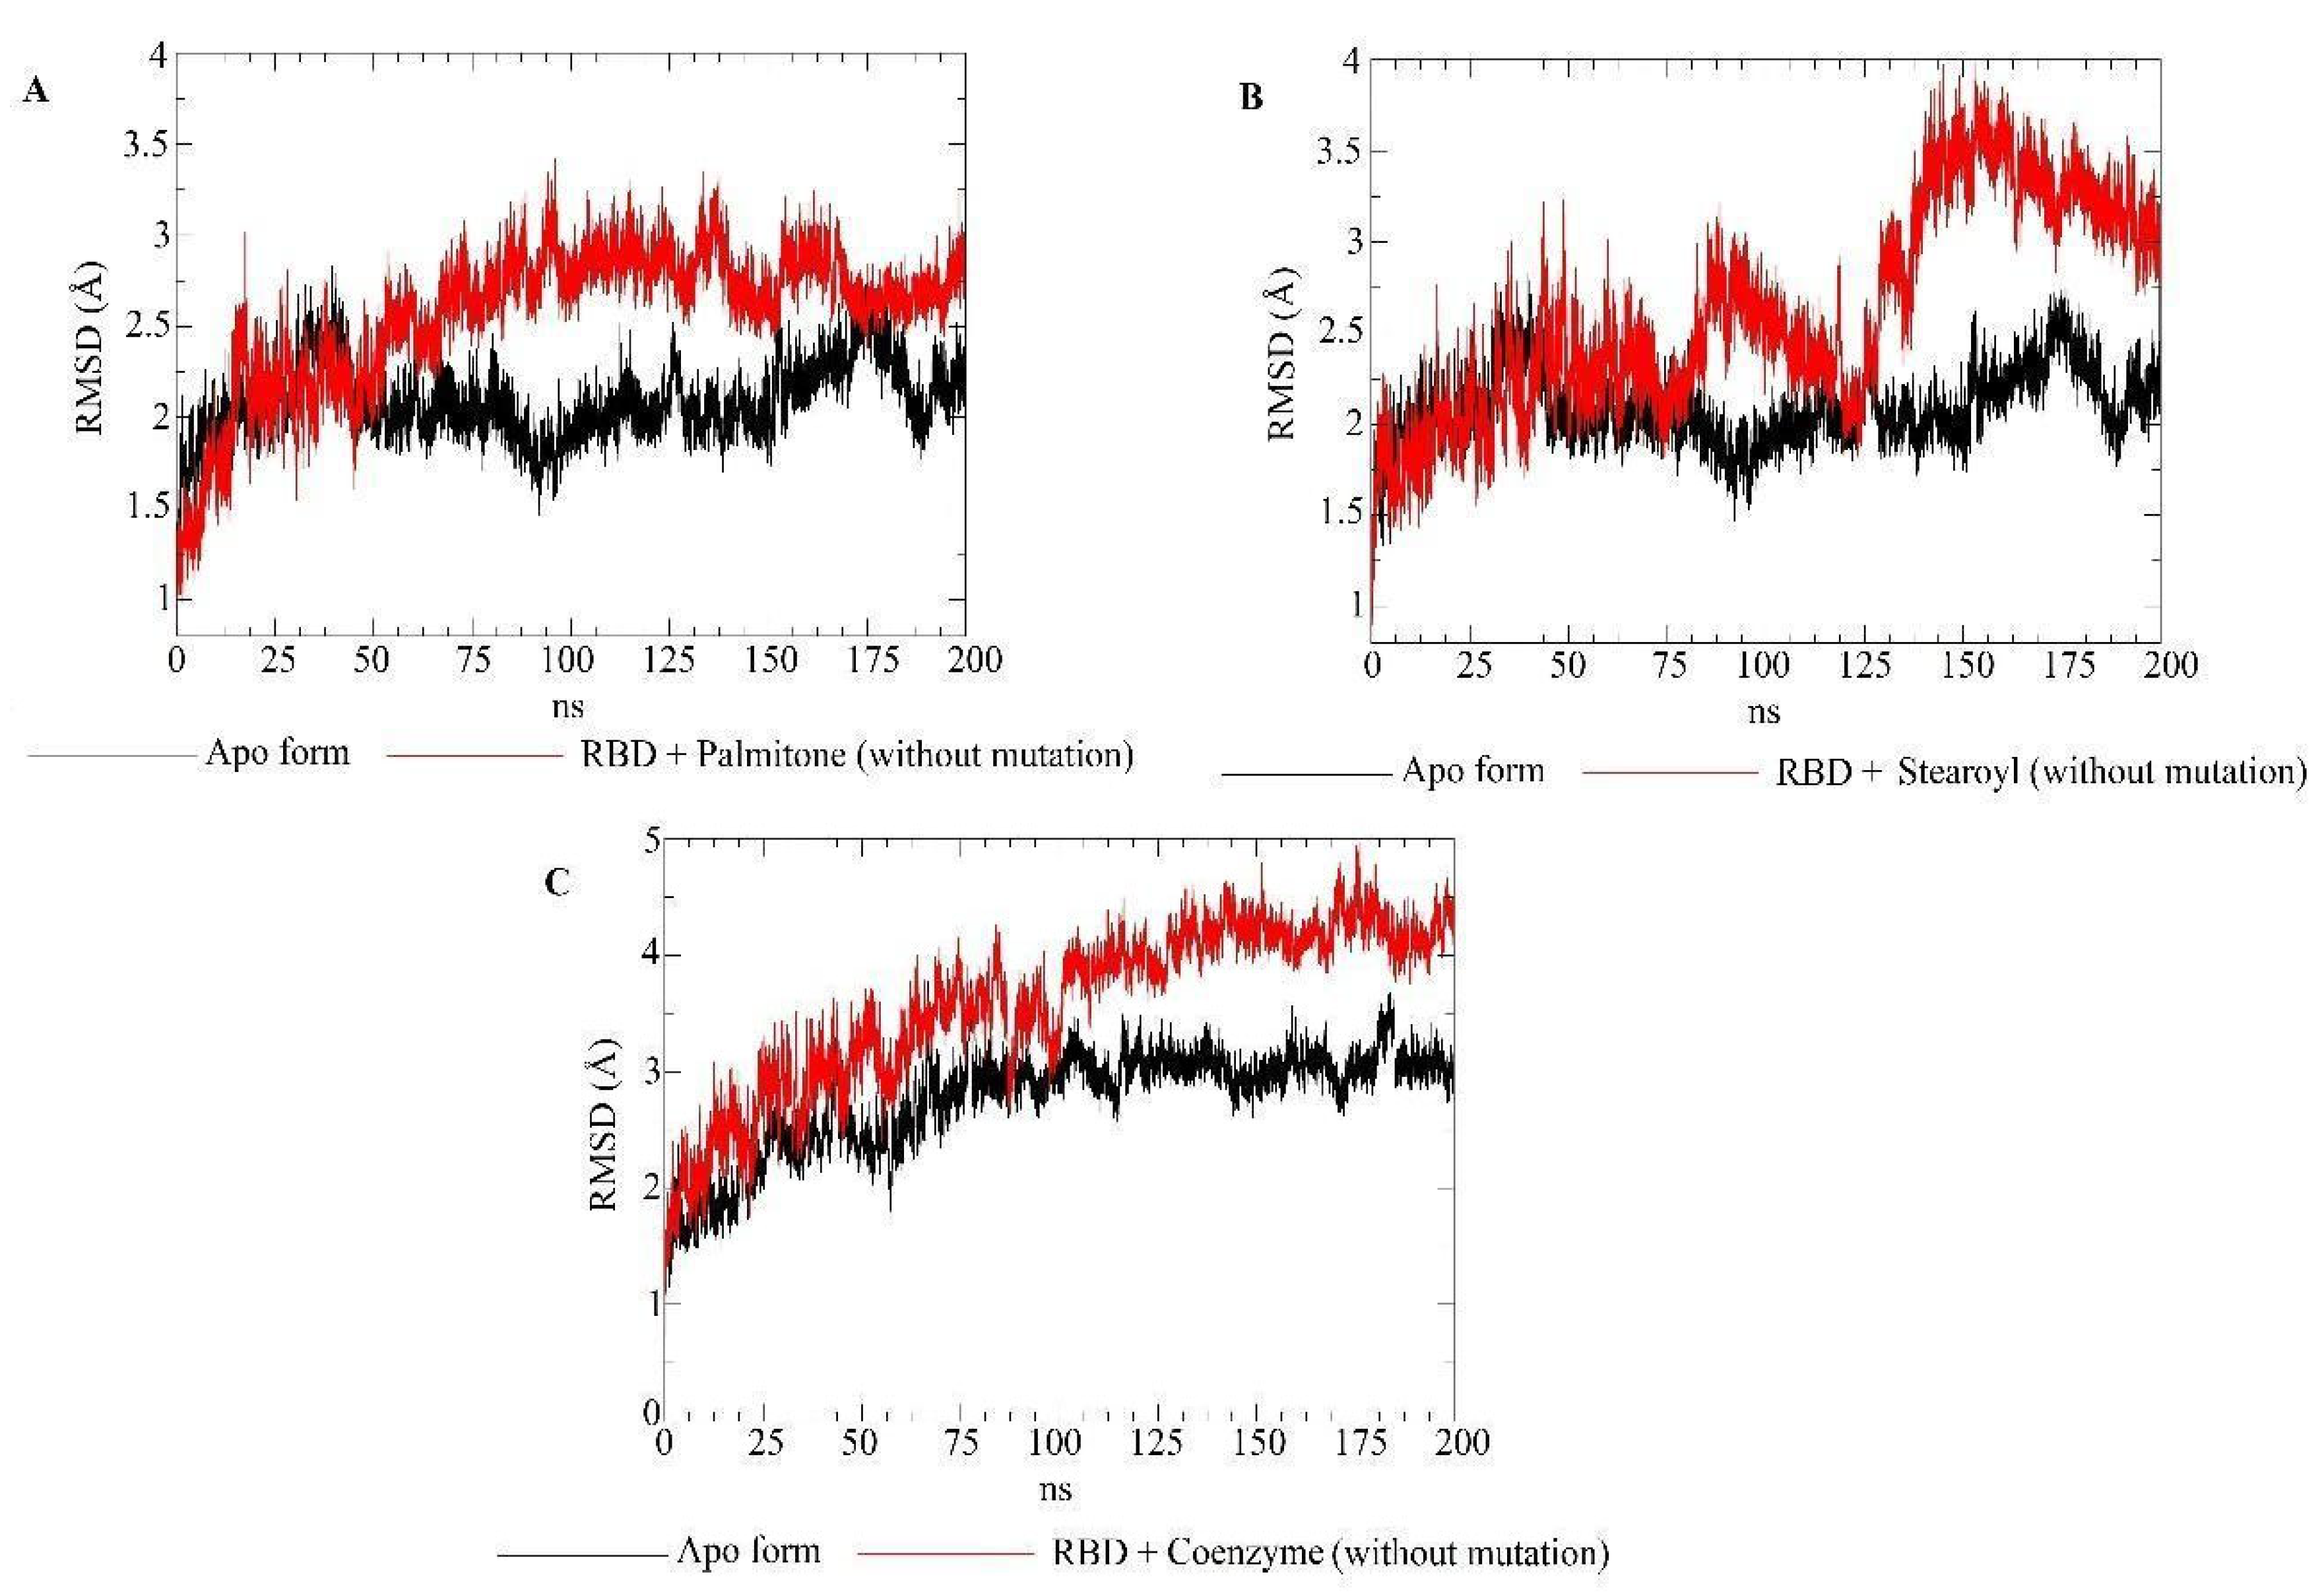
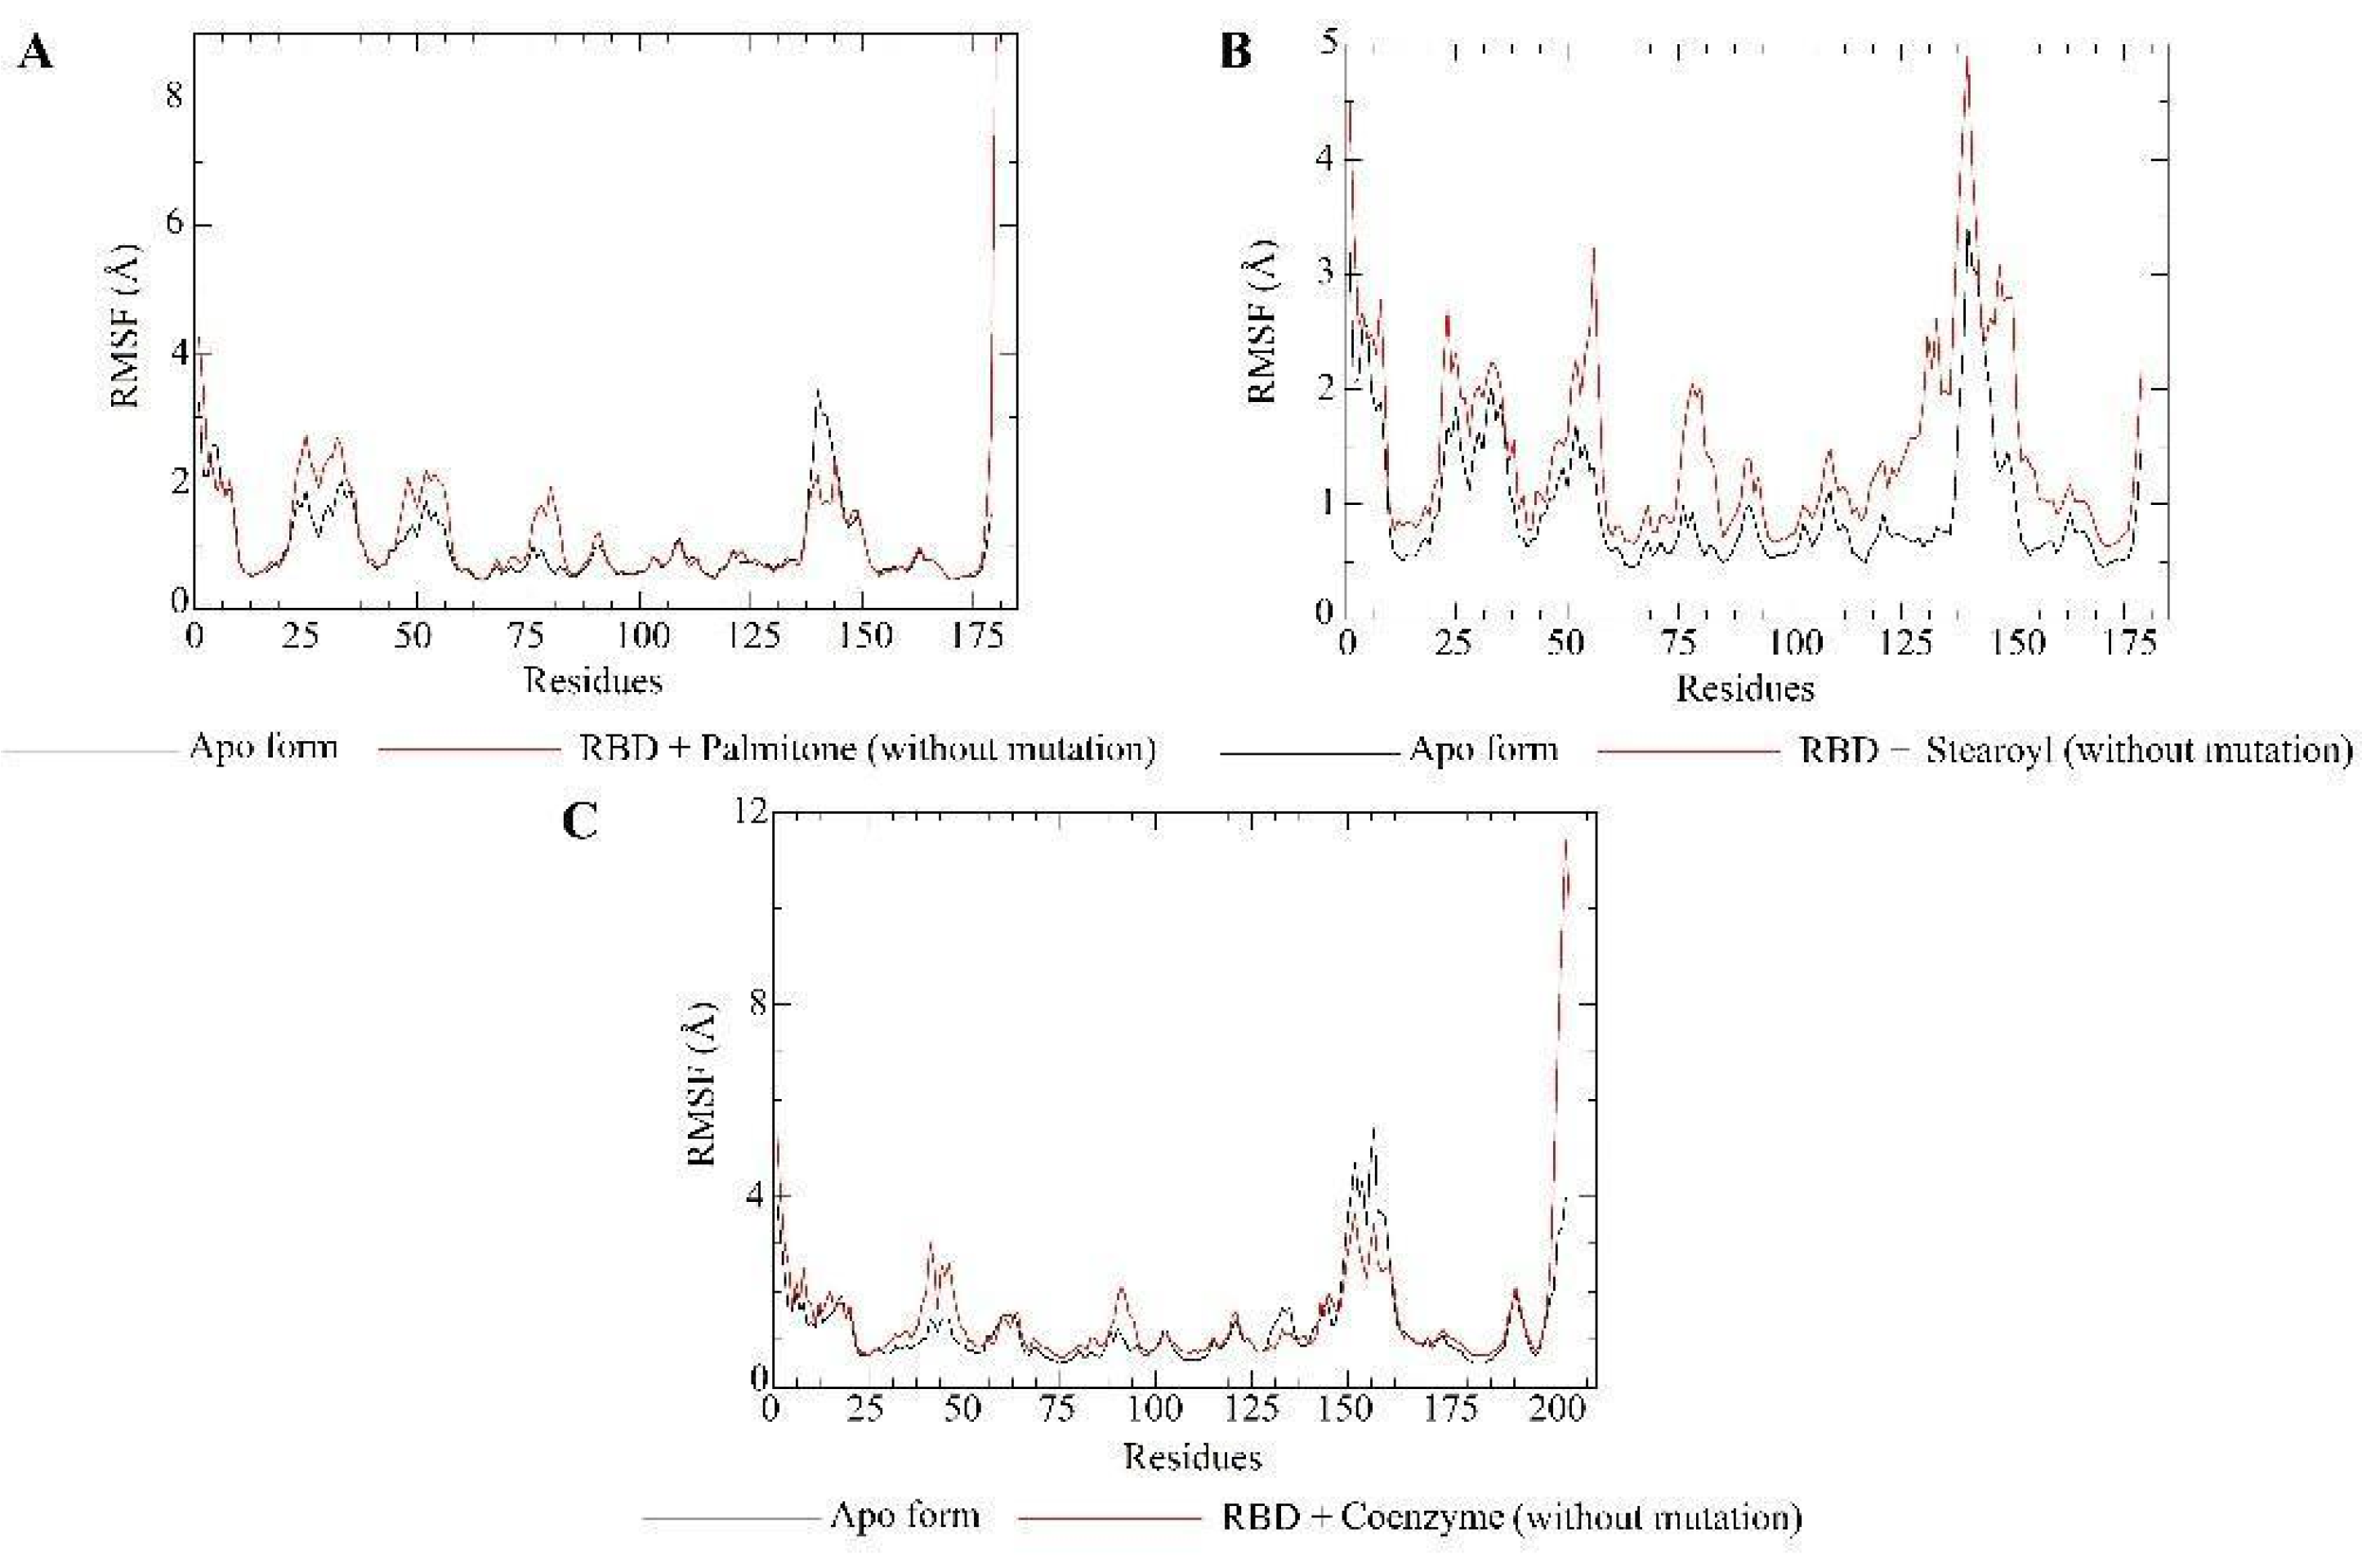
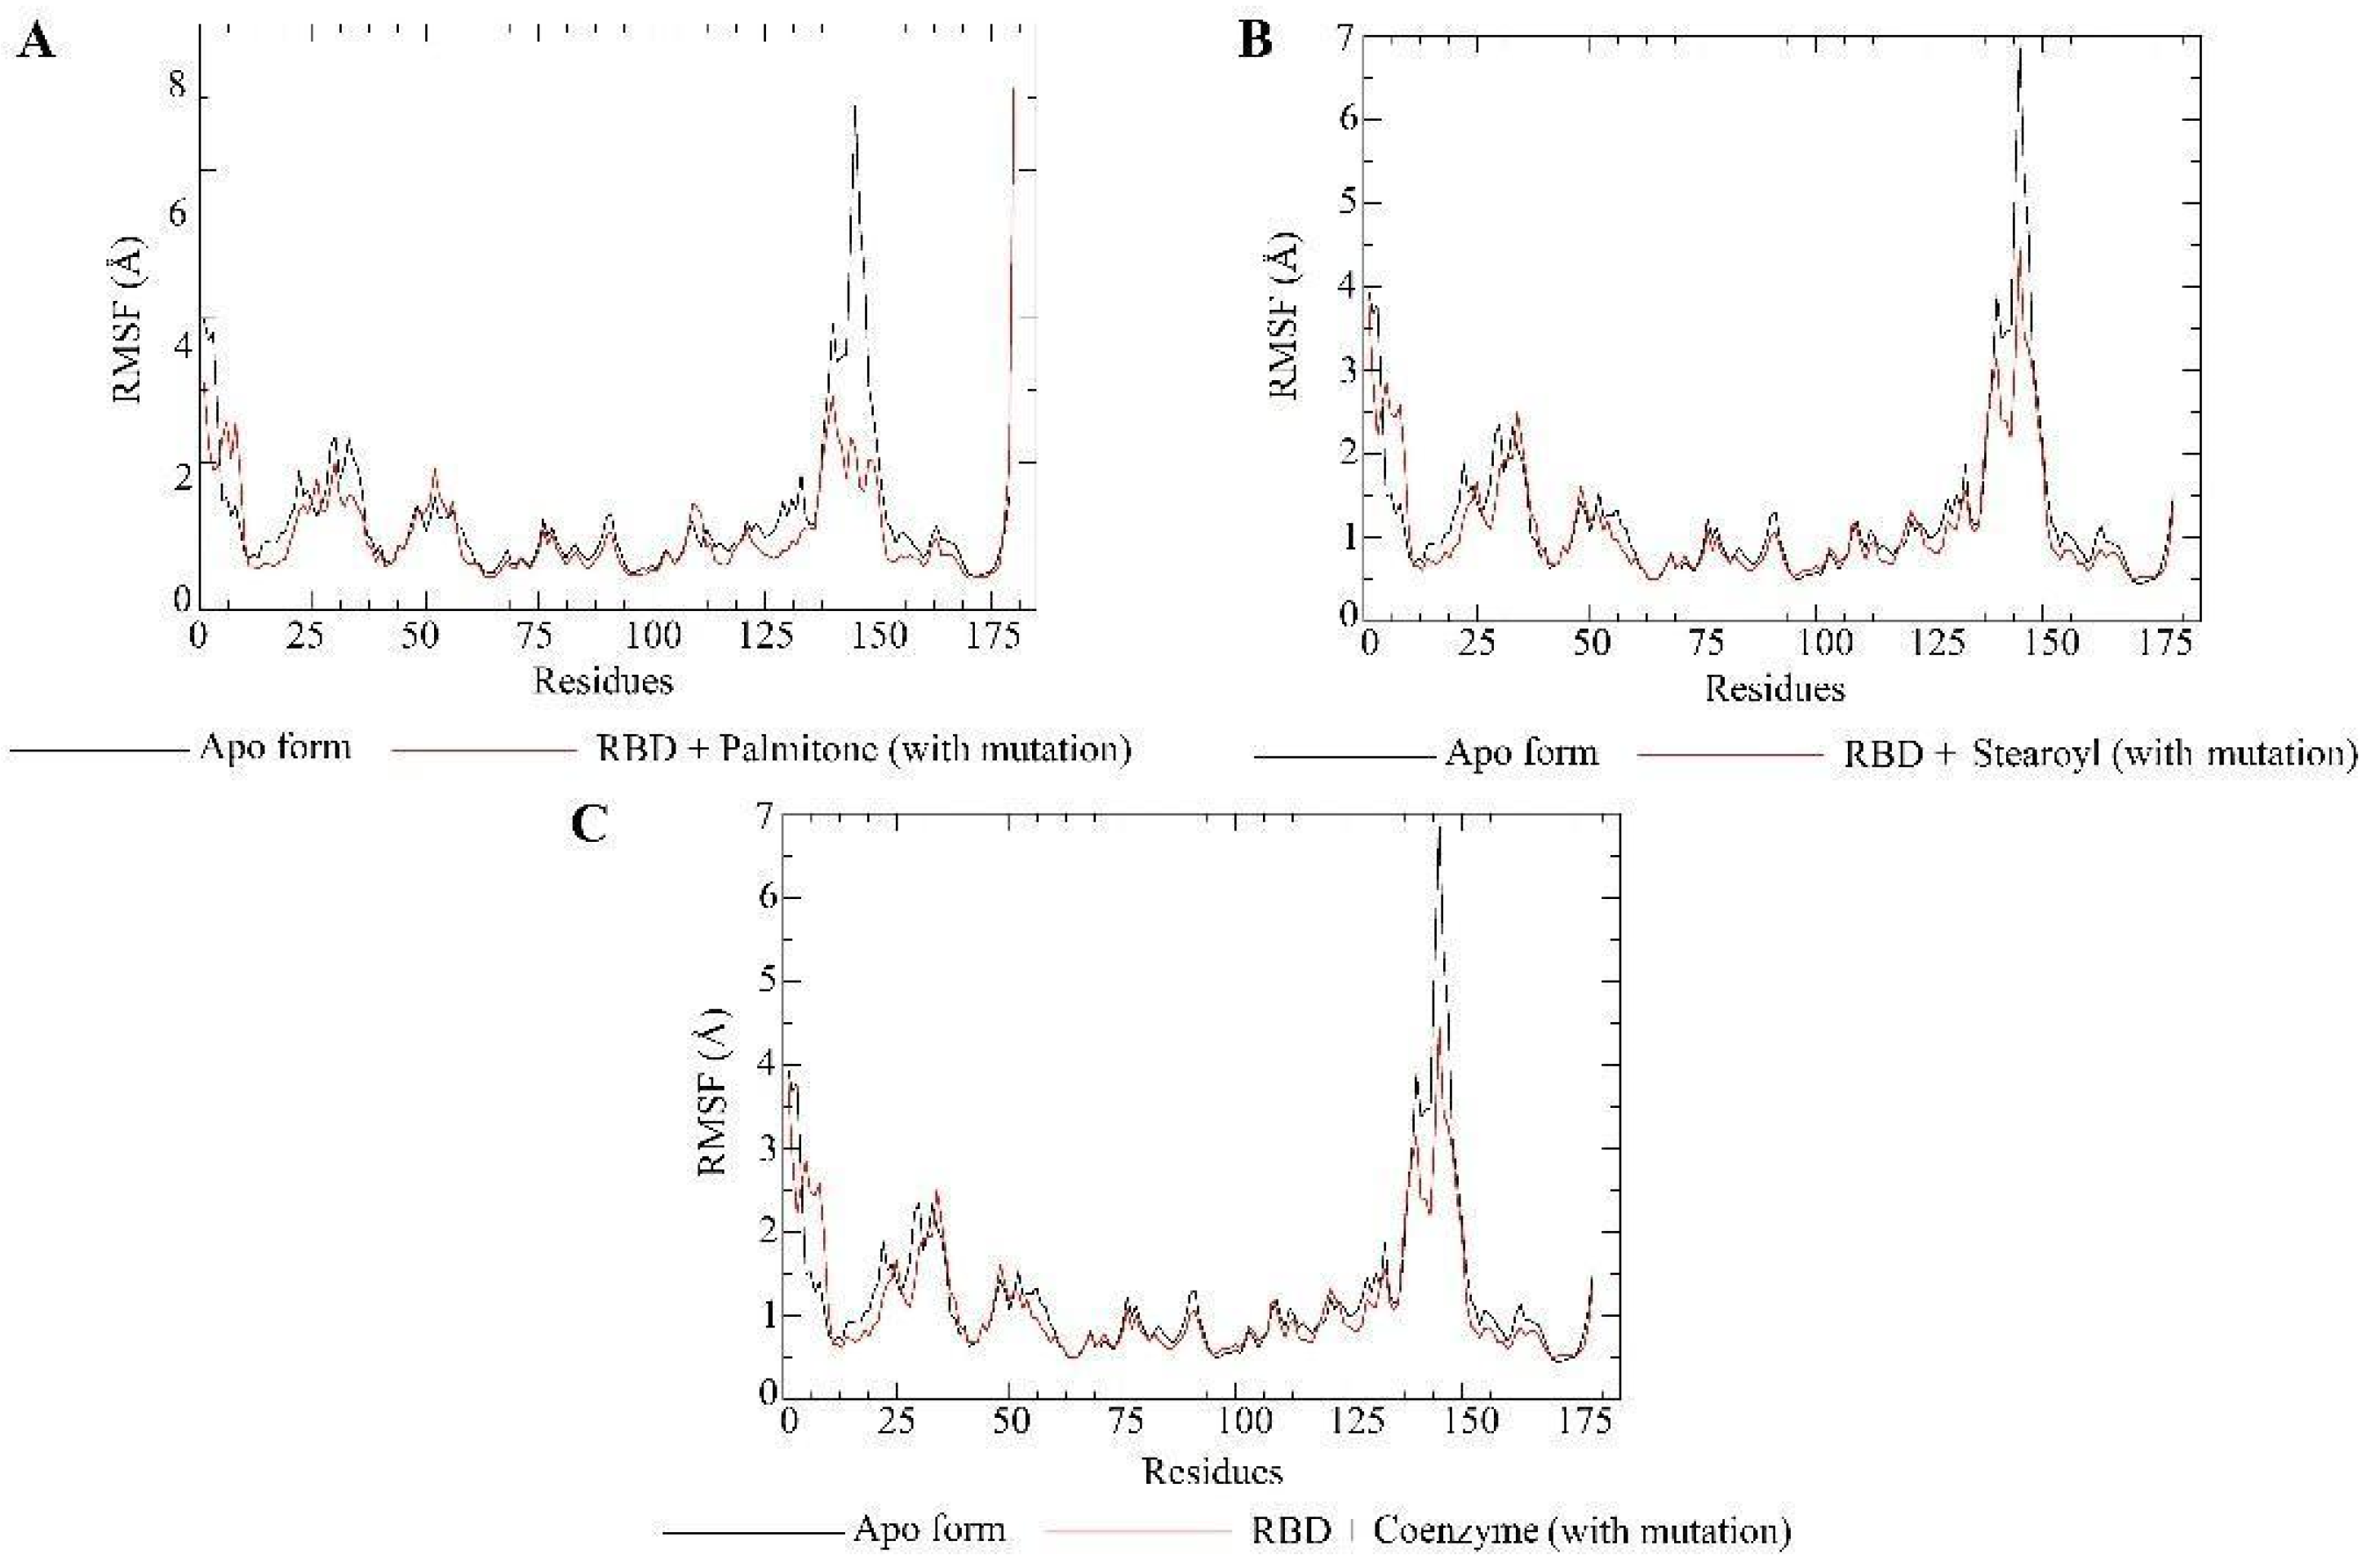
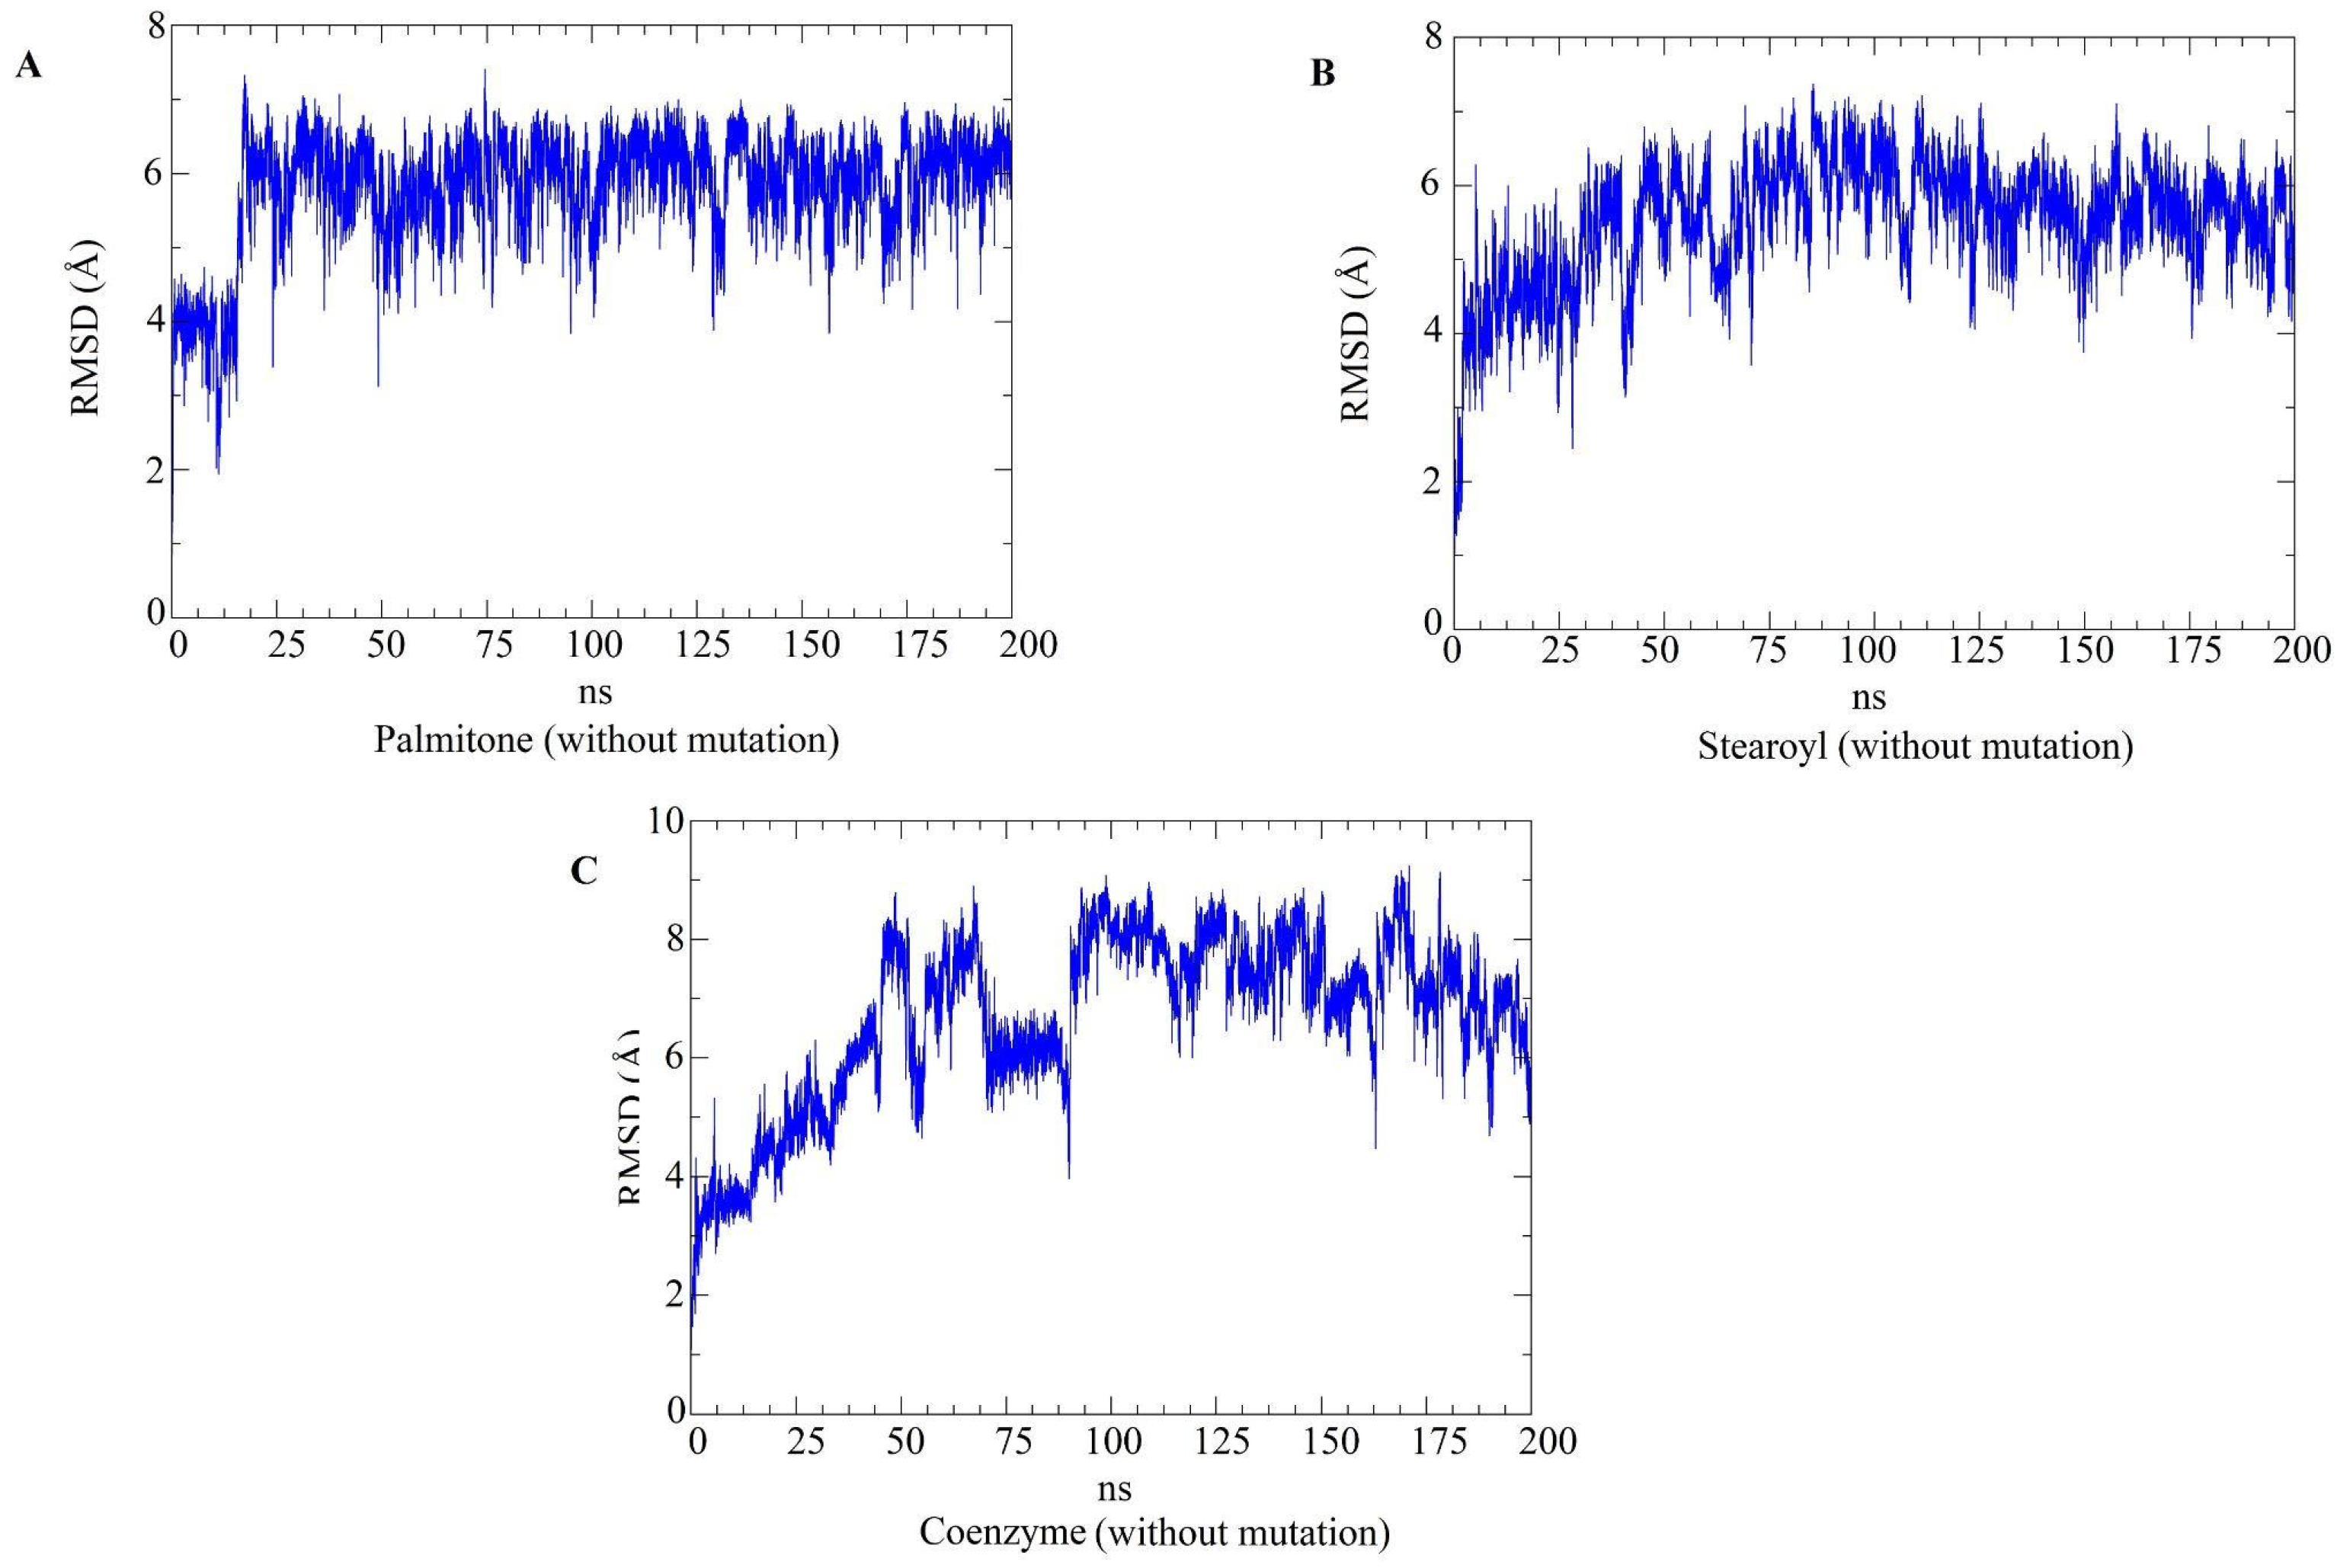
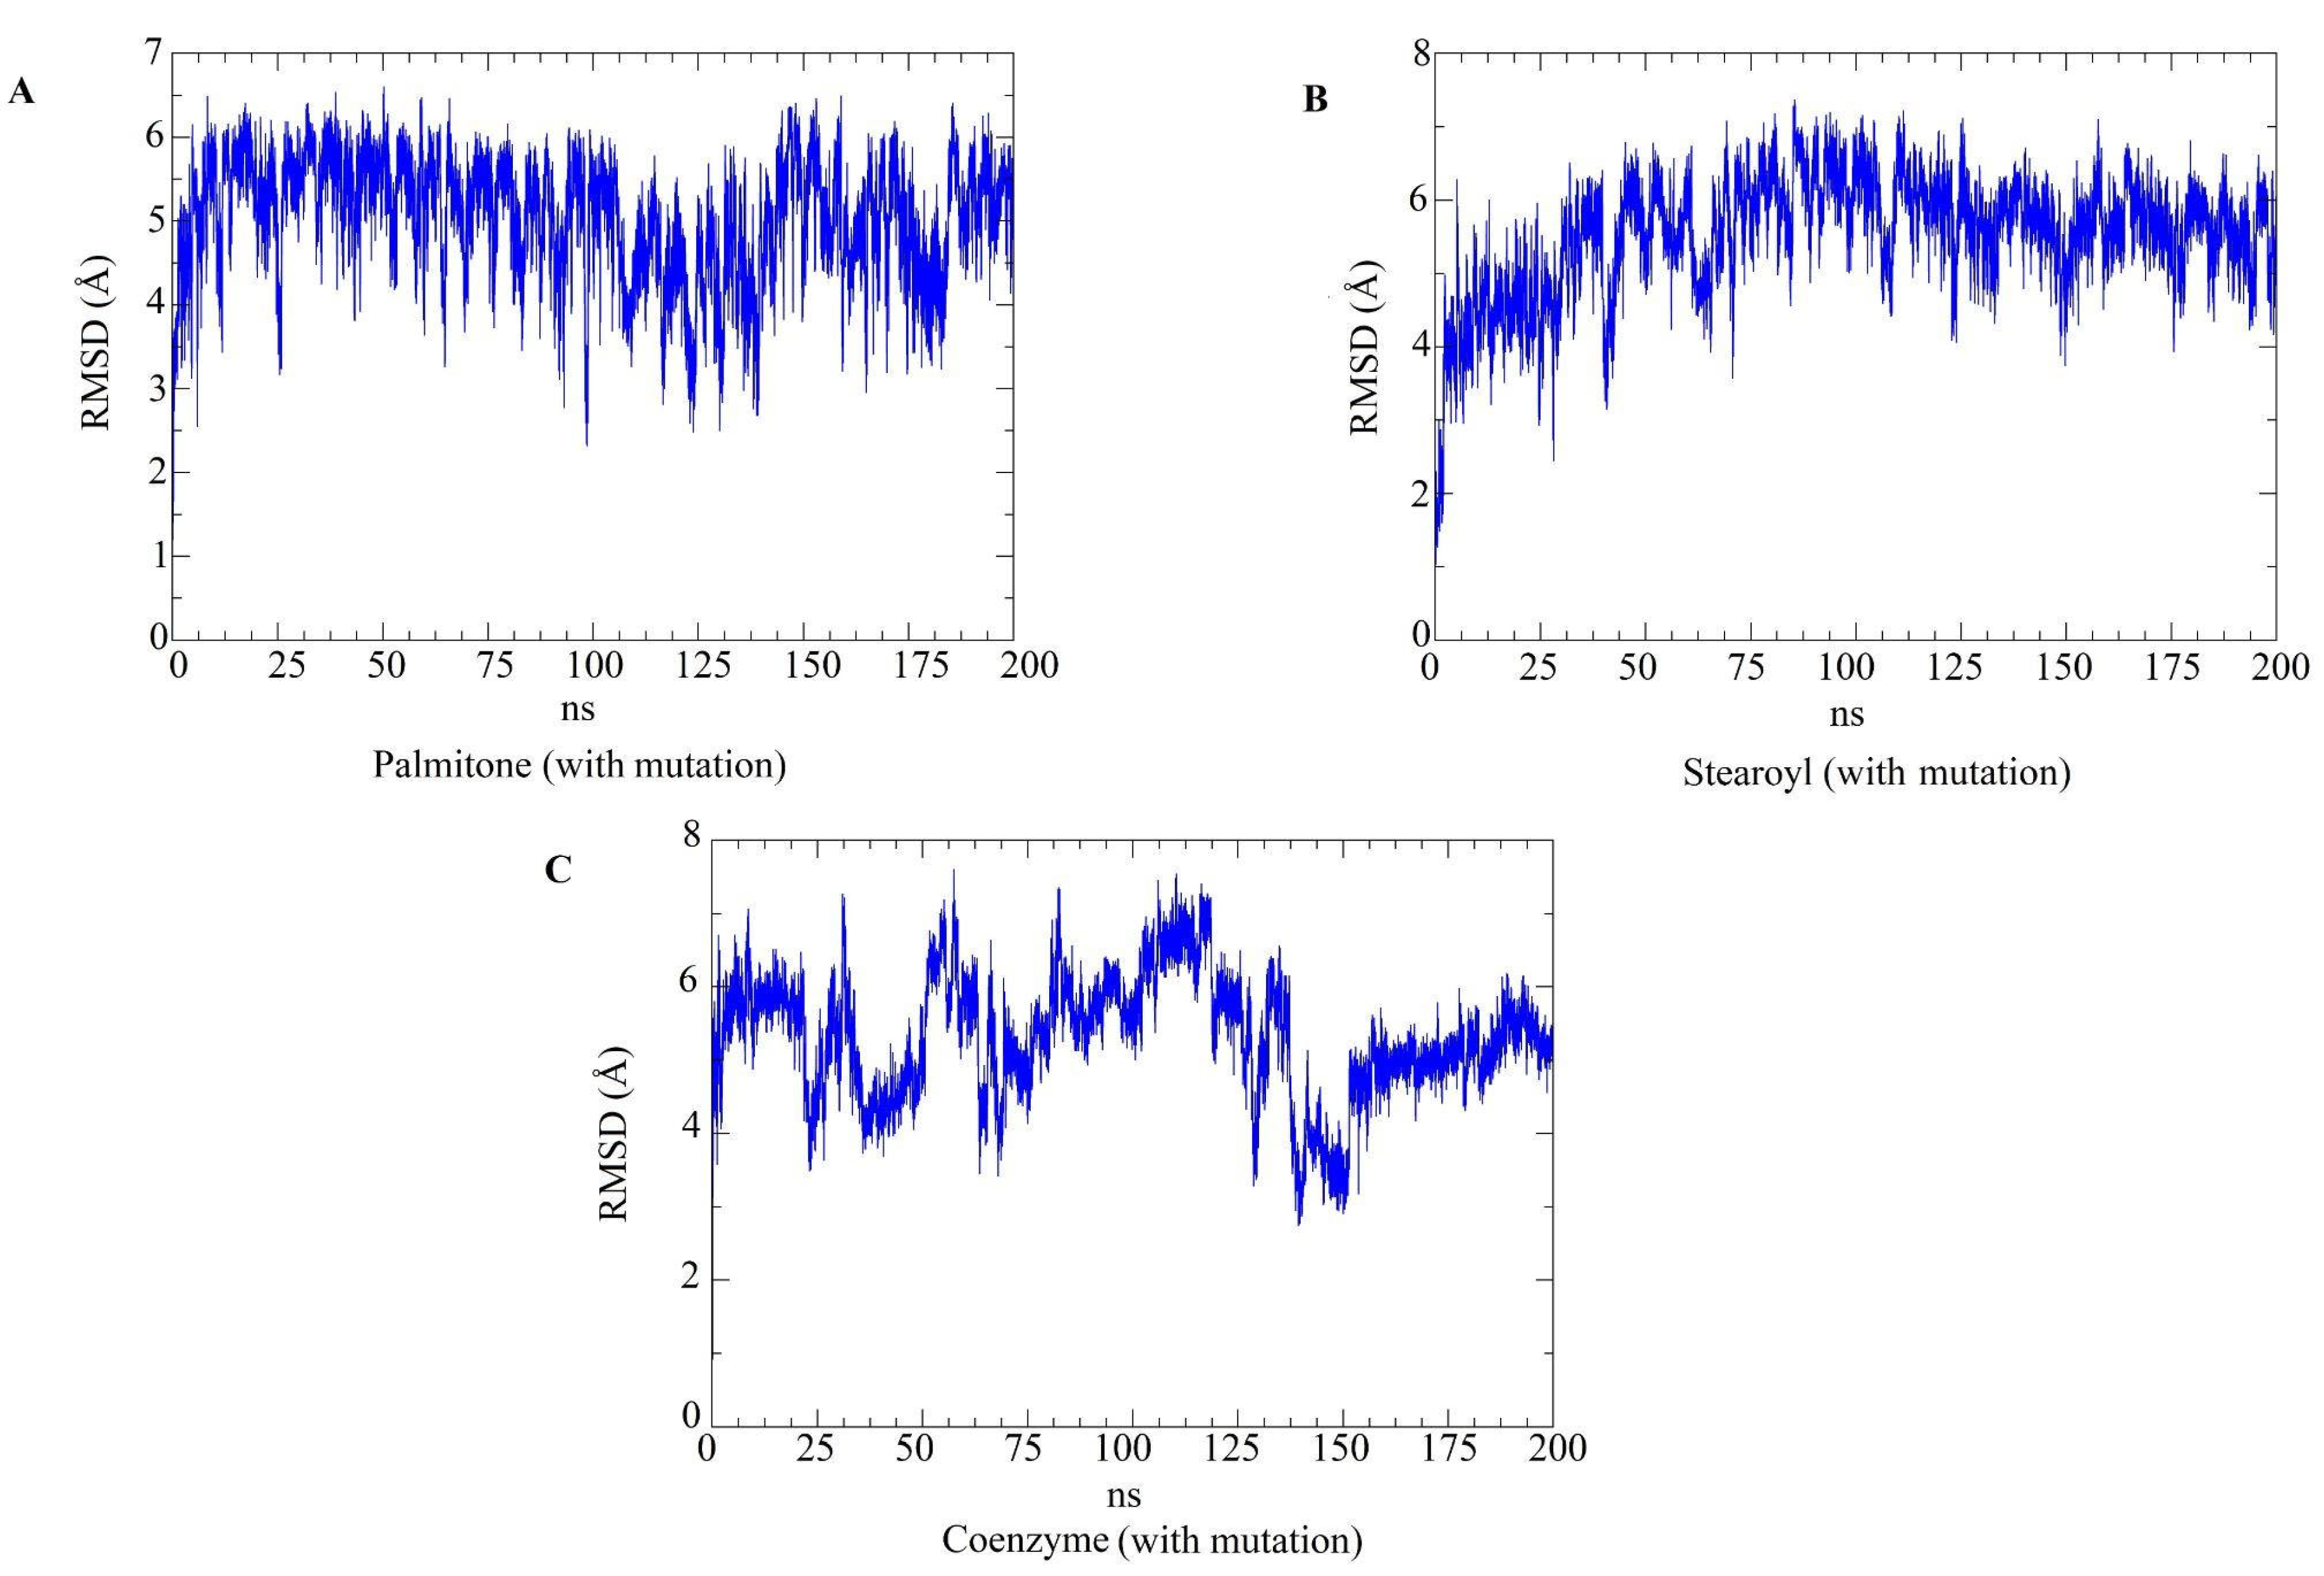
2.5. Molecular Dynamics Simulations

Molecular dynamics simulations evaluated the dynamic behavior, along 200 ns, of coenzyme Q10 (s131), 1-stearoyl-2-arachidonoylglycerol (s443), and palmitone (n115) ligands towards RBDs with and without the N501Y mutation. For each of the three mentioned molecules, the selected protein–ligand complexes contain the PDB version of RBD, with the highest consensus scoring from docking. Then, following minimization, heating, equilibration, and production steps, RMSD and RMSF plots were generated for each ligand-target complex (Figure 8, Figure 9, Figure 10 and Figure 11). In the last 50 ns of the RMSD plots (150–200 ns), we can observe that RMSD values tended to be lower for mutated RBD–ligand complexes than their apo forms, as well as lower than the values for wild-type RBDs. This result implies that N501Y RBDs presented less conformational variation during time trajectories, mainly when bound to a ligand. The RMSF results showed fewer residue fluctuations in Y501 RBD–ligand complexes, implying less conformational variation in specific residues when RBD is complexed with a ligand. Therefore, RMSD and RMSF results are complementary and convergent to each other. The ligands’ RMSD plots present high ligand flexibility throughout the simulations, which would be expected for large molecules with substantial hydrophobic interactions. This is especially noticeable for s131, the largest molecule between s443 and n115, where n115 is the smallest (Figure 12 and Figure 13).

2.6. Free Energy Calculations

From the MD trajectories, we performed calculations of binding free energy with the MM-GBSA method for the RBD–ligand complexes under study (Table 2).
Table 2 shows that N501 and Y501 RBDs complexed with s443 presented the lowest binding free energy values, suggesting that such ligands may promote more significant inhibition against RBD. Y501 RBD showed lower values than N501 RBD when complexed with s443 and n115, suggesting greater stability at binding ligands with the mutated RBDs. From the approximation used in the MM-GBSA technique, only s131 presented lower binding free energy when complexed with the N501 RBD, suggesting that more studies must be performed to investigate this finding.

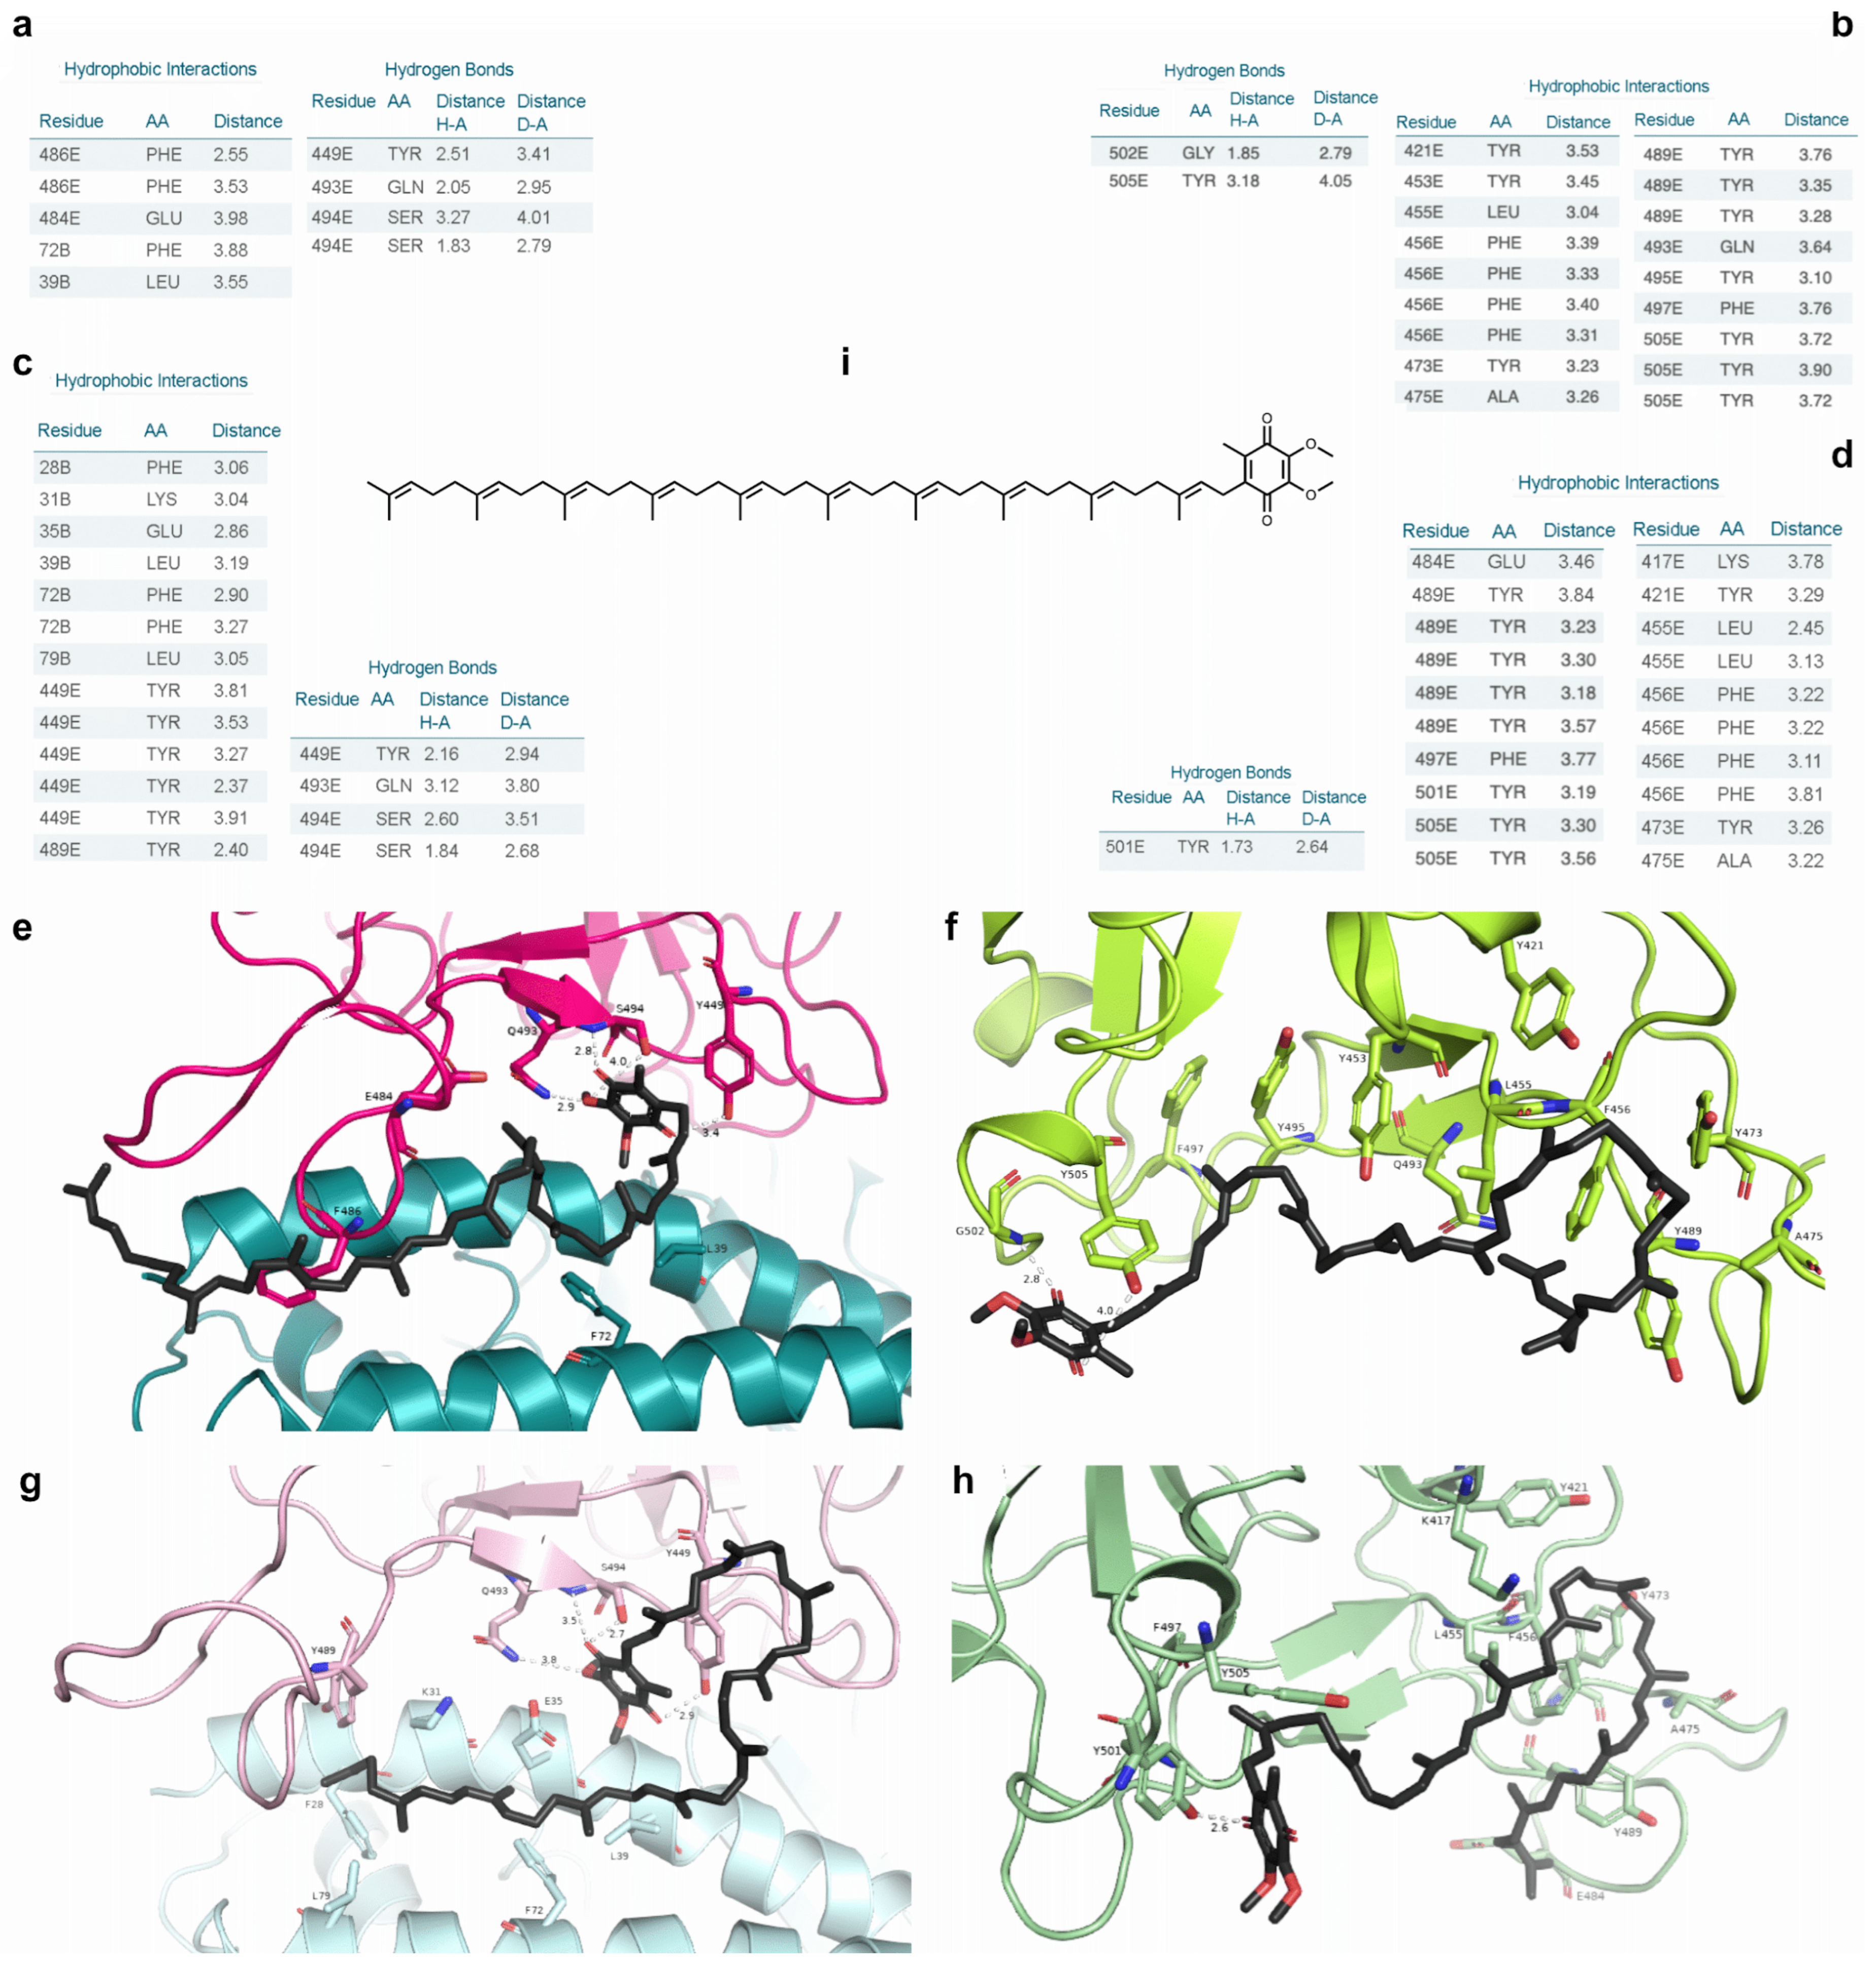
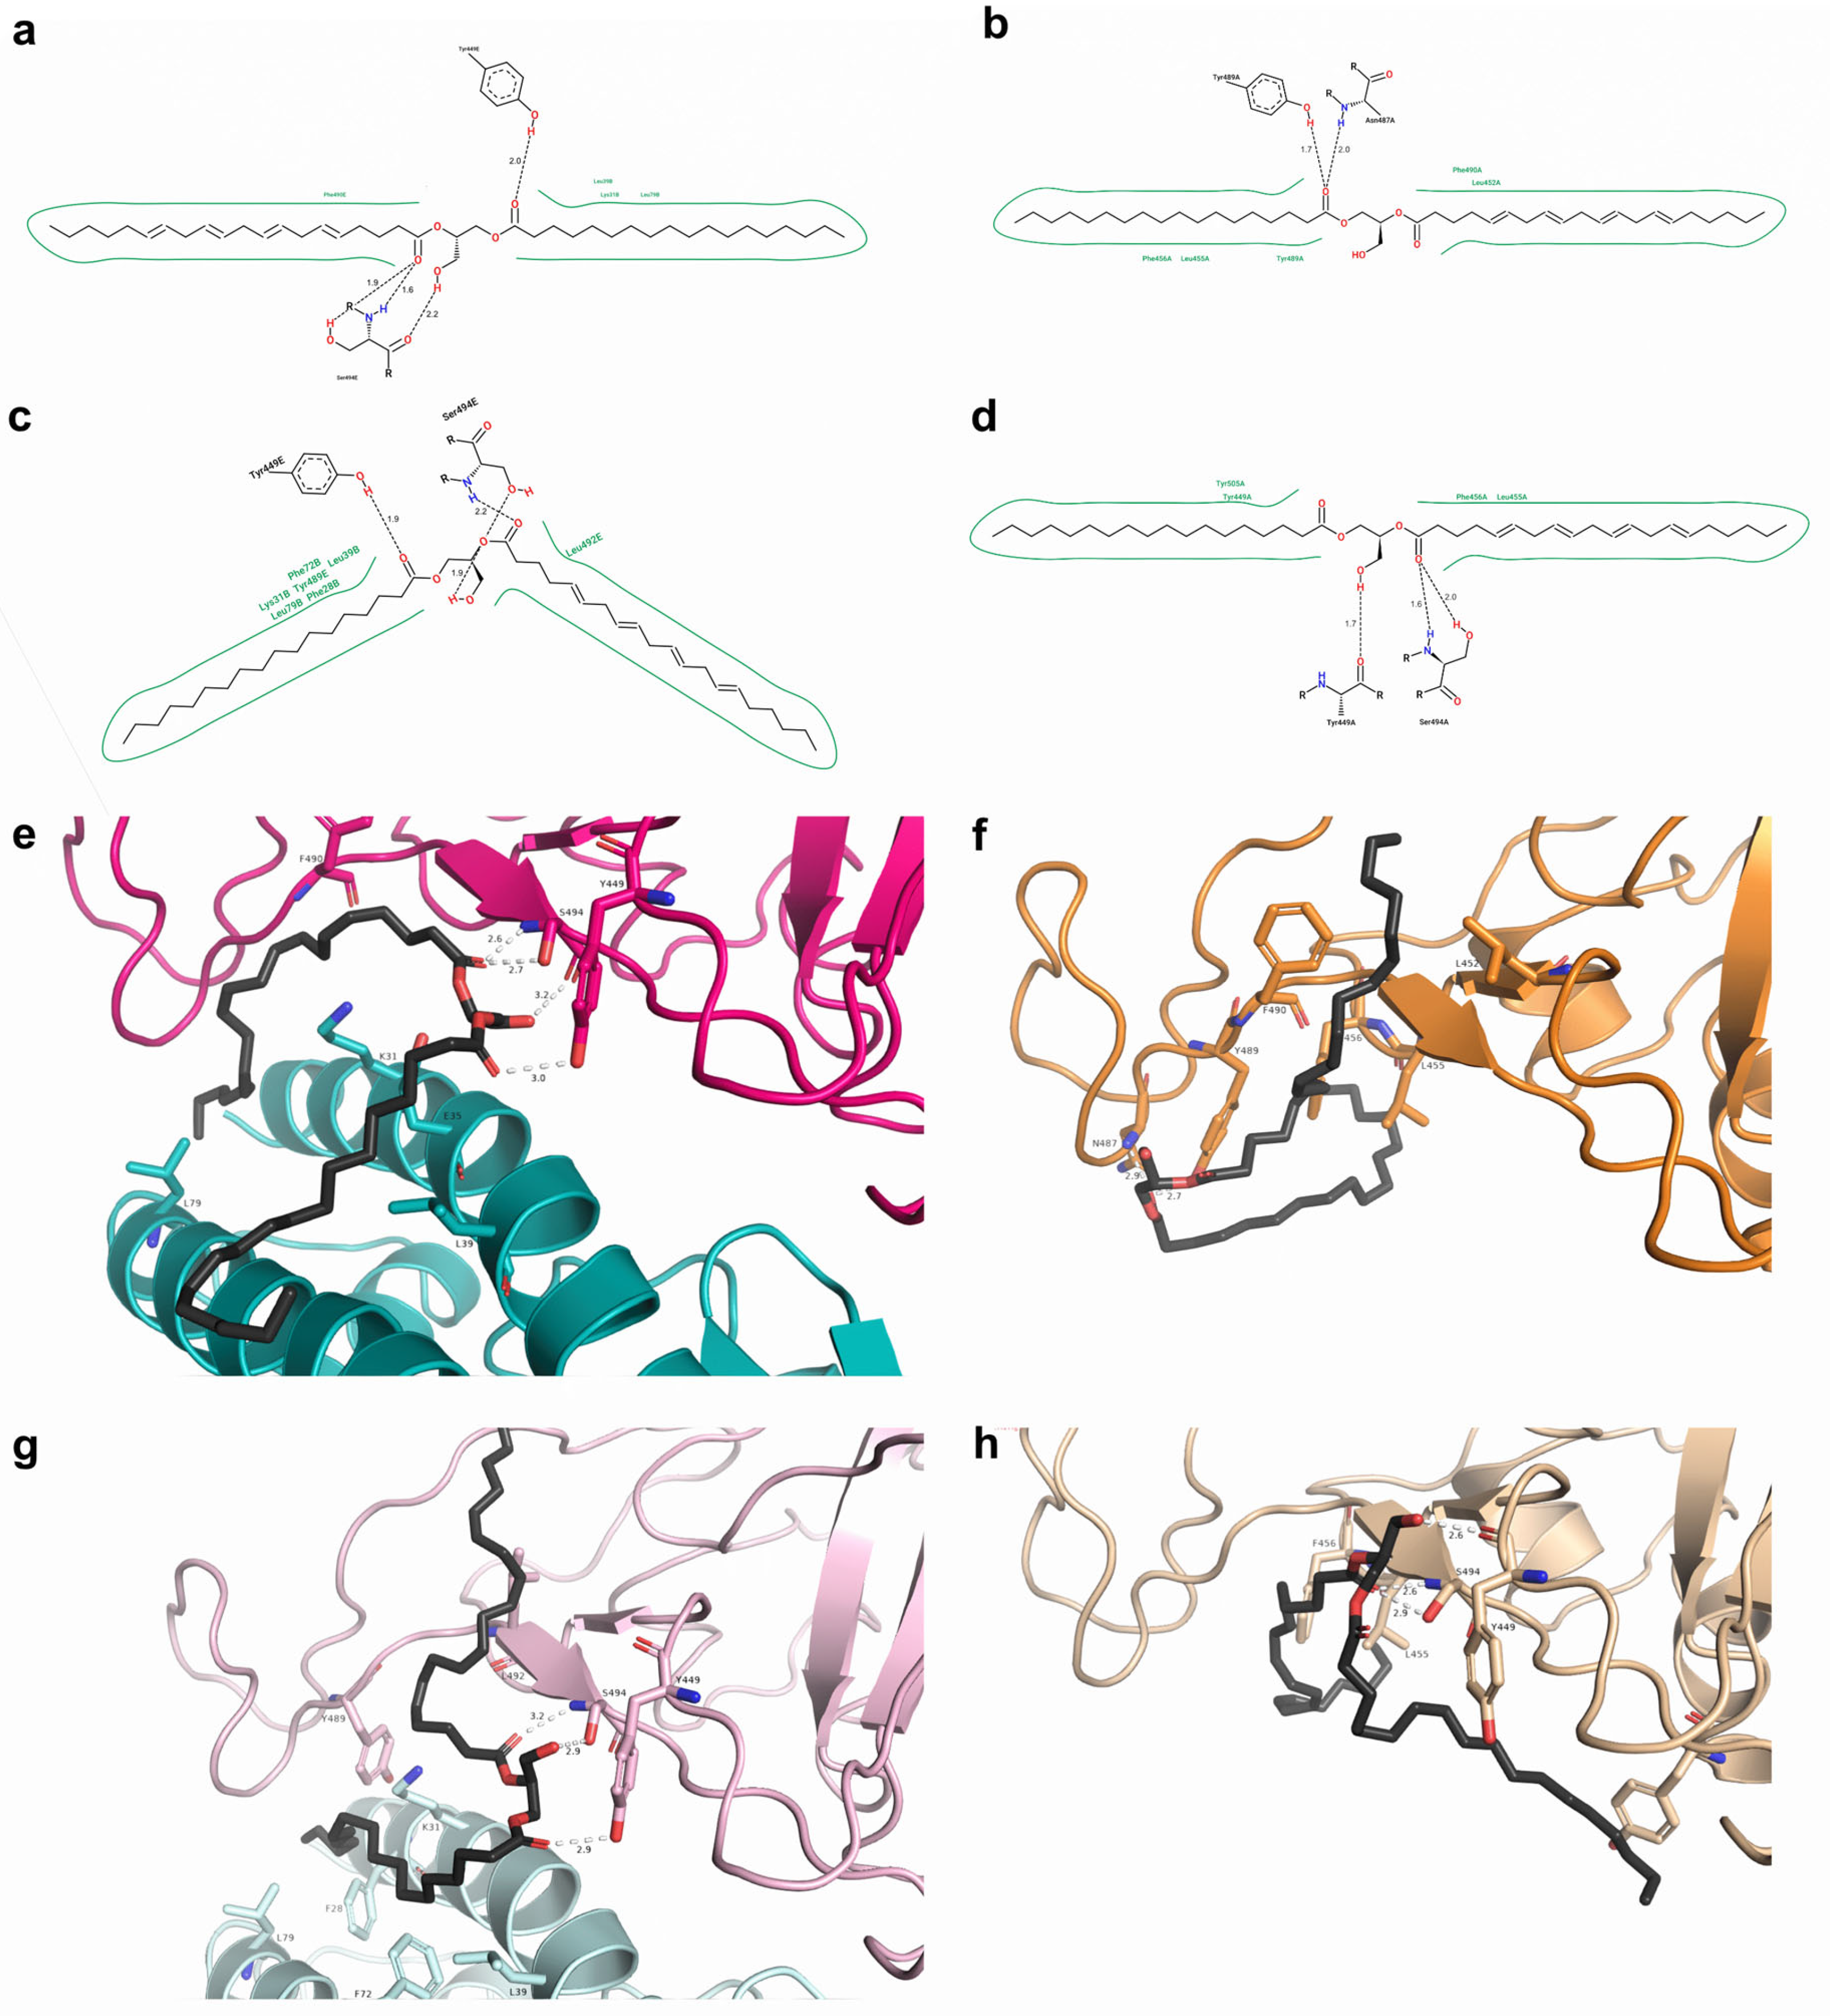
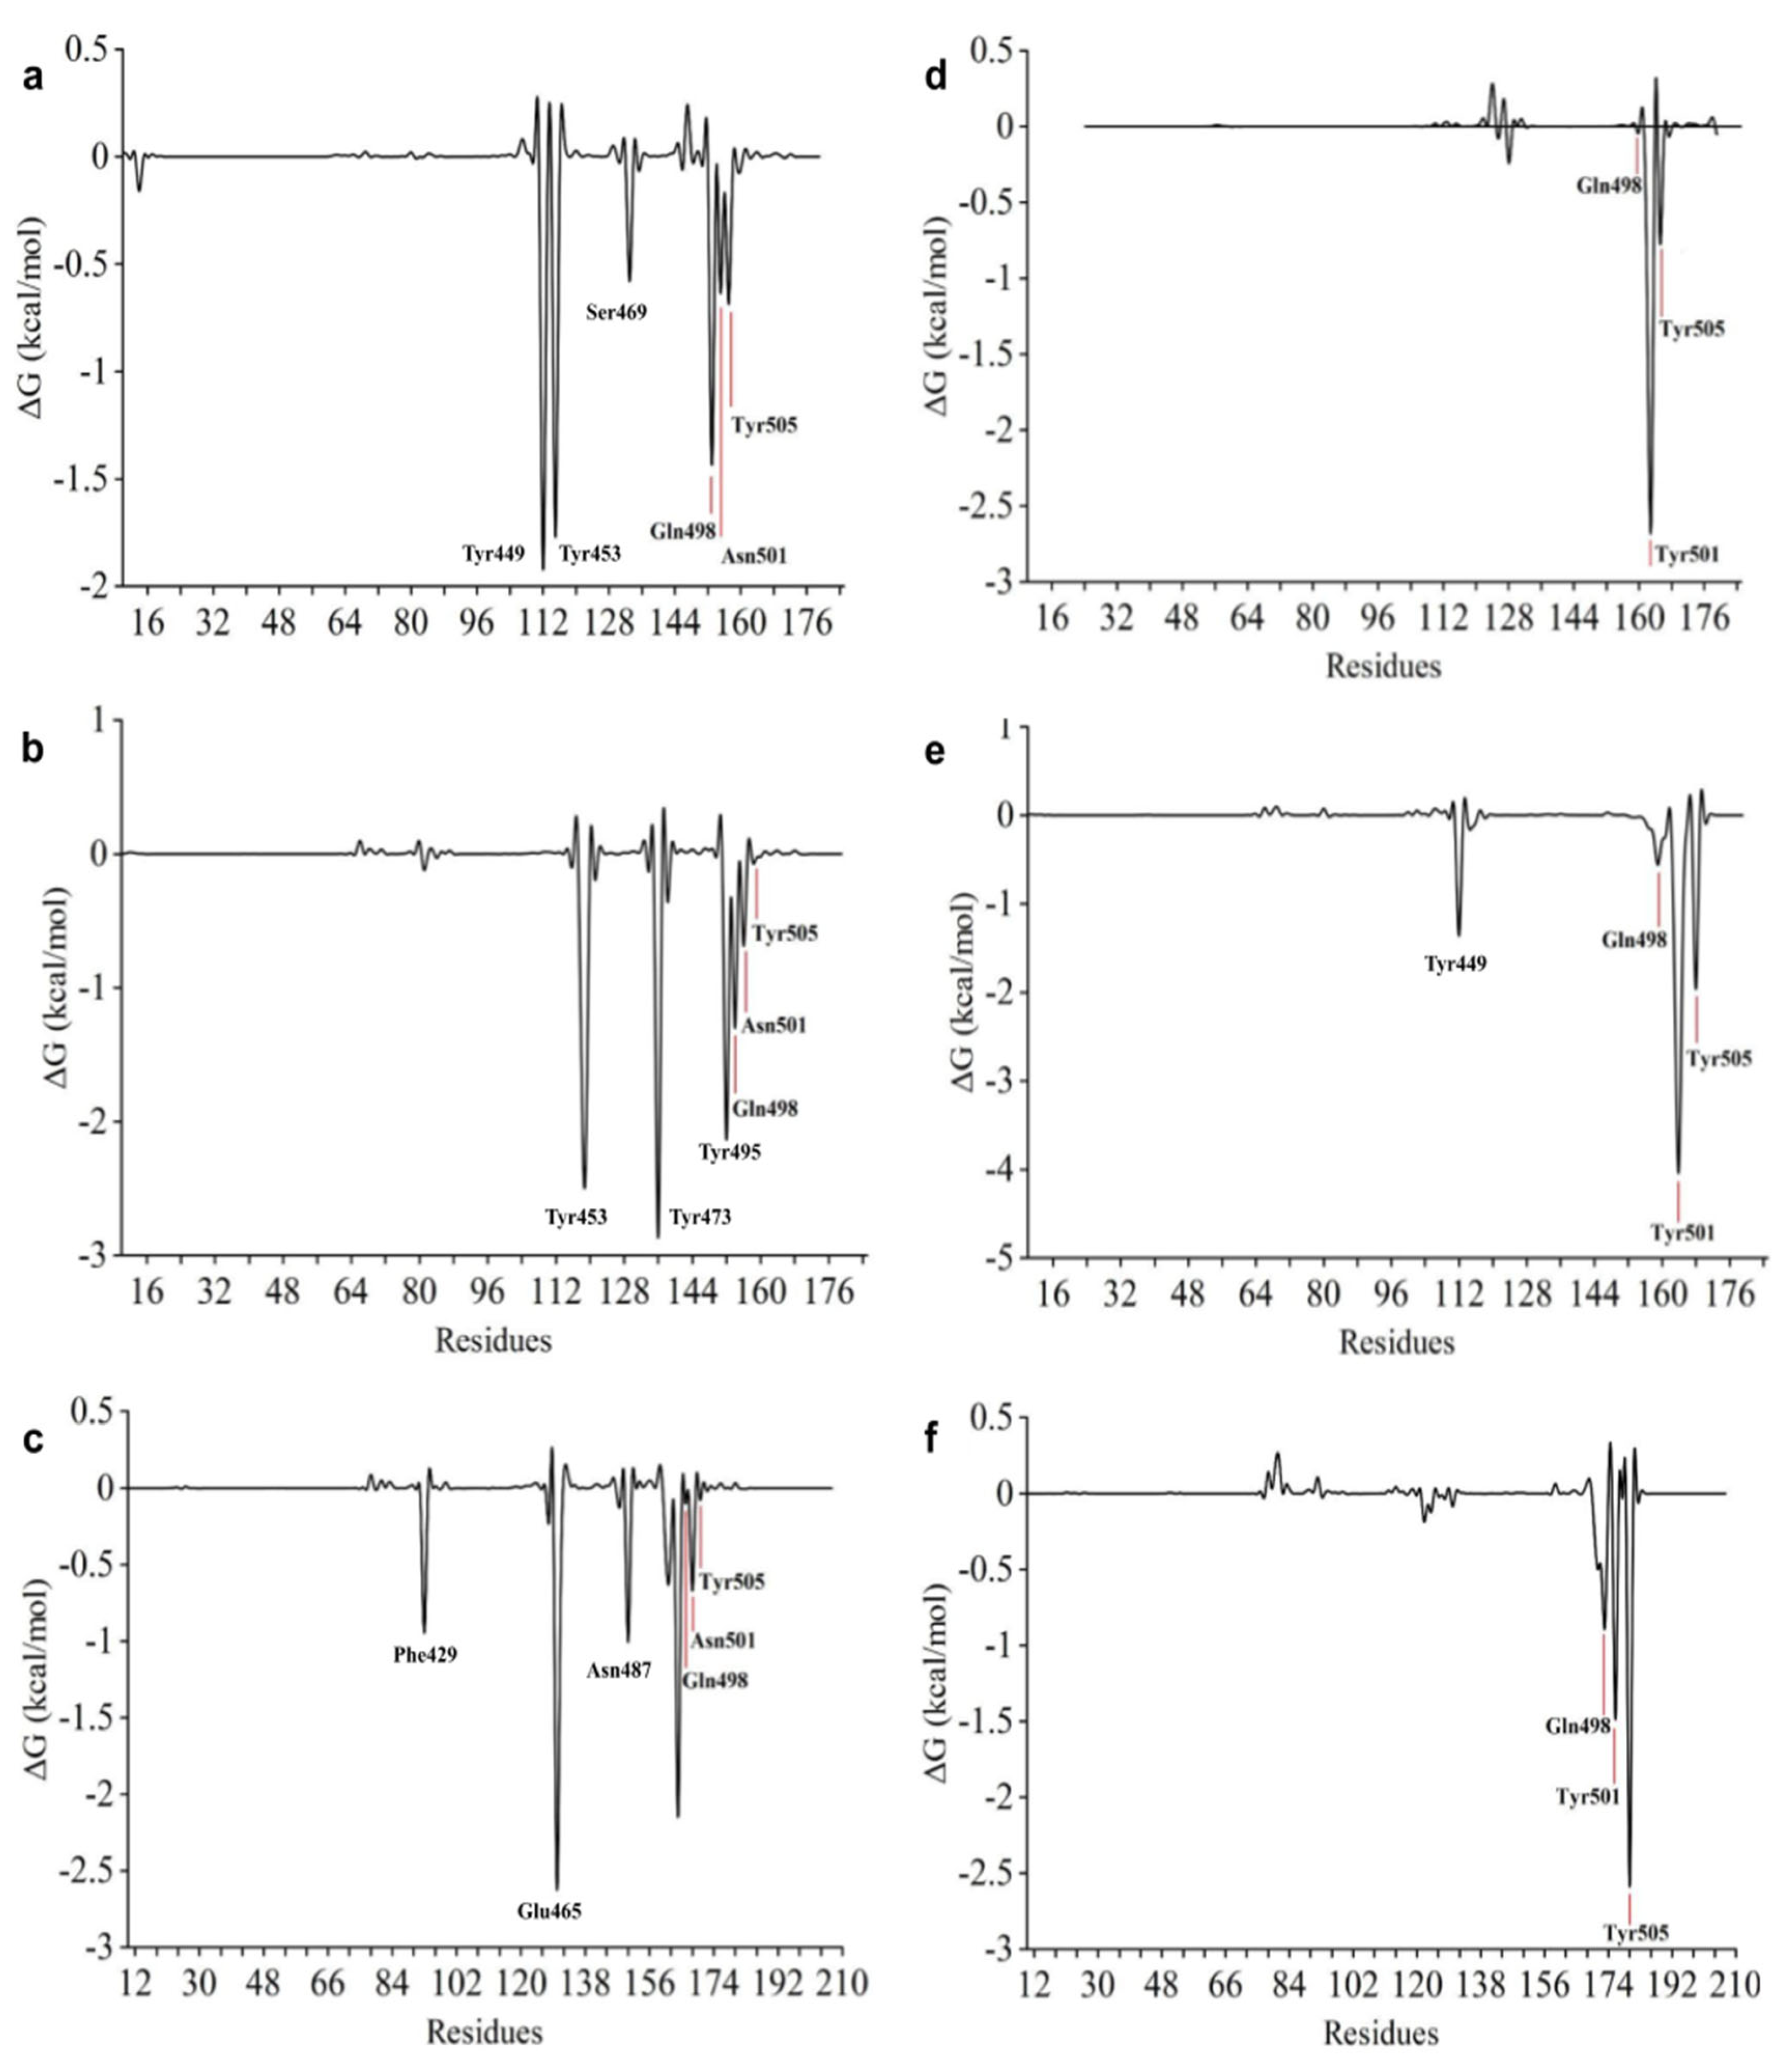
2.7. Free Energy Decomposition

We also carried out calculations of free energy decomposition per amino acid residue. Figure 14 shows the free energy values for the amino acid residues of N501 and Y501 RBDs in complexes with n115, s443, and s131 ligands. In all cases, the mutated RBD had lower energy values for the Y501 residue than the wild-type RBD for the N501 residue. In addition, essential residues, such as N501, Q498, and Y505, had negative binding free energy values in all cases, showing that they can contribute to the potential inhibitory activity of the ligands. These results suggest the critical role of mutated RBD in the biological potency against SARS-CoV-2.

2.8. Current Findings in the Literature on the Screened Molecules

Until the publication of this study, we have not found pre-clinical data regarding most of the hit molecules nor clinical trials evaluating them as a treatment for COVID-19. However, one in vitro study suggested that coenzyme Q10 (s131) attenuates human platelet aggregation promoted by the spike protein via oxidative stress [32]. On the other hand, the study only assessed the effect of coenzyme Q10 with the spike protein, not with the SARS-CoV-2 virus entirely. If further studies present similar results, this attenuation could be helpful for patients susceptible to thrombotic disorders related to COVID-19. Although one trial assessed coenzyme Q10 in people with COVID-19, the study was conducted months after the viral infection [33]. Therefore, there is still a lack of studies assessing the action of such molecules in biological assays and clinical trials during COVID-19 infection.

3. Materials and Methods

3.1. Selection and Processing of Proteins and Ligands

The 3D structure of proteins under study was retrieved from Protein Data Bank (https://rcsb.org/, accessed on 1 November 2020) [34] through the COVID-19/SARS-CoV-2 Resources > spike protein and spike receptors section. Filters were applied to prioritize structures with resolution under 3 Å, absence of mutations, and presence of all key RBD residues involved in interactions with PD (Table S1, Supplementary Information). These criteria allowed the selection of 6M17, 6XE1, and 7JMP (PDB codes), which were used to initially study four RBD-containing structures: 6M17 RBD-ACE2 complex (PDB chains E and B, respectively), as well as 6M17 (chain E), 6XE1 (chain E), and 7JMP (chain A) RBDs. These were later used to model a mutated version of each one (the interaction profile between N501 or N501Y RBDs with ACE2 can be observed in Figure S5).
All of the mentioned structures were chosen for two main reasons: (1) they made possible molecular docking and molecular dynamics simulations with RBDs obtained under distinct experimental settings—this could influence the protein and ligand conformations and, consequently, enable diverse results; (2) there was a lack of RBD structures in complex with a ligand available at PDB—therefore, it was not feasible to perform redocking and cross-docking to evaluate the docking algorithm. Thus, we decided to rely on more than one RBD structure to minimize these issues.
Concerning the ligands, three sets were used: 124 molecules from natural products, studied by collaborative groups; 489 synthetic compounds from Merck, and 24 control compounds, which contain IC50 data from chemical species that inhibited in vitro SARS-CoV-2 RBD-ACE2 binding (Table S2, Supplementary Information), making it a referential for the in silico tests to be described.
The N501 RBD-containing structures were aligned to 6M17 RBD and had water molecules, metallic ions, and stabilizing ligands removed in the PyMOL program. Notably, even though 7JMP RBD had a few missing residues outside the docking sites, they were modeled based on 6M17 RBD in the SWISS-MODEL (https://swissmodel.expasy.org/, accessed on 15 December 2020) [35] server since the entire structure would be considered in MD simulations. Moreover, hydrogens and MMFF94 charges were added by using the Sybyl computational package. N501Y RBDs were submitted to the same procedures, following N501 to Y501 mutation in PyMOL to the most stable tyrosine rotamer, which was minimized in Sybyl by the steepest descent method with 50,000 iterations. Sybyl was also used to prepare the ligand sets using the PM3 method (implemented in the MOPAC module). The final models were realigned using PyMOL (Table S3, Supplementary Information).

3.2. Protein–Ligand Docking

GOLD (Genetic Optimization for Ligand Docking) [36] software (version 2021.2.0, CCDC, Cambridge, UK) was employed for docking simulations. We used RBD-containing structures (6M17 RBD-ACE2 complex, 6M17, 6XE1, and 7JMP RBDs) in two versions (N501 or N501Y), two sites (“wide” or “specific” regions, according to relevant residues cited in the literature [37,38,39,40]—see Table S1, Supplementary Information), and three sets of compounds (natural, synthetic, and control ligands) that resulted in over a million ligand poses (see Supplementary Information). Each of the 637 docked ligands (either unique molecules or conformers) underwent 100 runs and were analyzed by functions used in scoring and rescoring of docking results, respectively: Chemscore [41,42], which estimates the ΔG value, and ChemPLP [43], a well-established function in CASF [44], which became a standard in GOLD. However, the function performance may vary according to the docking circumstances, hence the importance of comparing both functions (ChemScore and ChemPLP, in this case) and the function term investigated (ΔG).
Each molecule was ranked according to its greatest Chemscore, lowest ΔG, and most significant ChemPLP values (6M17 complex, 6M17, 6XE1, and 7JMP RBDs). These values were converted to positions in a ranking to obtain a consensus using the Exponential Consensus Ranking (ECR) method [45], assigning an ECR score to each ligand. This procedure was applied per RBD version (N501 or N501Y) and to the most promising docking region (see Section 2). Afterward, the top three ECR scores according to RBD versions and the most promising region were considered for the next steps. Each compound from the top ECRs was docked 25 other times (100 runs/time) per N501 and N501Y structures in the broad region. The ECR method was employed to rank the best consensus score for each ligand in each system. The highest ECR with the complex and any RBDs were considered the most favorable interactions. So, these conformations were investigated through Poseview in the ProteinPlus server (https://proteins.plus, accessed on 18 February 2021) and PyMOL (for 2D and 3D representations, respectively). When the former could not identify the molecule file, possibly due to size, PLIP (https://plip-tool.biotec.tu-dresden.de/plip-web/plip/index, accessed on 18 February 2021) [46] was the web server of choice.

3.3. ADMET Analyses

The aforementioned consensus compounds were assessed in ADME(T) servers, such as SwissADME (http://swissadme.ch/index.php, accessed on 1 November 2021) [47], admetSAR 2.0 (http://lmmd.ecust.edu.cn/admetsar2/, accessed on 1 November 2021) [48], and eMolTox (http://xundrug.cn/moltox, accessed on 1 November 2021) [49]. In cases where a significance level was required to be informed by the user (e.g., eMoltox server), a value of 0.05 was taken. There was a focus on ADME(T) properties derived from models built, including human data. For assessing if such consensus compounds were associated with significant pathways in COVID-19 involved in the immune system, circulatory system, and/or precisely in viral infections (5.1, 5.3, and 6.9 columns in Supplementary Information—Figure S9), the PathwayMap server (https://playmolecule.com/PathwayMap/#/, accessed on 18 February 2021) [50] was chosen with the KEGG database. The total ligand datasets and other metabolic routes were also processed from this tool so that we could verify how likely different ligands were to interact with a specific pathway and/or the same ligand with various pathways.

3.4. Validation of Docking and ADMET Results

The control dataset was implemented in docking and ADMET analyses for validating the in silico results. Since the library had compounds with known IC50 values against SARS-CoV-2 RBD-ACE2 binding and several had well-annotated pharmacological profiles, they were considered references. Among the 24 controls, there were 19 active and 5 inactive compounds. It is a smaller dataset than natural and synthetic datasets because of fewer data available at the moment of selecting the controls. Since this comprised an unbalanced dataset, a precision–recall curve was generated instead of a receiver operating characteristic (ROC) plot (see Section 2, Figure 1), which would be adequate for balanced datasets. These calculations were necessary for the model validation.

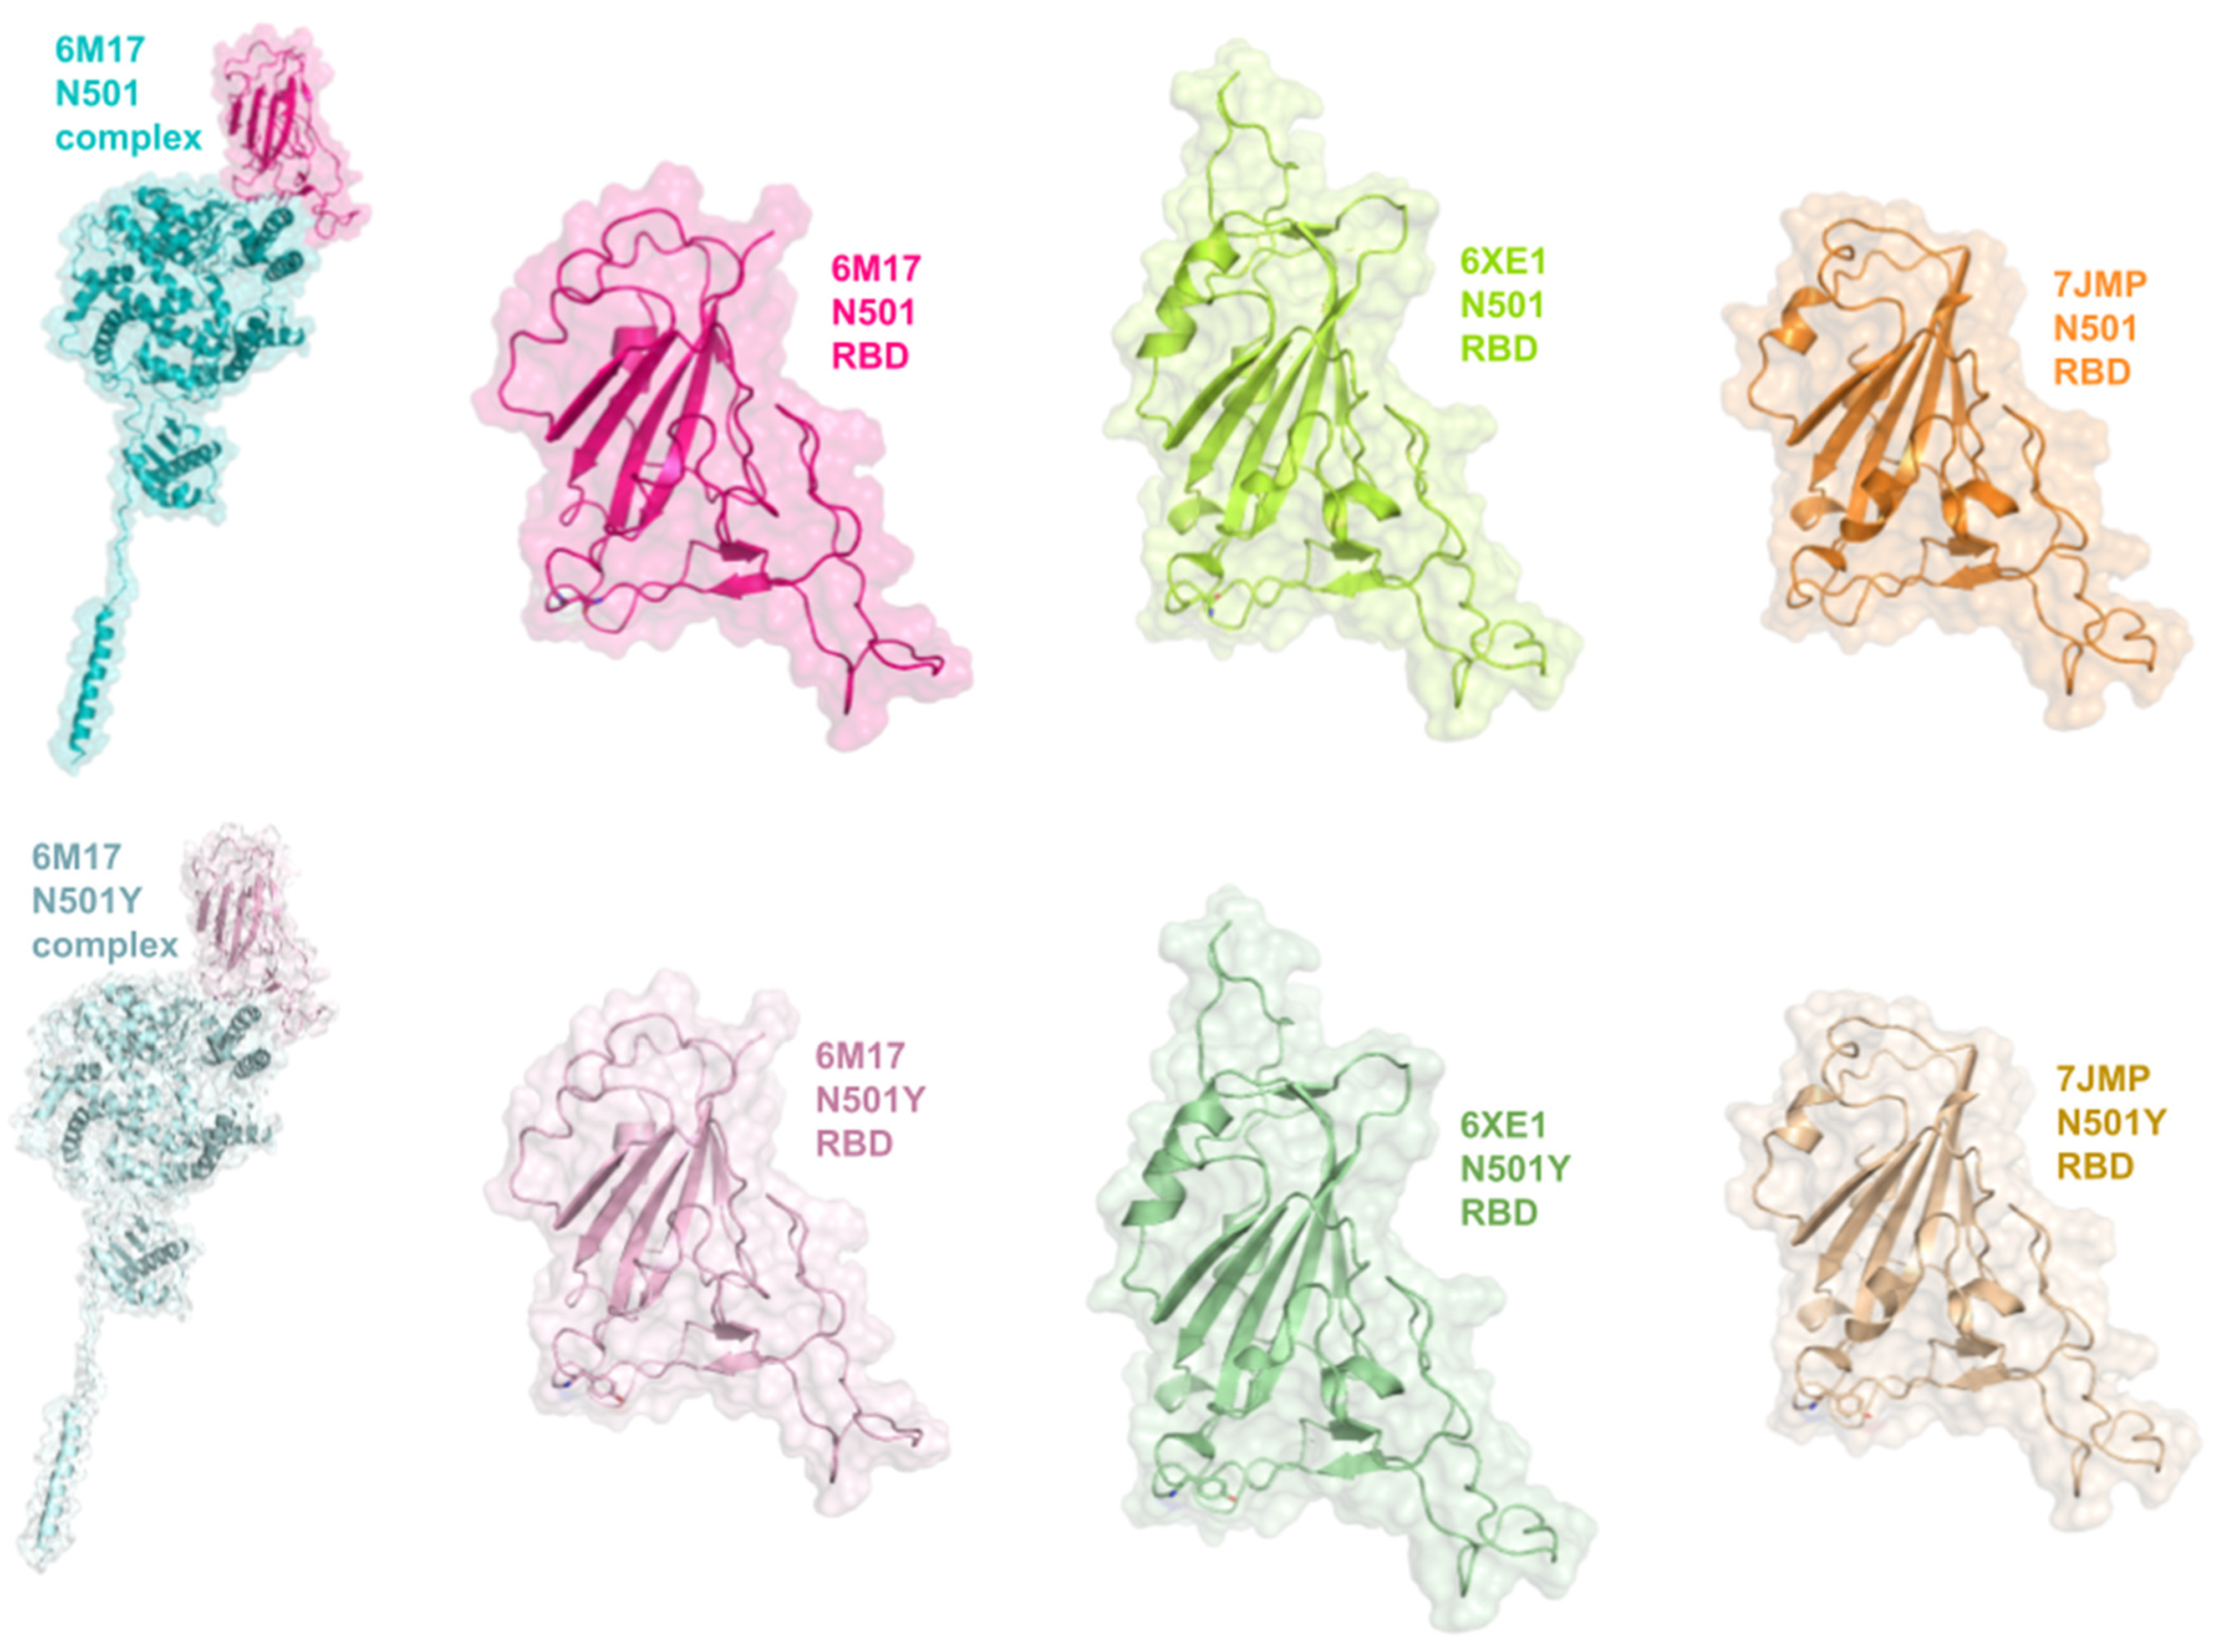
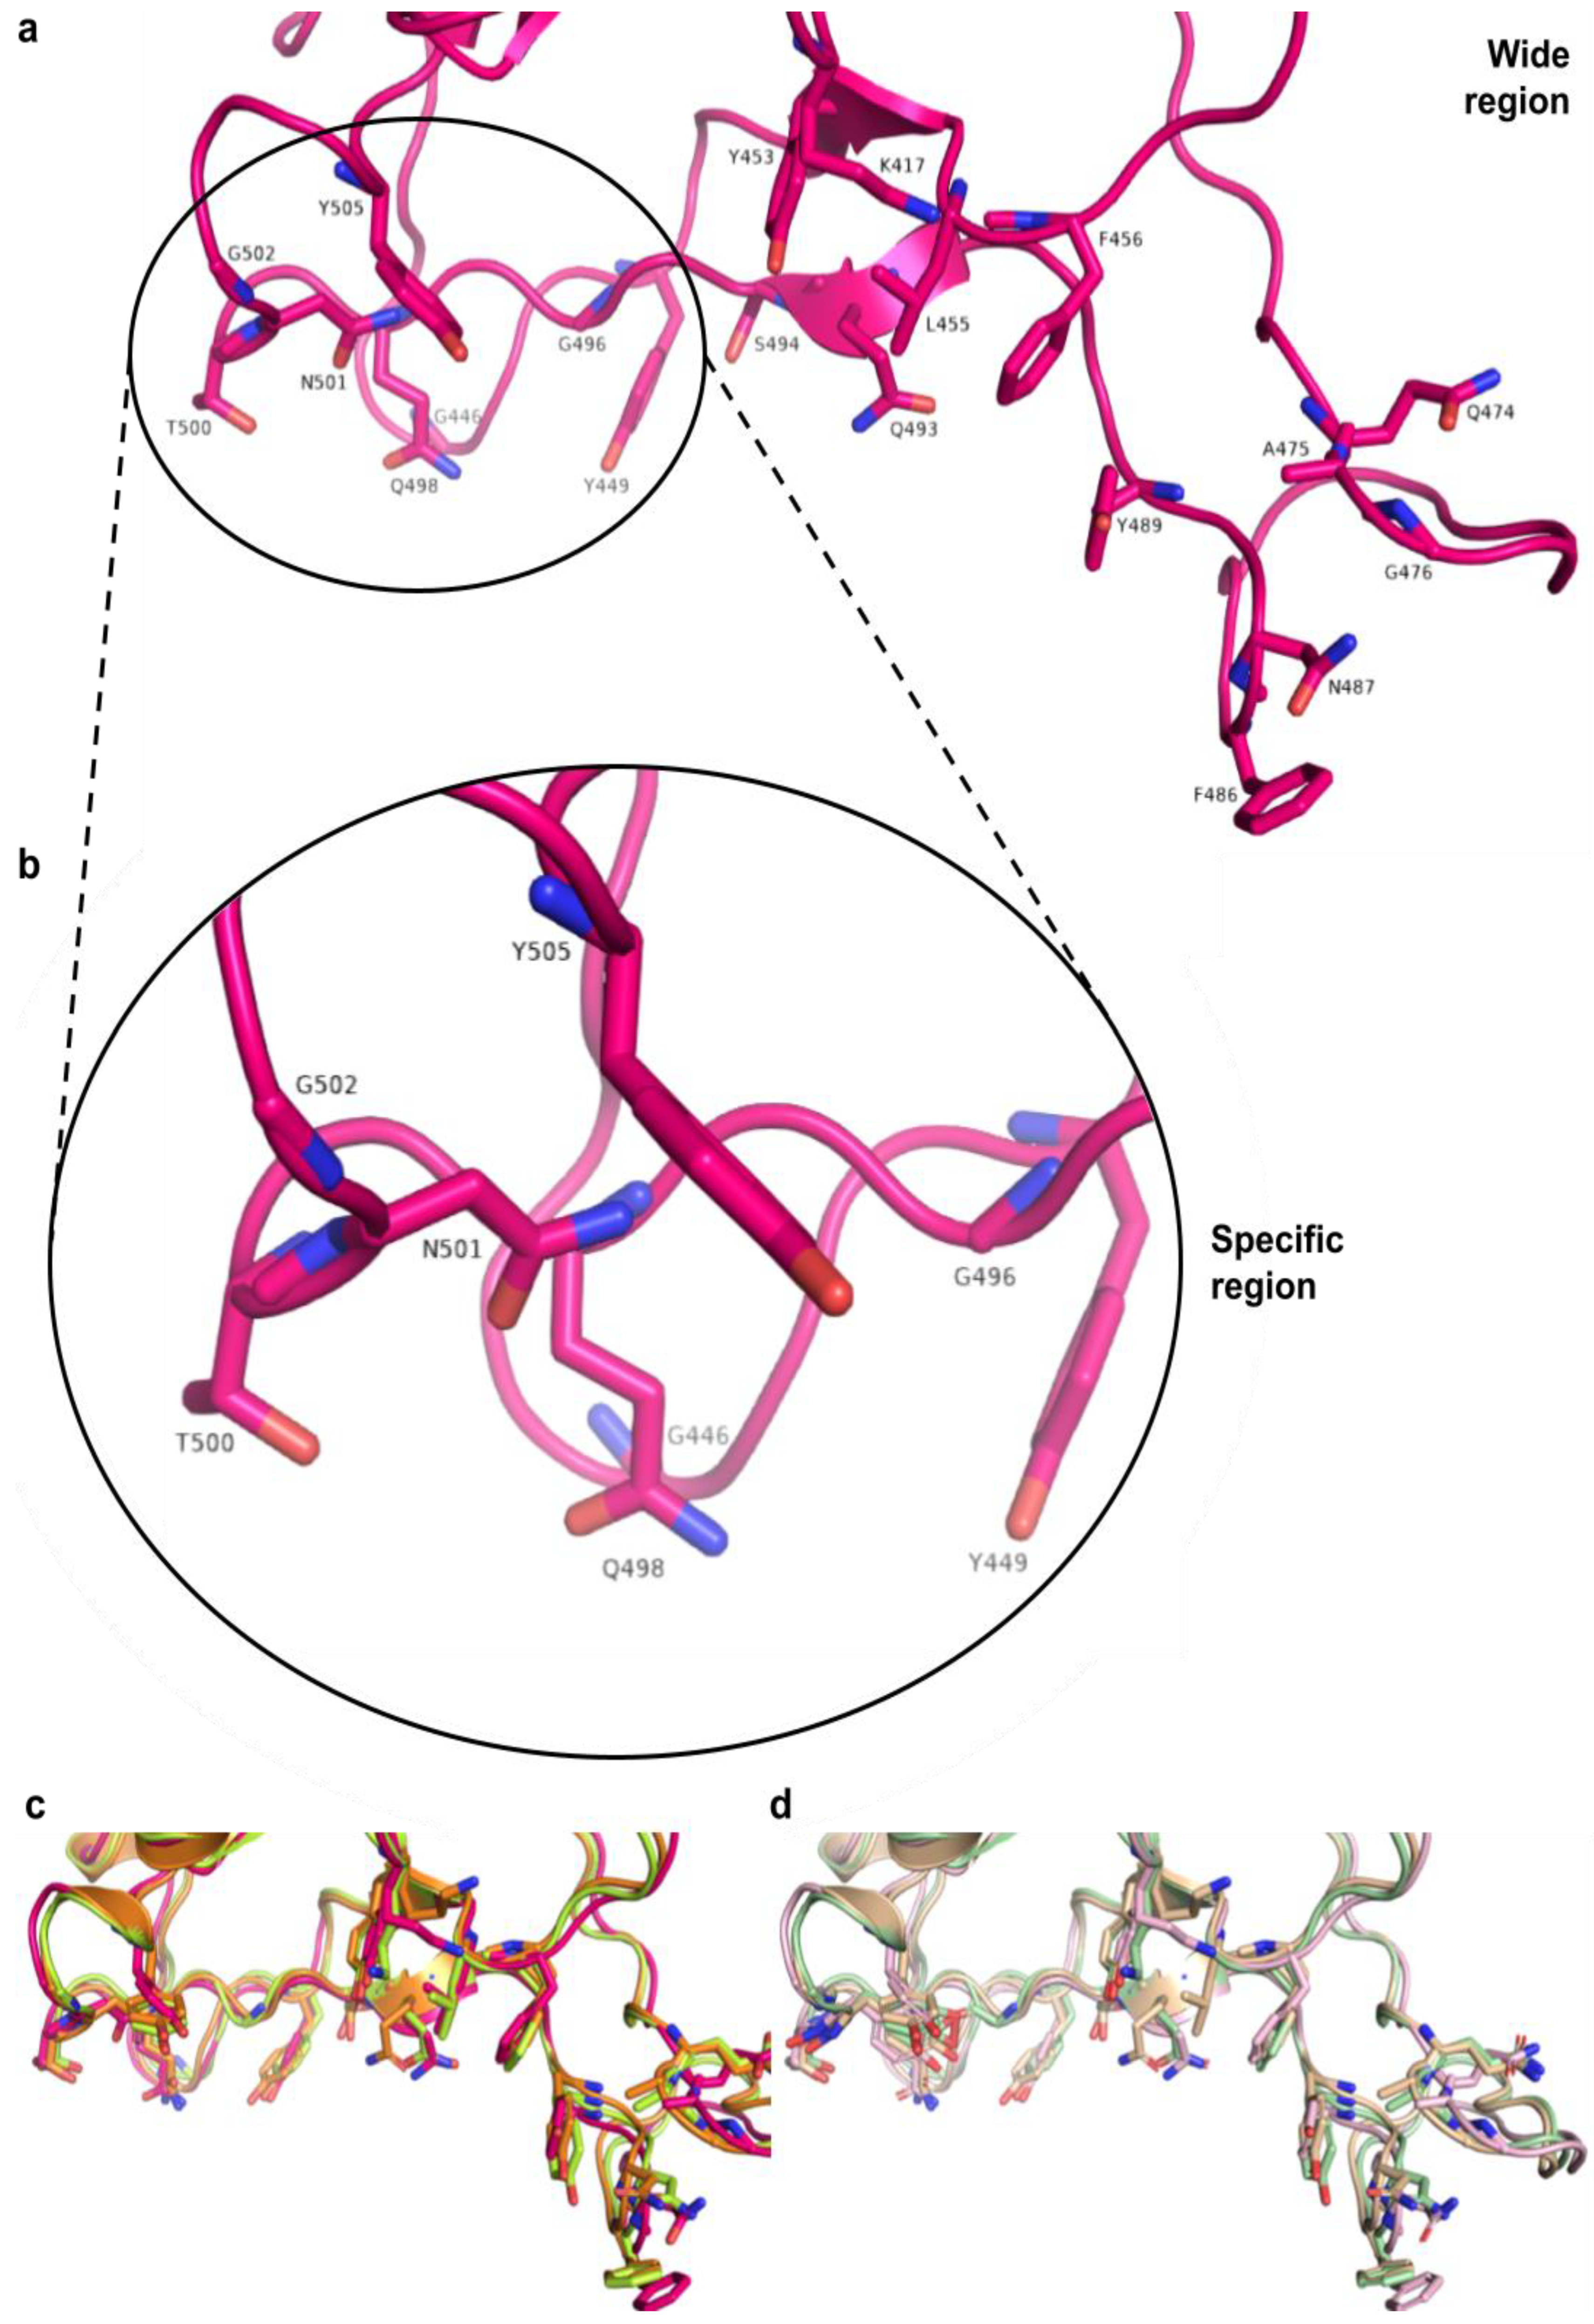
3.5. Interactions between RBD of Viral Spike and PD of ACE2 Receptor

PDBePISA (https:/ebi.ac.uk/pdbe/pisa/, accessed on 20 March 2021) [51,52,53] server was employed to compare the macromolecular RBD-ACE2 interfaces of N501 and N501Y RBDs from 6M17 complexes. This approach aided the evaluation of if/how the mutation affects intermolecular interactions and complex stability and comparisons with data related to the literature, when available (see Figure S6 and Table S8). ProteinsPlus was accessed by using HyPPI Prediction server [54], which classified interactions between RBD (N501 or N501Y) and ACE2 complex into permanent, transient, or crystal artifacts. Another server, PRODIGY (https://bianca.science.uu.nl/prodigy/, accessed on 25 April 2021) [55,56], predicted the binding affinities and dissociation constants of N501 and N501Y RBD-ACE2 complexes (see Figure S7).

3.6. Molecular Dynamics Simulations

Protein–ligand PDB files of the top three hits (s131, s443, and n115), docked with the best ECR-ranked RBD in N501 and N501Y versions, were retrieved from GOLD. This procedure allowed 6 MD simulations (3 ligands × 2 RBD versions). For the parameterization of the candidate inhibitors, RESP charges were calculated by Gaussian 09 (HF/6-31G*). After parameterizing the inhibitors, we used the UCSF Chimera for viewing the solvation box. Next to the choice of size of the periodic solvation properties, the tLEaP module (implemented in Ambertools18) was applied to generate the topology files of the complexes (receptor + inhibitor) and the receptor in the apo form. Thus, the molecular dynamics settings included cubic boxes, system neutralization (either with sodium or chloride ions, when appropriate), the force field ff99SB, TIP3P water solvation, 300 K temperature, the Langevin thermostat (ntt = 3), and the Monte Carlo barostat. The simulations started with five minimization steps to remove the bad contacts between the atoms. After, the systems were heated with a temperature range of 0 to 300 K and an equilibration step of 10 ns. Finally, the molecular dynamics simulations were performed at a time interval of 200 ns. The simulations were run on AMBER18 through High-Performance Computing (HPC) from the University of Sao Paulo.

3.7. Statistical Analysis of Docking Results

Statistical calculations and analysis were performed in Google Sheets or Python code via repl.it server. A p-value under 0.05 was considered significant. Shapiro–Wilk and Kolmogorov–Smirnov normality tests were performed for the docking results (scoring functions and their terms), and non-parametric tests were run when applicable.

3.8. Structural Analysis of the Proteins

The comparisons made in this study required eight RBD-containing structures (Figure 15), divided into two groups, comprised of N501 or N501Y RBDs: 6M17 RBD-ACE2 complex, 6M17, 6XE1, and 7JMP RBDs. Two sites (regions) of these structures were taken into account in analyses of protein–ligand interactions: “wide” and “specific” regions (Figure 16). The former targets twenty relevant RBD residues located at the central region, as well as C- and N-terminal sites; the latter includes eight key residues exclusively at the N-terminal site (Section 3). Further visualization of N501 and N501Y RBDs is depicted in Supplementary Information (Figures S10 and S11).

4. Conclusions

This study indicates differences among the protein–ligand docking conditions, notably for RBD regions (wide versus specific) and versions (N501 versus N501Y). The wide region had more favorable protein–ligand interactions than docking results directed to a particular site; a similar pattern according to the RBD version was also noticed, having more optimal interactions in Y501 than N501 RBDs. According to docking results, the “wide” and “mutated RBD” characteristics—docking simulations involving the wide region of an N501Y RBD—achieved the best results.
The ligands also tended to show better interactions with mutated RBDs in molecular dynamics. Additionally, the multitude of tyrosines in RBD interacting with the hit compounds suggests targetable residues in Structure-Based Drug Design. These hits could help to build pharmacophoric models, which can be used in studies related to Ligand-Based Drug Design. In particular, coenzyme Q10, 1-stearoyl-2-arachidonoylglycerol, and hentriacontan-16-one (palmitone) can be considered promising hits as inhibitors of the interaction between RBD-spike and ACE2. Disparities between protein–protein docking of N501 or N501Y RBDs with ACE2 were also noticeable. Albeit there was no substantial difference between the overall numbers of RBD-ACE2 interactions, we observed a more significant proportion of apolar-related contacts in the mutated RBD complexed with ACE2, an extra and stronger H bond between the residue 501 and K353, leading to a more energetically favorable complex.
Despite the findings obtained, inferences should be made carefully. When comparing the mutation effect in docking and molecular dynamics simulations, we aimed to assess the contribution of single essential amino acid present in certain Variants of Concern, but not assessing more of or all the sequence alterations among them. On the other hand, the multiple comparisons in other aspects (diverse compound sets, structures, sites, scoring functions, mutation, etc.) extended the data depiction of different circumstances. Whether the hit molecules can safely and effectively counteract the RBD binding to ACE2, reduce viral replication and treat COVID-19 might depend on hit-to-lead optimization and their evaluation in bioassays before clinical studies. These are questions that remain to be answered for this pandemic and potentially future ones to come.

Supplementary Materials

The following supporting information can be downloaded at: https://www.mdpi.com/article/10.3390/ddc2020022/s1, Figure S1. Docking results according to scoring functions (Chemscore and ChemPLP) and a function term (ChemScore’s ∆G). Charts representing boxplots for Chemscore, ∆G, and ChemPLP values of the (a) control, (b) natural) and (c) synthetic compounds under study. For a given chart, each dot in a box plot represents a score for a compound in a docking condition, varying by RBD-containing structure, absence or presence of mutation, and according to region. Outliers beyond the range shown in the charts were omitted; Figure S2. Correlation matrices between the functions and their terms employed to evaluate the docking results of the wide region. Correlation matrices for control (a–d), natural (e–h), and synthetic (i–l) compounds docked with N501 (a,b,e,f,i,j) and N501Y (c,d,g,h,k,l) RBD-containing structures, applying Pearson’s (a,c,e,g,i,k) and Spearman’s coefficients (b,d,f,h,j,l) to the mean results of each compound docked in the wide region. Chemscore function used for scoring is composed of the following terms: ∆G (binding energy), H bond (score for hydrogen bonds), Lipo. (protein-ligand lipophilic term contribution), H rot. (ligand conformational entropy loss when binding to the protein), Int. H bond (internal H bond, ligand intramolecular H bond contribution), DE clash (protein-ligand steric hindrance), DE int. (internal ligand torsional strain penalty), Int. cor. (internal ligand energy offset). ChemPLP used for rescoring presents an RMSD term (root mean square deviation between all conformations run for a ligand); Figure S3. Correlation matrices between ADME-related properties, the main functions, and terms used to evaluate the docking results of the wide region. Correlation matrices for control (a,b), natural (c–e), and synthetic (e–f) compounds, applying Pearson’s (a,c,e) and Spearman’s (b,d,f) coefficients. Each chart shows ADME-related properties, calculated from SwissADME, alongside Chemscore, ∆G, and ChemPLP mean results of each compound docked in the wide region of N501 and N501Y (indicated by an asterisk) RBD-containing structures; Figure S4. Interaction networks of the most frequent residues interacting with the top 10 hits. Interaction networks of the most frequent residues from N501 (upper left) and N501Y (lower left) RBD-containing structures interacting with the top 10 hits. The charts on the left only considered RBD residues from 6M17 RBD-ACE2, 6M17, 6XE1, and 7JMP RBDs. On the right, the most frequent RBD and ACE2 residues from 6M17 RBD-ACE2 interacting with the top 10 hits; Figure S5. Interaction profile between N501 or N501Y RBDs with ACE2. Nested pie charts of RBD (left chart) and ACE2 (right chart) interactions with the hits. White indicates N501 RBDs; black, N501Y. RBD interactions found less than six times were not exhibited in the figure, but aggregated in the “Other” categories. They are the following: forming H bonds, Y505 (4), F456 (3), K417 (3), N501 (3), G502 (2), E484 (2), Q498 (1), A475 (1), G447 (1) and Y495 (1) (N501 RBDs); N487 (5), G502 (5), F490 (3), Y505 (3), Q498 (3), T500 (3), G446 (2), L492 (2), G496 (2), F456 (1), A475 (1), E484 (1), Y495 (1), G447 (1) and F497 (1) (N501Y RBDs); hydrophobic contacts: Y449 (4), F497 (4), E484 (3), Y421 (2), Y453 (2), K417 (1), N487 (1), Y351 (1), K458 (1), I472 (1), G485 V483 and G496 (1) (N501 RBDs); L492 (5), F497 (5), K417 (4), Y473 (2), E484 (2), Y421 (2), F486 (1), N487 (1), K444 (1), S494 (1), P499 (1), T500 (1), G502 (1) and G504 (1) (N501Y RBDs). The data considered protein-ligand interactions between the hits and 6M17 complex, 6M17, 6XE1, and 7JMP RBDs in N501 and N501Y versions; Figure S6. PDBePISA’s main results for RBD sequences from RBD-ACE2 complexes. The figure highlights certain interfacing (yellow), solvent-accessible (light blue), and inaccessible residues (dark blue). HSDC, residues making hydrogen/disulfide bond, salt bridge or covalent link; ASA, accessible surface area [Å2]; BSA, buried surface area [Å2]; ∆iG, solvation energy effect [kcal mol−1]; ||||, buried area percentage, one bar per 10%; Figure S7. Comparison between N501 and N501Y RBDs in complex with ACE2. (a) Estimation, from the PRODIGY server, of the free energy changes and dissociation constants for N501 and N501Y RBD-ACE2. (b) Estimation by PRODIGY of the number of interfacial contacts in N501 and N501Y RBD-ACE2. In this server, the default threshold distance for the number of intermolecular contacts at the interface is 5.5 Å. (c) Results from the HyPPI Prediction server (proportions of transient complexes to crystal artifacts for N501 and N501Y RBD-ACE2); Figure S8. SwissADME’s bioavailability radar for drug-likeness of the top ECR-ranked molecules. Drug-like compounds ideally are within the red range in the plots below; Figure S9. Associations between pathways and the studied compounds. The heatmap shows how likely a pathway (x-axis number-coded as in the PathwayMap server) is associated with a compound from a set (y-axis number-coded with the indexes assigned to the ligands). 1.0, Global and overview maps; 1.1, Carbohydrate metabolism; 1.2, Energy metabolism; 1.3, Lipid metabolism; 1.4, Nucleotide metabolism; 1.5, Amino acid metabolism; 1.6, Metabolism of other amino acids; 1.7, Glycan biosynthesis and metabolism; 1.8, Metabolism of cofactors and vitamins; 1.9, Metabolism of terpenoids and polyketides; 1.10, Biosynthesis of other secondary metabolites; 1.11, Xenobiotics biodegradation and metabolism; 2.1, Transcription; 2.2, Translation; 2.3, Folding, sorting and degradation; 2.4, Replication and repair; 3.1, Membrane transport; 3.2, Signal transduction; 3.3, Signaling molecules and interaction; 4.1, Transport and catabolism; 4.2, Cell growth and death; 4.3, Cellular community—eukaryotes; 4.5, Cell motility; 5.1, Immune system; 5.2, Endocrine system; 5.3, Circulatory system; 5.4, Digestive system; 5.5, Excretory system; 5.6, Nervous system; 5.7, Sensory system; 5.8, Development; 5.9, Aging; 5.10, Environmental adaptation; 6.1, Cancers: overview; 6.2, Cancers: specific types; 6.3, Immune diseases; 6.4, Neurodegenerative diseases; 6.5, Substance dependence; 6.6, Cardiovascular diseases; 6.7, Endocrine and metabolic diseases; 6.8, Infectious diseases: bacterial; 6.9, Infectious diseases: viral; 6.10, Infectious diseases: parasitic; 6.12, Drug resistance: antineoplastic. The server was able to run interactive pathway maps for 24 control (https://playmolecule.com/PathwayMap/job/D956706F (accessed on 18 February 2021)), 124 natural (https://playmolecule.com/PathwayMap/job/9A3A9D46 (accessed on 18 February 2021)), and 489 synthetic (https://playmolecule.com/PathwayMap/job/61CE80A3#/ (accessed on 18 February 2021)) ligands; Figure S10. Overview of aligned wild-type (N501) RBDs. (a) 45° clockwise horizontal rotation of aligned 6M17, 6XE1 and 7JMP N501 RBDs in surface and (b) cartoon-only representations. (c) Comparison of N501 residues in each structure; Figure S11. Overview of aligned and mutated (N501Y) RBDs. (a) surface and (b) cartoon-only representations of aligned 6M17, 6XE1, 7JMP N501Y RBDs (rotated 45° horizontally and clockwise as in Figure 3. (c) N501Y comparison among RBDs. (d–f) Comparative between aligned 6M17 (d), 6XE1 (e) and 7JMP (f) N501 and N501Y RBDs; Table S1. Docking sites and their key residues targeted for molecular docking. The two first columns indicate if a residue was considered in the wide and/or specific regions; the other columns refer to whether they were mentioned (black rectangle) or not (blank rectangle) by the listed authors (Supplementary Information); Table S2. Classification and IC50 values of the control dataset. The table contains all the control compounds used in the study. For cases where the same compound was assessed in studies under different stages (a preprint and a published paper), the IC50 value of the published article was stated; Table S3. RMSD values (Å) among the aligned RBD-containing structures. By default, the RBD-containing structures were aligned to 6M17 RBD, but other alignments are shown in the table above; RMSD values for the 6M17 complex were omitted since it had the same RBD as in 6M17 RBD; Table S4. p-values for paired Wilcoxon two-tailed test to compare docking results according to RBD regions (wide ≠ specific) and versions (N501 ≠ N501Y). Wide and specific regions are compared to check for significant differences between their main docking results, according to each dataset and their RBD version (N501 or N501Y). Similarly, N501 and N501Y RBDs are compared, according to the datasets and their RBD regions (wide or specific); Table S5. p-values for paired Wilcoxon one-tailed test to compare docking results in RBD regions (wide > specific) and versions (N501 > N501Y). Docking regions are compared to check whether the wide region has significantly superior docking results, according to each dataset and their RBD version (N501 or N501Y). Similarly, RBD versions are compared, checking whether the N501 region has significantly better results than N501Y RBDs, according to the datasets and their RBD regions (wide or specific). Since the higher the Chemscore and ChemPLP scores and the lower the ∆G values, the more favorable the results, ∆G values were multiplied by −1 to be correctly interpreted in the Python program; Table S6. p-values for paired Wilcoxon one-tailed test to compare docking results in RBD regions (wide < specific) and versions (N501 < N501Y). p-values for paired Wilcoxon one-tailed test to compare docking results in RBD regions (wide < specific) and versions (N501 < N501Y). Docking regions are compared to check whether the wide region has significantly inferior docking results, according to each dataset and their RBD version (N501 or N501Y). Similarly, RBD versions are compared, checking whether the N501 region has significantly worse results than N501Y RBDs, according to the datasets and their RBD regions (wide or specific). Since the higher the Chemscore and ChemPLP scores and the lower the ∆G values, the more favorable the results, ∆G values were multiplied by −1 to be correctly interpreted in the Python program; Table S7. Top 10 ranked molecules in docking simulations. Their IUPAC or common names (when applicable) are indicated below; Table S8. Comparison of N501 and N501Y RBD-ACE2 complexes by PDBePISA. In these circumstances, the solvation energies displayed by PDBePISA should not be considered in absolute values, because the structures analyzed contain the RBD, but not entirely the Spike protein, to which a portion of the RBD would be attached and not exposed (as well as a part of ACE2, since it is a transmembrane protein). Instead, they should be interpreted qualitatively, comparing two RBDs differing in one residue; Table S9. Confidence intervals of eMolTox for top ECR-ranked molecules. ADMET properties predicted by eMolTox for a molecule for a 0.05 significance level α. Each value represents a confidence interval for an ADMET property of a ligand, which can present either a positive or negative result. Red indicates a concerning characteristic (e.g., positive result as a disruptor of the mitochondrial membrane potential); blue, optimal (e.g., negative result for liver injury); yellow, requiring further analysis; zero values indicate that it wasn’t able to return a given property for a particular ligand with α ≤ 0.05. Also, the yellow color for compounds acting as modulators doesn’t necessarily infer (a) toxicity, but the risk of a compound losing its potential specificity against RBD if it can act as a modulator of other targets. All the ten ligands had negative results as modulators of cyclooxygenase-2, beta (2 and 3) adrenergic receptors, vascular endothelial growth factor receptors (1 and 2), dopamine D1 receptor, calcitonin gene-related peptide type 1 receptor, receptor protein-tyrosine kinase erbB-2, adenosine A2a receptor, dopamine D2 receptor, glutamate NMDA receptor, androgen receptor, dopamine transporter, serotonin 3a (5-HT3a) receptor, histamine H1 receptor, melatonin receptor 1B, adenosine A2b receptor, beta-1 adrenergic receptor, serotonin 4 (5-HT4) receptor, alpha-1a adrenergic receptor, sigma opioid receptor, adenosine A3 receptor, peroxisome proliferator-activated receptor gamma, delta-opioid receptor, sodium channel protein type IX alpha subunit, norepinephrine transporter, P2X purinoceptor (3 and 7), adenosine A1 receptor, endothelin receptor ET-B, vascular endothelial growth factor receptor and serotonin 7 (5-HT7) receptor, endothelin receptor ET-A. References [57,58,59,60,61,62,63] are cited in the supplementary materials.

Author Contributions

Conceptualization, C.F.A.d.S.; methodology, C.F.A.d.S., S.O.C., M.d.O.A. and S.C.A.; validation, C.F.A.d.S.; formal analysis, C.F.A.d.S., S.O.C., M.d.O.A. and S.C.A.; investigation, C.F.A.d.S., S.O.C., M.d.O.A., S.C.A., M.S. and J.H.G.L.; data curation, C.F.A.d.S.; writing—original draft, C.F.A.d.S.; writing—review and editing, C.F.A.d.S., S.O.C., M.d.O.A., S.C.A., M.S., J.H.G.L. and K.M.H.; supervision, M.S., J.H.G.L. and K.M.H.; project administration, K.M.H.; funding acquisition, K.M.H. All authors have read and agreed to the published version of the manuscript.

Funding

This research was funded by FAPESP, CNPq, CAPES, and PUB-University of São Paulo.

Institutional Review Board Statement

Not applicable.

Informed Consent Statement

Not applicable.

Data Availability Statement

Protein and ligand files, docking, ADMET, molecular dynamics, and related data are available in Google Drive under request.

Conflicts of Interest

The authors declare no conflict of interest.

References

  1. WHO. Coronavirus Disease (COVID-19): Situation Reports. Available online: https://www.who.int/emergencies/diseases/novel-coronavirus-2019/situation-reports (accessed on 23 February 2021).
  2. WHO. Summary of Probable SARS Cases with Onset of Illness. Available online: https://www.who.int/publications/m/item/summary-of-probable-sars-cases-with-onset-of-illness-from-1-november-2002-to-31-july-2003 (accessed on 23 February 2021).
  3. WHO. Middle East Respiratory Syndrome: MERS Situation Update. Available online: http://www.emro.who.int/health-topics/mers-cov/mers-outbreaks.html (accessed on 23 February 2021).
  4. WHO. Novel Coronavirus—China. Available online: https://www.who.int/emergencies/disease-outbreak-news/item/2020-DON233 (accessed on 23 February 2021).
  5. Huang, C.; Wang, Y.; Li, X.; Ren, L.; Zhao, J.; Hu, Y.; Zhang, L.; Fan, G.; Xu, J.; Gu, X.; et al. Clinical features of patients infected with 2019 novel coronavirus in Wuhan, China. Lancet 2020, 395, 497–506. [Google Scholar] [CrossRef]
  6. Zhu, N.; Zhang, D.; Wang, W.; Li, X.; Yang, B.; Song, J.; Zhao, X.; Huang, B.; Shi, W.; Lu, R.; et al. A Novel Coronavirus from Patients with Pneumonia in China, 2019. N. Engl. J. Med. 2020, 382, 727–733. [Google Scholar] [CrossRef]
  7. Plowright, R.K.; Parrish, C.R.; McCallum, H.; Hudson, P.J.; Ko, A.I.; Graham, A.L.; Lloyd-Smith, J.O. Pathways to zo-onotic spillover. Nat. Rev. Microbiol. 2017, 15, 502–510. [Google Scholar] [CrossRef]
  8. Greger, M. The Human/Animal Interface: Emergence and Resurgence of Zoonotic Infectious Diseases. Crit. Rev. Microbiol. 2007, 33, 243–299. [Google Scholar] [CrossRef]
  9. Ye, Z.-W.; Yuan, S.; Yuen, K.-S.; Fung, S.-Y.; Chan, C.-P.; Jin, D.-Y. Zoonotic origins of human coronaviruses. Int. J. Biol. Sci. 2020, 16, 1686. [Google Scholar] [CrossRef]
  10. Andersen, K.G.; Rambaut, A.; Lipkin, W.I.; Holmes, E.C.; Garry, R.F. The proximal origin of SARS-CoV-2. Nat. Med. 2020, 26, 450–452. [Google Scholar] [CrossRef]
  11. Yan, R.; Zhang, Y.; Li, Y.; Xia, L.; Guo, Y.; Zhou, Q. Structural basis for the recognition of SARS-CoV-2 by full-length human ACE2. Science 2020, 367, 1444–1448. [Google Scholar] [CrossRef] [PubMed]
  12. Watanabe, Y.; Allen, J.D.; Wrapp, D.; McLellan, J.S.; Crispin, M. Site-specific glycan analysis of the SARS-CoV-2 spike. Science 2020, 369, 330–333. [Google Scholar] [CrossRef] [PubMed]
  13. Huang, Y.; Yang, C.; Xu, X.F.; Xu, W.; Liu, S.W. Structural and functional properties of SARS-CoV-2 spike protein: Potential antivirus drug development for COVID-19. Acta Pharmacol. Sin. 2020, 41, 1141–1149. [Google Scholar] [CrossRef] [PubMed]
  14. Hanson, Q.M.; Wilson, K.M.; Shen, M.; Itkin, Z.; Eastman, R.T.; Shinn, P.; Hall, M.D. Targeting ACE2–RBD Interaction as a Platform for COVID-19 Therapeutics: Development and Drug-Repurposing Screen of an AlphaLISA Proximity Assay. ACS Pharmacol. Transl. Sci. 2020, 3, 1352–1360. [Google Scholar] [CrossRef]
  15. Wu, Y.; Wang, F.; Shen, C.; Peng, W.; Li, D.; Zhao, C.; Li, Z.; Li, S.; Bi, Y.; Yang, Y.; et al. A noncompeting pair of human neutralizing antibodies block COVID-19 virus binding to its receptor ACE2. Science 2020, 368, 1274–1278. [Google Scholar] [CrossRef]
  16. Grant, O.C.; Montgomery, D.; Ito, K.; Woods, R.J. Analysis of the SARS-CoV-2 spike protein glycan shield reveals implica-tions for immune recognition. Sci. Rep. 2020, 10, 14991. [Google Scholar] [CrossRef]
  17. Shang, J.; Wan, Y.; Luo, C.; Ye, G.; Geng, Q.; Auerbach, A.; Li, F. Cell entry mechanisms of SARS-CoV-2. Proc. Natl. Acad. Sci. USA 2020, 117, 11727–11734. [Google Scholar] [CrossRef]
  18. WHO. Therapeutics and COVID-19: Living Guideline. Available online: https://www.who.int/publications/i/item/WHO-2019-nCoV-therapeutics-2022.4 (accessed on 15 July 2022).
  19. Singh, B.; Ryan, H.; Kredo, T.; Chaplin, M.; Fletcher, T. Chloroquine or hydroxychloroquine for prevention and treatment of COVID-19. Cochrane Database Syst. Rev. 2021, 2, CD013587. [Google Scholar] [CrossRef]
  20. Ghazy, R.M.; Almaghraby, A.; Shaaban, R.; Kamal, A.; Beshir, H.; Moursi, A.; Ramadan, A.; Taha, S.H.N. A systematic review and meta-analysis on chloroquine and hydroxychloroquine as monotherapy or combined with azithromycin in COVID-19 treatment. Sci. Rep. 2020, 10, 22139. [Google Scholar] [CrossRef]
  21. Zheng, Z.; Wu, Y.; Qian, D.; Lian, J. Off-label use of chloroquine, hydroxychloroquine, azithromycin and lopinavir/ritonavir in COVID-19 risks prolonging the Q.T. interval by targeting the hERG channel. Eur. J. Pharmacol. 2021, 893, 173813. [Google Scholar]
  22. Axfors, C.; Schmitt, A.M.; Janiaud, P.; Hooft, J.V.; Abd-Elsalam, S.; Abdo, E.F.; Abella, B.S.; Akram, J.; Amaravadi, R.K.; Angus, D.C.; et al. Mortality outcomes with hydroxychloroquine and chloroquine in COVID-19 from an international collaborative meta-analysis of randomized trials. Nat. Commun. 2021, 12, 2349. [Google Scholar] [CrossRef] [PubMed]
  23. Lester, M.; Sahin, A.; Pasyar, A. The use of dexamethasone in the treatment of COVID-19. Ann. Med. Surg. 2020, 56, 218–219. [Google Scholar] [CrossRef] [PubMed]
  24. Lim, M.A.; Pranata, R. Worrying situation regarding the use of dexamethasone for COVID-19. Ther. Adv. Respir. Dis. 2020, 14, 1753466620942131. [Google Scholar] [CrossRef]
  25. Brotherton, H.; Usuf, E.; Nadjm, B.; Forrest, K.; Bojang, K.; Samateh, A.L.; Bittaye, M.; Roberts, C.A.; D’Alessandro, U.; Roca, A. Dexamethasone for COVID-19: Data needed from randomised clinical trials in Africa. Lancet Glob. Health 2020, 8, e1125–e1126. [Google Scholar] [CrossRef]
  26. Ahmed, M.H.; Hassan, A. Dexamethasone for the Treatment of Coronavirus Disease (COVID-19): A Review. SN Compr. Clin. Med. 2020, 2, 2637–2646. [Google Scholar] [CrossRef] [PubMed]
  27. Shaman, J.; Galanti, M. Will SARS-CoV-2 become endemic? Science 2020, 370, 527–529. [Google Scholar] [CrossRef] [PubMed]
  28. Fontanet, A.; Autran, B.; Lina, B.; Kieny, M.P.; Karim, S.S.A.; Sridhar, D. SARS-CoV-2 variants and ending the COVID-19 pandemic. Lancet 2021, 397, 952–964. [Google Scholar] [CrossRef] [PubMed]
  29. Variant: S:N501. CoVariants. Available online: https://covariants.org/variants/S.N501 (accessed on 26 April 2021).
  30. Rifaioglu, A.S.; Atas, H.; Martin, M.J.; Cetin-Atalay, R.; Atalay, V.; Doğan, T. Recent applications of deep learning and machine intelligence on in silico drug discovery: Methods, tools and databases. Brief. Bioinform. 2019, 20, 1878–1912. [Google Scholar] [CrossRef]
  31. Liu, X.; Shi, D.; Zhou, S.; Liu, H.; Liu, H.; Yao, X. Molecular dynamics simulations and novel drug discovery. Expert Opin. Drug Discov. 2017, 13, 23–37. [Google Scholar] [CrossRef] [PubMed]
  32. Hansen, K.S.; Mogensen, T.H.; Agergaard, J.; Schiøttz-Christensen, B.; Østergaard, L.; Vibholm, L.K.; Leth, S. High-dose coenzyme Q10 therapy versus placebo in patients with post COVID-19 condition: A randomized, phase 2, crossover trial. Lancet Reg. Health Eur. 2023, 24, 100539. [Google Scholar] [CrossRef] [PubMed]
  33. Wang, R.; Chen, Y.; Tian, Z.; Zhu, M.; Zhang, B.; Du, S.; Li, Y.; Liu, Z.; Hou, S.; Yang, Y. Coenzyme Q10 Attenuates Human Platelet Aggregation Induced by SARS-CoV-2 Spike Protein via Re-ducing Oxidative Stress In Vitro. Int. J. Mol. Sci. 2022, 23, 12345. [Google Scholar] [CrossRef]
  34. wwPDB Consortium. Protein Data Bank: The single global archive for 3D macromolecular structure data. Nucleic Acids Res. 2019, 47, D520–D528. [Google Scholar] [CrossRef]
  35. Waterhouse, A.; Bertoni, M.; Bienert, S.; Studer, G.; Tauriello, G.; Gumienny, R.; Heer, F.T.; de Beer, T.A.P.; Rempfer, C.; Bordoli, L.; et al. SWISS-MODEL: Homology modelling of protein structures and complexes. Nucleic Acids Res. 2018, 46, W296–W303. [Google Scholar] [CrossRef]
  36. Verdonk, M.L.; Cole, J.C.; Hartshorn, M.J.; Murray, C.W.; Taylor, R.D. Improved protein-ligand docking using GOLD. Proteins Struct. Funct. Bioinform. 2003, 52, 609–623. [Google Scholar] [CrossRef]
  37. Gulotta, M.R.; Lombino, J.; Perricone, U.; De Simone, G.; Mekni, N.; De Rosa, M.; Diana, P.; Padova, A. Targeting SARS-CoV-2 RBD interface: A supervised computational data-driven approach to identify po-tential modulators. ChemMedChem 2020, 15, 1921–1931. [Google Scholar] [CrossRef] [PubMed]
  38. Han, P.; Li, L.; Liu, S.; Wang, Q.; Zhang, D.; Xu, Z.; Han, P.; Li, X.; Peng, Q.; Su, C.; et al. Receptor binding and complex structures of human ACE2 to spike RBD from omicron and delta SARS-CoV-2. Cell 2022, 185, 630–640. [Google Scholar] [CrossRef]
  39. Wu, N.C.; Yuan, M.; Liu, H.; Lee, C.-C.D.; Zhu, X.; Bangaru, S.; Torres, J.L.; Caniels, T.G.; Brouwer, P.J.M.; van Gils, M.J.; et al. An alternative binding mode of IGHV3-53 antibodies to the SARS-CoV-2 receptor binding domain. Cell Rep. 2020, 33, 108274. [Google Scholar] [CrossRef]
  40. Lan, J.; Ge, J.; Yu, J.; Shan, S.; Zhou, H.; Fan, S.; Zhang, Q.; Shi, X.; Wang, Q.; Zhang, L.; et al. Structure of the SARS-CoV-2 spike receptor-binding domain bound to the ACE2 receptor. Nature 2020, 581, 215–220. [Google Scholar] [CrossRef]
  41. Eldridge, M.D.; Murray, C.W.; Auton, T.R.; Paolini, G.V.; Mee, R.P. Empirical scoring functions: I. The development of a fast empirical scoring function to estimate the binding affinity of ligands in receptor complexes. J. Comput. Aided Mol. Des. 1997, 11, 425–445. [Google Scholar] [CrossRef] [PubMed]
  42. Baxter, C.A.; Murray, C.W.; Clark, D.E.; Westhead, D.R.; Eldridge, M.D. Flexible docking using Tabu search and an em-pirical estimate of binding affinity. Proteins Struct. Funct. Bioinform. 1998, 33, 367–382. [Google Scholar] [CrossRef]
  43. Korb, O.; Stützle, T.; Exner, T.E. Empirical Scoring Functions for Advanced Protein−Ligand Docking with PLANTS. J. Chem. Inf. Model. 2009, 49, 84–96. [Google Scholar] [CrossRef]
  44. Su, M.; Yang, Q.; Du, Y.; Feng, G.; Liu, Z.; Li, Y.; Wang, R. Comparative Assessment of Scoring Functions: The CASF-2016 Update. J. Chem. Inf. Model. 2019, 59, 895–913. [Google Scholar] [CrossRef]
  45. Palacio-Rodríguez, K.; Lans, I.; Cavasotto, C.N.; Cossio, P. Exponential consensus ranking improves the outcome in docking and receptor ensemble docking. Sci. Rep. 2019, 9, 5142. [Google Scholar] [CrossRef]
  46. Salentin, S.; Schreiber, S.; Haupt, V.J.; Adasme, M.F.; Schroeder, M. PLIP: Fully automated protein–ligand interaction profiler. Nucleic Acids Res. 2015, 43, W443–W447. [Google Scholar] [CrossRef]
  47. Daina, A.; Michielin, O.; Zoete, V. SwissADME: A free web tool to evaluate pharmacokinetics, drug-likeness and medicinal chemistry friendliness of small molecules. Sci. Rep. 2017, 7, 42717. [Google Scholar] [CrossRef]
  48. Yang, H.; Lou, C.; Sun, L.; Li, J.; Cai, Y.; Wang, Z.; Li, W.; Liu, G.; Tang, Y. admetSAR 2.0: Web-service for prediction and optimization of chemical ADMET properties. Bioinformatics 2018, 35, 1067–1069. [Google Scholar] [CrossRef] [PubMed]
  49. Ji, C.; Svensson, F.; Zoufir, A.; Bender, A. eMolTox: Prediction of molecular toxicity with confidence. Bioinformatics 2018, 34, 2508–2509. [Google Scholar] [CrossRef] [PubMed]
  50. Jiménez, J.; Sabbadin, D.; Cuzzolin, A.; Martínez-Rosell, G.; Gora, J.; Manchester, J.; Duca, J.S.; De Fabritiis, G. PathwayMap: Molecular Pathway Association with Self-Normalizing Neural Networks. J. Chem. Inf. Model. 2018, 59, 1172–1181. [Google Scholar] [CrossRef]
  51. Krissinel, E.; Henrick, K. Protein interfaces, surfaces and assemblies service P.I.S.A. at European Bioinformatics Institute. J Mol. Biol. 2007, 372, 774–797. [Google Scholar] [CrossRef] [PubMed]
  52. Krissinel, E.; Henrick, K. Detection of protein assemblies in crystals. In International Symposium on Computational Life Science; Springer: Berlin/Heidelberg, Germany, 2005; pp. 163–174. [Google Scholar]
  53. Krissinel, E. Crystal contacts as nature’s docking solutions. J. Comput. Chem. 2010, 31, 133–143. [Google Scholar] [CrossRef]
  54. Schneider, N.; Lange, G.; Hindle, S.; Klein, R.; Rarey, M. A consistent description of HYdrogen bond and DEhydration en-ergies in protein–ligand complexes: Methods behind the HYDE scoring function. J. Comput. Aided Mol. Des. 2013, 27, 15–29. [Google Scholar] [CrossRef]
  55. Vangone, A.; Bonvin, A.M.J.J. Contact-based prediction of binding affinity in protein-protein complexes. eLife 2015, 4, e07454. [Google Scholar] [CrossRef]
  56. Xue, L.C.; Rodrigues, J.P.; Kastritis, P.L.; Bonvin, A.M.; Vangone, A. PRODIGY: A web server for predicting the binding affinity of protein–protein complexes. Bioinformatics 2016, 32, 3676–3678. [Google Scholar] [CrossRef]
  57. Fu, W.; Chen, Y.; Wang, K.; Hettinghouse, A.; Hu, W.; Wang, J.-Q.; Lei, Z.-N.; Chen, Z.-S.; Stapleford, K.A.; Liu, C.-J. Repurposing FDA-approved drugs for SARS-CoV-2 through an ELISA-based screening for the inhibition of RBD/ACE2 interaction. Protein Cell 2021, 12, 586–591. [Google Scholar] [CrossRef]
  58. Bojadzic, D.; Alcazar, O.; Buchwald, P. Methylene Blue Inhibits the SARS-CoV-2 spike–ACE2 Protein-Protein Interaction–a Mechanism that can Contribute to its Antiviral Activity Against COVID-19. Front. Pharmacol. 2021, 11, 600372. [Google Scholar] [CrossRef] [PubMed]
  59. Lin, C.; Li, Y.; Zhang, Y.; Liu, Z.; Mu, X.; Gu, C.; Liu, J.; Li, Y.; Li, G.; Chen, J. Ceftazidime Is a Potential Drug to Inhibit SARS-CoV-2 Infection In Vitro by Blocking Spike Protein-ACE2 Interaction. Available online: https://biorxiv.org/content/10.1101/2020.09.14.295956v1.full (accessed on 20 February 2021).
  60. Mulgaonkar, N.S.; Wang, H.; Mallawarachchi, S.; Růžek, D.; Martina, B.; Fernando, S. Bcr-Abl Tyrosine Kinase Inhibitor Imatinib as a Potential Drug for COVID-19. Available online: https://biorxiv.org/content/10.1101/2020.06.18.158196v2 (accessed on 20 February 2021).
  61. Bojadzic, D.; Alcazar, O.; Chen, J.; Buchwald, P. Small-Molecule In Vitro Inhibitors of the Coronavirus Spike-ACE2 Protein-Protein Interaction as Blockers of Viral Attachment and Entry for SARS-CoV-2. Available online: https://biorxiv.org/content/10.1101/2020.10.22.351056v1 (accessed on 20 February 2021).
  62. Virtanen, S.I.; Niinivehmas, S.P.; Pentikäinen, O.T. Case-specific performance of MM-PBSA, MM-GBSA, and SIE in virtual screening. J. Mol. Graph. Model. 2015, 62, 303–318. [Google Scholar] [CrossRef] [PubMed]
  63. Wang, E.; Sun, H.; Wang, J.; Wang, Z.; Liu, H.; Zhang, J.Z.; Hou, T. End-point binding free energy calculation with MM/PBSA and MM/GBSA: Strategies and applications in drug design. Chem. Rev. 2019, 119, 9478–9508. [Google Scholar] [CrossRef] [PubMed]
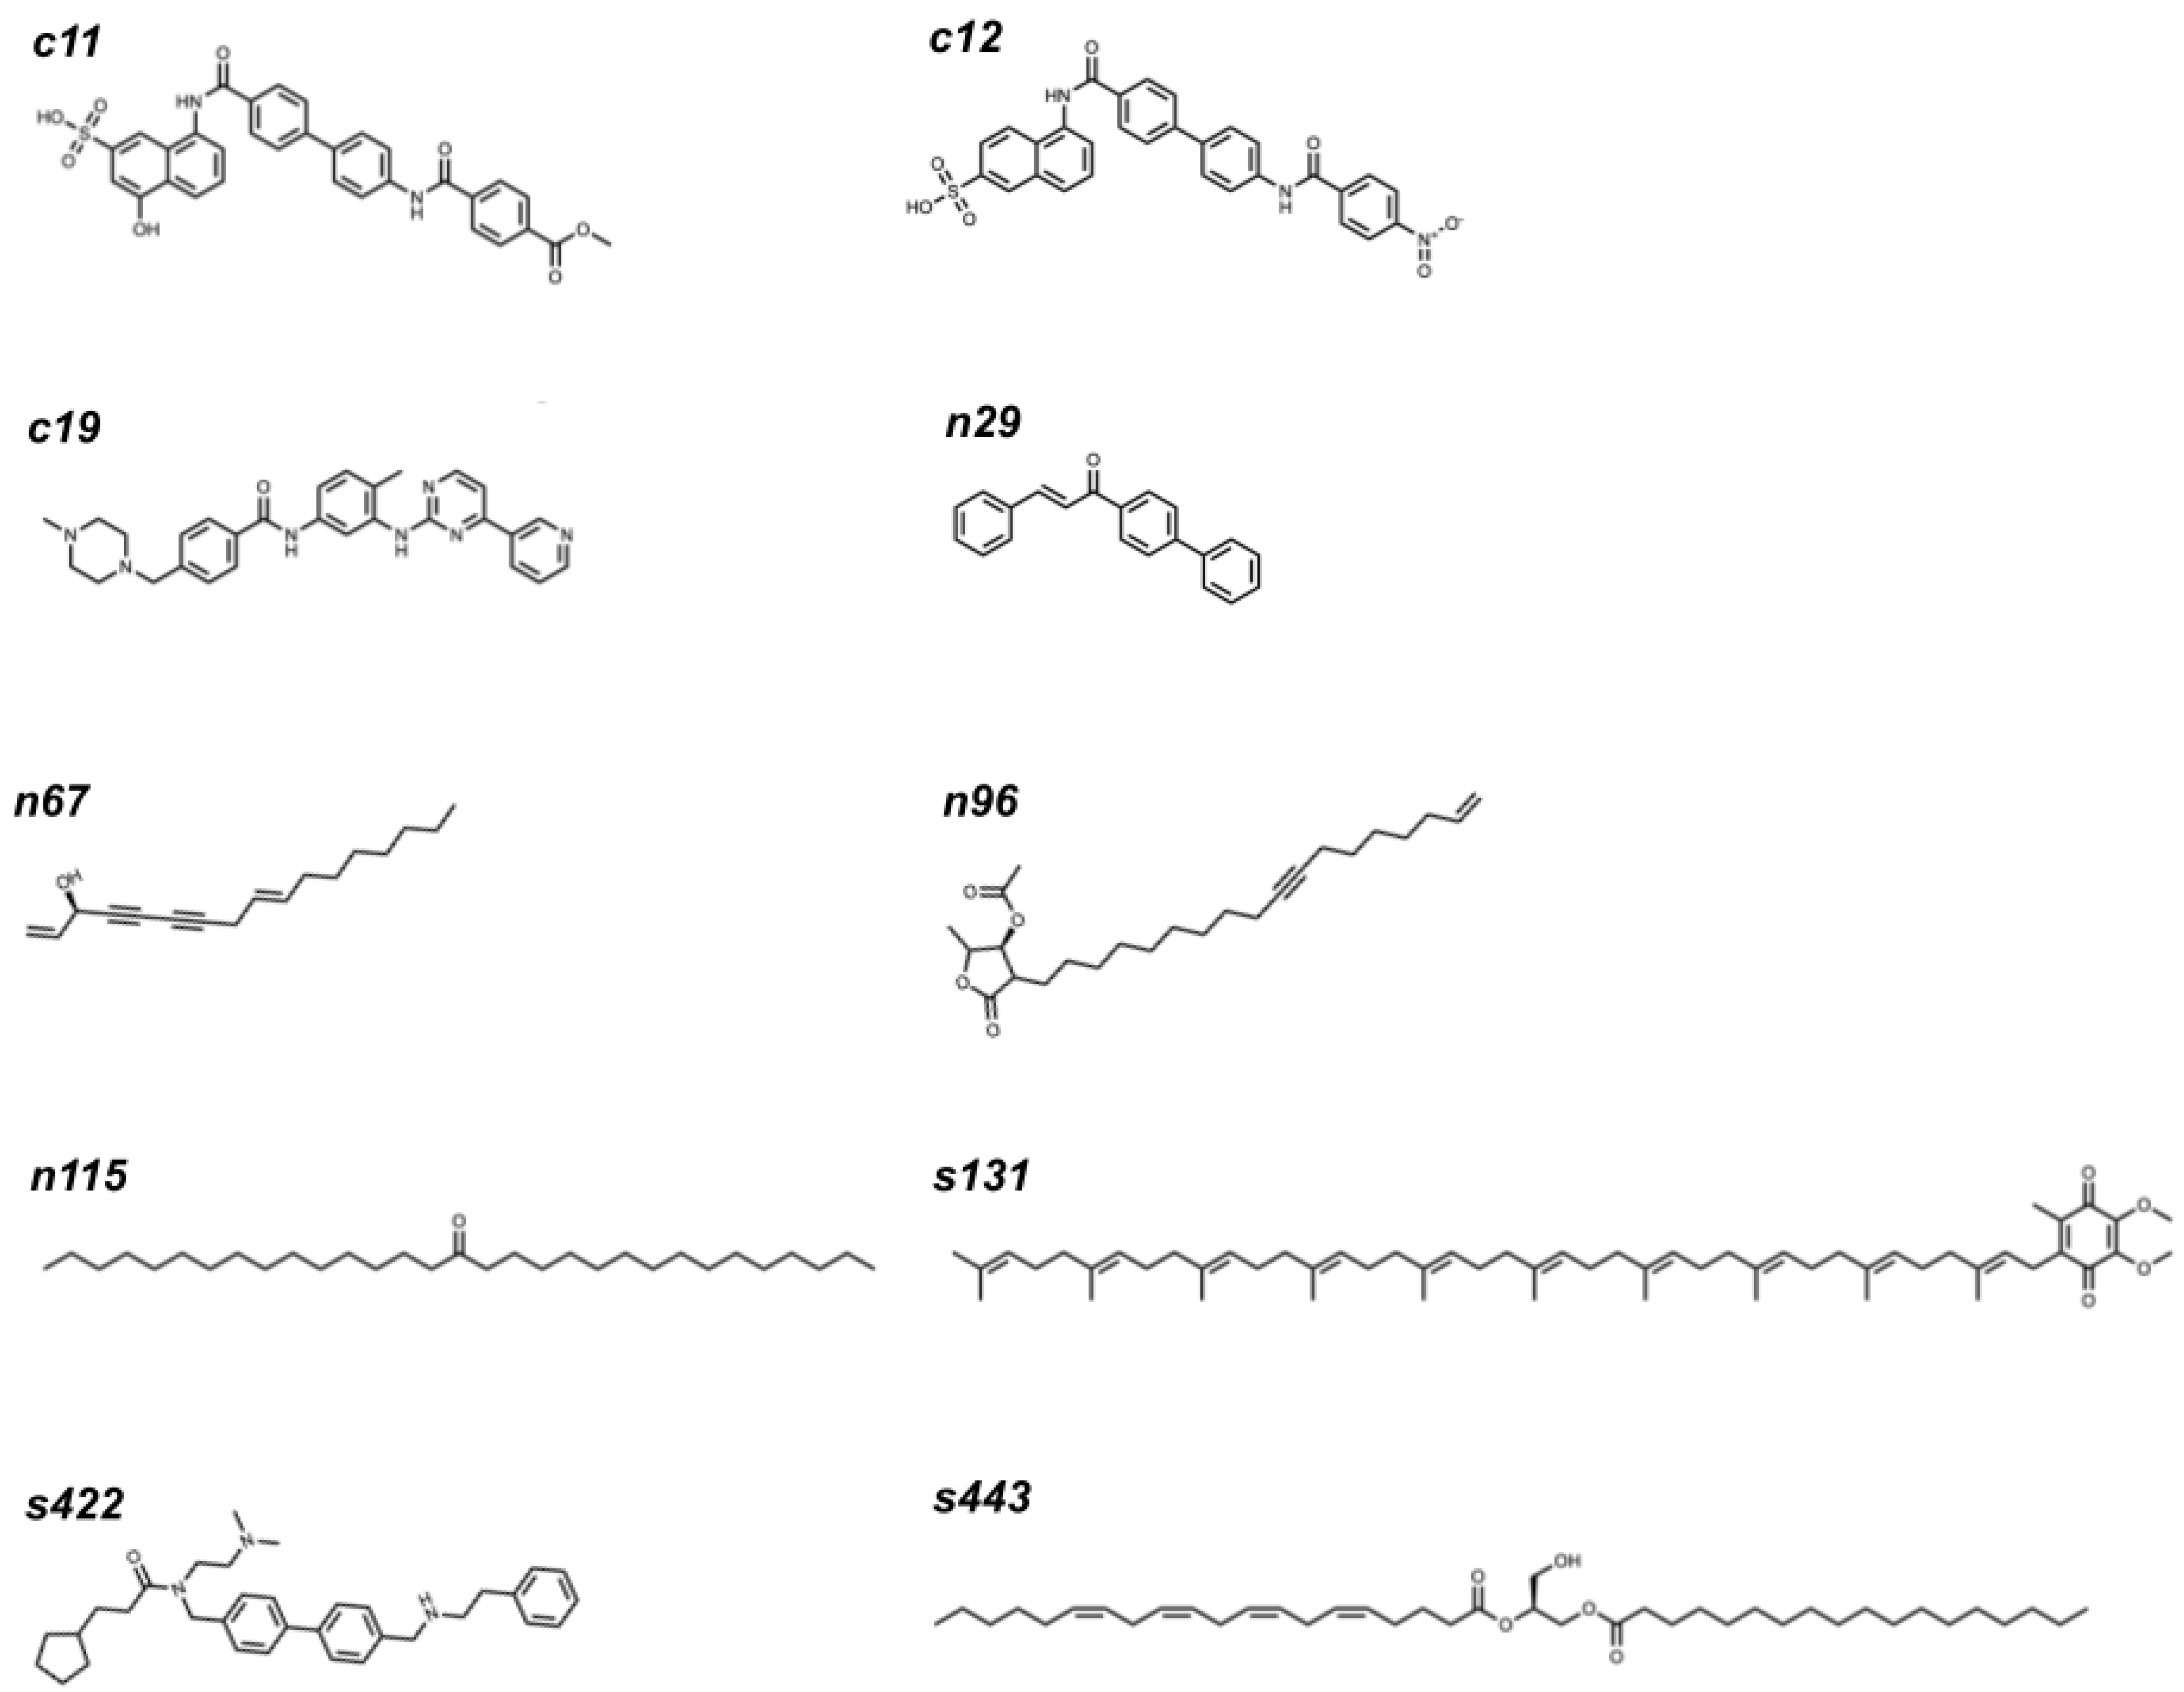
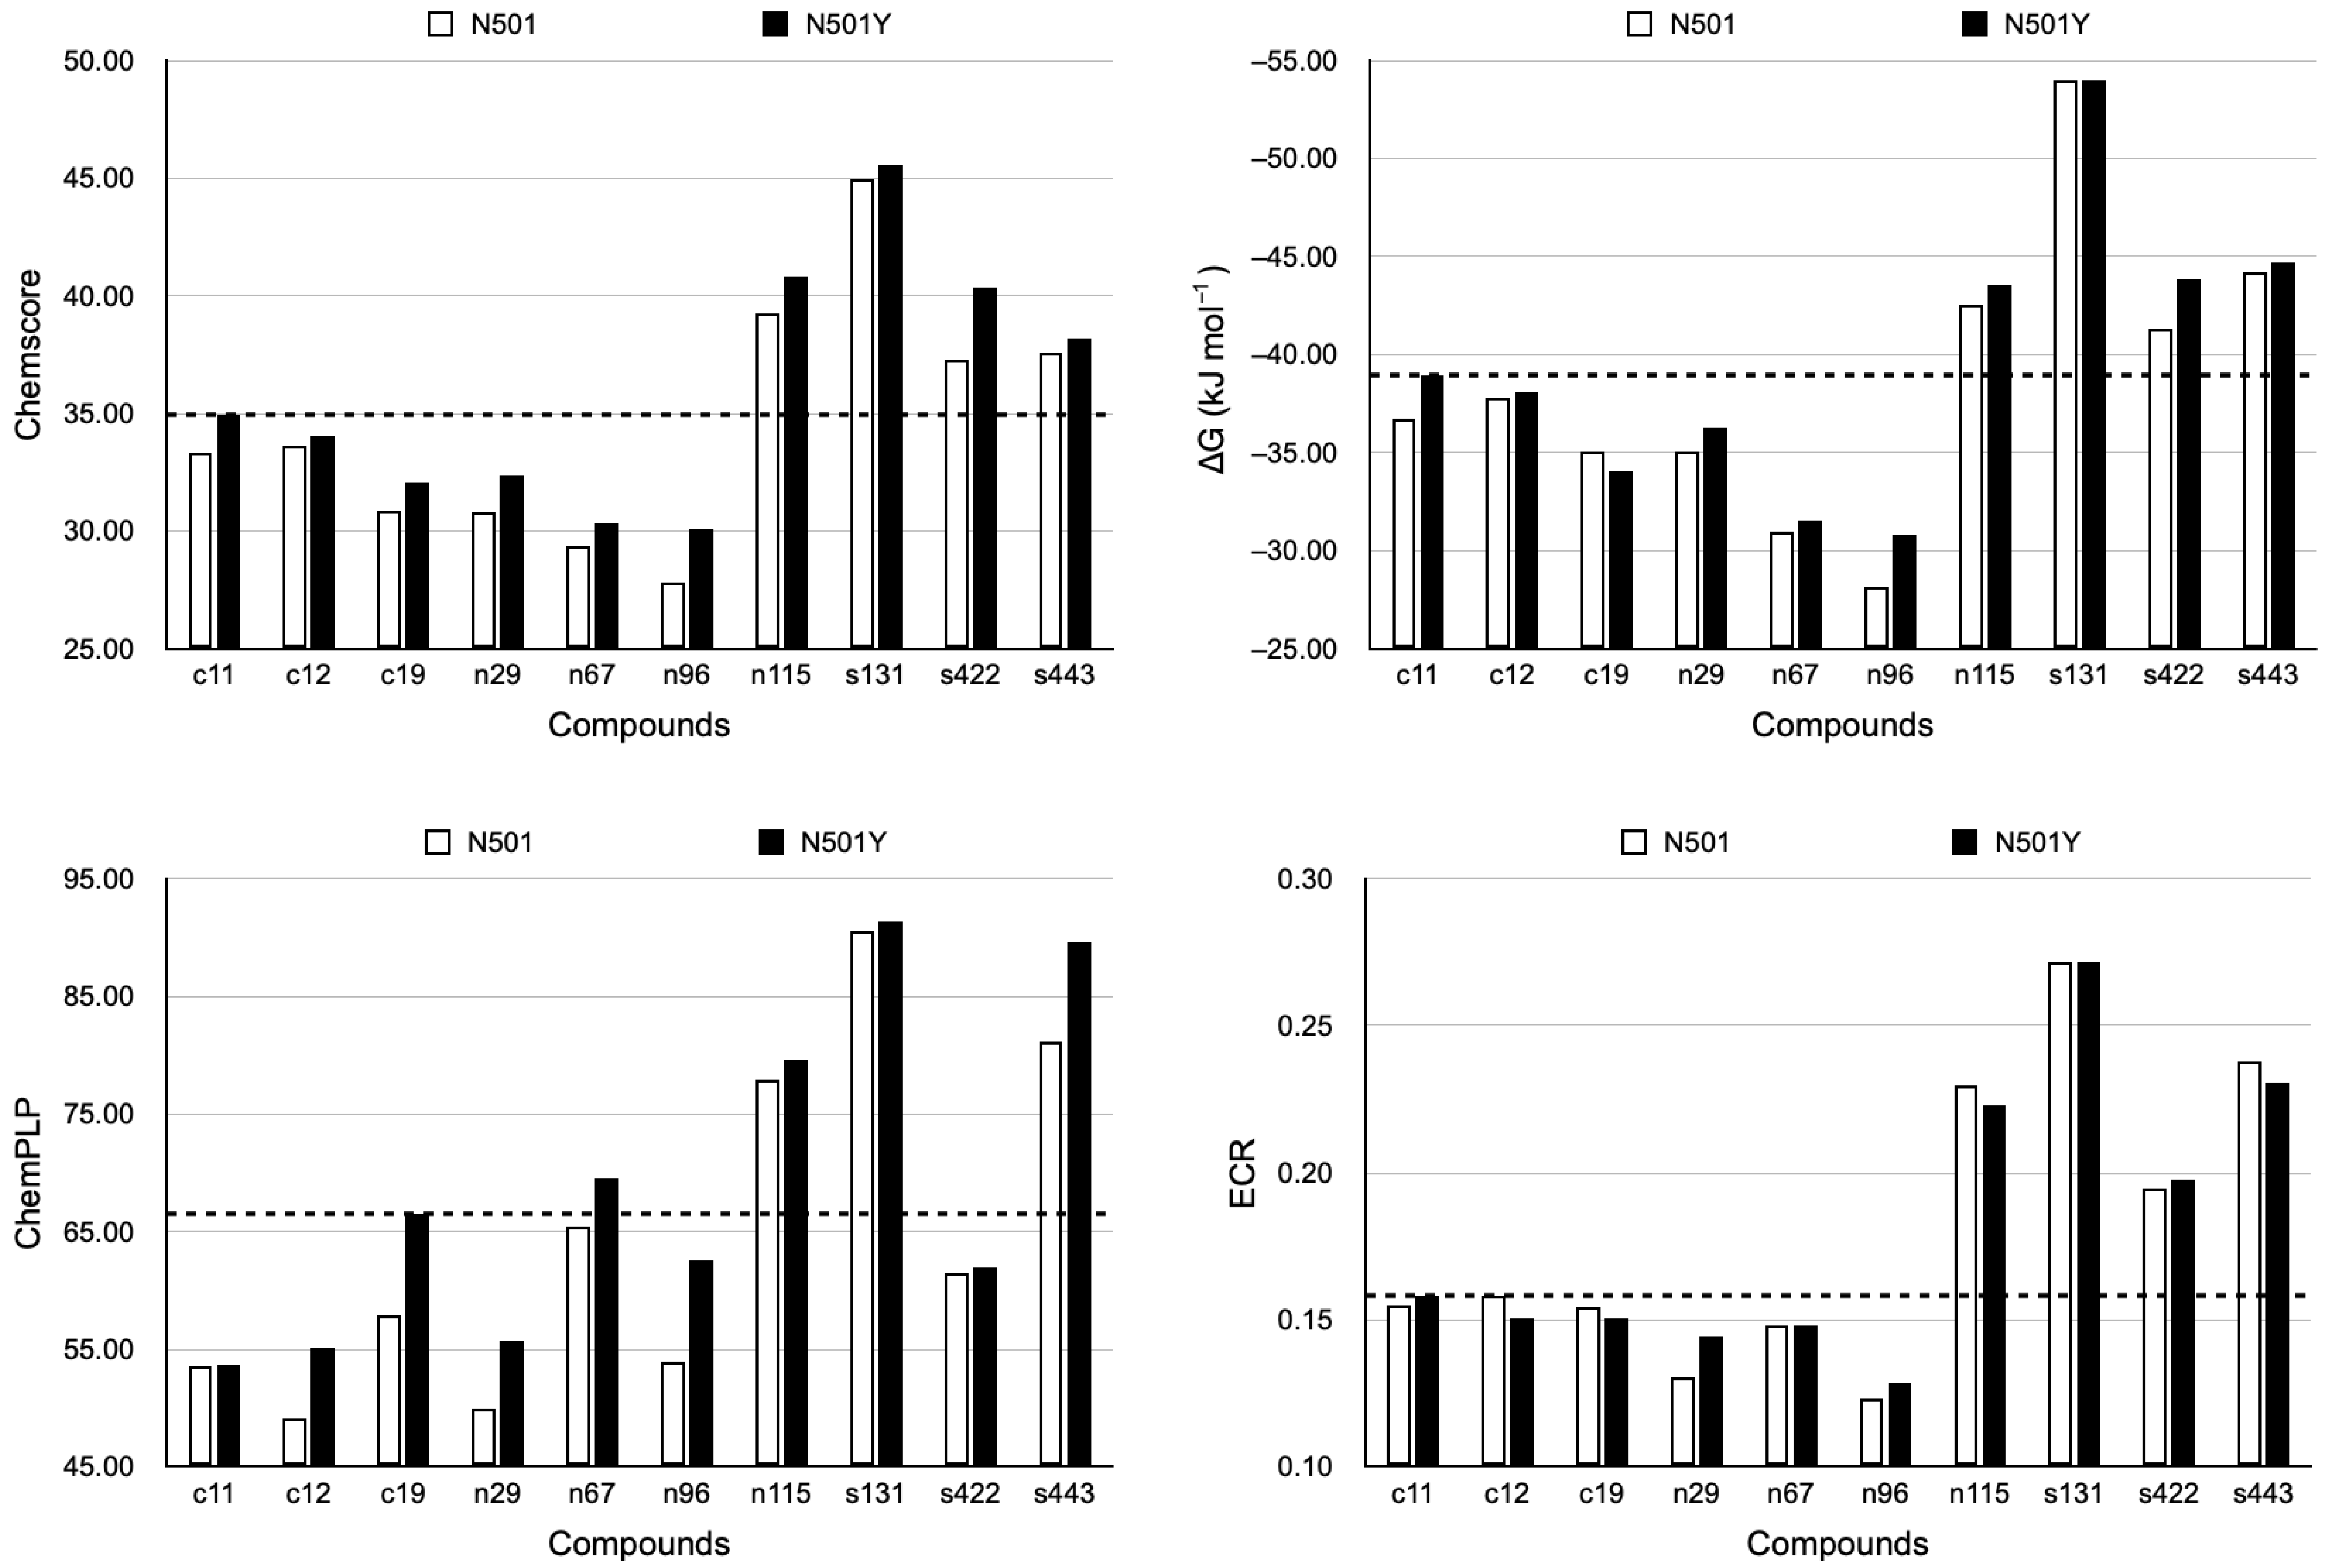
Figure 1. ROC curve of the docking results regarding positive and negative controls.
Ddc 02 00022 g001
Figure 2. The 10 hit molecules selected in this study. Their IUPAC or common names (when applicable) can be found in Table S7.
Ddc 02 00022 g002
Figure 3. Final Chemscore, ΔG, and ChemPLP values, and ECRs. Here, σ = 10 (see Section 3) for all ECR calculations since ten molecules were considered. Consequently, the ECRs were directly compared. When comparing N501 and N501Y results, p values for Chemscore, ΔG, ChemPLP, and ECRs of the ten hits were 0.00296, 0.0162, 0.00296, and 0.688, respectively (Wilcoxon paired one-sided test). N501 and N501Y ECR divergences were already expected to not be significant, as explained previously. The dotted line indicates the best performance of the controls as a threshold for validating the best-classified hits.
Ddc 02 00022 g003
Figure 4. Comparisons of coenzyme Q10 at N501 and N501Y RBD-containing structures. (ad) PLIP tables with hydrophobic contacts and H bonds on 6M17 N501 RBD-ACE2, 6XE1 N501 RBD, 6M17 N501Y RBD-ACE2, and 6XE1 N501Y RBD interacting with coenzyme Q10, respectively. Green indicates hydrophobic interactions; dotted lines = hydrogen bonds. (eh) Respective PyMOL’s 3D depictions. (i) Two-dimensional depiction of coenzyme Q10.
Ddc 02 00022 g004
Figure 5. Comparisons of 1-stearoyl-2-arachidonoylglycerol at N501 and N501Y RBD-containing structures. (ad) Two-dimensional diagrams of PoseView for 6M17 N501 RBD-ACE2, 7JMP N501 RBD, 6M17 N501Y RBD-ACE2, and 7JMP N501Y RBD interacting with 1-stearoyl-2-arachidonoylglycerol, respectively. Green indicates hydrophobic interactions; dotted lines = hydrogen bonds. (eh) Respective 3D representations obtained from PyMOL.
Ddc 02 00022 g005
Figure 6. Comparisons of palmitone at N501 and N501Y RBD-containing structures. (ad) Two-dimensional diagrams made in Poseview for 6M17 N501 RBD-ACE2, 7JMP N501 RBD, 6M17 N501Y RBD-ACE2, and 7JMP N501Y RBD interacting with palmitone, respectively. Green indicates hydrophobic interactions; dotted lines = hydrogen bonds. (eh) Respective 3D representations obtained from PyMOL.
Ddc 02 00022 g006
Figure 7. Heatmap obtained from admetSAR 2.0 for the top ECR-ranked molecules. The x-axis represents the best ECR-ranked compounds; the y-axis represents ADMET properties from admetSAR 2.0, assessing how likely either the presence (+) or absence (−) of a property is for the analyzed compound, according to the color bar. For instance, hepatotoxicity (−) assesses if a compound is not hepatotoxic; in case the result is negative for hepatotoxicity, a corresponding color ranging over 0 to 1 in the color bar is assigned to it; if positive, a color within the 0 to −1 range is shown.
Ddc 02 00022 g007
Figure 8. RMSD plots for the apo form (N501, not mutated) of the RBD target (black) and RBD–ligand complexes (red). (A) RMSD values of RBD bound to palmitone and the apo form of RBD. (B) RMSD values of RBD bound to 1-stearoyl-2-arachidonoylglycerol and the apo form of RBD. (C) RMSD values of RBD bound to coenzyme Q10 and the apo form of RBD.
Ddc 02 00022 g008
Figure 9. RMSD plots for the apo form (Y501, mutated) of the RBD target (black) and the RBD–ligand complexes (red). Each plot represents the RMSD values of mutated RBD bound to palmitone (A), 1-stearoyl-2-arachidonoylglycerol (B) or coenzyme Q10 (C). In addition, each plot displays the results for the RBD in apo form.
Ddc 02 00022 g009
Figure 10. RMSF plots for the apo form (N501, not mutated) of the RBD target (black) and RBD–ligand complexes (red). It is worth mentioning that the Amber program renumbers residues, such as N501 in the RMSF plot, corresponding to residue 164. The plot shows that N501 and other important residues, such as Gly496 (159) and Tyr505 (168), do not show the most considerable fluctuations, suggesting that main residues are maintained at the binding site. Regarding RBD bound to s131 or n115, the major residues are also not among the most considerable fluctuations. The plots show greater mobility of the residues in the structures bound to a ligand (palmitone (A), stearoyl-2-arachidonoylglycerol (B) and coenzyme Q10 (C)). Essential information for the RBD bound to s131 is that the numbering of the residues is different because the system was simulated from another PDB file, as shown previously. Hence, N501 corresponds to residue 176.
Ddc 02 00022 g010
Figure 11. RMSF plots for the apo form (Y501, mutated) of the RBD target (black) and RBD–ligand complexes (red). As mentioned in Figure 10, the corresponding numberings for the Y501 RBDs are the same as for N501 RBDs. Such numbers in the charts correspond to protein residues. Each chart shows the RMSF values of RBD (not mutated) bound to palmitone (A), 1-stearoyl-2-arachidonoylglycerol (B) or coenzyme Q10 (C). In addition, each plot displays the results for the RBD in apo form.
Ddc 02 00022 g011
Figure 12. RMSD plots for the top three hits concerning the N501 (non-mutated) RBDs. The RMSD plots of the ligands only (palmitone (A), stearoyl-2-arachidonoylglycerol (B) and coenzyme Q10 (C)), during molecular dynamics simulations with non-mutated RBDs. The relatively high RMSD values during trajectories are related to ligand flexibility. In the last 50 ns of the trajectories, coenzyme Q10 and palmitone in complex with non-mutated RBDs presented higher RMSD values than the ligands in mutated RBDs (Figure 13).
Ddc 02 00022 g012
Figure 13. RMSD plots for the top three hits concerning the Y501 (mutated) RBDs. The RMSD plots of the ligands only (palmitone (A), stearoyl-2-arachidonoylglycerol (B) and coenzyme Q10 (C)), during molecular dynamics simulations with mutated RBDs. Similarly to the previous figure, the considerably high RMSD values are related to ligand flexibility.
Ddc 02 00022 g013
Figure 14. Energy decomposition plots by amino acid residues for the N501 and Y501 RBD–ligand complexes under study. (ac) N501 RBD with n115, s131, and s443, respectively; (df) Y501 RBD with n115, s131, and s443, respectively.
Ddc 02 00022 g014
Figure 15. RBD-containing structures of the SARS-CoV-2 spike protein. For identification purposes in this study, wild-type (N501) and mutated (N501Y) RBD-containing structures have a PDB ID and color assigned to their representation. Bright colors represent N501 RBD-containing structures (6M17 N501 RBD-ACE2 complex, 6M17, 6XE1, and 7JMP N501 RBDs); light colors represent N501Y RBD-containing structures (6M17 N501Y RBD-ACE2 complex, 6M17, 6XE1 and 7JMP RBDs).
Ddc 02 00022 g015
Figure 16. “Wide” and “specific” regions on SARS-CoV-2 RBD defined for docking simulations. (a) Wide and (b) specific regions (for simplicity, only 6M17 RBD is displayed). (c) Wide region overview of aligned 6M17, 6XE1, and 7JMP N501 and (d) N501Y RBDs. The target residues considered in the docking simulations are labeled in the figure for each region.
Ddc 02 00022 g016
Table 1. Three best-ranked compounds in the wide region according to compound sets (control, natural, and synthetic ones) and RBD version (N501 or N501Y). The number of molecules in each set (σ) = 24, 124, and 489 molecules in control, natural and synthetic sets. Since each group had a different σ value for ranking its compounds, the larger the σ, the smaller the ECR score—therefore, in this step, the ECR values were not directly compared among sets but within them (see Section 3). Underlined ligands were the ones classified in the top three.
RBDLigandControlNaturalSynthetic
1st2nd3rd1st2nd3rd1st2nd3rd
N501Indexc19c12c11n115n67n29s131s443s422
ECR0.1070.1040.09730.02400.02340.02310.006120.006090.00606
Chemscore30.1031.8731.9637.2127.2329.5838.6733.3836.49
ΔG
[kJ mol−1]
−33.24−34.45−35.26−39.71−28.81−33.64−44.46−39.35−40.69
ChemPLP55.5343.7733.3270.8359.5848.5667.9566.4556.45
N501YIndexc11c19c12n115n29n96s131s443s422
ECR0.07470.06170.06120.02400.02320.02290.006120.006090.00608
Chemscore33.6831.0432.5238.0731.4329.0343.1236.7036.77
ΔG
[kJ mol−1]
−37.59−32.77−35.66−40.44−33.36−29.79−48.71−42.65−40.06
ChemPLP57.0959.5251.5173.8954.8158.5995.0982.1062.77
Table 2. Values of binding free energy (ΔG) obtained for RBDs (PDBs 7JMP and 6XE1) with n115, s131, and s443 (values in kcal/mol). The most stable sub-trajectories (150 ns out of 200 ns) were selected for the RBD–ligand complexes under study.
Ligand + PDB StructureMM-GBSA
n115 + N501 7JMP−20.60
n115 + Y501 7JMP−21.10
s131 + N501 6XE1−24.34
s131 + Y501 6XE1−15.59
s443 + N501 7JMP−28.62
s443 + Y501 7JMP−29.45
Disclaimer/Publisher’s Note: The statements, opinions and data contained in all publications are solely those of the individual author(s) and contributor(s) and not of MDPI and/or the editor(s). MDPI and/or the editor(s) disclaim responsibility for any injury to people or property resulting from any ideas, methods, instructions or products referred to in the content.

