
Analysis of Cell–Cell Communication by Single-Nuclei RNA Sequencing Identifies AHR-Mediated Induction of NRG-ERBB Signaling


1
Institute for Integrative Toxicology, Michigan State University, East Lansing, MI 48824, USA
2
Department of Biochemistry and Molecular Biology, Michigan State University, East Lansing, MI 48824, USA
*
Author to whom correspondence should be addressed.
Receptors 2023, 2(2), 148-159; https://doi.org/10.3390/receptors2020009
Submission received: 24 January 2023
/
Revised: 28 March 2023
/
Accepted: 27 April 2023
/
Published: 11 May 2023
(This article belongs to the Special Issue Selected Papers from the AHR Symposium 2022)
Abstract
:Communication between cells is essential in maintaining homeostasis. The persistent disruption of cell–cell communication by environmental contaminants contributes to progressive disease and toxicity. In this study, single-nuclei RNA sequencing (snRNAseq) data was used to examine dose-dependent cell-specific changes in cell–cell communication associated with the development of liver pathologies following the persistent activation of the aryl hydrocarbon receptor (AHR) by 2,3,7,8-tetrachlorodibenzo-p-dioxin (TCDD). Published hepatic snRNAseq data from male mice gavaged with sesame-oil vehicle or TCDD every 4 days for 28 days was used to assess the AHR-mediated disruption of ligand–receptor interactions. Analysis identified that portal fibroblasts and liver sinusoidal endothelial cells contributed the most ligand–receptor pairs at doses < 0.3μg/kg TCDD. Doses ≥ 0.3 μg/kg TCDD increased the putative intercellular communication between hepatocytes and hepatic stellate cells. In control livers, interactions primarily consisted of protease-activated receptor (PAR) signaling. TCDD treatment increased the number of active signaling pathways. Within hepatocytes, neuregulin signaling was induced, activating the NRG1–ERBB4 ligand axis, consistent with AHR genomic enrichment at dioxin response elements in a published chromatin immunoprecipitation sequencing (ChIP-seq) dataset, which suggested a direct regulation. Collectively, the results suggest that the disruption of cell signaling may play a central role in TCDD-elicited liver pathologies.
1. Introduction
The persistent environmental contaminant 2,3,7,8-tetrachlorodibenzo-p-dioxin (TCDD) is a potent aryl hydrocarbon receptor (AHR) agonist linked to the development of metabolic disease [1,2,3,4,5,6]. In mice, TCDD induces the accumulation of hepatic lipids (steatosis) that dose- and time-dependently progresses to steatosis with inflammation (steatohepatitis) and fibrosis, mirroring aspects of the nonalcoholic-fatty-liver-disease (NAFLD) spectrum. NAFLD is estimated to affect more than 30% of the global population [7] and is a leading cause of liver transplantation [8]. Accumulating evidence suggests that exposure to environmental contaminants such as TCDD plays an underappreciated role in the increased incidence of metabolic disorders such as NAFLD [2,9,10,11].
The liver is a heterogenous tissue both in terms of cell-type composition and spatial organization. It relies on exogenous (e.g., oxygen and nutrient gradients) and endogenous gradients (e.g., Wnt/β-catenin pathway) to ensure proper organization and function [12,13]. In response to cell stress (e.g., oxidative stress) or injury (e.g., partial hepatectomy), diverse hepatic cell types initiate various endogenous ligand–receptor interactions to reestablish homeostasis. For example, the secretion of mitogens such as hepatocyte growth factor (HGF) and ligands of the epidermal growth factor receptor (EGFR) promote hepatocyte proliferation following partial hepatectomy in order to replace excised tissue [14]. Similarly, protease-activated receptors (PARs) that mediate the coagulation cascade release clotting factors not only in response to liver injuries but also for other damaged tissues [15,16]. Beyond maintaining a healthy liver function, cell–cell interactions play a key role in the development, progression, and resolution of hepatic damage.
Our previous dose-dependent evaluation of TCDD-elicited cell-specific and spatially resolved gene expression revealed a global loss of normal liver lobule organization and function. The loss of zonation was mediated by the disruption of Wnt/β-catenin signaling between liver sinusoidal endothelial cells, hepatic stellate cells, and hepatocytes. To further investigate the effect of hepatic AHR activation by TCDD on the network of cell–cell communications, we used CellChat and leveraged published single-nuclei RNAseq data (snRNAseq) to infer cell–cell endogenous ligand–receptor interactions [17].
2. Materials and Methods
2.1. Dose-Response Single-Nuclei RNAseq Dataset
CellChat was used to infer cell–cell interactions in response to the dose-dependent exposure to TCDD [17]. Published snRNAseq data deposited in the Gene Expression Omnibus (GSE184506) and Broad Single Cell Portal (SCP1871) were used for the inference of endogenous ligand–receptor interactions. In short, snRNAseq data were obtained from male mice gavaged with 0.1 mL sesame-oil vehicle, 0.01, 0.03, 0.1, 0.3, 1, 3, 10, or 30 μg/kg TCDD every 4 days for 28 days. The dose range was selected as previously used to capture the spectrum of hepatic pathologies from steatosis to fibrosis without eliciting overt toxicity [3,18]. Oral gavage every 4 days was chosen, as it has been shown to approximate near-steady-state levels and considers the much shorter half-life in mice compared to humans [3]. The vehicle control group does not show any hepatic alterations. Only data from male mice were used, as it is the only data available. Furthermore, males are more sensitive than females to TCDD-elicited hepatotoxicities [5]. Livers from 3 mice per treatment group were frozen and stored at −80 °C until nuclei were isolated, as previously described (https://doi.org/10.17504/protocols.io.3fkgjkw, last accessed on 28 April 2023). Libraries were prepared using the 10X Genomics Single Cell 3′ v3 kit and sequenced (150 bp paired-end) at a depth of ~50,000 reads/cell. Following quality control, reads were aligned to the mouse reference genome (mm10 release 93) including both introns and exons. Initial QC led to the exclusion of 3 samples (doses 0.01, 0.03, and 3 μg/kg TCDD) due to elevated ambient RNA, as previously indicated for a total of 24 samples [19]. A breakdown of the dataset characterization is deposited in Data Dryad (https://doi.org/10.5061/dryad.547d7wmc5, last accessed on 28 April 2023). Integration, clustering, and annotation were performed using Seurat v4.0.5 [20]. Nuclei were used to minimize the cell population bias that could be introduced during single-cell isolation. Biases in RNA composition between whole-cell and single-nuclei experiments in the liver have been previously examined [21]. A published analysis has shown that all major known liver cell types using well-characterized markers were identified [19].
2.2. Cell–Cell Interaction and Functional Enrichment Analyses
The inference of cell–cell interactions was assessed at each dose group independently. Analysis of interactions was restricted to the mouse database for “Secreted Signaling” composed of 1209 ligand–receptor interactions. Normalized data and cell-type annotations were obtained from the original publications [19,22]. CellChat infers cell–cell communication using a database of known ligand–receptor pairs and mediator molecules to identify quantitative probabilities based on gene expression and mass action [17]. Functional enrichment analysis for the KEGG ERBB signaling pathway (mmu04012) was performed using ssGSEA and the GSEApy package [23] in Python 3.9. In short, genes for each cell in normalized expression data were ranked, and a normalized enrichment score was calculated. Analysis and visualization of CellChat results were performed using R v1.4.2, and the code is available for reproducibility (https://github.com/zacharewskilab/publication_analyses/tree/main/Analyses/CellChat_SCP1871, last accessed on 28 April 2023).
2.3. ChIP-seq, pDRE, and Spatial Transcriptomic Data
A summary of published datasets used in this study is outlined in Table 1. In addition to snRNAseq data, published ChIP-seq data (GSE97634) from male mice 2 h following gavage with 30 μg/kg TCDD [24] was visualized using the UCSC Genome Browser (https://genome.ucsc.edu/, last accessed on 28 April 2023) using deposited tracks (https://doi.org/10.7910/DVN/O1P0X3, last accessed on 28 April 2023). Putative dioxin response elements (pDREs) containing a core 5′-GCGTG-3′ were identified, as previously described [25], and can be obtained from the Harvard Dataverse (https://doi.org/10.7910/DVN/JASCVZ, last accessed 28 on April 2023). Spatial transcriptomic data using the Resolve Molecular Cartography platform, using samples from the same animals for the snRNAseq study, can be obtained from the Gene Expression Omnibus (GSE206294) and the Broad Single Cell Portal (SCP1875).
3. Results
3.1. AHR Activation by TCDD Increases the Number of Cell–Cell Interaction
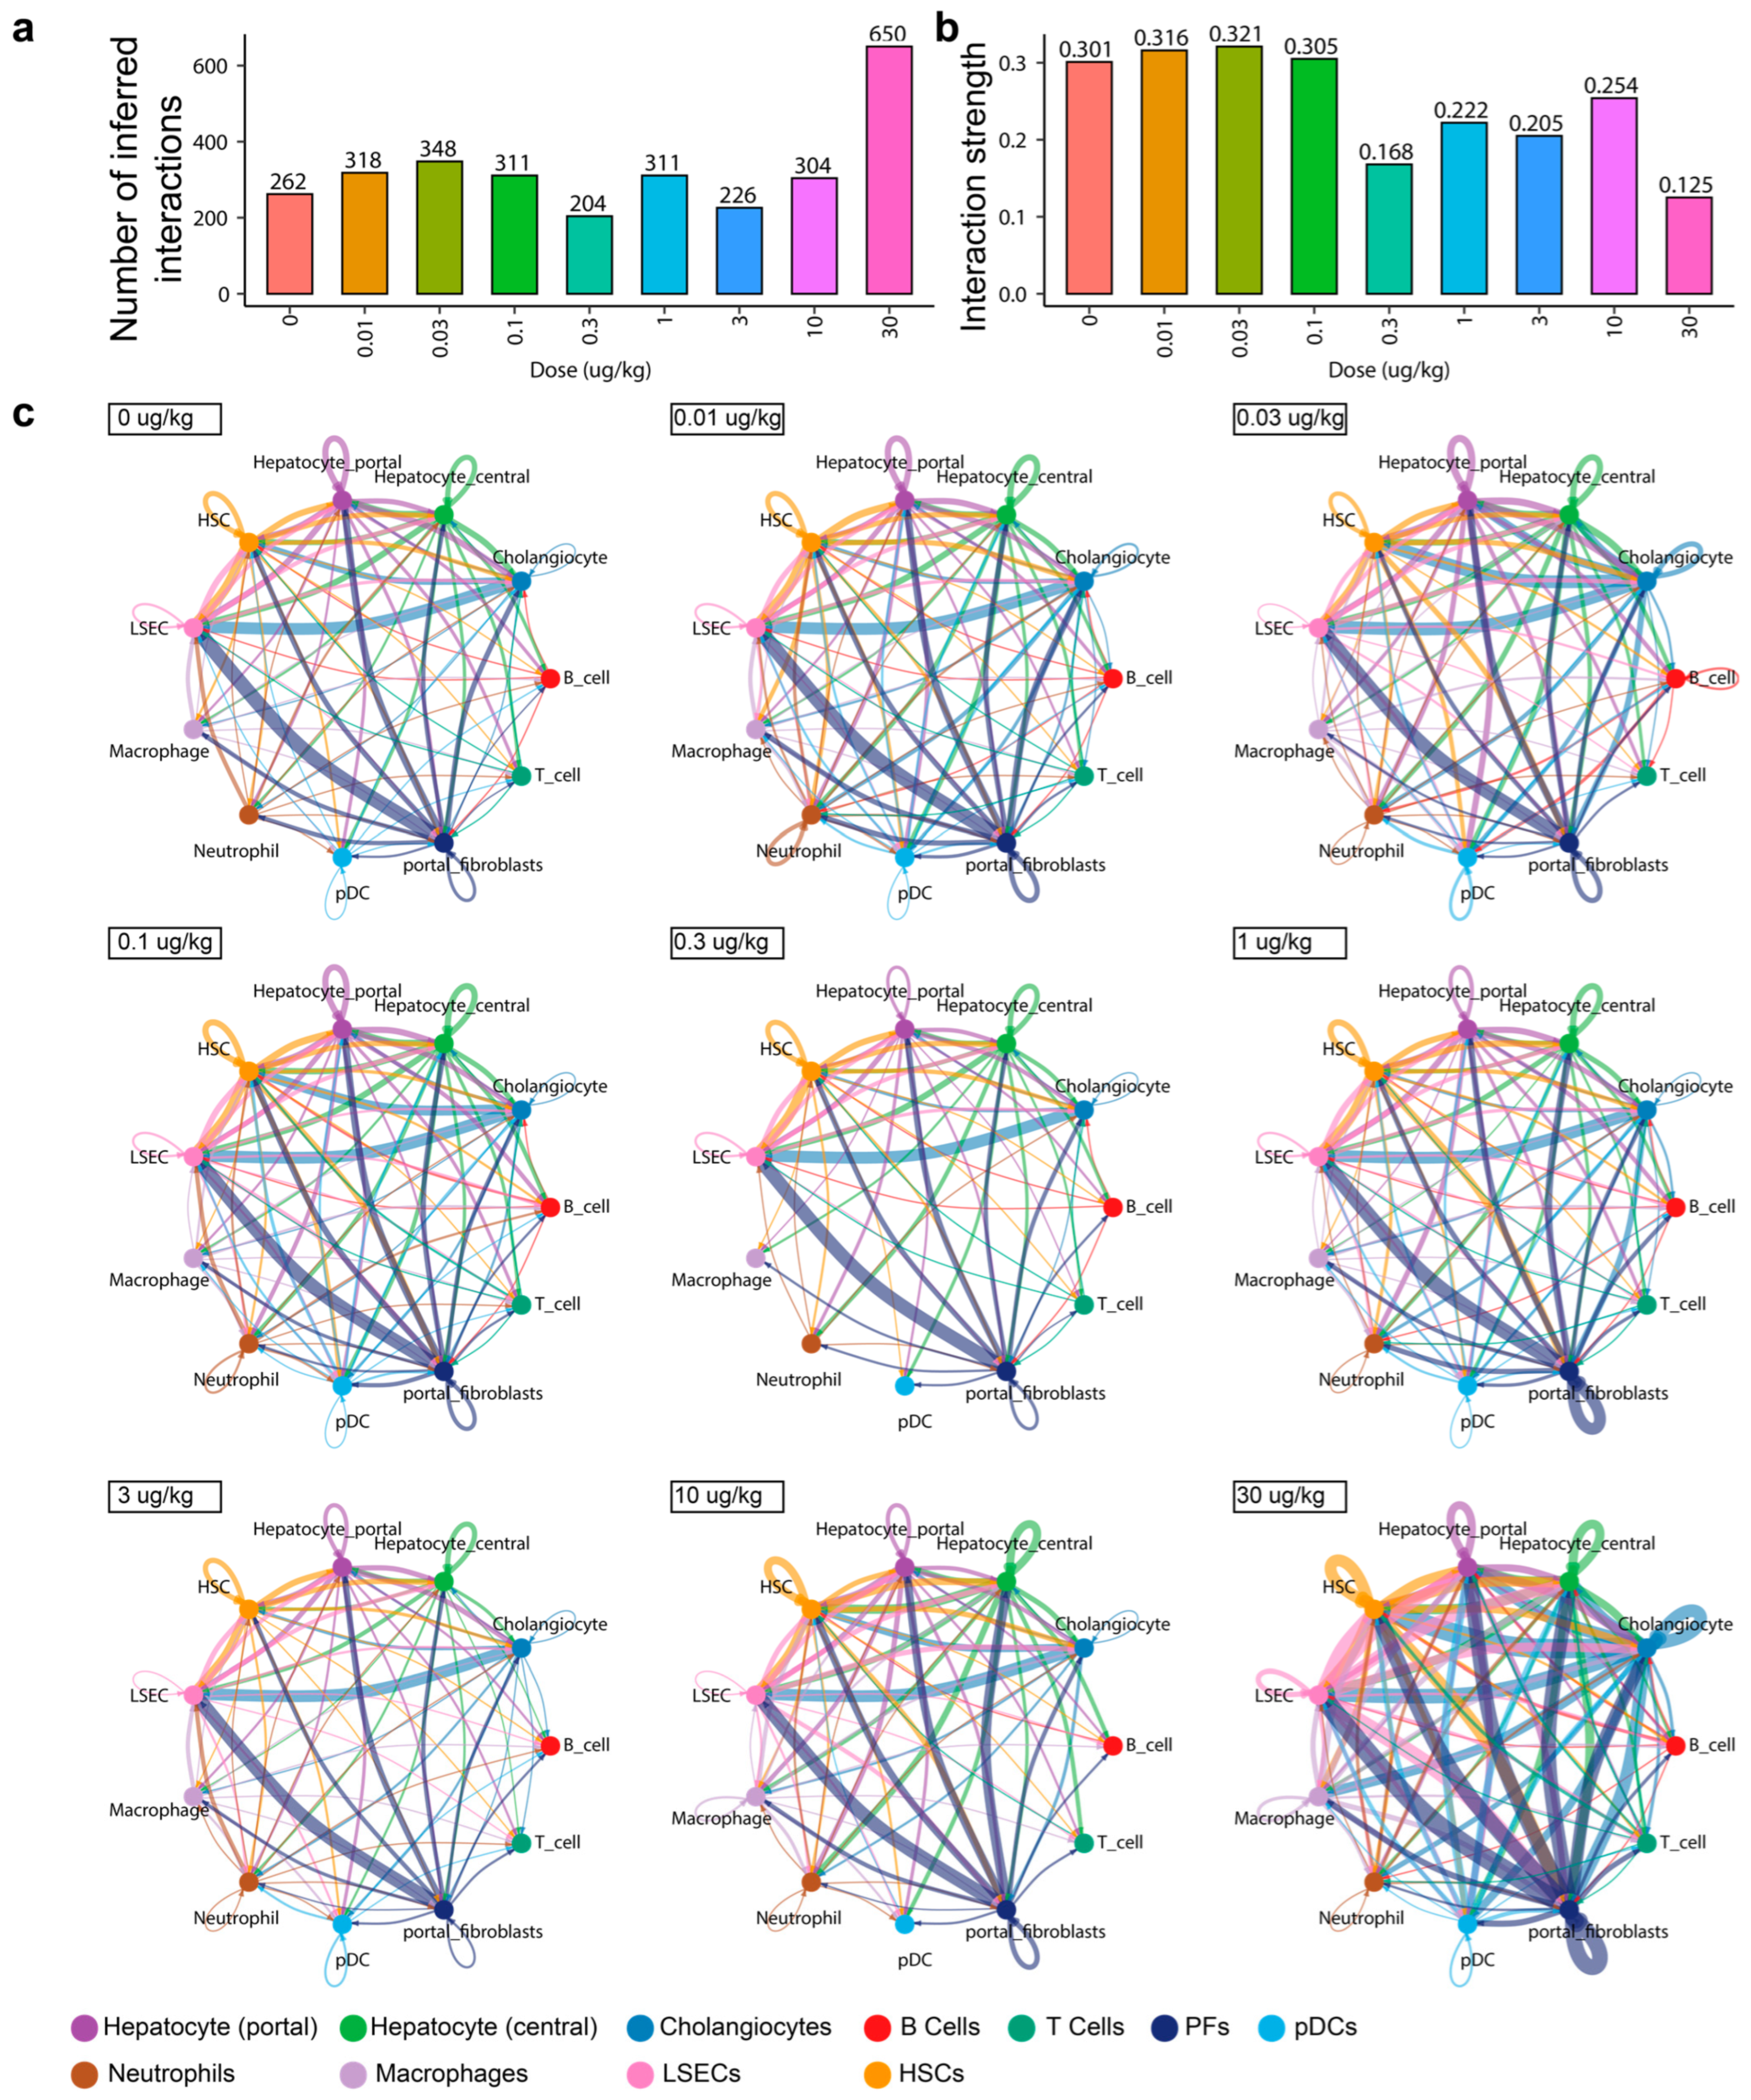
To examine the effects of AHR activation by TCDD on cell–cell ligand–receptor interactions, the number and strength of inferred pair interactions was determined from published hepatic dose-response snRNAseq datasets (GSE184506, SCP1871) using CellChat [17] (Figure 1). The total number of inferred interactions (~300) was consistent across dosage groups, with a total of 650 active ligand–receptor pair interactions at 30 μg/kg TCDD (Figure 1a). Using the same experimental design, the histological assessment reported the dose-dependent occurrence of hepatocyte hypertrophy, inflammation, fibrosis, and bile-duct proliferation and was consistent with widespread changes in cell communication. The strength of inferred ligand–receptor pairs, a measure of significance (higher values denote stronger interactions), was based on the expression level of ligands, mediators, and receptors, which decreased at doses ≥0.3 μg/kg TCDD (Figure 1b). This likely reflects a greater diversity in active signaling pathways and ligand–receptor pairs that may have multiple binding partners.
The examination of interactions between cell types showed that the number of outgoing interactions was primarily driven by portal fibroblasts and cholangiocytes, while liver sinusoidal endothelial cells appeared to be the receiving (target) cell type for the largest number of interactions, followed by hepatic stellate cells and hepatocytes (Figure 1c and Figure S1). At 30 μg/kg TCDD, portal fibroblasts and cholangiocytes continued to be among the cell types with the most outgoing signals, while hepatocytes (both central and portal), hepatic stellate cells, and macrophages exhibited increased ligand expression (Figure 1c—see arrowheads, Figure S1). Similarly, liver sinusoidal endothelial cells and cholangiocytes were the top receiving cell types, although the total number of incoming interactions increased across all cell types except B cells and T cells (Figure 1c and Figure S1).
3.2. AHR Dysregulation of Cell–Cell Interactions Increases Weak Signaling
The relative strength of inferred signaling pathways was examined across all cell types (Figure 2, Figure S2 and Figure S3). The contribution of each identified signaling pathway in lower dose groups (<0.3 μg/kg) suggested that the signaling activity was similar and consisted primarily of ligand–receptor pairs involved in protease-activated-receptor (PAR) and growth-factor (e.g., epidermal growth factor [EGF]; hepatocyte growth factor [HGF]) signaling (Figure 2a). These interactions were limited to hepatocytes for both incoming and outgoing signals. The major PAR ligand–receptor pairs were plasminogen (Plg) and prothrombin (aka coagulation factor II; F2) (Figure S4). Plg and F2 serve important roles in the regulation of hemostasis [15,16]. Likewise, growth factors such as HGF support hepatic cell growth and liver homeostasis [26]. Accordingly, growth-factor signaling pathways were primarily active in hepatocytes, particularly portal hepatocytes, though hepatic stellate cells were primarily responsible for outgoing HGF signals. Hepatic stellate cells also express outgoing signals, specifically bone morphogenic protein (BMP), class-3 semaphorins (SEMA3), and angiopoietin (ANGPT), which were received by liver sinusoidal endothelial cells (Figure 2b).
At 0.3–10 μg/kg TCDD, portal hepatocytes exhibited greater outgoing and incoming interaction strengths (Figure S2). The responsiveness of portal hepatocytes agrees with portal hepatocytes showing a greater sensitivity to AHR activation following TCDD treatment [19,21]. At 30 μg/kg TCDD, other signaling pathways emerge, such as transforming growth factor β (TGF-β), nicotinamide phosphoribosyltransferase (NAMPT aka VISFATIN), protein S (PROS), colony-stimulating factor (CSF), and BRADYKININ, as well as others implicated in inflammation (e.g., IL1, GALECTIN), cell proliferation (e.g., KIT, SEMA3), and metabolic dysregulation (e.g., NRG, ANGPTL) that show greater relative contributions (Figure 2a–c). Concomitantly, the relative contributions of the PARs, EGF, and HGF signaling pathways were reduced, consistent with the loss of hepatocyte identity and lobular zonation in treated mice [19,27]. Inferred signaling induced at 30 μg/kg TCDD primarily involved macrophages and liver sinusoidal endothelial cells (Figure 2c), suggesting that they play a key role in re-establishing homeostasis following AHR activation by TCDD.
3.3. Neuregulin-Erb-B2 Receptor Tyrosine Kinase Signaling by AHR Activation
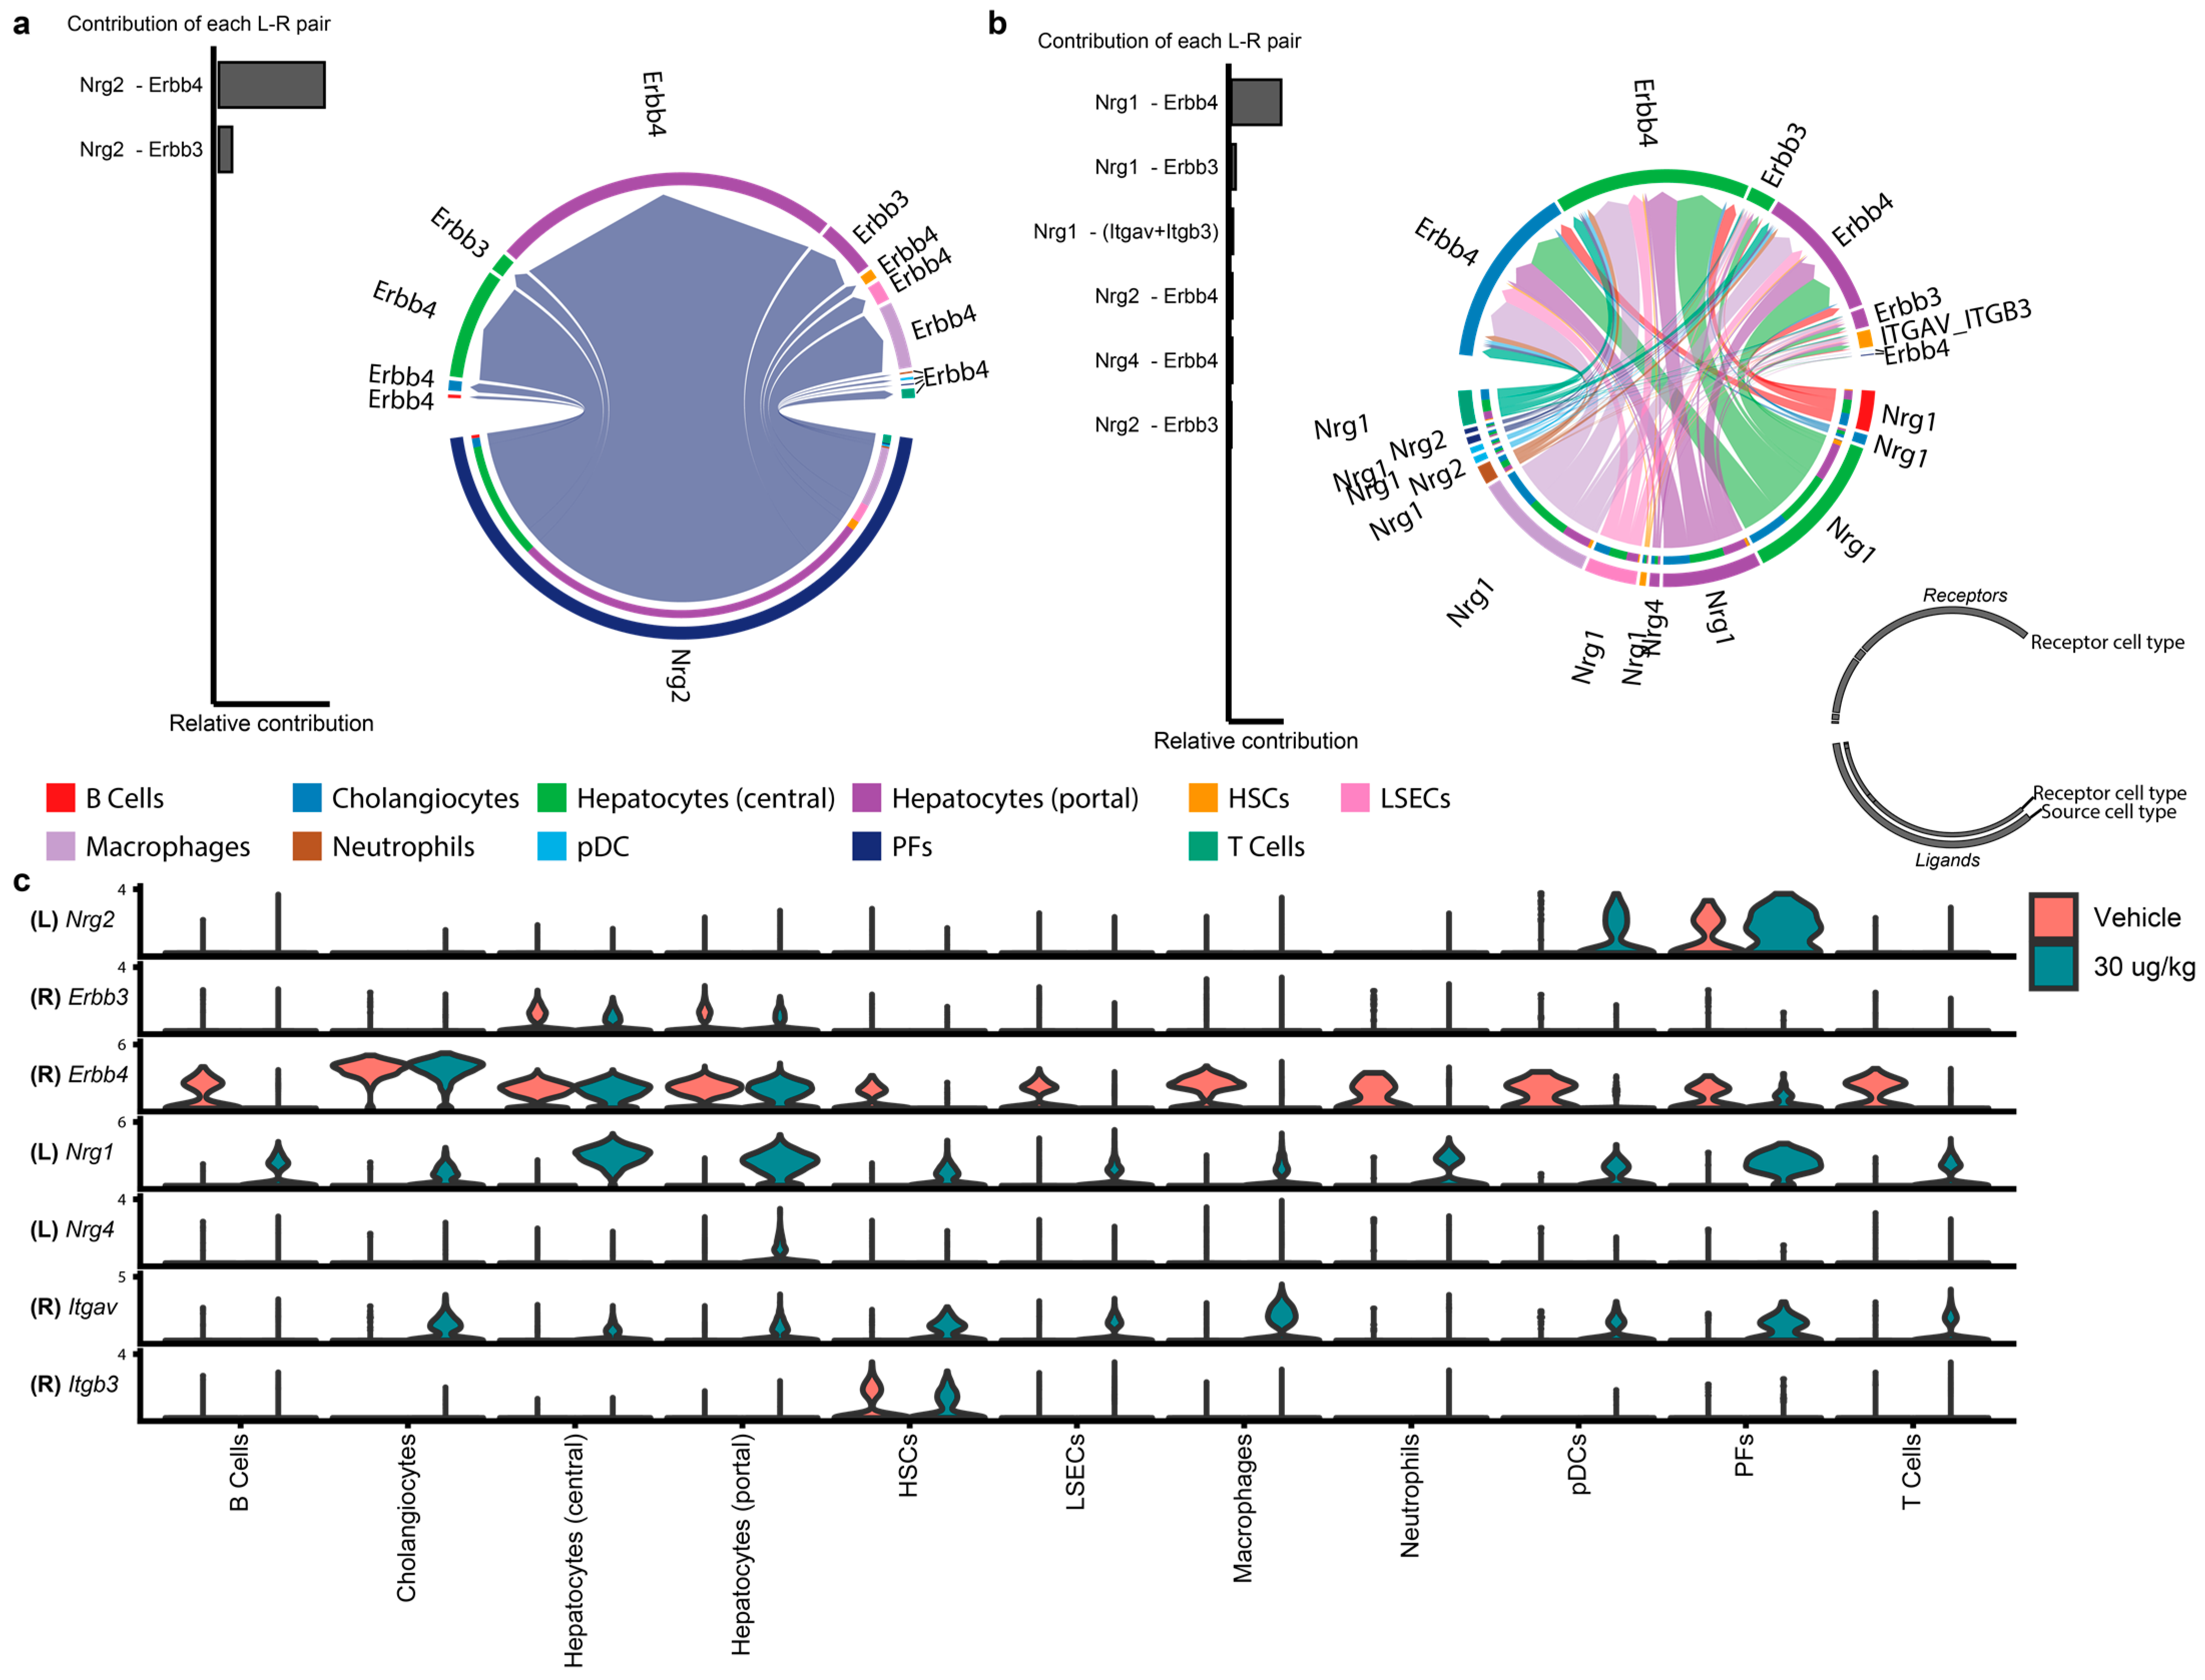
In contrast to the overall loss of growth-factor signaling (e.g., EGF, FGF) within hepatocyte-hepatocyte signaling following treatment, neuregulin (NRG)-related signaling increased within central and portal hepatocytes (Figure 3a–c). Nrg1 is a putative direct AHR target in Hepa1c1c7 (murine hepatoma) cells treated with B[a]P, BPDE, or TCDD [28]. Ahr and Nrg1 expression is also correlated in breast-cancer tissue [29]. Multiple putative DREs are present upstream and within the Nrg1 gene body that overlapped with AHR enrichment (Figure S5). Interestingly, exogenous NRG1-human IgG1 fusion protein (NRG1-fc) lowered blood glucose in obese mice [30], which may be linked to the improved glucose uptake in TCDD-treated mice exhibiting steatohepatitis [3].
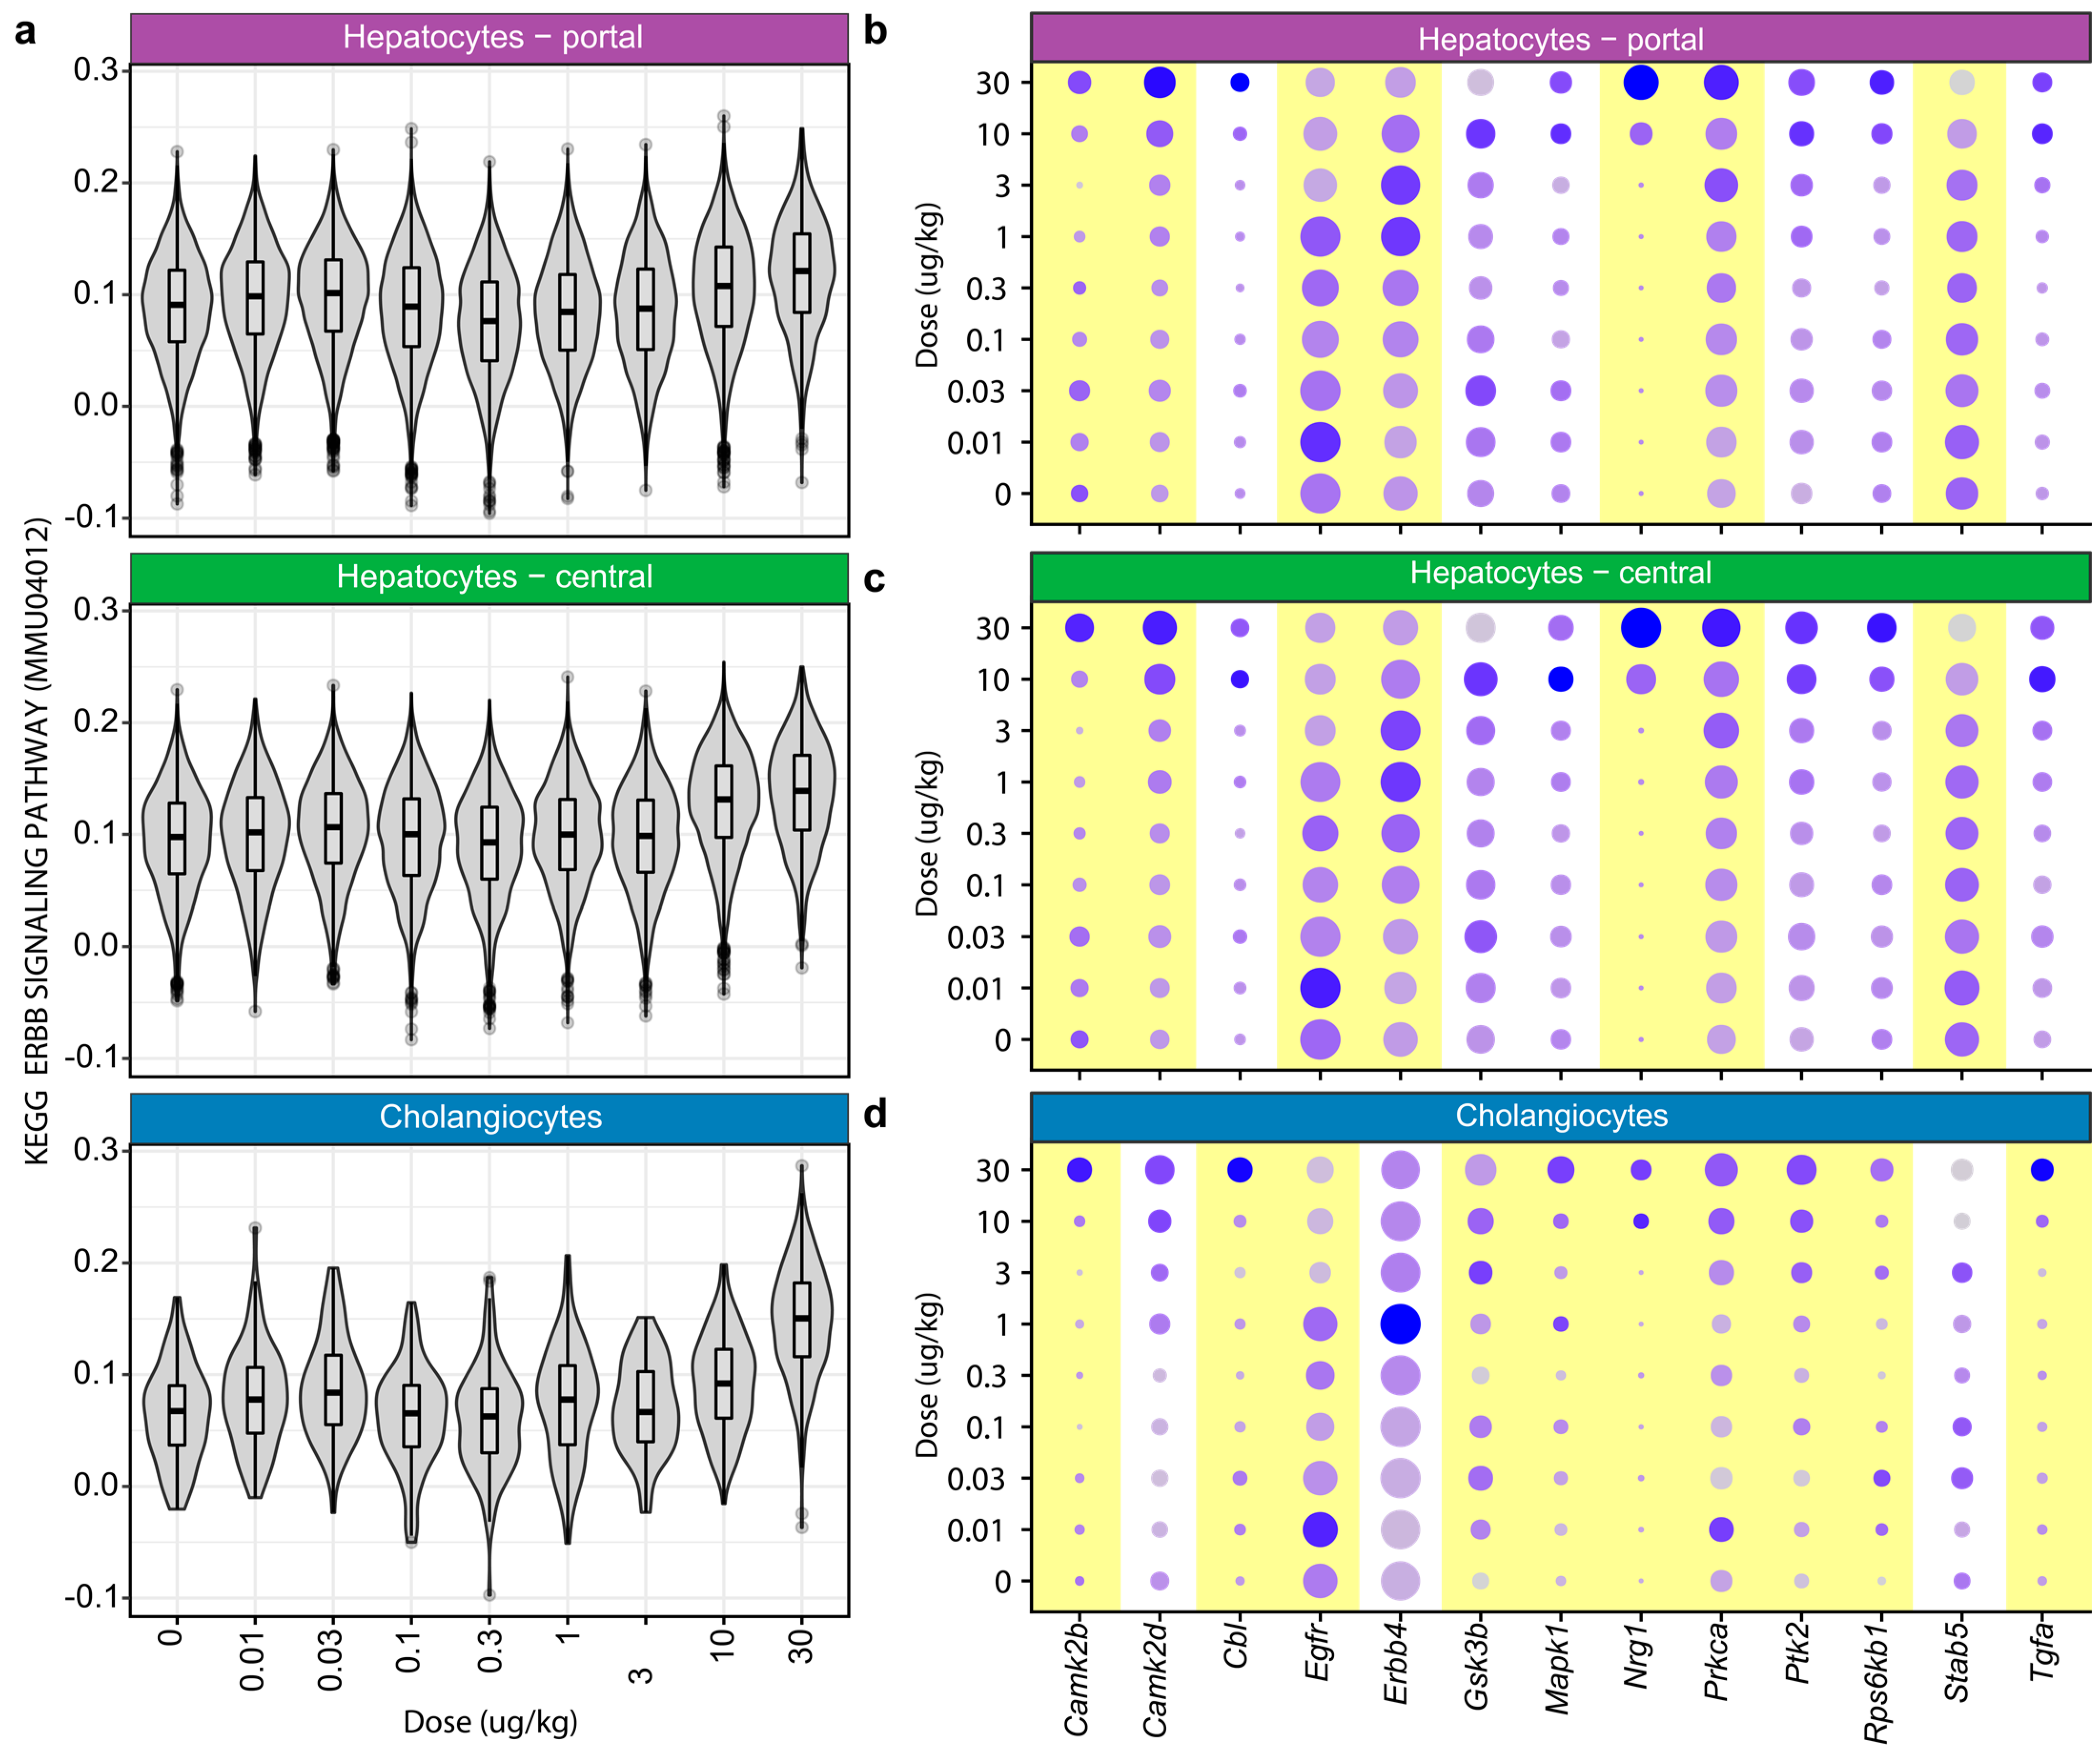
Functional analysis identified an increased enrichment of ERBB signaling (KEGG pathway mmu04012) across all cell types except neutrophils following TCDD treatment, including dose-dependent increases in cholangiocytes (Figure 4). Elevated ERBB4 is associated with cholangiocarcinoma and is consistent with the increased incidence in a two-year TCDD cancer rat study [31,32]. ERBB signaling cascade targets calmodulin (Camk2b/Camk2d; 1.5–2-fold) and protein kinase C alpha (Prkca; 1.5–2-fold), both implicated in various cellular functions from cell proliferation to cell death, were induced in hepatocytes and cholangiocytes. In cholangiocytes but not hepatocytes, the induction of ERBB signaling targets Cbl (1.6-fold), Gsk3b (1.6-fold), Mapk1 (1.6-fold), Ptk2 (1.7-fold), Rps6kb1 (1.5-fold), and Tgfa (1.6-fold) was observed. Notably, the induction of c-Cbl (Cbl), an E3 ubiquitin ligase, may indicate the marking of AHR for degradation [33]. Other differentially expressed genes represent intermediates in diverse signaling cascades, including the PI3K-Akt, mTOR, MAPK, and c-Src signaling pathways. Spatial transcriptomics confirmed that Nrg1 induction occurred primarily in hepatocytes within no specific zone (Figure S5).
4. Discussion
The liver is composed of diverse cell (sub)types working in concert using endocrine, paracrine, and autocrine signaling cues to maintain liver function and homeostasis. Liver disease and toxicity likely involve the persistent disruption of cell–cell communications leading to pathological phenotypes such as cholangiopathies and NAFLD [34]. Accumulating evidence suggests that there are links between environmental contaminant exposure and metabolic disorders, including type II diabetes and NAFLD [1,2]. AHR activation promotes the accumulation of hepatic lipids (steatosis), which can progress to steatohepatitis with fibrosis in a dose- and time-dependent manner [3,4,5,6]. A previous snRNAseq study identified and characterized dose-dependent and cell-specific responses in the AHR-mediated progression of steatosis to steatohepatitis with fibrosis following treatment with TCDD [3,4,5,6,19,35]. To further investigate disrupted cell signaling in AHR-mediated NAFLD development, hepatic-snRNAseq and spatial-transcriptomic data were examined to infer ligand–receptor interactions using CellChat [17].
Analysis of putative ligand–receptor interactions in vehicle control and low TCDD dose groups (<0.3 μg/kg) identified a larger number of cell–cell interactions in portal fibroblasts and liver sinusoidal endothelial cells. Liver sinusoidal endothelial cells form the sinusoidal permeable barrier where portal vein blood meets the nutrient- and oxygen-rich blood mix from the hepatic artery [36,37]. Similarly, portal fibroblasts located near the portal circulation maintain the integrity of the portal tract [38,39]. The proximity of liver sinusoidal endothelial cells and portal fibroblasts to the circulation is consistent with inferred active signaling pathways associated with the vascular system (VEGF/ANGPT/SEMA3) and cell proliferation (GAS/KIT). For hepatocytes, the most abundant cell type in the liver, the coagulation cascade represented by PARs (e.g., plasminogen, prothrombin) was most active. While the coagulation cascade is typically associated with liver injury, hepatocytes constitutively expressed these factors [15,16].
TCDD-elicited disruption of cell–cell communication is evident from weaker inferred interactions and the switch from central hepatocytes exhibiting the most significant communication roles to portal hepatocytes. Notably, lipid accumulation occurs periportally at ≥0.3 μg/kg TCDD using the exact same dosing regimen and model [5]. Analyses identified that PAR signaling decreased following TCDD exposure, causing the activation of the coagulation cascade and promoting fibrinogen deposition. We previously reported the PAR signaling member F2r (aka PAR-1) as a mediator of TCDD-elicited body-weight loss and inflammation [40], suggesting a putative negative feedback mechanism at higher doses. Other signaling pathways activated by TCDD involved macrophage. The proportion of macrophage increased ≥4-fold and included TGF-β and VISFATIN signaling, primarily communicating with liver sinusoidal endothelial cells. In contrast, little signaling was identified in B cells, T cells, and neutrophils, likely due to their low cell proportions (≤15% of liver cells) [19]. Interestingly, NAMPT (aka VISFATIN) has been hypothesized to play a role in liver sinusoidal endothelial cell fenestration, which contributes to liver injury and NAFLD pathogenesis, warranting further investigation into the effects of AHR activation on fenestration [41,42,43].
NRG-ERBB signaling was also disrupted, in agreement with previous reports of AHR-mediated induction of Nrg1 [29]. NRG1 has been proposed as a marker of AHR activation in mice in contaminated areas [44]. Moreover, it is an important regulator of hepatic metabolism, with recombinant protein (NRG1-fc) improving glucose tolerance, possibly due to the repression of phosphoenolpyruvate carboxy-kinase (Pck1) and glucose-6-phosphatase (G6pase) in mice [30]. There are also potential interactions between matrix-remodeling proteins, such as ADAM17 and TIMP3, with NRG1 and ERBB4, which also regulate SREBP2 activation [45]. In HepG2 cells, NRG1 impaired mitochondrial respiration and biogenesis [46]. AHR activation has been reported to improve glucose tolerance, repress gluconeogenesis, disrupt cholesterol metabolism, and compromise mitochondrial function [25,47,48,49,50]. Furthermore, NRG1 regulates skeletal-muscle metabolism, while persistent AHR activation has been linked to wasting syndrome [51].
Cell-signaling inferences suggested by CellChat assumed that ligand and receptor gene-expression levels corresponded to protein levels and activity. While this investigation did not examine the effects on protein levels or activity, previous studies reported that TCDD altered PAR and NRG signaling and protein levels in mice [40,44]. Another potential limitations may be the database for ligand–receptor interactions, which was derived from manually curated KEGG pathways [17] and does not consider putative aberrant signaling, tissue-specific signaling, or other types of signaling (e.g., steroids), and which is limited to paracrine/autocrine signaling, as both ligands and receptors must be expressed in the dataset. Moreover, datasets used in these analyses were obtained from single-nuclei datasets, which may include mature and pre-mRNA molecules and have shown biases for certain genes compared to single-cell datasets. Using the same methodology, we have shown that despite these biases, there is good consistency between snRNAseq and bulk RNAseq approaches [21].
5. Conclusions
Collectively, specific signaling pathways associated with known functional roles that involve communication between different cell types are disrupted by TCDD in the male mouse liver. In healthy livers, liver sinusoidal endothelial cells interact directly with nutrient-rich blood and communicate extensively with other hepatic cell types to maintain homeostasis and function. However, TCDD dose-dependently and persistently disrupts communications between cell types via diverse signaling pathways. Moreover, these disrupted interactions can be associated with TCDD-elicited hepatotoxicity and the progression of steatosis to steatohepatitis with fibrosis and bile-duct proliferation. Consequently, disrupted cell–cell communication between liver cell types warrants further investigation to elucidate potential roles in AHR-mediated hepatotoxicity and the progression of steatosis to steatohepatitis with fibrosis. These studies may lead to the identification of novel strategies to treat the progression of steatosis to steatohepatitis with fibrosis in human NAFLD.
Supplementary Materials
The following supporting information can be downloaded at: https://www.mdpi.com/article/10.3390/receptors2020009/s1, Figure S1: Number of incoming and outgoing inferred interactions across cell types following TCDD treatment; Figure S2: Incoming and outgoing interaction strength across cell types and TCDD doses; Figure S3: Changes in incoming and outgoing signaling across portal and central hepatocytes, liver sinusoidal endothelial cells, and macrophages; Figure S4: Contributions of individual PAR ligand–receptor pairs; Figure S5: Nrg1 induction by TCDD-mediated AHR activation [19].
Author Contributions
Conceptualization, R.N. and T.Z.; Data curation, R.N.; Formal analysis, R.N. and G.N.C.; Funding acquisition, T.Z.; Methodology, R.N. and G.N.C.; Software, R.N. and G.N.C.; Supervision, T.Z.; Visualization, R.N.; Writing—original draft, R.N.; Writing—review & editing, R.N., G.N.C. and T.Z. All authors have read and agreed to the published version of the manuscript.
Funding
This research was funded by the National Human Genome Research Institute (NHGRI R21HG010789) and the National Institute of Environmental Health and Science Superfund Research Program (NIEHS SRP P42ES04004911). T.Z. is supported by AgBioResearch at MSU. G.N.C. was supported by NIEHS Multidisciplinary Training in Environmental Toxicology (T32ES007255).
Institutional Review Board Statement
Not applicable.
Informed Consent Statement
Not applicable.
Data Availability Statement
Datasets used in this manuscript are all publicly available following the Findable, Accessible, Interoperable, Reusable (FAIR) data guiding principles. Single-nuclei RNAseq data were obtained from GEO (GSE184506) and SCP (SCP1871). ChIP-seq data were obtained from GEO (GSE97634) and genome browser tracks from Harvard Dataverse (doi.org/10.7910/DVN/O1P0X3, last accessed on 28 April 2023). Putative dioxin response elements were obtained from Harvard Dataverse (doi.org/10.7910/DVN/JASCVZ, last accessed on 28 April 2023). Spatial transcriptomic data is available from GEO (GSE206294) and SCP (SCP1875). Analysis code can be obtained on Github (https://github.com/zacharewskilab/publication_analyses/tree/main/Analyses/CellChat_SCP1871, last accessed on 28 April 2023).
Conflicts of Interest
The authors declare no conflict of interest. The funders had no role in the design of the study; in the collection, analyses, or interpretation of data; in the writing of the manuscript; or in the decision to publish the results.
References
- Kumar, J.; Lind, L.; Salihovic, S.; van Bavel, B.; Ingelsson, E.; Lind, P.M. Persistent organic pollutants and liver dysfunction biomarkers in a population-based human sample of men and women. Environ. Res. 2014, 134, 251–256. [Google Scholar] [CrossRef] [PubMed]
- Taylor, K.W.; Novak, R.F.; Anderson, H.A.; Birnbaum, L.S.; Blystone, C.; Devito, M.; Jacobs, D.; Kohrle, J.; Lee, D.H.; Rylander, L.; et al. Evaluation of the association between persistent organic pollutants (POPs) and diabetes in epidemiological studies: A national toxicology program workshop review. Environ. Health Perspect. 2013, 121, 774–783. [Google Scholar] [CrossRef]
- Nault, R.; Fader, K.A.; Ammendolia, D.A.; Dornbos, P.; Potter, D.; Sharratt, B.; Kumagai, K.; Harkema, J.R.; Lunt, S.Y.; Matthews, J.; et al. Dose-Dependent Metabolic Reprogramming and Differential Gene Expression in TCDD-Elicited Hepatic Fibrosis. Toxicol. Sci. 2016, 154, 253–266. [Google Scholar] [CrossRef] [PubMed]
- Nault, R.; Colbry, D.; Brandenberger, C.; Harkema, J.R.; Zacharewski, T.R. Development of a computational high-throughput tool for the quantitative examination of dose-dependent histological features. Toxicol. Pathol. 2015, 43, 366–375. [Google Scholar] [CrossRef] [PubMed]
- Fader, K.A.; Nault, R.; Zhang, C.; Kumagai, K.; Harkema, J.R.; Zacharewski, T.R. 2,3,7,8-Tetrachlorodibenzo-p-dioxin (TCDD)-elicited effects on bile acid homeostasis: Alterations in biosynthesis, enterohepatic circulation, and microbial metabolism. Sci. Rep. 2017, 7, 5921. [Google Scholar] [CrossRef]
- Pierre, S.; Chevallier, A.; Teixeira-Clerc, F.; Ambolet-Camoit, A.; Bui, L.C.; Bats, A.S.; Fournet, J.C.; Fernandez-Salguero, P.; Aggerbeck, M.; Lotersztajn, S.; et al. Aryl hydrocarbon receptor-dependent induction of liver fibrosis by dioxin. Toxicol. Sci. 2014, 137, 114–124. [Google Scholar] [CrossRef]
- Riazi, K.; Azhari, H.; Charette, J.H.; Underwood, F.E.; King, J.A.; Afshar, E.E.; Swain, M.G.; Congly, S.E.; Kaplan, G.G.; Shaheen, A.A. The prevalence and incidence of NAFLD worldwide: A systematic review and meta-analysis. Lancet Gastroenterol. Hepatol. 2022, 7, 851–861. [Google Scholar] [CrossRef]
- Wong, R.J.; Aguilar, M.; Cheung, R.; Perumpail, R.B.; Harrison, S.A.; Younossi, Z.M.; Ahmed, A. Nonalcoholic steatohepatitis is the second leading etiology of liver disease among adults awaiting liver transplantation in the United States. Gastroenterology 2015, 148, 547–555. [Google Scholar] [CrossRef]
- Casals-Casas, C.; Desvergne, B. Endocrine disruptors: From endocrine to metabolic disruption. Annu. Rev. Physiol. 2011, 73, 135–162. [Google Scholar] [CrossRef]
- Grun, F.; Blumberg, B. Endocrine disrupters as obesogens. Mol. Cell. Endocrinol. 2009, 304, 19–29. [Google Scholar] [CrossRef]
- Neel, B.A.; Sargis, R.M. The paradox of progress: Environmental disruption of metabolism and the diabetes epidemic. Diabetes 2011, 60, 1838–1848. [Google Scholar] [CrossRef]
- Burke, Z.D.; Reed, K.R.; Phesse, T.J.; Sansom, O.J.; Clarke, A.R.; Tosh, D. Liver zonation occurs through a beta-catenin-dependent, c-Myc-independent mechanism. Gastroenterology 2009, 136, 2316–2324.e3. [Google Scholar] [CrossRef] [PubMed]
- Cunningham, R.P.; Porat-Shliom, N. Liver Zonation—Revisiting Old Questions with New Technologies. Front. Physiol. 2021, 12, 732929. [Google Scholar] [CrossRef]
- Kang, L.I.; Mars, W.M.; Michalopoulos, G.K. Signals and cells involved in regulating liver regeneration. Cells 2012, 1, 1261–1292. [Google Scholar] [CrossRef]
- Kelly, D.A.; Summerfield, J.A. Hemostasis in liver disease. Semin. Liver Dis. 1987, 7, 182–191. [Google Scholar] [CrossRef]
- Pant, A.; Kopec, A.K.; Luyendyk, J.P. Role of the blood coagulation cascade in hepatic fibrosis. Am. J. Physiol. Gastrointest. Liver Physiol. 2018, 315, G171–G176. [Google Scholar] [CrossRef]
- Jin, S.; Guerrero-Juarez, C.F.; Zhang, L.; Chang, I.; Ramos, R.; Kuan, C.H.; Myung, P.; Plikus, M.V.; Nie, Q. Inference and analysis of cell-cell communication using CellChat. Nat. Commun. 2021, 12, 1088. [Google Scholar] [CrossRef]
- Fader, K.A.; Nault, R.; Doskey, C.M.; Fling, R.R.; Zacharewski, T.R. 2,3,7,8-Tetrachlorodibenzo-p-dioxin abolishes circadian regulation of hepatic metabolic activity in mice. Sci. Rep. 2019, 9, 6514. [Google Scholar] [CrossRef]
- Nault, R.; Saha, S.; Bhattacharya, S.; Sinha, S.; Maiti, T.; Zacharewski, T. Single-cell transcriptomics shows dose-dependent disruption of hepatic zonation by TCDD in mice. Toxicol. Sci. 2023, 191, 135–148. [Google Scholar] [CrossRef]
- Hao, Y.; Hao, S.; Andersen-Nissen, E.; Mauck, W.M., 3rd; Zheng, S.; Butler, A.; Lee, M.J.; Wilk, A.J.; Darby, C.; Zager, M.; et al. Integrated analysis of multimodal single-cell data. Cell 2021, 184, 3573–3587.e29. [Google Scholar] [CrossRef]
- Nault, R.; Fader, K.A.; Bhattacharya, S.; Zacharewski, T.R. Single-Nuclei RNA Sequencing Assessment of the Hepatic Effects of 2,3,7,8-Tetrachlorodibenzo-p-dioxin. Cell. Mol. Gastroenterol. Hepatol. 2021, 11, 147–159. [Google Scholar] [CrossRef]
- Nault, R.; Saha, S.; Bhattacharya, S.; Dodson, J.; Sinha, S.; Maiti, T.; Zacharewski, T. Benchmarking of a Bayesian single cell RNAseq differential gene expression test for dose-response study designs. Nucleic Acids Res. 2022, 50, e48. [Google Scholar] [CrossRef]
- Fang, Z.; Liu, X.; Peltz, G. GSEApy: A comprehensive package for performing gene set enrichment analysis in Python. Bioinformatics 2022, 39, btac757. [Google Scholar] [CrossRef] [PubMed]
- Fader, K.A.; Nault, R.; Kirby, M.P.; Markous, G.; Matthews, J.; Zacharewski, T.R. Convergence of hepcidin deficiency, systemic iron overloading, heme accumulation, and REV-ERBalpha/beta activation in aryl hydrocarbon receptor-elicited hepatotoxicity. Toxicol. Appl. Pharmacol. 2017, 321, 1–17. [Google Scholar] [CrossRef]
- Nault, R.; Fader, K.A.; Kirby, M.P.; Ahmed, S.; Matthews, J.; Jones, A.D.; Lunt, S.Y.; Zacharewski, T.R. Pyruvate Kinase Isoform Switching and Hepatic Metabolic Reprogramming by the Environmental Contaminant 2,3,7,8-Tetrachlorodibenzo-p-Dioxin. Toxicol. Sci. 2016, 149, 358–371. [Google Scholar] [CrossRef] [PubMed]
- Nakamura, T.; Mizuno, S. The discovery of hepatocyte growth factor (HGF) and its significance for cell biology, life sciences and clinical medicine. Proc. Jpn. Acad. Ser. B Phys. Biol. Sci. 2010, 86, 588–610. [Google Scholar] [CrossRef]
- Nault, R.; Fader, K.A.; Harkema, J.R.; Zacharewski, T. Loss of liver-specific and sexually dimorphic gene expression by aryl hydrocarbon receptor activation in C57BL/6 mice. PLoS ONE 2017, 12, e0184842. [Google Scholar] [CrossRef] [PubMed]
- Michaelson, J.J.; Trump, S.; Rudzok, S.; Gräbsch, C.; Madureira, D.J.; Dautel, F.; Mai, J.; Attinger, S.; Schirmer, K.; von Bergen, M.; et al. Transcriptional signatures of regulatory and toxic responses to benzo-[a]-pyrene exposure. BMC Genom. 2011, 12, 502. [Google Scholar] [CrossRef]
- Yamashita, N.; Saito, N.; Zhao, S.; Terai, K.; Hiruta, N.; Park, Y.; Bujo, H.; Nemoto, K.; Kanno, Y. Heregulin-induced cell migration is promoted by aryl hydrocarbon receptor in HER2-overexpressing breast cancer cells. Exp. Cell. Res. 2018, 366, 34–40. [Google Scholar] [CrossRef]
- Zhang, P.; Kuang, H.; He, Y.; Idiga, S.O.; Li, S.; Chen, Z.; Yang, Z.; Cai, X.; Zhang, K.; Potthoff, M.J.; et al. NRG1-Fc improves metabolic health via dual hepatic and central action. JCI Insight 2018, 3, e98522. [Google Scholar] [CrossRef]
- Pellat, A.; Vaquero, J.; Fouassier, L. Role of ErbB/HER family of receptor tyrosine kinases in cholangiocyte biology. Hepatology 2018, 67, 762–773. [Google Scholar] [CrossRef]
- Walker, N.J.; Wyde, M.E.; Fischer, L.J.; Nyska, A.; Bucher, J.R. Comparison of chronic toxicity and carcinogenicity of 2,3,7,8-tetrachlorodibenzo-p-dioxin (TCDD) in 2-year bioassays in female Sprague-Dawley rats. Mol. Nutr. Food Res. 2006, 50, 934–944. [Google Scholar] [CrossRef] [PubMed]
- Jia, Y.; Tao, Y.; Lv, C.; Xia, Y.; Wei, Z.; Dai, Y. Tetrandrine enhances the ubiquitination and degradation of Syk through an AhR-c-src-c-Cbl pathway and consequently inhibits osteoclastogenesis and bone destruction in arthritis. Cell. Death Dis. 2019, 10, 38. [Google Scholar] [CrossRef] [PubMed]
- Sato, K.; Kennedy, L.; Liangpunsakul, S.; Kusumanchi, P.; Yang, Z.; Meng, F.; Glaser, S.; Francis, H.; Alpini, G. Intercellular Communication between Hepatic Cells in Liver Diseases. Int. J. Mol. Sci. 2019, 20, 2180. [Google Scholar] [CrossRef] [PubMed]
- Kana, O.; Nault, R.; Filipovic, D.; Marri, D.; Zacharewski, T.; Bhattacharya, S. Generative Modeling of Single Cell Gene Expression for Dose-Dependent Chemical Perturbations. bioRxiv 2022. [Google Scholar] [CrossRef]
- Sorensen, K.K.; Simon-Santamaria, J.; McCuskey, R.S.; Smedsrod, B. Liver Sinusoidal Endothelial Cells. Compr. Physiol. 2015, 5, 1751–1774. [Google Scholar] [CrossRef]
- Pandey, E.; Nour, A.S.; Harris, E.N. Prominent Receptors of Liver Sinusoidal Endothelial Cells in Liver Homeostasis and Disease. Front. Physiol. 2020, 11, 873. [Google Scholar] [CrossRef]
- Fuji, H.; Miller, G.; Nishio, T.; Koyama, Y.; Lam, K.; Zhang, V.; Loomba, R.; Brenner, D.; Kisseleva, T. The role of Mesothelin signaling in Portal Fibroblasts in the pathogenesis of cholestatic liver fibrosis. Front. Mol. Biosci. 2021, 8, 790032. [Google Scholar] [CrossRef]
- Wells, R.G. The portal fibroblast: Not just a poor man’s stellate cell. Gastroenterology 2014, 147, 41–47. [Google Scholar] [CrossRef]
- Nault, R.; Fader, K.A.; Kopec, A.K.; Harkema, J.R.; Zacharewski, T.R.; Luyendyk, J.P. From the Cover: Coagulation-Driven Hepatic Fibrosis Requires Protease Activated Receptor-1 (PAR-1) in a Mouse Model of TCDD-Elicited Steatohepatitis. Toxicol. Sci. 2016, 154, 381–391. [Google Scholar] [CrossRef]
- McCuskey, R.S.; Bethea, N.W.; Wong, J.; McCuskey, M.K.; Abril, E.R.; Wang, X.; Ito, Y.; DeLeve, L.D. Ethanol binging exacerbates sinusoidal endothelial and parenchymal injury elicited by acetaminophen. J. Hepatol. 2005, 42, 371–377. [Google Scholar] [CrossRef] [PubMed]
- Miyao, M.; Kotani, H.; Ishida, T.; Kawai, C.; Manabe, S.; Abiru, H.; Tamaki, K. Pivotal role of liver sinusoidal endothelial cells in NAFLD/NASH progression. Lab. Investig. A J. Tech. Methods Pathol. 2015, 95, 1130–1144. [Google Scholar] [CrossRef]
- Szafranska, K.; Kruse, L.D.; Holte, C.F.; McCourt, P.; Zapotoczny, B. The wHole Story About Fenestrations in LSEC. Front. Physiol. 2021, 12, 735573. [Google Scholar] [CrossRef]
- Abril, N.; Chicano-Galvez, E.; Michan, C.; Pueyo, C.; Lopez-Barea, J. iTRAQ analysis of hepatic proteins in free-living Mus spretus mice to assess the contamination status of areas surrounding Donana National Park (SW Spain). Sci. Total. Environ. 2015, 523, 16–27. [Google Scholar] [CrossRef] [PubMed]
- Casagrande, V.; Mauriello, A.; Bischetti, S.; Mavilio, M.; Federici, M.; Menghini, R. Hepatocyte specific TIMP3 expression prevents diet dependent fatty liver disease and hepatocellular carcinoma. Sci. Rep. 2017, 7, 6747. [Google Scholar] [CrossRef]
- Martinez, C.; Latorre, J.; Ortega, F.; Arnoriaga-Rodriguez, M.; Lluch, A.; Oliveras-Canellas, N.; Diaz-Saez, F.; Aragones, J.; Camps, M.; Guma, A.; et al. Serum neuregulin 4 is negatively correlated with insulin sensitivity in humans and impairs mitochondrial respiration in HepG2 cells. Front. Physiol. 2022, 13, 950791. [Google Scholar] [CrossRef] [PubMed]
- VanEtten, S.L.; Bonner, M.R.; Ren, X.; Birnbaum, L.S.; Kostyniak, P.J.; Wang, J.; Olson, J.R. Effect of exposure to 2,3,7,8-Tetrachlorodibenzo-p-dioxin (TCDD) and polychlorinated biphenyls (PCBs) on mitochondrial DNA (mtDNA) copy number in rats. Toxicology 2021, 454, 152744. [Google Scholar] [CrossRef]
- Tanos, R.; Patel, R.D.; Murray, I.A.; Smith, P.B.; Patterson, A.D.; Perdew, G.H. Aryl hydrocarbon receptor regulates the cholesterol biosynthetic pathway in a dioxin response element-independent manner. Hepatology 2012, 55, 1994–2004. [Google Scholar] [CrossRef]
- Dornbos, P.; Jurgelewicz, A.; Fader, K.A.; Williams, K.; Zacharewski, T.R.; LaPres, J.J. Characterizing the Role of HMG-CoA Reductase in Aryl Hydrocarbon Receptor-Mediated Liver Injury in C57BL/6 Mice. Sci. Rep. 2019, 9, 15828. [Google Scholar] [CrossRef]
- Diani-Moore, S.; Ram, P.; Li, X.; Mondal, P.; Youn, D.Y.; Sauve, A.A.; Rifkind, A.B. Identification of the aryl hydrocarbon receptor target gene TiPARP as a mediator of suppression of hepatic gluconeogenesis by 2,3,7,8-tetrachlorodibenzo-p-dioxin and of nicotinamide as a corrective agent for this effect. J. Biol. Chem. 2010, 285, 38801–38810. [Google Scholar] [CrossRef]
- Uno, S.; Dalton, T.P.; Sinclair, P.R.; Gorman, N.; Wang, B.; Smith, A.G.; Miller, M.L.; Shertzer, H.G.; Nebert, D.W. Cyp1a1(-/-) male mice: Protection against high-dose TCDD-induced lethality and wasting syndrome, and resistance to intrahepatocyte lipid accumulation and uroporphyria. Toxicol. Appl. Pharmacol. 2004, 196, 410–421. [Google Scholar] [CrossRef] [PubMed]
Figure 1.
Inferred cell–cell interactions. CellChat was used to infer ligand–receptor interactions using hepatic snRNAseq data (GSE184506, SCP1871) male mice gavaged with sesame-oil vehicle or 0.01–30 μg/kg TCDD every 4 days for 28 days. (a) The number and (b) strength, a measure of significance based on ligand, mediator, and receptor expression, are summarized across all cell types in the dataset. (c) Networks of cell–cell inferred interactions show the number of ligand–receptor pairs (edges) between each cell type (nodes) across treatment groups. The width of the edge indicates the number of ligand–receptor interactions between cell types. PFs—portal fibroblasts; pDCs—plasmacytoid dendritic cells; LSECS—liver sinusoidal endothelial cells; HSC—hepatic stellate cells.

Figure 2.
Relative signaling strength. (a) Heatmap of scaled sum of weighted signal strength for all cell types in each dose group for all identified pathways (incoming and outgoing). Hierarchical clustering was performed to identify pathways showing similar dose-dependent patterns of signaling strength. Representative examples of signaling strength between each cell type are shown for (b) sesame oil and (c) 30 μg/kg TCDD, indicating both outgoing (ligand) and incoming (receptor) contributions. The heatmap shows the relative strength of each signaling pathway, while bar plots show the sum of weighted signal strength (denoted as S with arbitrary units) across signaling pathways (gray barplot) and cell types (colored barplot). The color scale indicates the relative signaling strength, with strong interactions (dark green) to weak interactions (white), represented within individual tiles. PFs—portal fibroblasts; pDCs—plasmacytoid dendritic cells; LSECS—liver sinusoidal endothelial cells; HSC—hepatic stellate cells.

Figure 3.
Individual NRG ligand–receptor pair contributions. Inferred NRG signaling was examined for specific ligand–receptor (L-R) pair interactions as well as individual cell–cell interactions in (a) vehicle and (b) 30 μg/kg TCDD. Chord plots show the direction of the ligand (outer ring)–receptor (inner ring) pair interactions colored by cell type. (c) The expression levels of contributing ligands (L) and receptors (R) in the snRNAseq dataset are shown for each cell type in vehicle and 30 μg/kg TCDD dose groups. PFs—portal fibroblasts; pDCs—plasmacytoid dendritic cells; LSECS—liver sinusoidal endothelial cells; HSC—hepatic stellate cells.

Figure 4.
Enrichment analysis of the ERBB signaling pathway. (a) Single-sample gene set enrichment analysis (ssGSEA) was performed for the KEGG ERBB signaling pathway (mmu04012) for each cell type and dose. Dot plots show the scaled average expression level and percent of nuclei expressing ERBB signaling pathway genes for (b) portal hepatocytes, (c) central hepatocytes, and (d) cholangiocytes. A yellow background indicates a significant difference in gene expression, as determined using the previously published single-cell Bayesian analysis tool (scBT) [22].


Table 1.
Summary of genomic datasets used for the inference of cell signaling changes in response to TCDD.
Table 1.
Summary of genomic datasets used for the inference of cell signaling changes in response to TCDD.
| Accession IDs 1 | Data Type | Study Design | Reference |
|---|---|---|---|
| GSE184506SCP1871 | snRNAseq | Dose response (0.01, 0.03, 0.1, 0.3, 1, 3, 10, and 30 μg/kg) | [17] |
| GSE206294SCP1875 | Spatial | Dose response (0.3, 3, and 30 μg/kg) | [17] |
| GSE97634 | ChIP-seq | 2 h following gavage of 30 μg/kg TCDD | [25] |
1 GSE datasets are deposited in the Gene Expression Omnibus, while SCP datasets are deposited in the Broad Single Cell Portal.
Disclaimer/Publisher’s Note: The statements, opinions and data contained in all publications are solely those of the individual author(s) and contributor(s) and not of MDPI and/or the editor(s). MDPI and/or the editor(s) disclaim responsibility for any injury to people or property resulting from any ideas, methods, instructions or products referred to in the content. |
© 2023 by the authors. Licensee MDPI, Basel, Switzerland. This article is an open access article distributed under the terms and conditions of the Creative Commons Attribution (CC BY) license (https://creativecommons.org/licenses/by/4.0/).
Share and Cite
MDPI and ACS Style
Nault, R.; Cholico, G.N.; Zacharewski, T. Analysis of Cell–Cell Communication by Single-Nuclei RNA Sequencing Identifies AHR-Mediated Induction of NRG-ERBB Signaling. Receptors 2023, 2, 148-159. https://doi.org/10.3390/receptors2020009
AMA Style
Nault R, Cholico GN, Zacharewski T. Analysis of Cell–Cell Communication by Single-Nuclei RNA Sequencing Identifies AHR-Mediated Induction of NRG-ERBB Signaling. Receptors. 2023; 2(2):148-159. https://doi.org/10.3390/receptors2020009
Chicago/Turabian StyleNault, Rance, Giovan N. Cholico, and Tim Zacharewski. 2023. "Analysis of Cell–Cell Communication by Single-Nuclei RNA Sequencing Identifies AHR-Mediated Induction of NRG-ERBB Signaling" Receptors 2, no. 2: 148-159. https://doi.org/10.3390/receptors2020009