Article

A Novel Liver X Receptor Inverse Agonist Impairs Cholesterol and Phospholipid Metabolism and Induces Apoptosis and Necroptosis in Pancreatic Ductal Adenocarcinoma Cells

Center for Nuclear Receptors and Cell Signaling, Department of Biology and Biochemistry, University of Houston, Houston, TX 77004, USA
*
Author to whom correspondence should be addressed.
Receptors 2023, 2(1), 34-46; https://doi.org/10.3390/receptors2010003
Submission received: 9 December 2022 / Revised: 9 January 2023 / Accepted: 13 January 2023 / Published: 1 February 2023

Abstract

:
Pancreatic ductal adenocarcinoma (PDAC) is an aggressive disease with a high mortality rate and few effective treatments. A growing area of cancer therapeutics seeks to exploit the metabolic dysregulation of cancer cells, such as glucose, amino acid, and fatty acid metabolism, to selectively target malignant cells. As ligand-dependent transcription factors and critical regulators of metabolism, liver X receptors (LXRs) are amenable to small-molecule targeting for such purposes. We have profiled the transcriptomic, metabolomic, and cytotoxic effects of a newly discovered small-molecule LXR modulator, GAC0003A4 (3A4), in PDAC cell lines. On the transcriptomic level, marked changes in gene expression were observed, including downregulation of LXR target genes and pathways. Gene set enrichment analysis determined downregulation of several metabolic pathways, such as fatty acid and cholesterol metabolism, while upregulated pathways involved TNFα/NF-κB and other stress-induced processes. Metabolomic analyses revealed altered metabolites in several pathways, the most enriched categories being lipids and amino acid metabolites, while phospholipids and sphingolipids, including ceramides, were also found to be significantly altered. Insights from transcriptomic and metabolomic studies helped guide the determination of alterations in cholesterol and ceramides as integral to the antiproliferative mechanisms of 3A4. Additionally, a concurrent programmed cell death mechanism involving apoptosis and necroptosis was shown to be activated. These studies provide novel insights into the effects of LXR modulation on gene expression, metabolism, and cell death induction in PDAC cells. The metabolic and cytotoxic effects of LXR modulation on the PDAC cell lines used in this study could also aid in the design and application of drugs to target other refractory cancers.

1. Introduction

Pancreatic cancer is projected to be the second leading cause of cancer deaths in the US by 2030 [1]. The majority of clinical cases are pancreatic ductal adenocarcinomas (PDAC) [2] and have been shown to harbor mutations in KRAS, TP53, CDKN2A, and SMAD4 that contribute to their aggressiveness and resistance to available therapies [3]. Poor outcomes are attributed to late diagnosis, treatment resistance, and the overall lack of effective therapies. Pancreatic surgical resection is the ideal approach, but it is contingent upon early detection. Current standard care employs adjuvant or neoadjuvant chemotherapeutics, or combinations thereof, such as gemcitabine with nab-paclitaxel or FOLFRINOX (oxaliplatin, irinotecan, leucovorin, and fluorouracil) [4]. A recent clinical trial demonstrated a three-year survival rate of 63.4% with adjuvant FOLFRINOX therapy, although adverse effects were reported in 75.9% of patients [5]. Unfortunately, resistance to standard-of-care therapeutics is common [6] and results in a five-year survival rate of approximately 9% for pancreatic cancer patients [7]. Novel therapeutic approaches and investigations into targetable vulnerabilities for this disease are desperately needed.
Metabolic dysregulation/reprogramming, including glucose, amino acid, and lipid metabolism, is a hallmark of cancer [8]. Metabolic pathways rely on the exchange of substrates between one another for anabolic processes, such as the pentose phosphate pathway and the TCA cycle providing NADPH and acetyl-CoA, respectively, for fatty acid (FA) synthesis [9]. Cancer-associated alterations in lipid metabolism were first observed with in vivo models, wherein de novo FA synthesis accounted for nearly all the esterified fatty acids, regardless of extracellular lipid availability [10]. Key enzymes involved in FA synthesis, such as FASN, SCD1, and SREBP1C, have been shown to be upregulated in tumor cells and correlate with poor clinical outcome [11]. The genes encoding these enzymes are under direct transcriptional control of liver X receptors (LXRs) [12,13,14], which function as ligand-dependent transcription factors and can be selectively targeted with small-molecule ligands.
The two LXRs, LXRα and LXRβ, are members of the nuclear receptor (NR) family [15]. Even though these closely related NRs share 77% sequence homology, LXRβ is ubiquitously expressed, while LXRα is mainly expressed in the liver [16]. Upon activation by endogenous ligands such as 22(R)-hydroxycholesterol, LXRs induce transcription of target genes involved in fatty acid metabolism and cholesterol homeostasis [17]. LXR agonist treatments have been shown to inhibit proliferation in various cancer models, including breast and prostate [18], colon [19], melanoma [20], and glioblastoma [21]. We have previously shown that LXRβ is the isoform expressed in PDAC cell lines and that treatment with the synthetic LXR agonist GW3965 leads to antiproliferative effects involving cell cycle arrest [22]. To identify novel LXR ligands with antitumor activities, we recently conducted a screen in PDAC cell lines using a focused library of small molecules computationally predicted to bind LXRs [23]. Among the top hits, GAC0003A4 (3A4) was shown to inhibit PDAC cell proliferation in a dosage-dependent manner, while having little or no effect on non-transformed pancreatic cells. Initial characterization of 3A4 indicated that it functions as an LXR inverse agonist and a “degrader” that reduces LXR protein levels over time. In this study, we conducted transcriptomic and metabolomic analyses in PDAC cell lines and identified potential mechanisms of action of 3A4 in targeting key metabolic pathways in pancreatic cancer.

2. Materials and Methods

2.1. Cell Lines and Culture

Human pancreatic cancer cell lines BxPC-3, MIA PaCa-2, and PANC-1 were purchased from the American Type Culture Collection (ATCC). BxPC-3 cells were cultured in RPMI 1640 (Gibco 11875085, Thermo Fisher Scientific, Waltham, MA, USA). MIA PaCa-2 and PANC-1 cells were cultured in high-glucose DMEM (Gibco 12430047, Waltham, MA, USA) with HEPES. HPNE cells were cultured in low-glucose DMEM with GlutaMAX (Gibco 10567014, Waltham, MA, USA). All media were supplemented with 10% FBS (Gibco 26140079, Waltham, MA, USA). All cell lines were cultured in a humidified atmosphere of 5% CO2 at 37 °C. DMSO was purchased from VWR (97063-136, Radnor, PA, USA). GW3965 was purchased from (Tocris Bioscience, Bristol, UK (2474)). 3A4 was synthesized by and obtained from OTAVA Chemicals. Necrostatin-1, necrosulfonamide, fumonisin B1, myriocin, GW4869, and C6-ceramide were purchased from (Cayman Chemical Company, Ann Arbor, MI, USA).

2.2. Proliferation Assays

2.5 × 10³ BxPC-3, 2.5 × 10³ MIA PaCa-2, and 3 × 10³ PANC-1 cells/well were seeded in a 96-well plate (100 µL/well) and allowed 36 h for attachment. Cells were treated with 10 µM 3A4 for 72 h, after which cell viability was assessed with MTS (3-(4,5-dimethylthiazol-2-yl)-5-(3-carboxymethoxyphenyl)-2-(4-sulfophenyl)-2H-tetrazolium) reagent (Promega G3582, Madison, WI, USA). Cells were washed with PBS and 100 µL of fresh media was added with 10 µL MTS reagent per well and incubated for 2–3 h. Absorbance was measured at 490 nm with a SpectraMAX M5 microplate reader (Molecular Devices, San Jose, CA, USA). Assays were performed in triplicate, with technical replicates in quadruplicate.

2.3. Western Blotting

Cells were plated in 6-well plates at densities of 2 × 10⁵ for BxPC-3 and MIA PaCa-2, and 2.5 × 10⁵ for PANC-1, and allowed 24 h for attachment. Treatments included DMSO (vehicle), staurosporine, and 3A4 at 10 µM for 48 h. Cells were resuspended in RIPA and lysed on ice for 30 min, followed by heating at 99 °C for 10 min. Samples were applied to 12% SDS-PAGE and transferred to a PVDF membrane (Thermo Fisher Scientific 88518, Waltham, MA, USA). Primary antibodies: PARP (#9542, Cell Signaling Technology, Danvers, MA, USA), Caspase-3 (#9662, Cell Signaling Technology, Danvers, MA, USA) and β-actin (GE, Boston, MA, USA). Signals were detected using BIO-RAD chemiluminescence reagents (Hercules, CA, USA) and images were captured on a LI-COR Odyssey Fc imager (Lincoln, NE, USA). Blot images are representative of three biological replicates.

2.4. RNA-Seq Library Preparation and Sequencing

Cells were plated in 6-well plates at densities of 2 × 10⁵ for BxPC-3 and MIA PaCa-2 cells, and 2.5 × 10⁵ for PANC-1 cells and allowed 24 h for attachment. Treatments included DMSO (vehicle), GW3965, and 3A4 at 10 µM for 48 h. RNA samples underwent quality control assessment using the RNA tape on the Tapestation 4200 (Agilent Technologies, Santa Clara, CA, USA) and were quantified with a Qubit Fluorometer (Thermo Fisher, Waltham, MA, USA). The RNA libraries were prepared and sequenced at the University of Houston Seq-N-Edit Core, per standard protocols. RNA libraries were prepared with QIAseq Stranded Total RNA library Kit (Qiagen, Hilden, Germany) using 500 ng input RNA. mRNA was enriched with oligo-dT probes attached to pure mRNA beads (Qiagen, Hilden, Germany). RNA was fragmented, reverse transcribed into cDNA, and ligated with Illumina sequencing adaptors. The size selection for libraries was performed using SPRIselect beads (Beckman Coulter, Brea, CA, USA) and the purity of the libraries was analyzed using the DNA 1000 tape on the Tapestation 4200 (Agilent Technologies, Santa Clara, CA, USA). The indexed libraries were pooled and 2 × 76 bp paired-end reads were sequenced using a NextSeq 500 (Illumina, San Diego, CA, USA).

2.5. RNA-Seq Analysis

Paired-end FASTQ files were adapter and quality trimmed with Trim Galore v.0.4.4 (Babraham Bioinformatics, Cambridge, UK) and aligned to indexes built using the Homo_sapiens.GRCh38.dna.primary_assembly with HISAT2 v.2.0.2 (Johns Hopkins University, Baltimore, MD, USA) [24]. SAM files were sorted and converted to BAM format using SAMtools v.1.3 (Genome Research Limited, Hinxton, UK). Transcripts were assembled and quantified with Homo_sapiens.GRCh38.99.gtf using StringTie v.1.3.1c (Johns Hopkins University, Baltimore, MD, USA) [24]. Transcript matrices were imported into RStudio v.1.2.1355 and differential expression was performed with DESeq2 v.1.22.2 [25]. Pre-ranked GSEA v.4.0.3 (Broad Institute, Cambridge, MA, USA) [26] was used on FPKM-filtered genes (mean ≥ 1 across all samples) using the Wald test statistic from the differential expression analysis and the c2.cp.v7.1.symbols (Broad Institute, Cambridge, MA, USA) and h.all.v7.1.symbols (Broad Institute, Cambridge, MA, USA) gene sets.

2.6. Metabolomics

Metabolomics analysis was performed by Metabolon, Inc. (Durham, NC, USA). BxPC-3 and PANC-1 cells were grown in a 10 cm plate and treated with DMSO and 3A4 (10 µM) for 48 h, in media containing 4 mM glutamine and 25 g/L glucose, supplemented with 10% FBS, n = 6. Briefly, samples were homogenized and subjected to methanol extraction, then split into aliquots for analysis by ultrahigh performance liquid chromatography/mass spectrometry (UHPLC/MS) in the positive, negative, or polar ion mode. Metabolites were identified by automated comparison of ion features to a reference library of chemical standards followed by visual inspection for quality control, as previously described [27,28,29]. For statistical analysis and data display, any missing values were assumed to be below the limits of detection; these values were imputed with the compound minimum. Data were normalized to cell number, in order to account for differences in metabolite levels resulting from differences in cell number due to treatments. Statistical tests were performed in ArayStudio (Omicsoft, Qiagen, Hilden, Germany, version.10.0) or R to compare data between experimental groups; p < 0.05 was considered significant. An estimate of the false discovery rate (q-value) was also calculated to consider the multiple comparisons that normally occur in metabolomics-based studies, with q < 0.05 used as an indication of high confidence in a result.

2.7. Caspase-3/7 Glo Assay

Caspase-3/7 activity was measured using Promega’s caspase-Glo 3/7 Assay (G8090) (Promega, Madison, WI, USA). Briefly, PANC-1, BxPC-3, and MIA PaCa-2 (5000 cells/well) were plated in a white 96-well plate (Greiner Bio-One, Monroe, NC, USA) in complete media. The following day, cells were treated with DMSO and 3A4 (10 µM) for 48 h, and staurosporine (2 µM) for 8 h. On the day of the assay, caspase-Glo 3/7 reagent was prepared according to the manufacturer’s instructions. The prepared reagent (100 µL) was added to each well and the plate was shaken for 1 min at 300 rpm, followed by a 1 h incubation at RT. Luminescence was recorded using a Victor X4 plate reader (PerkinElmer, Waltham, MA, USA).

3. Results

3.1. Transcriptomic Analyses Reveal Downregulation of Fatty Acid and Cholesterol Metabolism

LXRs are key transcriptional regulators of metabolism genes. To determine the effects and mechanisms of action of the novel LXR ligand 3A4, we performed RNA sequencing (RNA-seq) analysis on three PDAC cell lines following 48 h treatments with DMSO (vehicle) or 3A4. Treatments with 3A4 resulted in more differentially expressed genes (DEGs) in PANC-1 and MIA PaCA-2 cells, which harbor KRAS mutations, as compared to KRAS-wildtype BxPC-3 cells (Figure 1a). Figure 1b Venn diagrams show an overlap of 53 DEGs between all three cell lines, suggesting significant cell line-specific effects, and a set of core genes which may mediate the inhibitory effects of 3A4. We next performed gene set enrichment analysis (GSEA) to investigate which pathways and gene networks were affected by ligand treatment (see Figure 1c and Supplementary Materials File S1). Among the positively enriched pathways, the highest enrichment scores across all cell lines were for gene sets involved in TNFα/NF-κB signaling and ribosome biogenesis. Stressful conditions and excess free FAs, such as the saturated FA palmitate, have been shown to activate NF-κB [30], and some of LXR’s anti-inflammatory effects have been attributed to repression of NF-κB target genes [31]. Increased expression of genes involved in TNFα signaling suggests possible disruption of cell survival and activation of apoptosis. Other positively enriched gene sets include those which function in MYC target activation and cell cycle checkpoints. MYC activation has been shown to increase cholesterol influx in tumors [32], and the observed upregulation may be caused by disrupted cholesterol synthesis, while ribosome biogenesis and effects on the cell cycle are well-documented responses to MYC signaling [33]; MYC activation also sensitizes cells to pro-apoptotic stimuli [34]. Ferroptosis and apoptosis genes were also positively enriched in MIA PaCa-2 cells, while those involved in apoptosis and necroptosis showed enrichment in PANC-1 cells. Negatively enriched pathways were predominately involved with lipid-associated processes, such as fatty acid synthesis and cholesterol homeostasis, but oxidative phosphorylation and the TCA cycle were also downregulated. These results demonstrate that metabolic pathways related to LXR activity—both directly and indirectly—are downregulated by 3A4 treatment. Transcriptomic data also provide insights into possible stress, immunomodulatory, cell death, and survival processes that are activated in response to metabolic perturbations caused by LXR inverse agonism.

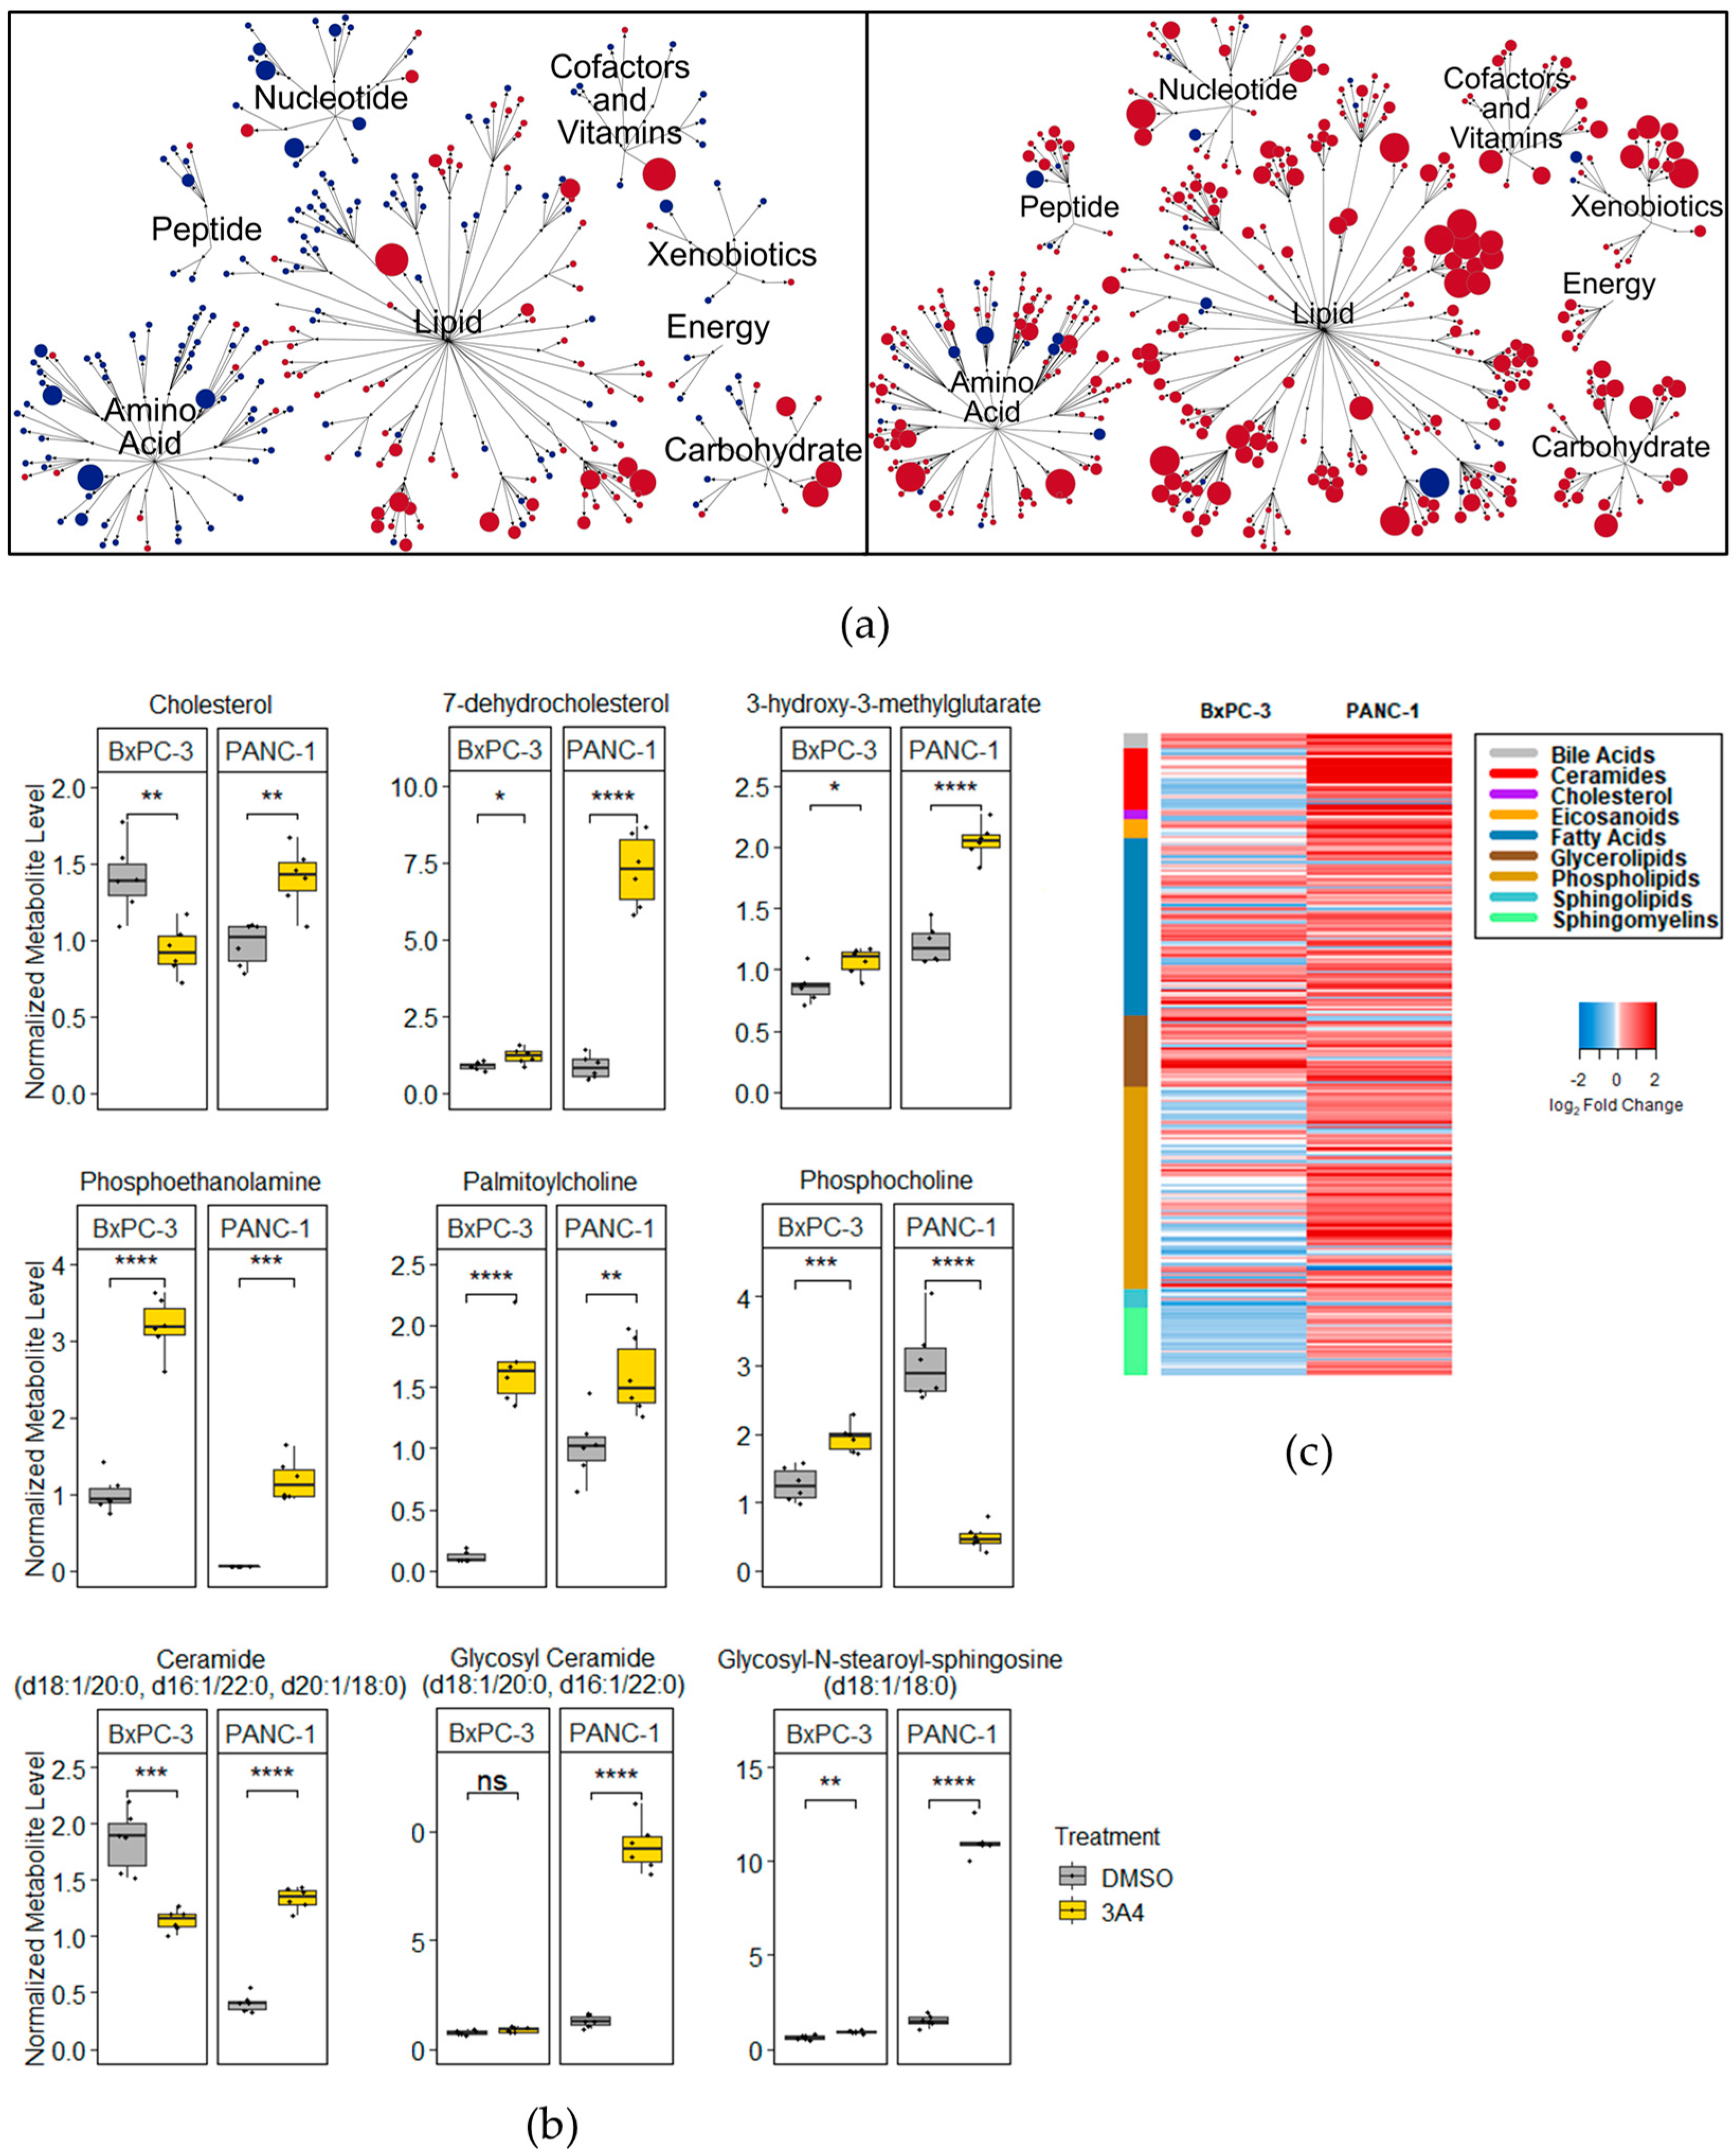
3.2. Metabolomic Analyses Demonstrate Perturbations of Cholesterol, Phospholipid, and Amino Acid Pathways

To gain a more precise understanding of the metabolic pathways affected by 3A4, we analyzed the differential regulation of 674 metabolites in BxPC-3 (KRAS wildtype) and PANC-1 (KRAS mutant) cell lines. Treatments with 3A4 produced robust increases in differentially detected metabolites (DDMs) in PANC-1 cells, while treated BxPC-3 cells exhibited an overall reduction in DDMs. An overview of the metabolites and implicated super-pathways is shown in a pathway map (Figure 2a). In PANC-1 cells, 3A4 treatment increased almost all metabolite classes covered by the analysis. BxPC-3, on the other hand, showed decreases in DDMs involved in nucleotide and amino acid metabolism. Metabolite enrichment analysis of total DDMs showed statistically significant perturbations in a variety of classes, including amino acids/proteins, purines/pyrimidines, and fatty acids (Supplementary Materials Figure S1). KEGG pathway enrichment analysis of total DDMs revealed the potential involvement of various amino acid and glycerophospholipid metabolism pathways (Supplementary Materials Figure S2). Since LXR plays an extensive role in regulating lipid metabolism, subtype-level lipid enrichment analysis was performed on the statistically significant DDMs belonging to the lipid super-pathway. Results show that the most significantly enriched lipid species were saturated and unsaturated fatty acids, as well as phospholipids (Supplementary Materials Figure S3). Considering the overlapping DEGs and DDMs between the BxPC-3 and PANC-1 cell lines, joint pathway enrichment analysis showed that the most statistically significant pathway affected by 3A4 was glycerophospholipid metabolism (Supplementary Materials Figure S4). A heatmap of all lipid-associated metabolites shows substantial increases in phospholipid and sphingolipid species and precursors in PANC-1 cells (Figure 2c). Specifically, the phospholipid precursors phosphoethanolamine and palmitoylcholine showed large increases, with an 18-fold increase in PANC-1 cells and a 14-fold increase in BxPC-3 cells. Cholesterol and cholesterol synthesis intermediates showed varying alterations, such as an 8.4-fold increase in 7-dehydrocholesterol in PANC-1 cells and a 33% decrease in cholesterol in BxPC-3 cells. Ceramides, known to induce apoptosis, were increased in PANC-1 cells (Figure 2b). We would note, however, that changes in gene expression and metabolite levels may reflect the direct effects of ligands and their modulation of LXR activity and expression, and indirect effects and feedback mechanisms in response to genetic and metabolic perturbations. Nonetheless, these results demonstrate the disruption of several metabolic pathways following suppression of LXR activity, notably those involving amino acids, nucleotides, fatty acids, cholesterol, and phospholipids, and illustrate the integral role LXR plays in cellular metabolism and homeostasis.

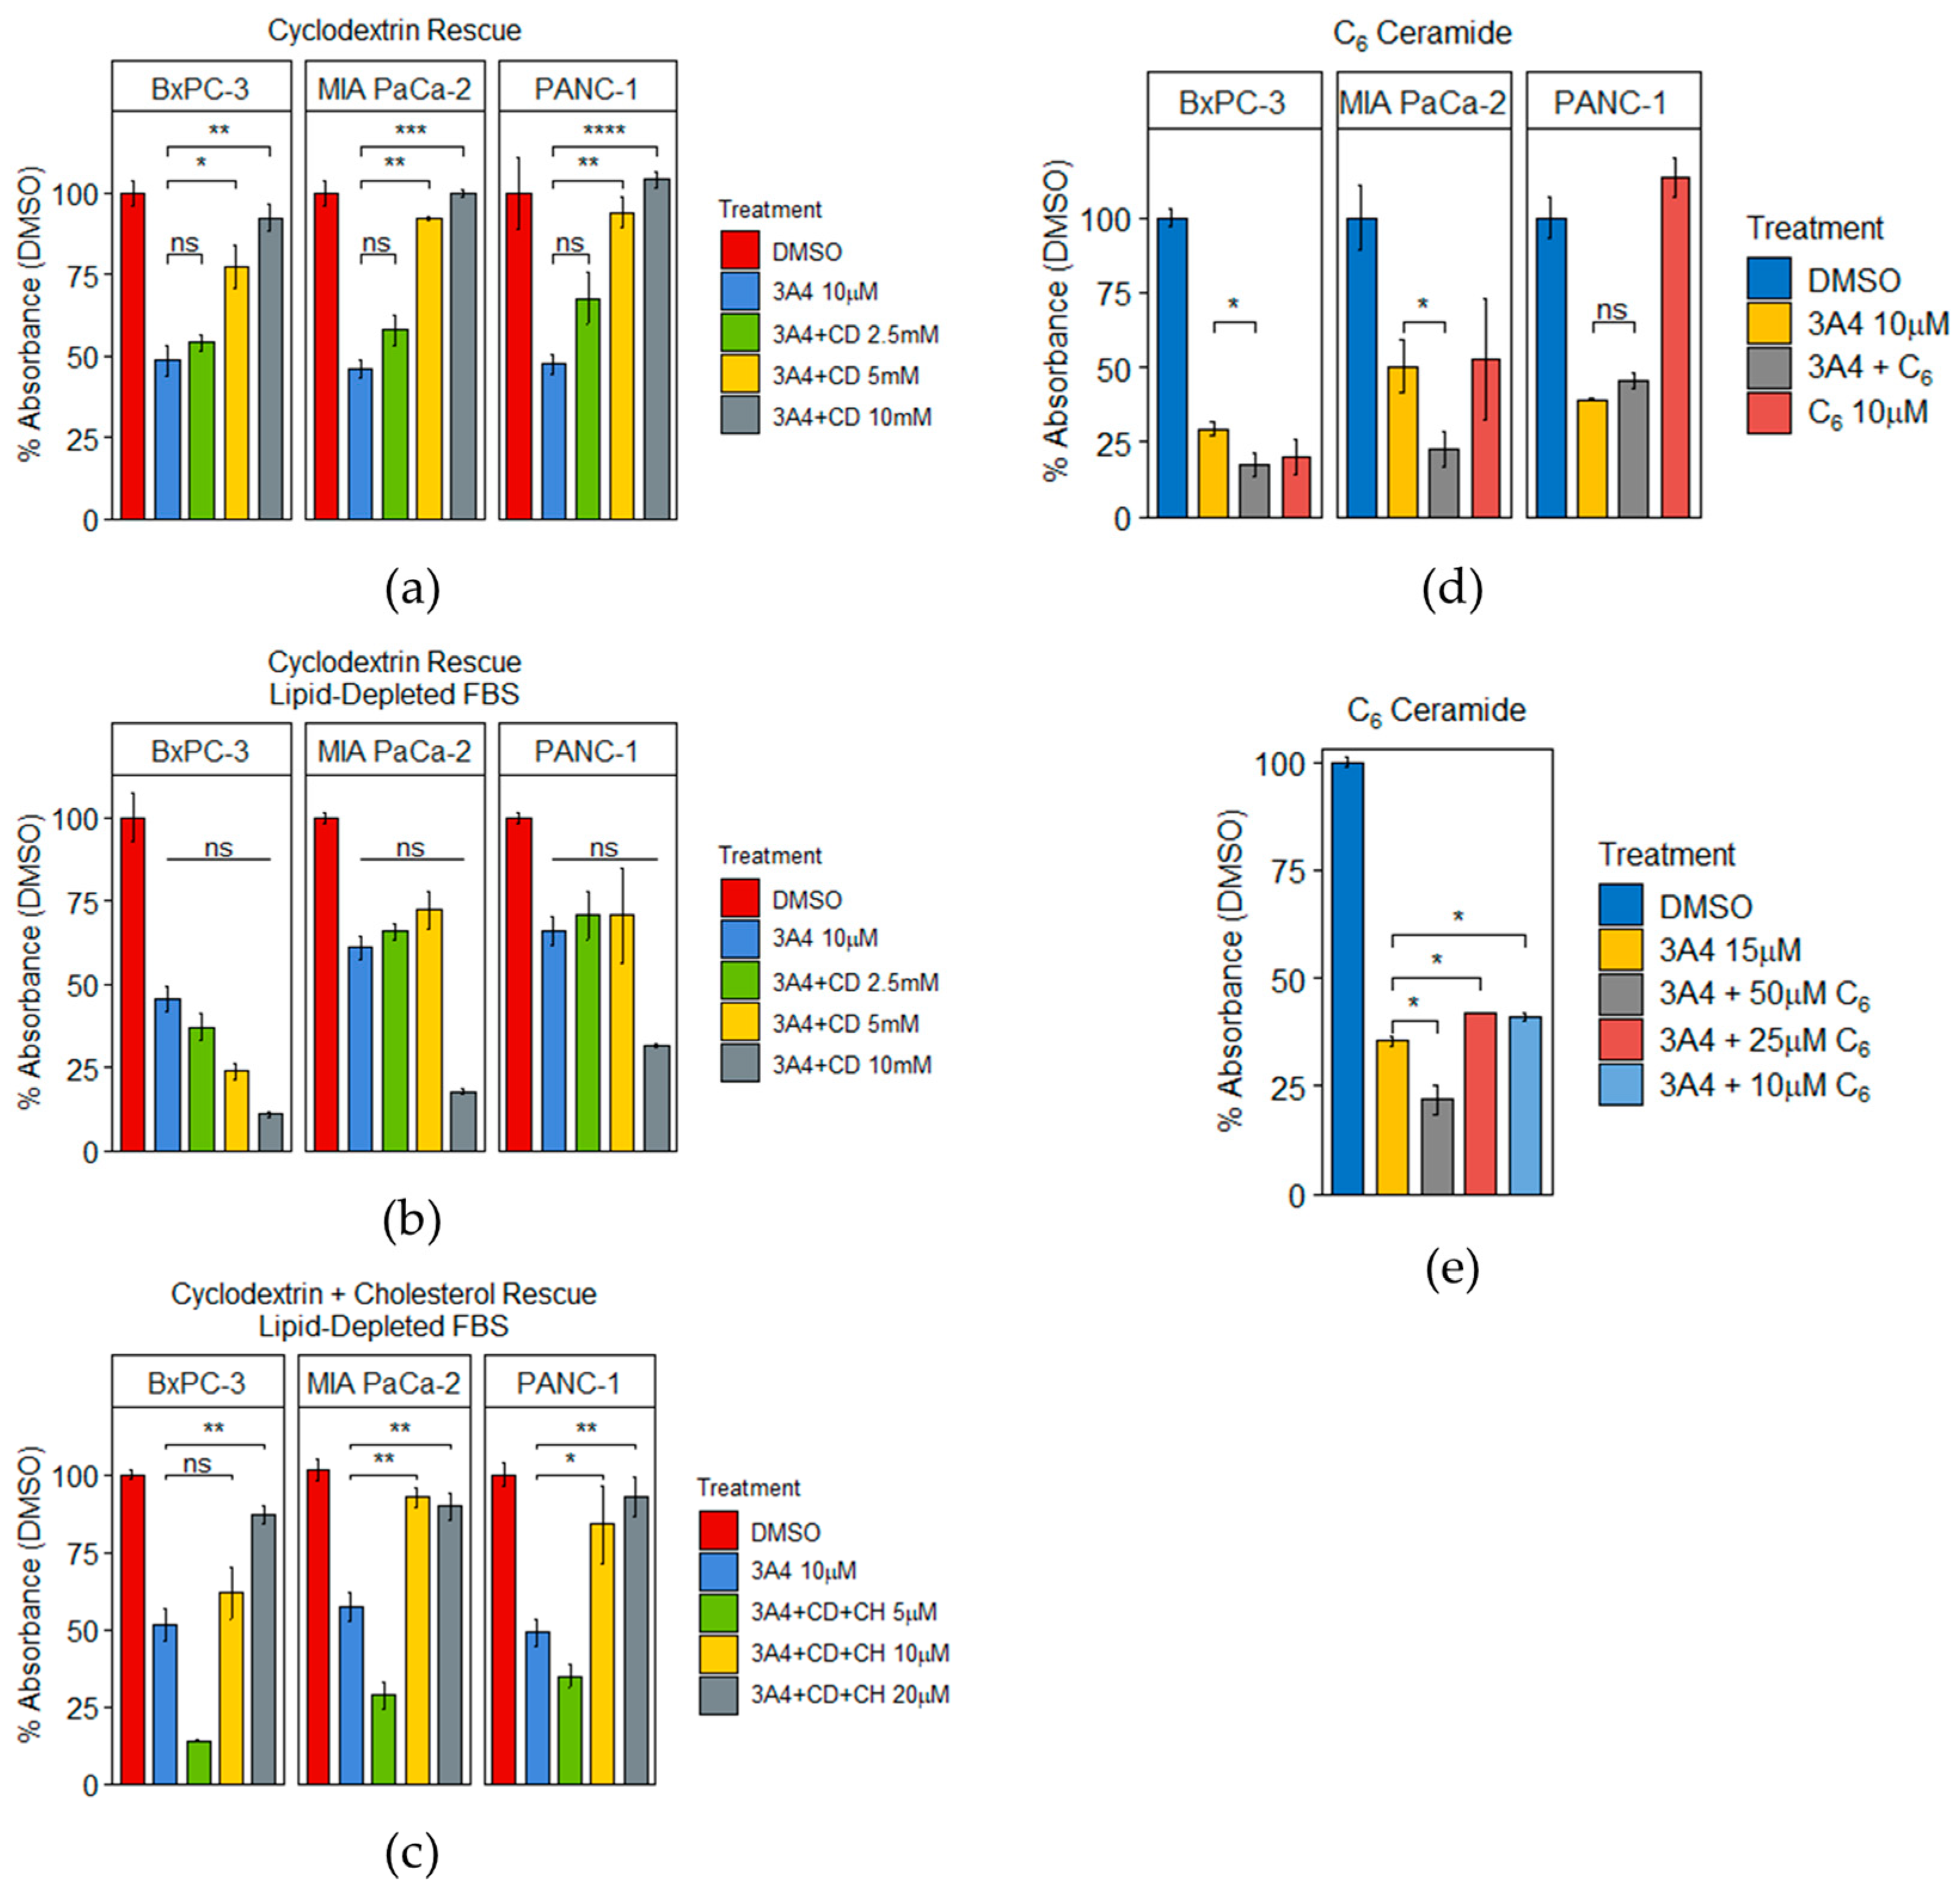
3.3. 3A4 Causes Alterations in Cholesterol and Ceramide Metabolism

As both transcriptomic and metabolomic analyses revealed perturbations in cholesterol metabolism, we sought to investigate the role of cholesterol in mediating the effects of 3A4. PDAC cells were treated with (2-Hydroxypropyl)-β-cyclodextrin (CD), a cholesterol transporter that can either deplete or replenish intracellular cholesterol, depending on the amount of extracellular cholesterol present [35]. In media containing 10% serum (~34 mg/dL cholesterol in serum), CD was able to fully rescue the inhibitory effects of 3A4 in a concentration-dependent manner (Figure 3a). Interestingly, in media containing 10% lipid-depleted serum (<4 mg/dL cholesterol in serum), no rescue was observed; in fact, inhibitory effects of 3A4 were enhanced (Figure 3b). This suggests that CD is capable of replenishing intracellular cholesterol in cells where cholesterol synthesis is disrupted. Using lipid-depleted serum, we found that CD and supplementations of cholesterol rescued the effects of 3A4 in a dose-dependent manner (Figure 3c). These results support the role of disrupted cholesterol synthesis in the antiproliferative effects of 3A4. Furthermore, cholesterol synthesis genes, such as DHCR7, LSS, and SQLE, were observed to be downregulated in the transcriptomic data (Supplementary Materials Figure S5). Ceramide is known to be apoptotic and synthetic ceramide treatments have been shown to elicit apoptosis in cancer cells [36]. Since we observed increases in various ceramide species in the metabolomic analyses of PANC-1 cells, we hypothesized that apoptosis was being promoted by increased ceramide levels. Interestingly, neither chemical inhibition of ceramide synthase with fumonisin B1 (FB1), serine palmitoyltransferase with myriocin (myr), nor sphingomyelinase with GW4869, was able to rescue the antiproliferative effects of 3A4 (Supplementary Materials Figure S6). We then concurrently treated cells with 3A4 and varying concentrations of the commonly used synthetic C6-ceramide and observed additive antiproliferative effects. BxPC-3 and MIA PaCa-2 cells were especially sensitive to C6-ceramide (Figure 3d), while PANC-1 cells exhibited variable effects (Figure 3e).

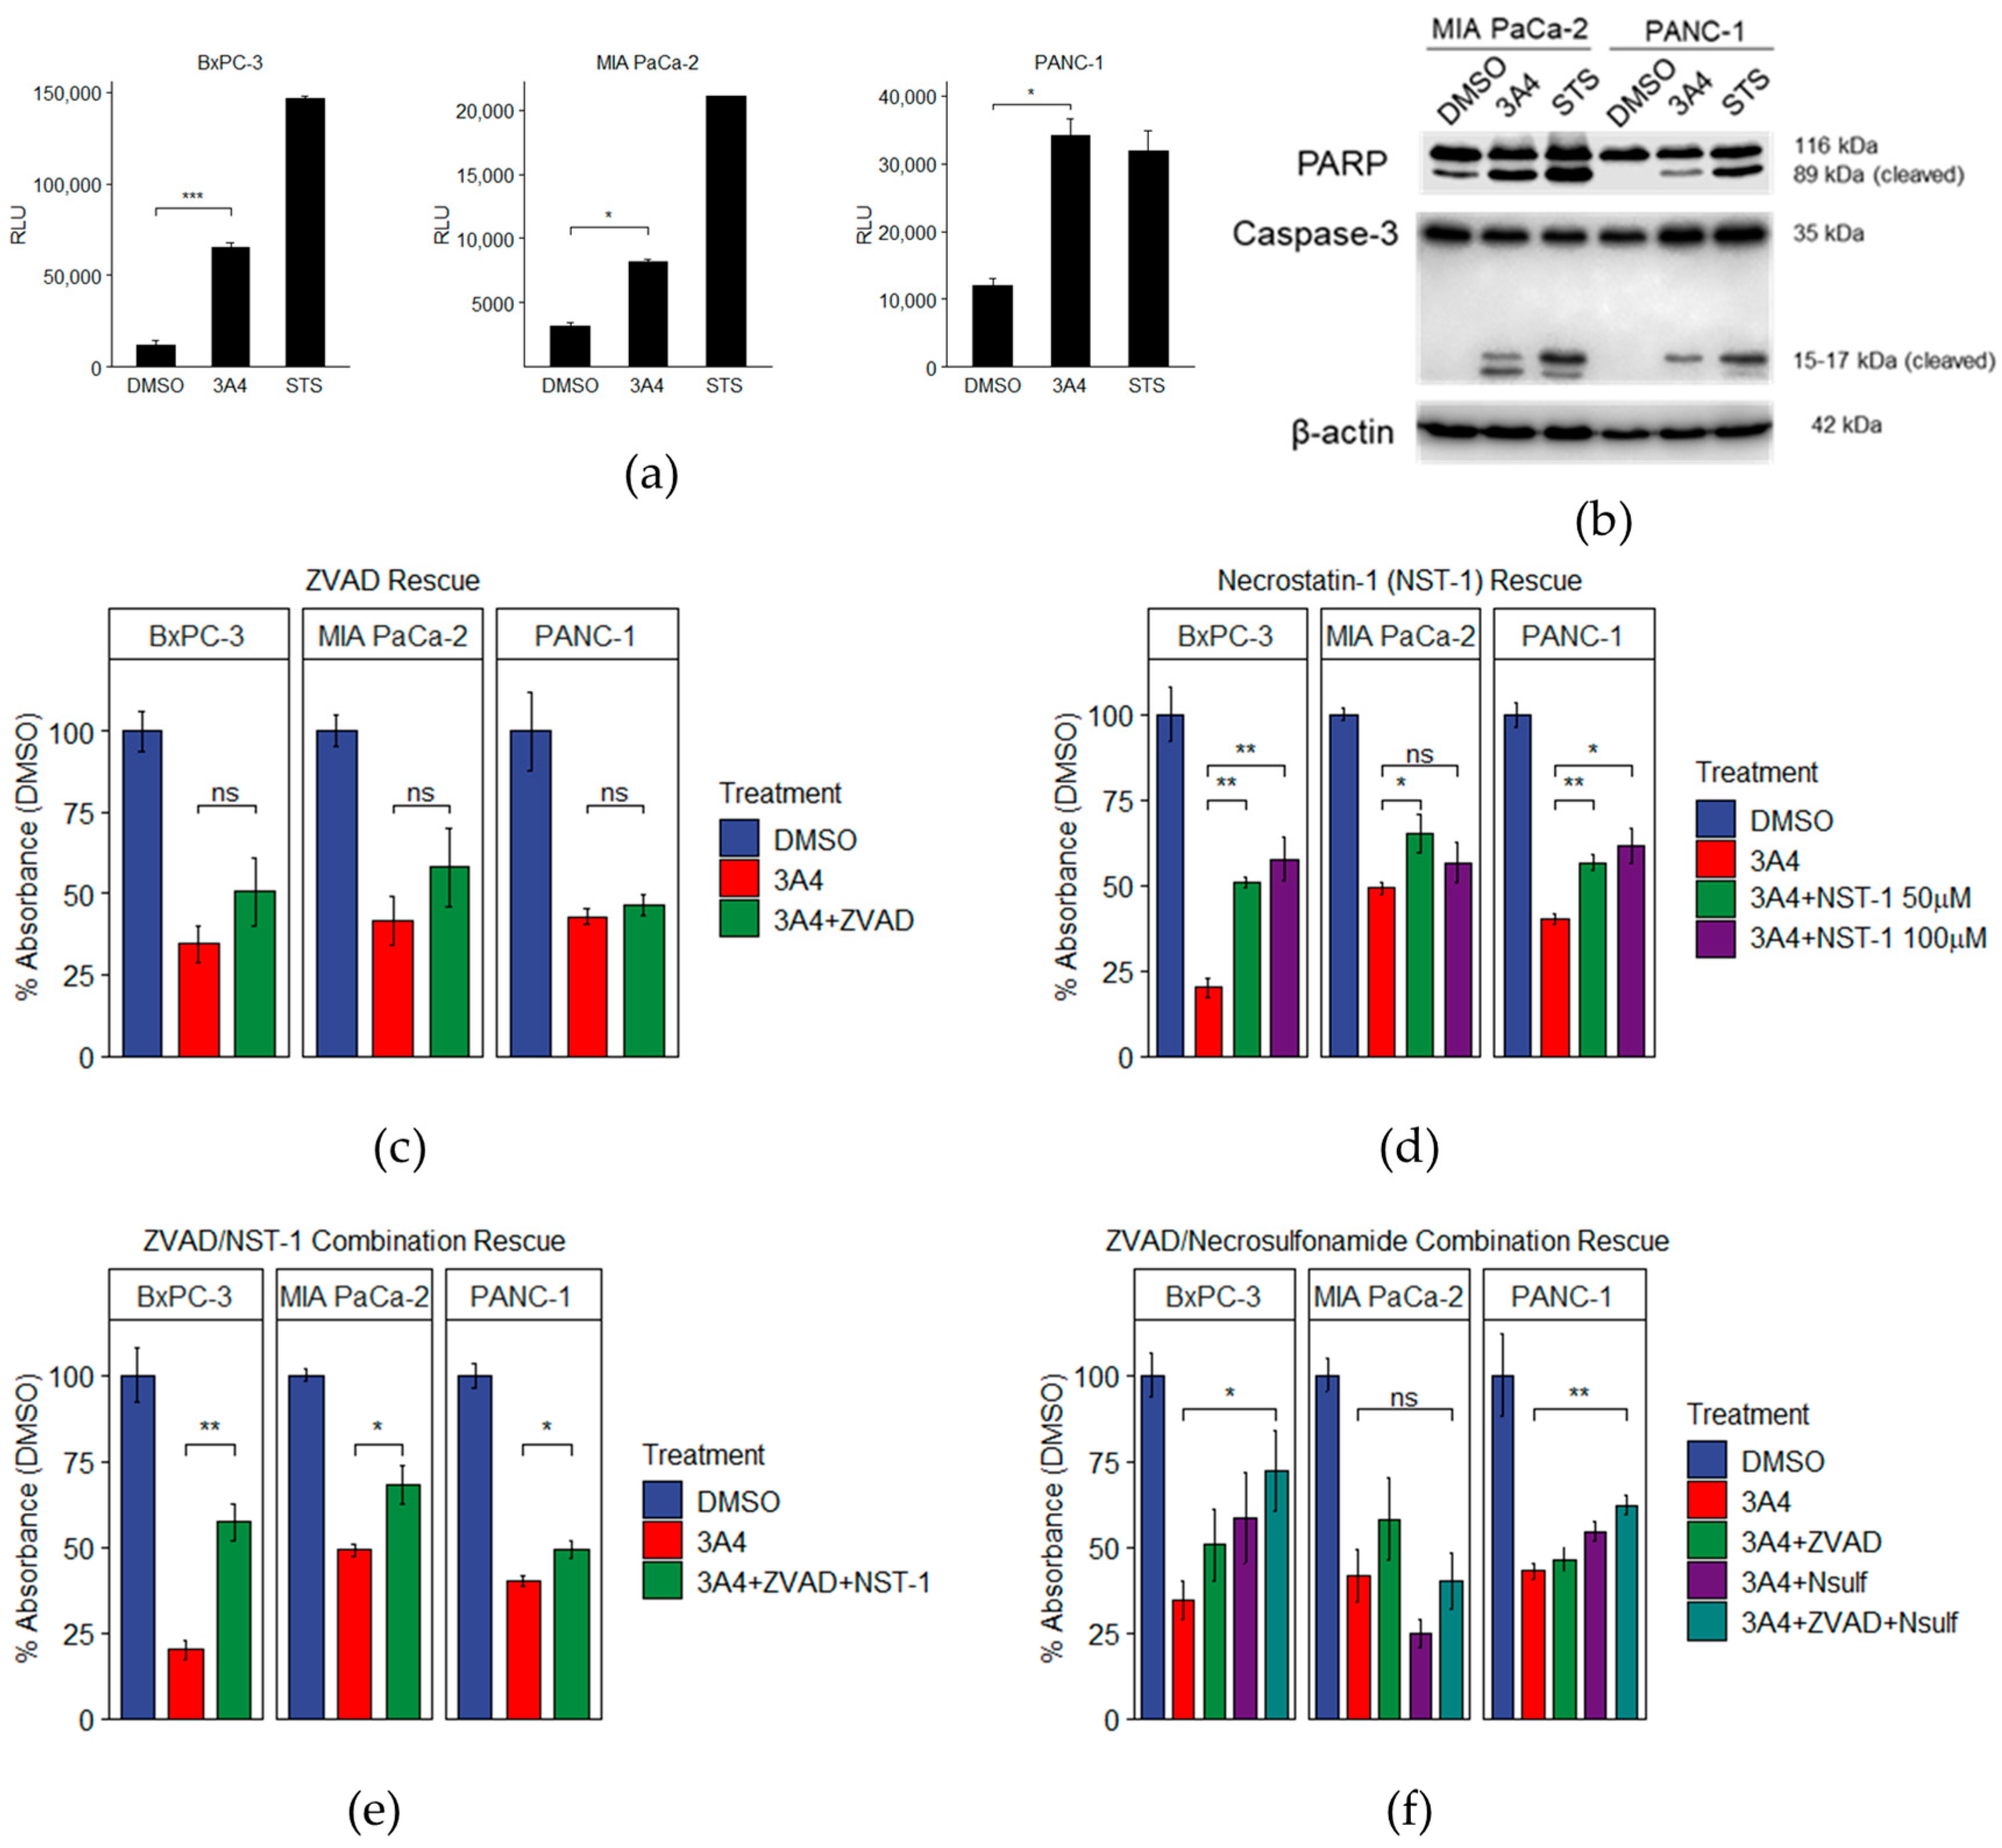
3.4. LXR Inhibition by Novel Ligand Induces Both Apoptotic and Necroptotic Cell Death Pathways

Since programmed cell death genes are differentially expressed following 3A4 treatments, we sought to delineate the specific types of cell death induced. It has been shown that chemical inhibition or genetic knockdown of SREBP1 [37], FASN [38], and SCD1 [39] causes cell death via apoptosis. In line with these observations, we performed caspase-3/7 activation assays and observed activity in all three cell lines (Figure 4a). We also performed Western blotting for cleaved PARP and caspase-3, and observed positive results in two of the cell lines (Figure 4b). Next, we used a pan-caspase inhibitor, Z-VAD-FMK (ZVAD), to determine the role of apoptotic pathways in mediating the effects of 3A4. Using a concentration (20 μM) consistent with reported studies [40], we saw no statistically significant rescue when cells were cultured with both 3A4 and ZVAD (Figure 4c). Morphological differences were observed, however, when comparing 3A4 to staurosporine (an inducer of apoptosis), with swollen, necrotic-like cells in addition to the condensed apoptotic bodies that are characteristic of apoptosis; ruptured cells were also observed (Supplementary Materials Figure S7). When cells were cultured with 20 μM ZVAD and 20 μM of the necroptosis inhibitor necrostatin-1 (NST-1), partial rescues in cell viability were observed (Figure 4d). Concurrent activation of apoptosis and necroptosis has been observed with certain cancer therapeutics [41]. Higher concentrations (50 μM and 100 μM) of NST-1 alone provided an increased partial rescue from 3A4, with BxPC-3 and PANC-1 cells showing more responsiveness. We then tried rescue with another necroptosis inhibitor, necrosulfonamide (Nsulf), but saw only a moderate, yet statistically significant, partial rescue in BxPC-3 and PANC-1 cell lines, when combined with ZVAD. These results highlight the ability of 3A4 to activate multiple death pathways in PDAC cells, which have been shown to be resistant to chemotherapeutics.

4. Discussion

The work presented here highlights the transcriptional and metabolic effects of a small-molecule modulator of LXR in PDAC cells. Small-molecule targeting of LXR has been focused on the activation of the receptor by synthetic agonists such as GW3965 and T0901317 [42]. LXR agonists were first purposed as treatments for atherosclerosis [43] due to the activation of reverse cholesterol transport, but hypertriglyceridemia [44] and neurological side effects [45] hindered their application in humans. Recently, a purported LXR inverse agonist, SR9243 [46], was shown in great detail to selectively inhibit cancer cell proliferation and induce apoptosis. These studies primarily focused on colorectal, prostate, and lung cancer cells, while only conducting an IC50 analysis on the PDAC cell line MIA PaCa-2. Since cancers of different tissues are inherently different in their mutational landscapes and overall phenotypes, we took a singular approach and focused on PDAC to determine the fundamental effects elicited by 3A4 in this cancer. Comparisons with TCGA PAAD and GTEx normal pancreas samples revealed that LXRβ, SREBF1, SCD, FASN, LPCAT3, and ACSS2 are more highly expressed in tumors (Supplementary Materials Figure S8). The effectiveness of 3A4, demonstrated across three PDAC cell lines with different genotypic and phenotypic properties demonstrates the applicability of inverse agonist-like LXR modulators to this disease.
From a transcriptional perspective, cell-line variation in response to ligand treatment was observed, but overlapping statistically significant DEGs had high concordance in profile. Notably, the KRAS mutant [47] cell lines, MIA PaCa-2 and PANC-1, had higher numbers and similarity of DEGs than the BxPC-3 cell line. Regarding pathways, RNA-seq demonstrated the downregulation of genes involved in fatty acid and cholesterol metabolism, as well as in oxidative phosphorylation. Cancer cells have been shown to contain excess cholesterol [48] and its depletion has been shown to sensitize cancer cells to apoptosis [49]. Upregulated genes were associated with TNFα/NF-κB, ribosomal processes, MYC signaling, and the cell cycle. MYC is known to control rRNA and protein synthesis, as well as proliferation [50]; however, under nutrient-depleted conditions, MYC’s effects on the cell cycle can sensitize cells to apoptosis [34] via several pathways, including via TNFα [51]. It should be noted that a limitation of the present study is the collection of samples and data at a single time point. We chose the 48 h time point based on our time course studies, where significant inhibitory effects of the novel ligand were observed. Our rationale is that coupling the emergence of reproducible phenotypes with the RNA-seq and metabolomic data can better facilitate the correlation of alterations in gene networks with inhibitory mechanisms and effects. On the other hand, the late time point selected suggests that both direct and indirect mechanisms are present in the datasets. Early time points are more likely to reveal the direct effects of LXR inhibition/degradation, but those effects and mechanisms, however, may or may not necessarily correspond to the downstream effects on cell proliferation and survival. It would have been ideal to conduct time-course omics studies, and they should be a priority in future studies to further define the inhibitory mechanisms of 3A4.
Transcriptional profiling demonstrated the effects of LXR inverse agonism in PDAC cells and offers insights into the susceptibility of cancer cells to metabolic targeting. Metabolomic analyses showed alterations in multiple pathways, with some cell line-specific responses. Similar to the transcriptional responses, the KRAS mutant cell line PANC-1 showed a higher number of significant DDMs than the KRAS WT cell line BxPC-3. Directionality of DDMs also differed between cell lines, such as the increase in metabolites associated with amino acid and nucleotide metabolism in PANC-1 cells and the decrease in BxPC-3 cells. Canonical LXR-associated metabolites, such as cholesterol and its derivatives, were altered, as well as phospholipids, including both glycerophospholipids and sphingolipids. The results of metabolomic profiling highlight the implications of LXR signaling on PDAC metabolism and the resulting disruption of cholesterol and phospholipid metabolism.
Using the differentially expressed genes determined from treatments with 3A4, the expression of genes involved in cholesterol and phospholipid metabolism was found to be correlated with survival in the TCGA PAAD cohort (Supplementary Materials Figures S9 and S10). Lower expression of genes involved in various steps of cholesterol synthesis, such as ACAT2, DHCR7, SQLE, FDPS, and MSMO1, was found to be correlated with better overall survival. Similarly, lower expression levels of genes involved in phospholipid synthesis, remodeling, and transport, such as OSBPL5, PLBD1, PITPNM3, LPCAT2, LPCAT4, PNPLA3, CPNE3, SLC44A1, and PLA2R1, was also correlated with better overall survival. The clinical relevance of cholesterol and phospholipid metabolism in PDAC highlights a possible therapeutic strategy that is capable of being targeted by LXR inverse agonism. Both apoptotic and necroptotic cell death pathways were observed to be activated following treatments with 3A4. Considering the treatment resistance associated with PDAC, the induction of multiple death pathways offers a way to overcome one of the hallmarks of cancer: resistance to cell death [9]. Combination treatments of 3A4 with front-line chemotherapeutics, such as gemcitabine, may potentiate their cytotoxic effects and remain to be investigated, as does the in vivo efficacy of 3A4.

Supplementary Materials

The following supporting information can be downloaded at: https://www.mdpi.com/article/10.3390/receptors2010003/s1, File S1: Differential_expression_results_DMSO_vs_3A4.xlsx. Figure S1: Metabolite class enrichment of total DDMs is associated with amino acids and fatty acids. Figure S2: Metabolite pathway enrichment of total DDMs is associated with amino acid and glycerophospholipid metabolism. Figure S3: Lipid metabolite enrichment of total DDMs is associated with fatty acids and phospholipids. Figure S4: Integration of transcriptomics and metabolomics indicates glycerophospholipid metabolism is highly enriched. Figure S5: 3A4 affects the expression of cholesterol biosynthesis genes. Figure S6: Ceramide synthesis inhibition does not rescue the antiproliferative effects of 3A4. Figure S7: Morphological changes induced by 3A4 differ from apoptosis. Figure S8: LXRβ and its target genes are overexpressed in pancreatic cancer. Figure S9: Cholesterol synthesis genes are correlated with survival in PDAC patients. Figure S10: Phospholipid synthesis and remodeling genes are correlated with survival in PDAC patients.

Author Contributions

Conceptualization, C.-Y.L., S.W. and S.S.; methodology, C.-Y.L., S.W. and S.S.; software, S.W.; validation, S.W.; formal analysis, S.W.; investigation, S.W. and S.S.; resources, C.-Y.L.; data curation, S.W.; writing-original draft preparation, S.W.; writing-review and editing, C.-Y.L., S.W. and S.S.; visualization, S.W.; supervision, C.-Y.L. and S.W.; project administration, C.-Y.L. and S.W.; funding acquisition, C.-Y.L. All authors have read and agreed to the published version of the manuscript.

Funding

This research was funded by research grants awarded to C.-Y.L. from the William and Ella Owens Medical Research Foundation and Golfers Against Cancer.

Institutional Review Board Statement

Not applicable.

Informed Consent Statement

Not applicable.

Data Availability Statement

RNA-seq data (accession number GSE220620) is available on the Gene Expression Omnibus database.

Acknowledgments

We thank members of the Lin lab for helpful discussions regarding the study and the manuscript.

Conflicts of Interest

Chin-Yo Lin and Shivangi Srivastava are co-inventors on a patent application for the use of novel LXR ligands in cancer therapeutics.

References

  1. Rahib, L.; Smith, B.D.; Aizenberg, R.; Rosenzweig, A.B.; Fleshman, J.M.; Matrisian, L.M. Projecting cancer incidence and deaths to 2030: The unexpected burden of thyroid, liver, and pancreas cancers in the United States. Cancer Res. 2014, 74, 2913–2921. [Google Scholar] [CrossRef] [PubMed]
  2. Adamska, A.; Domenichini, A.; Falasca, M. Pancreatic Ductal Adenocarcinoma: Current and Evolving Therapies. Int. J. Mol. Sci. 2017, 18, 1338. [Google Scholar] [CrossRef]
  3. Orth, M.; Metzger, P.; Gerum, S.; Mayerle, J.; Schneider, G.; Belka, C.; Schnurr, M.; Lauber, K. Pancreatic ductal adenocarcinoma: Biological hallmarks, current status, and future perspectives of combined modality treatment approaches. Radiat. Oncol. 2019, 14, 141. [Google Scholar] [CrossRef]
  4. McGuigan, A.; Kelly, P.; Turkington, R.C.; Jones, C.; Coleman, H.G.; McCain, R.S. Pancreatic cancer: A review of clinical diagnosis, epidemiology, treatment and outcomes. World J. Gastroenterol. 2018, 24, 4846–4861. [Google Scholar] [CrossRef] [PubMed]
  5. Conroy, T.; Hammel, P.; Hebbar, M.; Ben Abdelghani, M.; Wei, A.C.; Raoul, J.-L.; Choné, L.; Francois, E.; Artru, P.; Biagi, J.J.; et al. FOLFIRINOX or Gemcitabine as Adjuvant Therapy for Pancreatic Cancer. N. Engl. J. Med. 2018, 379, 2395–2406. [Google Scholar] [CrossRef] [PubMed]
  6. Long, J.; Zhang, Y.; Yu, X.; Yang, J.; LeBrun, D.G.; Chen, C.; Yao, Q.; Li, M. Overcoming drug resistance in pancreatic cancer. Expert Opin. Ther. Targets 2011, 15, 817–828. [Google Scholar] [CrossRef] [PubMed]
  7. Siegel, R.L.; Miller, K.D.; Jemal, A. Cancer statistics, 2020. CA Cancer J. Clin. 2020, 70, 7–30. [Google Scholar] [CrossRef]
  8. Barberis, I.; Martini, M.; Iavarone, F.; Orsi, A. Hallmarks of Cancer: The Next Generation. J. Prev. Med. Hyg. 2016, 57, E41–E46. [Google Scholar]
  9. Swierczynski, J.; Hebanowska, A.; Sledzinski, T. Role of abnormal lipid metabolism in development, progression, diagnosis and therapy of pancreatic cancer. World J. Gastroenterol. 2014, 20, 2279–2303. [Google Scholar] [CrossRef]
  10. Medes, G.; Thomas, A.; Weinhouse, S. Metabolism of neoplastic tissue. IV. A study of lipid synthesis in neoplastic tissue slices in vitro. Cancer Res. 1953, 13, 27–29. [Google Scholar]
  11. Milgraum, L.Z.; Witters, L.A.; Pasternack, G.R.; Kuhajda, F.P. Enzymes of the fatty acid synthesis pathway are highly expressed in in situ breast carcinoma. Clin. Cancer Res. 1997, 3, 2115–2120. [Google Scholar]
  12. Joseph, S.B.; Laffitte, B.A.; Patel, P.H.; Watson, M.A.; Matsukuma, K.E.; Walczak, R.; Collins, J.L.; Osborne, T.F.; Tontonoz, P. Direct and Indirect Mechanisms for Regulation of Fatty Acid Synthase Gene Expression by Liver X Receptors. J. Biol. Chem. 2002, 277, 11019–11025. [Google Scholar] [CrossRef]
  13. Repa, J.J.; Liang, G.; Ou, J.; Bashmakov, Y.; Lobaccaro, J.-M.A.; Shimomura, I.; Shan, B.; Brown, M.S.; Goldstein, J.L.; Mangelsdorf, D.J. Regulation of mouse sterol regulatory by oxysterol receptors, LXR and LXR. Genes Dev. 2000, 36, 2819–2830. [Google Scholar] [CrossRef] [PubMed] [Green Version]
  14. Chu, K.; Miyazaki, M.; Man, W.C.; Ntambi, J.M. Stearoyl-Coenzyme A Desaturase 1 Deficiency Protects against Hypertriglyceridemia and Increases Plasma High-Density Lipoprotein Cholesterol Induced by Liver X Receptor Activation. Mol. Cell. Biol. 2006, 26, 6786–6798. [Google Scholar] [CrossRef] [PubMed]
  15. Song, C.; Kokontis, J.M.; Hiipakka, R.A.; Liao, S. Ubiquitous receptor: A receptor that modulates gene activation by retinoic acid and thyroid hormone receptors. Proc. Natl. Acad. Sci. USA 1994, 91, 10809–10813. [Google Scholar] [CrossRef] [PubMed]
  16. Jakobsson, T.; Treuter, E.; Gustafsson, J.-Å.; Steffensen, K.R. Liver X receptor biology and pharmacology: New pathways, challenges and opportunities. Trends Pharmacol. Sci. 2012, 33, 394–404. [Google Scholar] [CrossRef]
  17. Lin, C.-Y.; Vedin, L.-L.; Steffensen, K.R. The emerging roles of liver X receptors and their ligands in cancer. Expert Opin. Ther. Targets 2015, 20, 61–71. [Google Scholar] [CrossRef] [PubMed]
  18. Nguyen-Vu, T.; Vedin, L.-L.; Liu, K.; Jonsson, P.; Lin, J.Z.; Candelaria, N.R.; Candelaria, L.P.; Addanki, S.; Williams, C.; Gustafsson, J.; et al. Liver × receptor ligands disrupt breast cancer cell proliferation through an E2F-mediated mechanism. Breast Cancer Res. 2013, 15, R1–R12. [Google Scholar] [CrossRef] [PubMed]
  19. Vedin, L.L.; Gustafsson, J.A.; Steffensen, K.R. The oxysterol receptors lxrα and lxrβ suppress proliferation in the colon. Mol. Carcinog. 2013, 52, 835–844. [Google Scholar] [CrossRef]
  20. Pencheva, N.; Buss, C.; Posada, J.; Merghoub, T.; Tavazoie, S.F. Broad-Spectrum Therapeutic Suppression of Metastatic Melanoma through Nuclear Hormone Receptor Activation. Cell 2014, 156, 986–1001. [Google Scholar] [CrossRef]
  21. Guo, D.; Reinitz, F.; Youssef, M.; Hong, C.; Nathanson, D.; Akhavan, D.; Kuga, D.; Amzajerdi, A.N.; Soto, H.; Zhu, S.; et al. An LXR agonist promotes GBM cell death through inhibition of an EGFR/AKT/SREBP-1/LDLR-dependent pathway. Cancer Discov. 2011, 1, 442–456. [Google Scholar] [CrossRef] [PubMed]
  22. Candelaria, N.R.; Addanki, S.; Zheng, J.; Nguyen-Vu, T.; Karaboga, H.; Dey, P.; Gabbi, C.; Vedin, L.-L.; Liu, K.; Wu, W.; et al. Antiproliferative Effects and Mechanisms of Liver X Receptor Ligands in Pancreatic Ductal Adenocarcinoma Cells. PLoS ONE 2014, 9, e106289. [Google Scholar] [CrossRef] [PubMed]
  23. Karaboga, H.; Huang, W.; Srivastava, S.; Widmann, S.; Addanki, S.; Gamage, K.T.; Mazhar, Z.; Ebalunode, J.O.; Briggs, J.M.; Gustafsson, J.; et al. Screening of Focused Compound Library Targeting Liver X Receptors in Pancreatic Cancer Identified Ligands with Inverse Agonist and Degrader Activity. ACS Chem. Biol. 2020, 15, 2916–2928. [Google Scholar] [CrossRef]
  24. Pertea, M.; Kim, D.; Pertea, G.M.; Leek, J.T.; Salzberg, S.L. Transcript-level expression analysis of RNA-seq experiments with HISAT, StringTie and Ballgown. Nat. Protoc. 2016, 11, 1650–1667. [Google Scholar] [CrossRef] [PubMed]
  25. Love, M.I.; Huber, W.; Anders, S. Moderated estimation of fold change and dispersion for RNA-seq data with DESeq2. Genome Biol. 2014, 15, 550. [Google Scholar] [CrossRef] [PubMed]
  26. Subramanian, A.; Tamayo, P.; Mootha, V.K.; Mukherjee, S.; Ebert, B.L.; Gillette, M.A.; Paulovich, A.; Pomeroy, S.L.; Golub, T.R.; Lander, E.S.; et al. Gene set enrichment analysis: A knowledge-based approach for interpreting genome-wide expression profiles. Proc. Natl. Acad. Sci. USA 2005, 102, 15545–15550. [Google Scholar] [CrossRef]
  27. Evans, A.; Bridgewater, B.R.; Liu, Q.; Mitchell, M.W.; Robinson, R.J.; Dai, H.; Stewart, S.J.; DeHaven, C.D.; Miller, L.A.D. High Resolution Mass Spectrometry Improves Data Quantity and Quality as Compared to Unit Mass Resolution Mass Spectrometry in High-Throughput Profiling Metabolomics. Metabolomics 2014, 4, 1000132. [Google Scholar]
  28. Evans, A.M.; DeHaven, C.D.; Barrett, T.; Mitchell, M.; Milgram, E. Integrated, Nontargeted Ultrahigh Performance Liquid Chromatography/Electrospray Ionization Tandem Mass Spectrometry Platform for the Identification and Relative Quantification of the Small-Molecule Complement of Biological Systems. Anal. Chem. 2009, 81, 6656–6667. [Google Scholar] [CrossRef]
  29. DeHaven, C.D.; Evans, A.M.; Dai, H.; Lawton, K.A. Organization of GC/MS and LC/MS metabolomics data into chemical libraries. J. Chemin. 2010, 2, 9. [Google Scholar] [CrossRef]
  30. Van Beek, M.; Oravecz-Wilson, K.I.; Delekta, P.C.; Gu, S.; Li, X.; Jin, X.; Apel, I.J.; Konkle, K.S.; Feng, Y.; Teitelbaum, D.H.; et al. Bcl10 Links Saturated Fat Overnutrition with Hepatocellular NF-κB Activation and Insulin Resistance. Cell Rep. 2012, 1, 444–452. [Google Scholar] [CrossRef] [PubMed]
  31. Bilotta, M.T.; Petillo, S.; Santoni, A.; Cippitelli, M. Liver X Receptors: Regulators of Cholesterol Metabolism, Inflammation, Autoimmunity, and Cancer. Front. Immunol. 2020, 11, 584303C. [Google Scholar] [CrossRef] [PubMed]
  32. Hall, Z.; Wilson, C.H.; Burkhart, D.L.; Ashmore, T.; Evan, G.I.; Griffin, J.L. Myc linked to dysregulation of cholesterol transport and storage in nonsmall cell lung cancer. J. Lipid Res. 2020, 61, 1390–1399. [Google Scholar] [CrossRef] [PubMed]
  33. Chen, H.; Liu, H.; Qing, G. Targeting oncogenic Myc as a strategy for cancer treatment. Signal Transduct. Target. Ther. 2018, 3, 5. [Google Scholar] [CrossRef]
  34. Pelengaris, S.; Khan, M.; Evan, G. c-MYC: More than just a matter of life and death. Nat. Rev. Cancer 2002, 2, 764–776. [Google Scholar] [CrossRef] [PubMed]
  35. Christian, A.E.; Haynes, M.P.; Phillips, M.C.; Rothblat, G.H. Use of cyclodextrins for manipulating cellular cholesterol content. J. Lipid Res. 1997, 38, 2264–2272. [Google Scholar] [CrossRef] [PubMed]
  36. Flowers, M.; Fabrias, G.; Delgado, A.; Casas, J.; Abad, J.L.; Cabot, M.C. C6-Ceramide and targeted inhibition of acid ceramidase induce synergistic decreases in breast cancer cell growth. Breast Cancer Res. Treat. 2011, 133, 447–458. [Google Scholar] [CrossRef] [PubMed]
  37. Griffiths, B.; Lewis, C.A.; Bensaad, K.; Ros, S.; Zhang, Q.; Ferber, E.C.; Konisti, S.; Peck, B.; Miess, H.; East, P.; et al. Sterol regulatory element binding protein-dependent regulation of lipid synthesis supports cell survival and tumor growth. Cancer Metab. 2013, 1, 3. [Google Scholar] [CrossRef]
  38. Fritz, V.; Benfodda, Z.; Henriquet, C.; Hure, S.; Cristol, J.-P.; Michel, F.; Carbonneau, M.-A.; Casas, F.; Fajas, L. Metabolic intervention on lipid synthesis converging pathways abrogates prostate cancer growth. Oncogene 2012, 32, 5101–5110. [Google Scholar] [CrossRef]
  39. Ariyama, H.; Kono, N.; Matsuda, S.; Inoue, T.; Arai, H. Decrease in Membrane Phospholipid Unsaturation Induces Unfolded Protein Response. J. Biol. Chem. 2010, 285, 22027–22035. [Google Scholar] [CrossRef]
  40. Greer, Y.E.; Porat-Shliom, N.; Nagashima, K.; Stuelten, C.; Crooks, D.; Koparde, V.N.; Gilbert, S.F.; Islam, C.; Ubaldini, A.; Ji, Y.; et al. ONC201 kills breast cancer cells in vitro by targeting mitochondria. Oncotarget 2018, 9, 18454–18479. [Google Scholar] [CrossRef]
  41. McComb, S.; Aguadé-Gorgorió, J.; Harder, L.; Marovca, B.; Cario, G.; Eckert, C.; Schrappe, M.; Stanulla, M.; von Stackelberg, A.; Bourquin, J.-P.; et al. Activation of concurrent apoptosis and necroptosis by SMAC mimetics for the treatment of refractory and relapsed ALL. Sci. Transl. Med. 2016, 8, 339ra70. [Google Scholar] [CrossRef] [PubMed]
  42. Collins, J.L.; Fivush, A.M.; Watson, M.A.; Galardi, C.M.; Lewis, M.C.; Moore, L.B.; Parks, D.J.; Wilson, J.G.; Tippin, T.K.; Binz, J.G.; et al. Identification of a Nonsteroidal Liver X Receptor Agonist through Parallel Array Synthesis of Tertiary Amines. J. Med. Chem. 2002, 45, 1963–1966. [Google Scholar] [CrossRef] [PubMed]
  43. Schultz, J.R.; Tu, H.; Luk, A.; Repa, J.J.; Medina, J.C.; Li, L.; Schwendner, S.; Wang, S.; Thoolen, M.; Mangelsdorf, D.J.; et al. Role of LXRs in control of lipogenesis. Genes Dev. 2000, 14, 2831–2838. [Google Scholar] [CrossRef] [PubMed]
  44. Repa, J.J.; Liang, G.; Ou, J.; Bashmakov, Y.; Lobaccaro, J.M.A.; Shimomura, I.; Shan, B.; Brown, M.S.; Goldstein, J.L.; Mangelsdorf, D.J. Regulation of mouse sterol regulatory element-binding protein-1c gene (SREBP-1c) by oxysterol receptors, LXRα and LXRβ. Genes Dev. 2000, 14, 2819–2830. [Google Scholar] [CrossRef] [PubMed] [Green Version]
  45. Katz, A.; Udata, C.; Ott, E.; Hickey, L.; Burczynski, M.E.; Burghart, P.; Vesterqvist, O.; Meng, X. Safety, pharmacokinetics, and pharmacodynamics of single doses of lxr-623, a novel liver X-receptor agonist, in healthy participants. J. Clin. Pharmacol. 2009, 49, 643–649. [Google Scholar] [CrossRef]
  46. Flaveny, C.A.; Griffett, K.; El-Gendy, B.E.-D.M.; Kazantzis, M.; Sengupta, M.; Amelio, A.L.; Chatterjee, A.; Walker, J.; Solt, L.A.; Kamenecka, T.M.; et al. Broad Anti-tumor Activity of a Small Molecule that Selectively Targets the Warburg Effect and Lipogenesis. Cancer Cell 2015, 28, 42–56. [Google Scholar] [CrossRef]
  47. Deer, E.L.; González-Hernández, J.; Coursen, J.D.; Shea, J.E.; Ngatia, J.; Scaife, C.L.; Firpo, M.A.; Mulvihill, S.J. Phenotype and Genotype of Pancreatic Cancer Cell Lines. Pancreas 2010, 39, 425–435, Erratum in Pancreas 2018, 47, e37. [Google Scholar] [CrossRef]
  48. Gu, L.; Saha, S.T.; Thomas, J.; Kaur, M. Targeting cellular cholesterol for anticancer therapy. FEBS J. 2019, 286, 4192–4208. [Google Scholar] [CrossRef]
  49. Li, Y.C.; Park, M.J.; Ye, S.-K.; Kim, C.-W.; Kim, Y.-N. Elevated Levels of Cholesterol-Rich Lipid Rafts in Cancer Cells Are Correlated with Apoptosis Sensitivity Induced by Cholesterol-Depleting Agents. Am. J. Pathol. 2006, 168, 1107–1118. [Google Scholar] [CrossRef] [PubMed]
  50. Miller, D.M.; Thomas, S.D.; Islam, A.; Muench, D.; Sedoris, K. c-Myc and Cancer Metabolism. Clin. Cancer Res. 2012, 18, 5546–5553. [Google Scholar] [CrossRef] [PubMed]
  51. Klefstrom, J.; Västrik, I.; Saksela, E.; Valle, J.; Eilers, M.; Alitalo, K. c-Myc induces cellular susceptibility to the cytotoxic action of TNF-alpha. EMBO J. 1994, 13, 5442–5450. [Google Scholar] [CrossRef] [PubMed]
Figure 1. Gene expression changes induced by 3A4 are more pronounced in KRAS mutants and are associated with increased stress responses and decreased lipid metabolism. (a) Volcano plots of DEGs (vs. vehicle treatment). Red denotes statistically significant upregulated genes and blue denotes downregulated genes. Horizontal dashed lines depict log2-fold change +/−1. (b) Venn diagrams of statistically significant, differentially expressed genes (FPKM > 1, adjusted p-value < 0.05). (c) Gene set enrichment analysis results. Mean normalized enrichment scores among all cell lines are shown. Color represents statistical significance (q-value).
Receptors 02 00003 g001
Figure 2. Treatment with 3A4 causes disruptions in cholesterol and phospholipid metabolites. (a) Pathway maps of statistically significant metabolites altered by 3A4 in BxPC-3 (left) and PANC-1 (right) cell lines. Red denotes upregulated metabolites and blue denotes downregulated metabolites (vs. DMSO). Node size correlates to magnitude of change. (b) Boxplots of differentially detected metabolites related to cholesterol and phospholipid metabolism. (c) Heatmap of log2-fold changes (vs. DMSO) for all lipid metabolites profiled. Side color bar indicates specific pathway. * p < 0.05, ** p < 0.01, *** p < 0.001, **** p < 0.0001, ns = nonsignificant.
Receptors 02 00003 g002
Figure 3. PDAC cells are sensitive to alterations in cholesterol and ceramide levels caused by 3A4. (a) 3A4 rescue assay with cyclodextrin. 10 µM treatments of 3A4 with concurrent treatments of cyclodextrin at stated concentrations. (b) 3A4 rescue assay with cyclodextrin in lipid-depleted serum. 10 µM treatments of 3A4 with concurrent treatments of cyclodextrin at stated concentrations. (c) 3A4 rescue assay with cyclodextrin and cholesterol in lipid-depleted serum. 10 µM treatments of 3A4 with concurrent treatments of cyclodextrin (10 mM) and cholesterol at stated concentrations. (d) C6-ceramide assays with 10 µM treatments of 3A4. (e) C6-ceramide assays with the PANC-1 cell line and 15 µM treatments of 3A4. * p < 0.05, ** p < 0.01, *** p < 0.001, **** p < 0.0001, ns = nonsignificant.
Receptors 02 00003 g003
Figure 4. 3A4 induces both apoptosis and necroptosis. (a) Caspase-3/7 activity assay. (b) Western blotting of 48 h treatments of 3A4 in MIA PaCa-2 and PANC-1 cell lines. (c) Pan-caspase inhibition assay. (d) RIPK1 inhibition assay. (e) Pan-caspase and RIPK1 concurrent inhibition assay. (f) Pan-caspase and MLKL concurrent inhibition assay. STS = staurosporine. * p < 0.05, ** p < 0.01, *** p < 0.001, ns = nonsignificant.
Receptors 02 00003 g004
Disclaimer/Publisher’s Note: The statements, opinions and data contained in all publications are solely those of the individual author(s) and contributor(s) and not of MDPI and/or the editor(s). MDPI and/or the editor(s) disclaim responsibility for any injury to people or property resulting from any ideas, methods, instructions or products referred to in the content.

