
Association between Anthropometric Measurements and Vascular Disease: A Cross Sectional Study

 , , , and
Abstract
:1. Introduction
2. Materials and Methods
2.1. Design
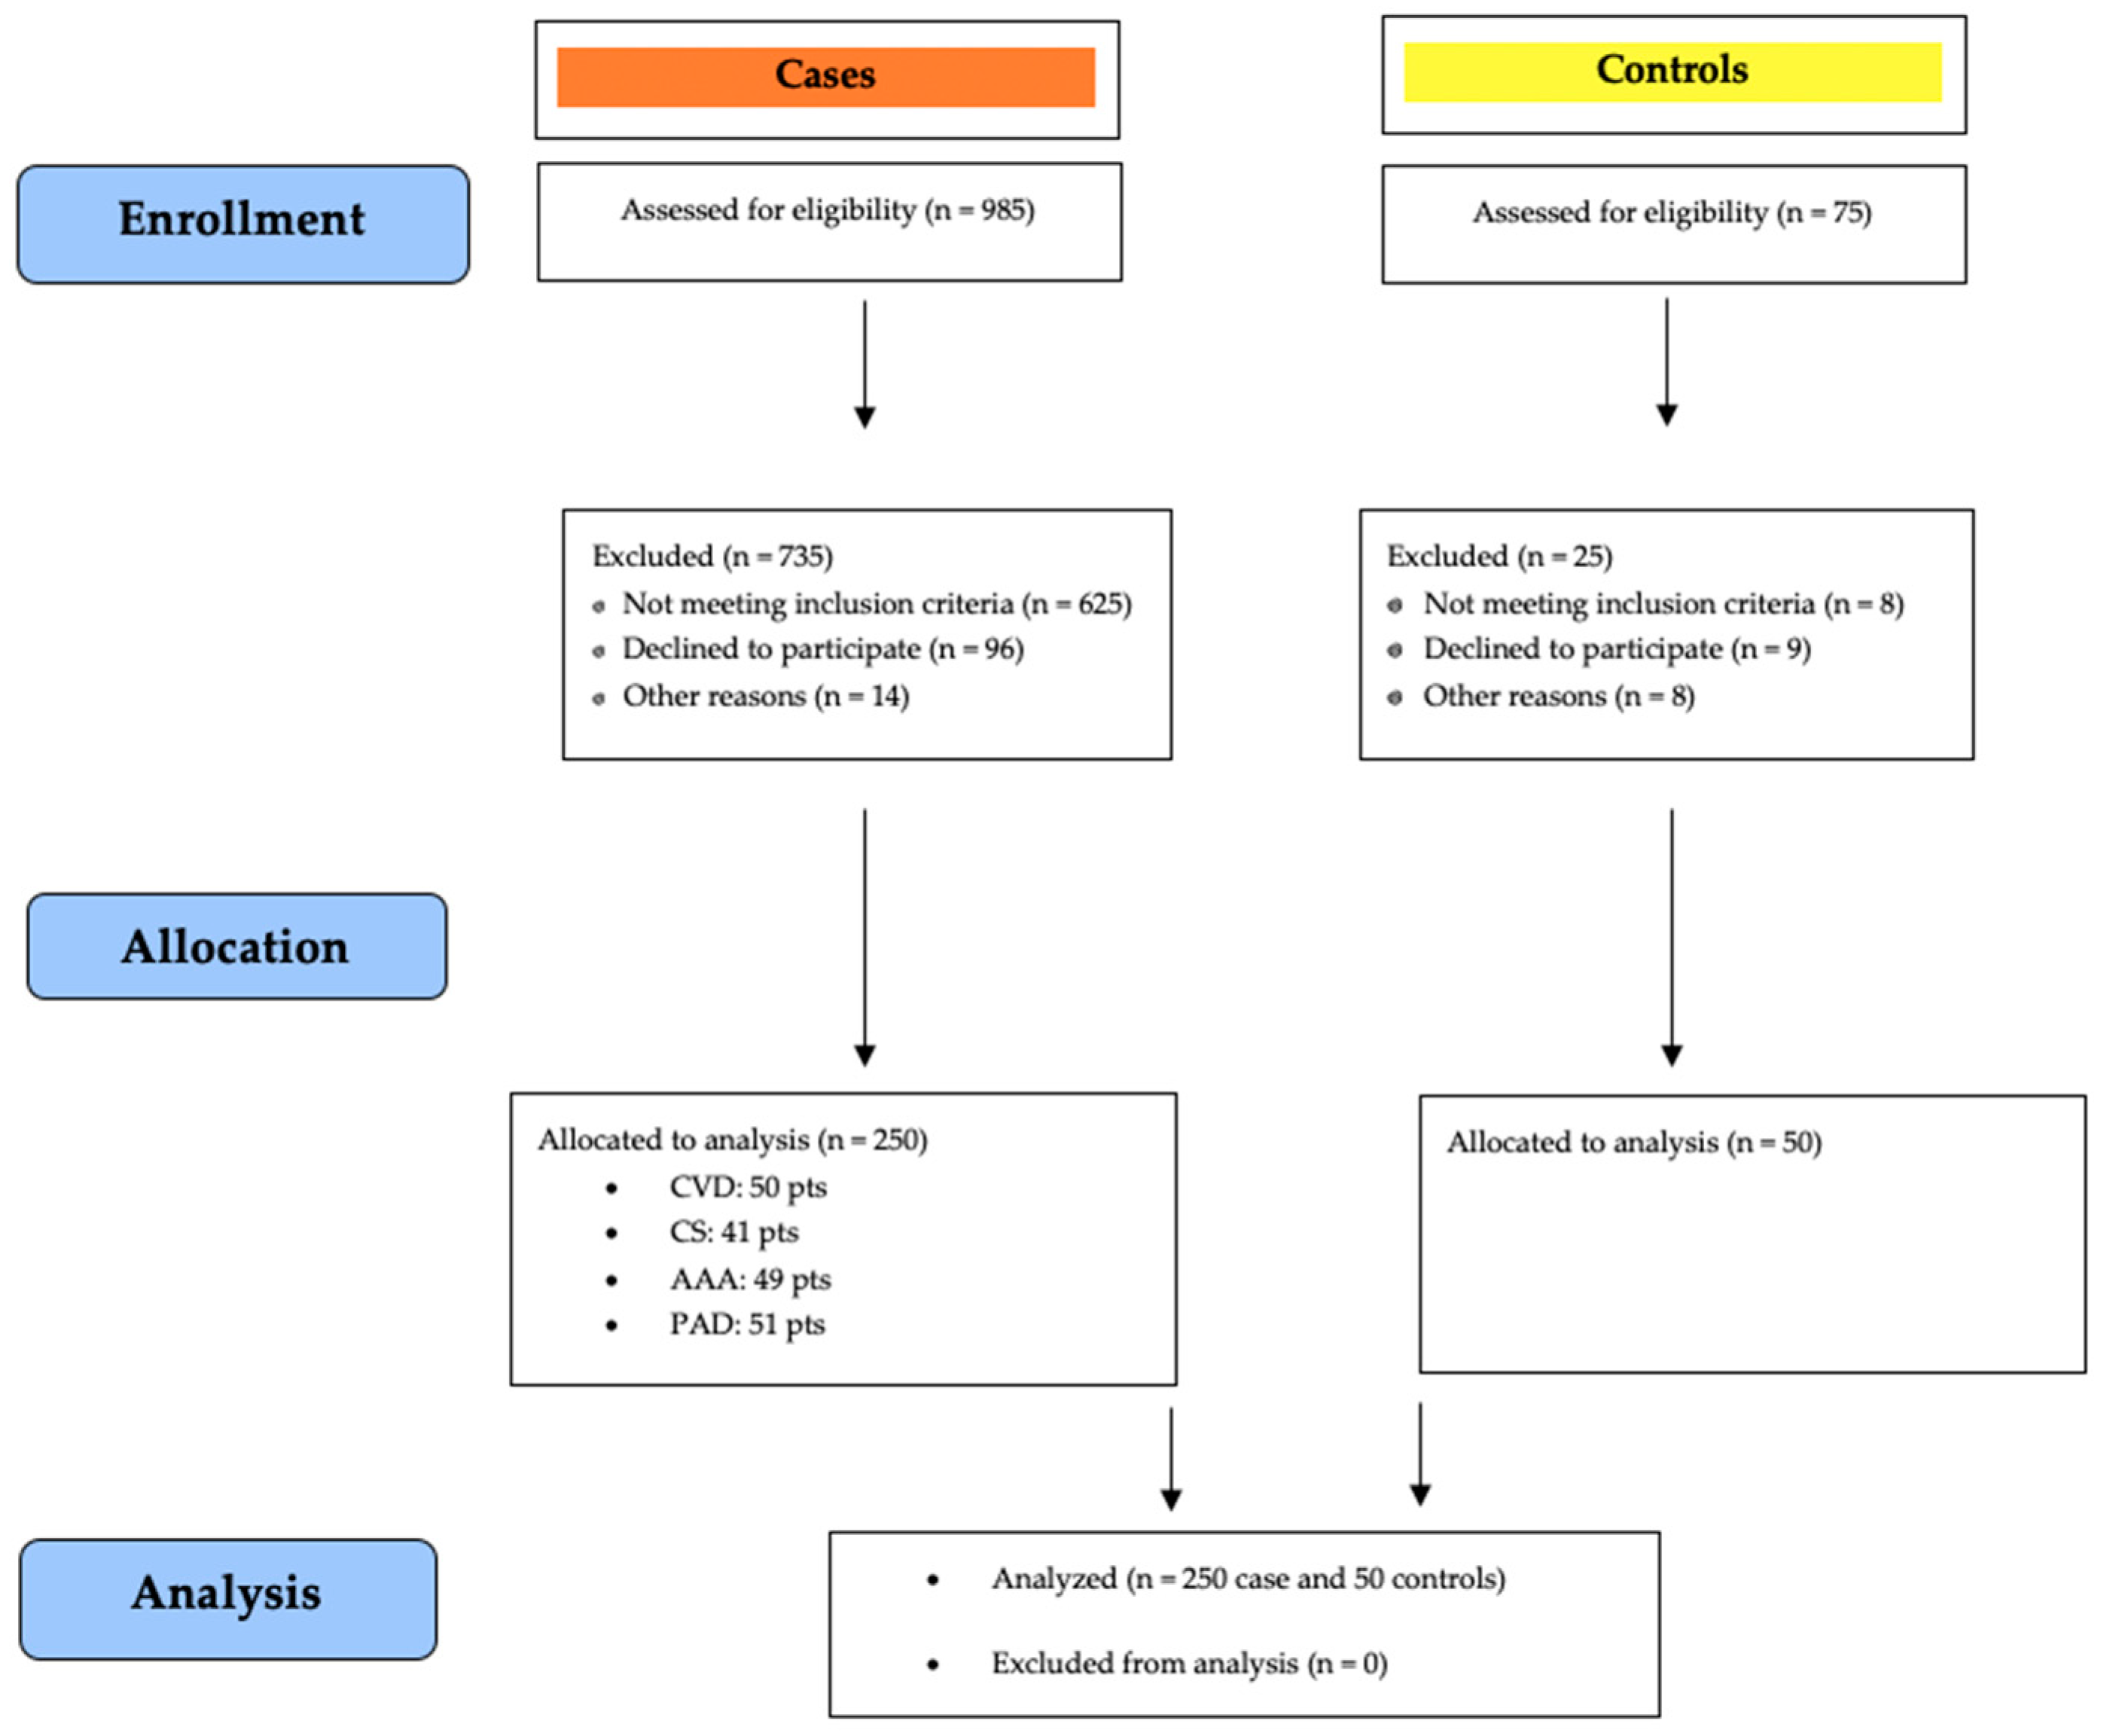
2.2. Participants
2.3. Vascular Diagnostics
2.4. Measurements
2.5. Data Analysis
3. Results
4. Discussion
Author Contributions
Funding
Institutional Review Board Statement
Informed Consent Statement
Data Availability Statement
Conflicts of Interest
References
- Barnes, R.W. Vascular holism: The epidemiology of vascular disease. Ann. Vasc. Surg. 1995, 9, 576–582. [Google Scholar] [CrossRef] [PubMed]
- Blais, C.; Rochette, L.; Ouellet, S.; Huynh, T. Complex Evolution of Epidemiology of Vascular Diseases, Including Increased Disease Burden: From 2000 to 2015. Can. J. Cardiol. 2020, 36, 740–746. [Google Scholar] [CrossRef] [PubMed]
- Federman, D.G.; Trent, J.T.; Froelich, C.W.; Demirovic, J.; Kirsner, R.S. Epidemiology of peripheral vascular disease: A predictor of systemic vascular disease. Ostomy Wound Manag. 1998, 44, 58–62. [Google Scholar]
- Marcaccio, C.L.; Schermerhorn, M.L. Epidemiology of abdominal aortic aneurysms. Semin. Vasc. Surg. 2021, 34, 29–37. [Google Scholar] [CrossRef]
- Serra, R.; Grande, R.; Butrico, L.; Fugetto, F.; de Franciscis, S. Epidemiology, diagnosis and treatment of chronic venous disease: A systematic review. Chirurgia 2016, 29, 34–45. [Google Scholar]
- de Weerd, M.; Greving, J.P.; de Jong, A.W.; Buskens, E.; Bots, M.L. Prevalence of asymptomatic carotid artery stenosis according to age and sex: Systematic review and metaregression analysis. Stroke 2009, 40, 1105–1113. [Google Scholar] [CrossRef] [Green Version]
- Firnhaber, J.M.; Powell, C.S. Lower Extremity Peripheral Artery Disease: Diagnosis and Treatment. Am. Fam. Physician 2019, 99, 362–369. [Google Scholar]
- Haque, K.; Bhargava, P. Abdominal Aortic Aneurysm. Am. Fam. Physician 2022, 106, 165–172. [Google Scholar]
- Cundy, J.B. Carotid artery stenosis and endarterectomy. AORN J. 2002, 75, 310–332. [Google Scholar] [CrossRef]
- Padilla, C.J.; Ferreyro, F.A.; Arnold, W.D. Anthropometry as a readily accessible health assessment of older adults. Exp. Gerontol. 2021, 153, 111464. [Google Scholar] [CrossRef]
- Zhu, Q.; Wang, X.B.; Yao, Y.; Ning, C.X.; Chen, X.P.; Luan, F.X.; Zhao, Y.L. Association between anthropometric measures and cardiovascular disease (CVD) risk factors in Hainan centenarians: Investigation based on the Centenarian’s health study. BMC Cardiovasc. Disord. 2018, 18, 73. [Google Scholar] [CrossRef] [PubMed]
- Dhana, K.; Ikram, M.A.; Hofman, A.; Franco, O.H.; Kavousi, M. Anthropometric measures in cardiovascular disease prediction: Comparison of laboratory-based versus non-laboratory-based model. Heart 2015, 101, 377–383. [Google Scholar] [CrossRef] [PubMed]
- Vlajinac, H.D.; Marinkovic, J.M.; Maksimovic, M.Z.; Matic, P.A.; Radak, D.J. Body mass index and primary chronic venous disease--a cross-sectional study. Eur. J. Vasc. Endovasc. Surg. 2013, 45, 293–298. [Google Scholar] [CrossRef] [PubMed] [Green Version]
- Hsuan, C.F.; Lin, F.J.; Lee, T.L.; Yang, K.C.; Tseng, W.K.; Wu, Y.W.; Yin, W.H.; Yeh, H.I.; Chen, J.W.; Wu, C.C. Taiwanese Secondary Prevention for Patients with AtheRosCLErotic Disease (T-SPARCLE) Registry Investigators. The waist-to-body mass index ratio as an anthropometric predictor for cardiovascular outcome in subjects with established atherosclerotic cardiovascular disease. Sci. Rep. 2022, 12, 804. [Google Scholar] [PubMed]
- Chávez-Sosa, J.V.; Rojas-Humpire, R.; Gutierrez-Ajalcriña, R.; Huancahuire-Vega, S. Association between lifestyles, anthropometric measurements and peripheral arterial disease in public sector health workers. Am. J. Cardiovasc. Dis. 2021, 11, 194–202. [Google Scholar]
- Sampa, M.B.; Hoque, M.R.; Hossain, M.N. Impacts of Anthropometric, Biochemical, Socio-demographic, and Dietary Habits Factors on the Health Status of Urban Corporate People in a Developing Country. Healthcare 2020, 8, 188. [Google Scholar] [CrossRef]
- Yates-Doerr, E. Reworking the Social Determinants of Health: Responding to Material-Semiotic Indeterminacy in Public Health Interventions. Med. Anthropol. Q. 2020, 34, 378–397. [Google Scholar] [CrossRef]
- Scicali, R.; Rosenbaum, D.; Di Pino, A.; Giral, P.; Cluzel, P.; Redheuil, A.; Piro, S.; Rabuazzo, A.M.; Purrello, F.; Bruckert, E.; et al. An increased waist-to-hip ratio is a key determinant of atherosclerotic burden in overweight subjects. Acta Diabetol. 2018, 55, 741–749. [Google Scholar] [CrossRef]
- Lurie, F.; Passman, M.; Meisner, M.; Dalsing, M.; Masuda, E.; Welch, H.; Bush, R.L.; Blebea, J.; Carpentier, P.H.; De Maeseneer, M.; et al. The 2020 update of the CEAP classification system and reporting standards. J. Vasc. Surg. Venous Lymphat. Disord. 2020, 8, 342–352, correction in J. Vasc. Surg. Venous Lymphat. Disord. 2021, 9, 288. [Google Scholar] [CrossRef] [PubMed]
- Rutherford, R.B.; Baker, J.D.; Ernst, C.; Johnston, K.W.; Porter, J.M.; Ahn, S.; Jones, D.N. Recommended standards for reports dealing with lower extremity ischemia: Revised version. J. Vasc. Surg. 1997, 26, 517–538, correction in J. Vasc. Surg. 2001, 33, 805. [Google Scholar] [CrossRef] [PubMed] [Green Version]
- Paajanen, T.A.; Oksala, N.K.; Kuukasjärvi, P.; Karhunen, P.J. Short stature is associated with coronary heart disease: A systematic review of the literature and a meta-analysis. Eur. Heart J. 2010, 31, 1802–1809. [Google Scholar] [CrossRef] [PubMed] [Green Version]
- Medina-Inojosa, J.R.; Batsis, J.A.; Supervia, M.; Somers, V.K.; Thomas, R.J.; Jenkins, S.; Grimes, C.; Lopez-Jimenez, F. Relation of Waist-Hip Ratio to Long-Term Cardiovascular Events in Patients with Coronary Artery Disease. Am. J. Cardiol. 2018, 121, 903–909. [Google Scholar] [CrossRef]
- Takada, M.; Yamagishi, K.; Tamakoshi, A.; Iso, H. Height and Mortality from Aortic Aneurysm and Dissection. J. Atheroscler. Thromb. 2022, 29, 1166–1175. [Google Scholar] [CrossRef] [PubMed]
- Lindquist Liljeqvist, M.; Hultgren, R.; Siika., A.; Gasser, T.C.; Roy, J. Gender, smoking, body size, and aneurysm geometry influence the biomechanical rupture risk of abdominal aortic aneurysms as estimated by finite element analysis. J. Vasc. Surg. 2017, 65, 1014–1021.e4. [Google Scholar] [CrossRef] [PubMed] [Green Version]
- Emerging Risk Factors Collaboration. Adult height and the risk of cause-specific death and vascular morbidity in 1 million people: Individual participant meta-analysis. Int. J. Epidemiol. 2012, 41, 1419–1433. [Google Scholar] [CrossRef] [PubMed]
- Khosla, S.; Morris, D.R.; Moxon, J.V.; Walker, P.J.; Gasser, T.C.; Golledge, J. Meta-analysis of peak wall stress in ruptured, symptomatic and intact abdominal aortic aneurysms. Br. J. Surg. 2014, 101, 1350–1357. [Google Scholar] [CrossRef]
- Indrakusuma, R.; Jalalzadeh, H.; Planken, R.N.; Marquering, H.A.; Legemate, D.A.; Koelemay, M.J.; Balm, R. Biomechanical Imaging Markers as Predictors of Abdominal Aortic Aneurysm Growth or Rupture: A Systematic Review. Eur. J. Vasc. Endovasc. Surg. 2016, 52, 475–486. [Google Scholar] [CrossRef] [Green Version]
- Lee, A.J.; Evans, C.J.; Allan, P.L.; Ruckley, C.V.; Fowkes, F.G. Lifestyle factors and the risk of varicose veins: Edinburgh Vein Study. J. Clin. Epidemiol. 2003, 56, 171–179. [Google Scholar] [CrossRef]
- Sorte, S.R.; Waghmare, L.; Banode, P.; Srivastava, T.; Biswas, D. Effect of height on chronic venous insufficiency patients of rural Wardha: A cross sectional study. IJSR 2012, 3, 977–981. [Google Scholar]
- Laurikka, J.O.; Sisto, T.; Tarkka, M.R.; Auvinen, O.; Hakama, M. Risk indicators for varicose veins in forty- to sixty-year-olds in the Tampere varicose vein study. World J. Surg. 2002, 26, 648–651. [Google Scholar] [CrossRef] [PubMed]
- Komsuoğlu, B.; Göldeli, O.; Kulan, K.; Cetinarslan, B.; Komsuoğlu, S.S. Prevalence and risk factors of varicose veins in an elderly population. Gerontology 1994, 40, 25–31. [Google Scholar] [CrossRef]
- Guberan, E.; Widmer, L.K.; Glaus, L.; Muller, R.; Rougemont, A.; Da Silva, A.; Gendre, F. Causative factors of varicose veins: Myths and facts. An epidemiological study of 610 women. Vasa 1973, 2, 115–120. [Google Scholar] [PubMed]
- Hirai, M.; Naiki, K.; Nakayama, R. Prevalence and risk factors of varicose veins in Japanese women. Angiology 1990, 41, 228–232. [Google Scholar] [CrossRef] [PubMed]
- Serra, R.; Gallelli, L.; Perri, P.; De Francesco, E.M.; Rigiracciolo, D.C.; Mastroroberto, P.; Maggiolini, M.; de Franciscis, S. Estrogen Receptors and Chronic Venous Disease. Eur. J. Vasc. Endovasc. Surg. 2016, 52, 114–118. [Google Scholar] [CrossRef] [PubMed] [Green Version]
- Latheef, S.A.A.; Subramanyam, G.; Reddy, B.M. Utility of anthropometric traits and indices in predicting the risk of coronary artery disease in the adult men of southern Andhra Pradesh. Indian Heart J. 2018, 70 (Suppl. 3), S133–S139. [Google Scholar] [CrossRef] [PubMed]


| Overall (N = 250) | CTRL (n = 50/250) | CVD (n = 59/250) | CS (n = 41/250) | AAA (n = 49/250) | PAD (n = 51/250) | p-Value (<0.05) | |
|---|---|---|---|---|---|---|---|
| Subject clinical characteristics | |||||||
| Age (years) | 65.2 ± 13.3 | 66 ± 12.8 | 60 ± 16.1 | 66.8 ± 11.9 | 67.7 ± 9.9 | 66.8 ± 13.3 | 0.086 |
| - | - | 60 ± 16.1 | - | 67.7 ± 9.9 | - | 0.022 | |
| Males | 155/250 (62%) | 32/50 (64%) | 22/59 (37.2%) | 27/41 (65.8%) | 40/49 (81.6%) | 34/51 (66.6%) | <0.001 |
| - | 32/50 (64%) | 22/59 (37.2%) | - | - | - | 0.009 | |
| - | - | 22/59 (37.2%) | 27/41 (65.8%) | - | - | 0.009 | |
| - | - | 22/59 (37.2%) | - | 40/49 (81.6%) | - | <0.001 | |
| - | - | 22/59 (37.2%) | - | - | 34/51 (66.6%) | 0.003 | |
| Current smoker | 76/250 (30.4%) | 14/50 (28%) | 9/59 (15.2%) | 11/41 (26.8%) | 25/49 (51%) | 17/51 (33.3%) | 0.002 |
| - | 14/50 (28%) | - | - | 25/49 (51%) | - | 0.032 | |
| - | - | 9/59 (15.2%) | - | 25/49 (51%) | - | <0.001 | |
| - | - | 9/59 (15.2%) | - | - | 17/51 (33.3%) | 0.045 | |
| - | - | - | 11/41 (26.8%) | 25/49 (51%) | - | 0.034 | |
| Hypertension | 169/250 (67.6%) | 38/50 (76%) | 28/59 (47.4%) | 30/41 (73.1%) | 36/49 (73.4%) | 37/51 (72.5%) | 0.006 |
| - | 38/50 (76%) | 28/59 (47.4%) | - | - | - | 0.004 | |
| - | - | 28/59 (47.4%) | - | - | 37/51 (72.5%) | 0.013 | |
| - | - | 28/59 (47.4%) | 30/41 (73.1%) | - | - | 0.018 | |
| - | - | 28/59 (47.4%) | - | 36/49 (73.4%) | - | 0.011 | |
| Diabetes | 90/250 (36%) | 17/50 (34%) | 12/59 (20.3%) | 16/41 (39%) | 12/49 (24.4%) | 33/51 (64.7%) | <0.001 |
| - | 17/50 (34%) | - | - | - | 33/51 (64.7%) | 0.003 | |
| - | - | 12/59 (20.3%) | - | - | 33/51 (64.7%) | <0.001 | |
| - | - | - | 16/41 (39%) | - | 33/51 (64.7%) | 0.024 | |
| 12/49 (24.4%) | 33/51 (64.7%) | <0.001 | |||||
| Dyslipidemia | 117/250 (46.8%) | 23/50 (46%) | 22/59 (37.2%) | 25/41 (60.9%) | 19/49 (38.7%) | 28/51 (54.9%) | 0.088 |
| - | - | 22/59 (37.2%) | 25/41 (60.9%) | - | - | 0.033 | |
| Coronary Artery Disease | 75/250 (30%) | 14/50 (28%) | 15/59 (25.4%) | 13/41 (31.7%) | 16/49 (32.6%) | 17/51 (33.3%) | 0.882 |
| Chronic Kidney Disease | 33/250 (13.2%) | 3/50 (6%) | 6/59 (10.1%) | 6/41 (14.6%) | 9/49 (18.3%) | 9/51 (17.6%) | 0.305 |
| CTRL (n = 50/250) | CVD (n = 59/250) | CS (n = 41/250) | AAA (n = 49/250) | PAD (n = 51/250) | p-Value (<0.05) | |
|---|---|---|---|---|---|---|
| Anthropometric characteristics | ||||||
| Weight (kg) | ||||||
| 82.2 ± 18.7 | 79.9 ± 18.6 | 78.6 ± 14.3 | 80.4 ± 13.6 | 86.7 ± 24.6 | 0.232 |
| 81 ± 16.3 | 86.7 ± 16.7 | 80.6 ± 10.6 | 81.9 ± 13.6 | 85.2 ± 16.3 | 0.610 |
| 84.3 ± 22.5 | 75.8 ± 18.7 | 74.7 ± 19.4 | 73.5 ± 11.9 | 89.6 ± 25.8 | 0.351 |
| Height (cm) | ||||||
| 168 ± 8.4 | 165 ± 8.6 | 168.9 ± 7.7 | 169.8 ± 8.5 | 166.2 ± 7.4 | 0.621 |
| - | 165 ± 8.6 | - | 169.8 ± 8.5 | - | 0.017 | |
| 171.9 ± 6.1 | 173.4 ± 4.2 | 171.7 ± 6.3 | 172.7 ± 5.8 | 169.2 ± 6.7 | 0.107 |
| 161 ± 7.4 | 159.8 ± 6.2 | 163.5 ± 7.5 | 156.6 ± 5.5 | 160.3 ± 4.8 | 0.679 |
| BMI (kg/m2) | ||||||
| 29.1 ± 6.8 | 29.1 ± 6.4 | 27.6 ± 5.6 | 27.9 ± 4.3 | 31.4 ± 9 | 0.267 |
| 27.3 ± 5 | 28.2 ± 5.7 | 27.4 ± 4.2 | 27.4 ± 3.9 | 29.6 ± 8.3 | 0.222 |
| 32.4 ± 8.4 | 29.6 ± 6.8 | 28 ± 7.8 | 29.9 ± 5.3 | 35 ± 9.6 | 0.244 |
| Waist circumference (cm) | ||||||
| 100.7 ± 19.3 | 102.4 ± 17.9 | 99.5 ± 13.4 | 98.3 ± 15 | 105.8 ± 22.5 | 0.446 |
| 96.8 ± 15.7 | 103.8 ± 16.1 | 99.5 ± 13 | 97.4 ± 14.8 | 102.3 ± 21.8 | 0.552 |
| 107.6 ± 23.3 | 101.6 ± 19.1 | 99.5 ± 14.9 | 102.3 ± 16 | 113 ± 22.8 | 0.321 |
| WHR | ||||||
| 0.932 ± 0.07 | 0.918 ± 0.09 | 0.978 ± 0.06 | 0.953 ± 0.08 | 0.950 ± 0.09 | 0.055 |
| - | 0.918 ± 0.09 | 0.978 ± 0.06 | - | - | 0.005 | |
| 0.955 ± 0.04 | 0.955 ± 0.11 | 0.984 ± 0.05 | 0.975 ± 0.05 | 0.956 ± 0.09 | 0.652 |
| 0.892 ± 0.09 | 0.895 ± 0.08 | 0.966 ± 0.08 | 0.854 ± 0.12 | 0.939 ± 0.08 | 0.192 |
| WSR | ||||||
| 0.614 ± 0.149 | 0.638 ± 0.139 | 0.592 ± 0.101 | 0.593 ± 0.121 | 0.663 ± 0.202 | 0.437 |
| 0.572 ± 0.121 | 0.629 ± 0.148 | 0.586 ± 0.102 | 0.567 ± 0.09 | 0.643 ± 0.222 | 0.284 |
| 0.688 ± 0.169 | 0.643 ± 0.135 | 0.606 ± 0.102 | 0.710 ± 0.148 | 0.702 ± 0.154 | 0.413 |
| ABSI | ||||||
| 0.0818 ± 0.008 | 0.0836 ± 0.007 | 0.0837 ± 0.009 | 0.0815 ± 0.008 | 0.0826 ± 0.01 | 0.889 |
| 0.0810 ± 0.007 | 0.0837 ± 0.005 | 0.0831 ± 0.007 | 0.0809 ± 0.008 | 0.0823 ± 0.009 | 0.995 |
| 0.0831 ± 0.009 | 0.0835 ± 0.008 | 0.0849 ± 0.011 | 0.0843 ± 0.009 | 0.0833 ± 0.010 | 0.878 |
| Height ≥ 170 mm a | Odds Ratio | 95% CI | p-Value (<0.05) |
|---|---|---|---|
| CVD 23/59 (38.9%) vs. AAA 39/49 (61.2%) | 2.45 | [1.06; 5.79] | 0.033 |
| WHR ≥ 0.980 a | |||
| CVD 13/59 (22%) vs. CS 21/41 (51.2%) | 3.66 | [1.43; 9.72] | 0.004 |
Disclaimer/Publisher’s Note: The statements, opinions and data contained in all publications are solely those of the individual author(s) and contributor(s) and not of MDPI and/or the editor(s). MDPI and/or the editor(s) disclaim responsibility for any injury to people or property resulting from any ideas, methods, instructions or products referred to in the content. |
© 2023 by the authors. Licensee MDPI, Basel, Switzerland. This article is an open access article distributed under the terms and conditions of the Creative Commons Attribution (CC BY) license (https://creativecommons.org/licenses/by/4.0/).
Share and Cite
Costa, D.; Andreucci, M.; Isabella, F.; Ielapi, N.; Peluso, A.; Bracale, U.M.; Serra, R. Association between Anthropometric Measurements and Vascular Disease: A Cross Sectional Study. J. Vasc. Dis. 2023, 2, 13-22. https://doi.org/10.3390/jvd2010002
Costa D, Andreucci M, Isabella F, Ielapi N, Peluso A, Bracale UM, Serra R. Association between Anthropometric Measurements and Vascular Disease: A Cross Sectional Study. Journal of Vascular Diseases. 2023; 2(1):13-22. https://doi.org/10.3390/jvd2010002
Chicago/Turabian StyleCosta, Davide, Michele Andreucci, Francesco Isabella, Nicola Ielapi, Antonio Peluso, Umberto Marcello Bracale, and Raffaele Serra. 2023. "Association between Anthropometric Measurements and Vascular Disease: A Cross Sectional Study" Journal of Vascular Diseases 2, no. 1: 13-22. https://doi.org/10.3390/jvd2010002