
An Event Study of the Ethereum Transition to Proof-of-Stake


Department of Economics, Rutgers University, 75 Hamilton Street, New Brunswick, NJ 08901, USA
*
Author to whom correspondence should be addressed.
†
These authors contributed equally to this work.
Commodities 2023, 2(2), 96-110; https://doi.org/10.3390/commodities2020006
Submission received: 28 February 2023
/
Revised: 16 March 2023
/
Accepted: 20 March 2023
/
Published: 29 March 2023
Abstract
:On 15 September 2022, the Ethereum network adopted a proof-of-stake (PoS) consensus mechanism. We study the impact on the network and competing platforms in a two month event window around the Beacon chain merge. We find that the transition to PoS has reduced energy consumption by 99.98%. Miners have not transformed into validators, and total block reward income (in USD) has fallen by 97%, though transaction fees (in ETH) for Ether have increased nearly 10%. The Herfindahl index for the top 10 is 1009; the network is 19% less concentrated after the merge. Ethereum supply growth has been deflationary since the merge. The time between consecutive blocks is now steady at 12 s and transactions per day are up 7.0%. On Polygon, Matic fees rose but token fees fell. Polygon also slows, processing 3.3% fewer transactions per day. Solana’s fees fall by $0.0003, and transactions per day are down 48%. Stablecoin transfer volumes fall on Ethereum and Polygon, but rise on Solana.
1. Introduction
The Ethereum blockchain began operation on 30 July 2015. For more than seven years, the chain was secured by a proof-of-work (PoW) protocol. This entailed large clusters of specialized computers, known as mining networks, competing with one another to find a random number called the nonce. The first miner to show that the hash of the nonce was below the network’s difficulty level would be allowed to add the new block to the chain. The miner would receive a block reward and collect gas fees for the transactions included in the block. As the network difficulty increased, the energy resources consumed by the miners grew ever larger.
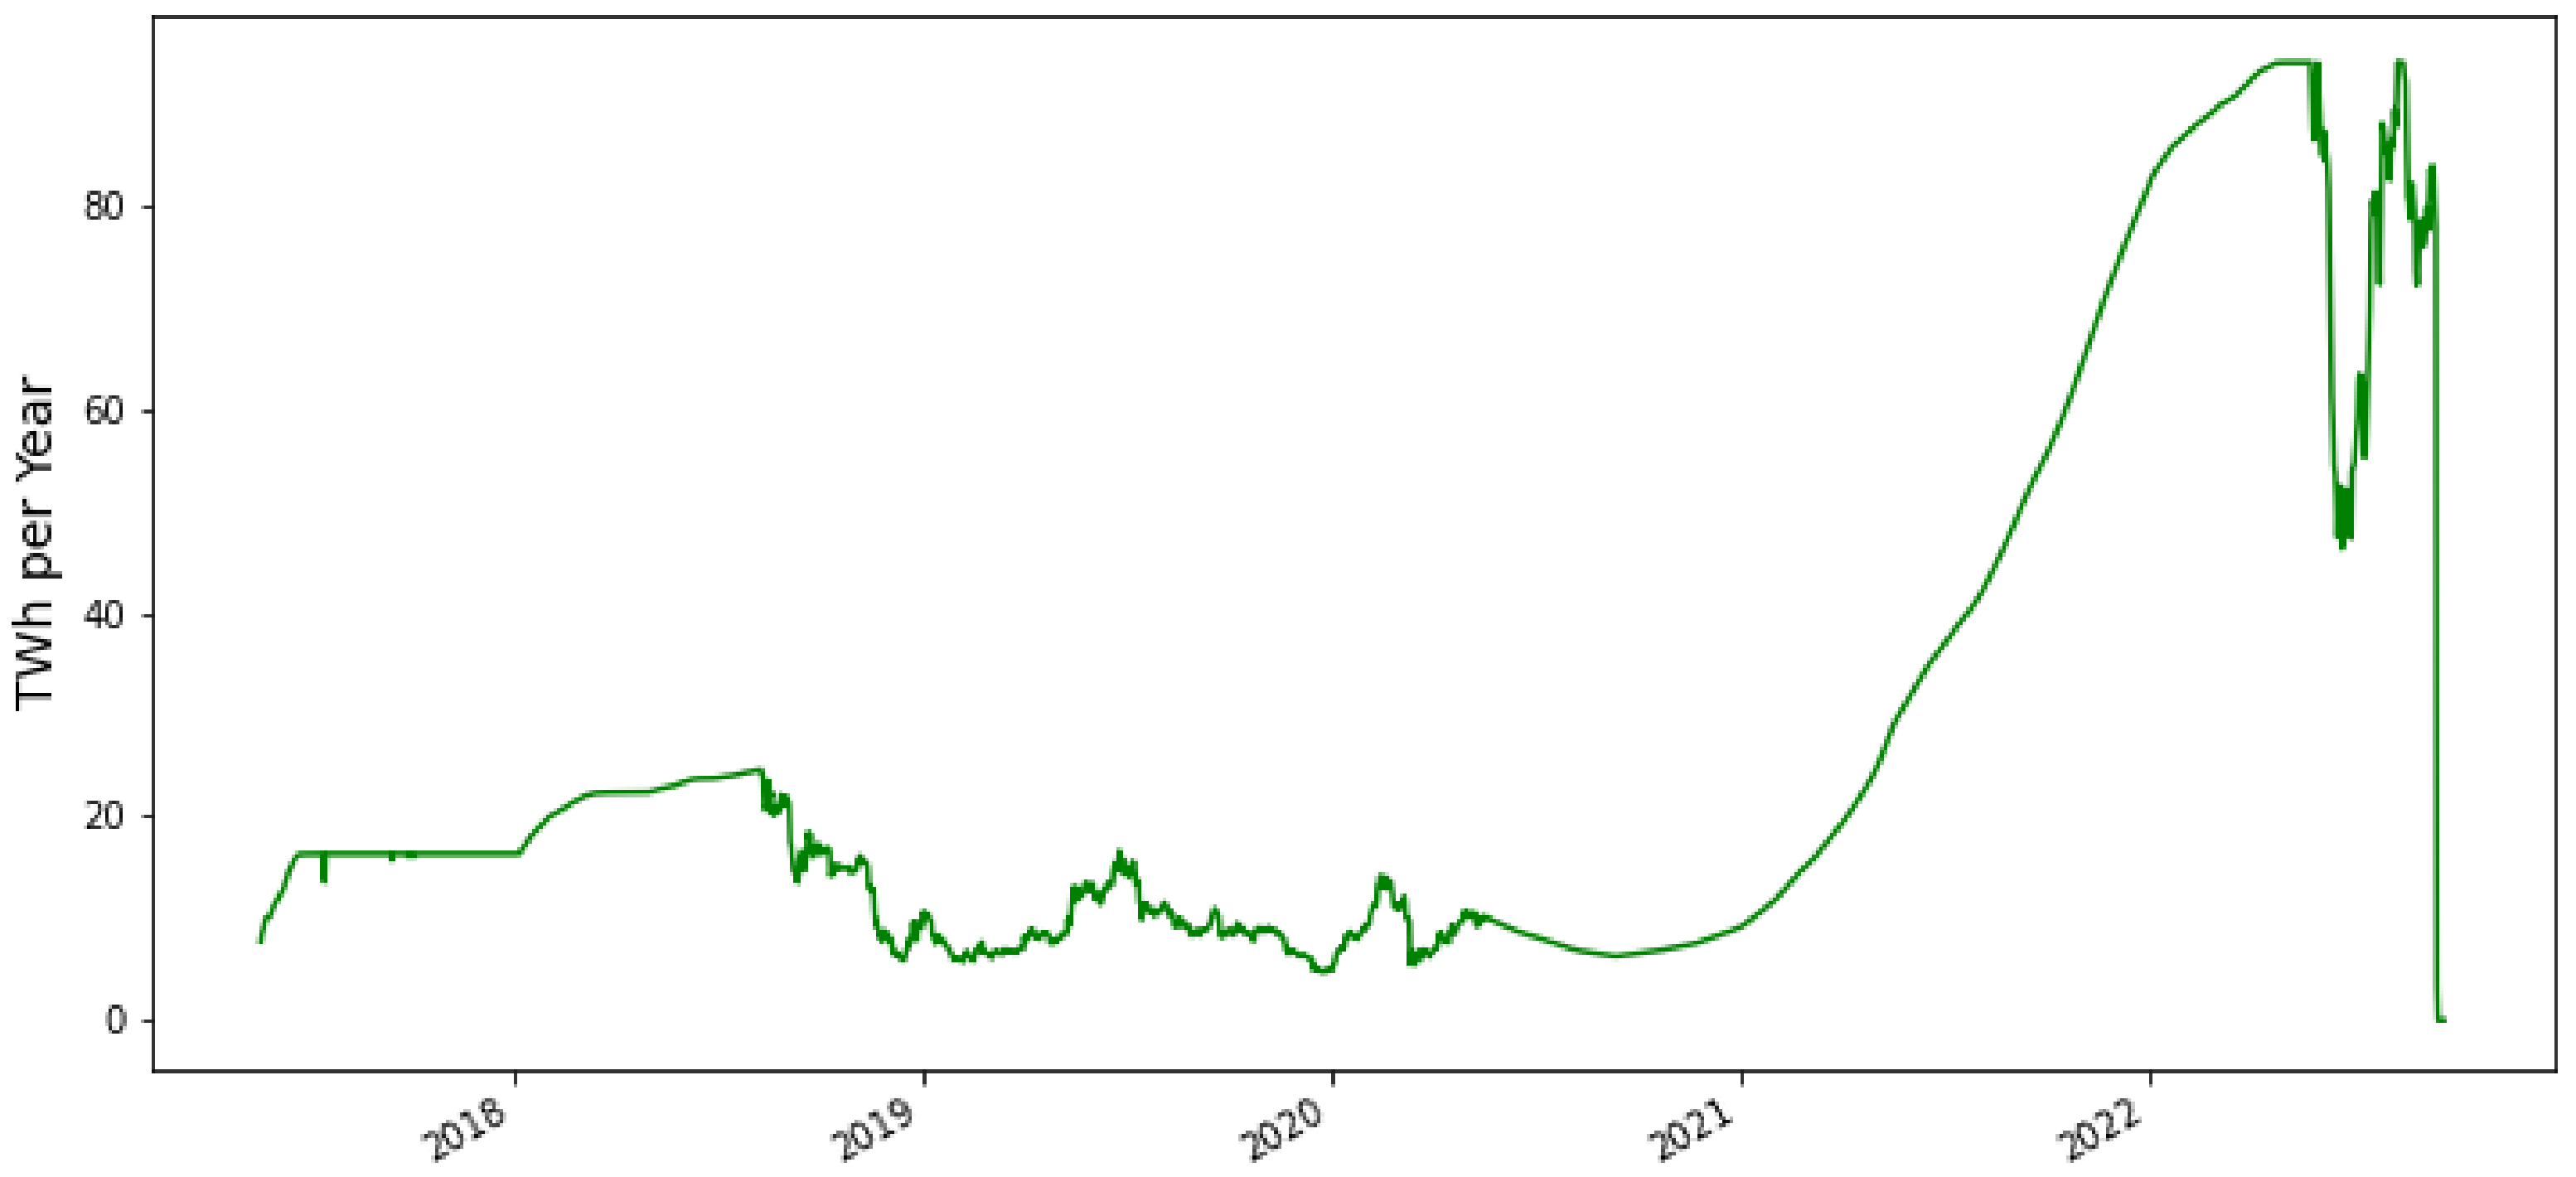
On 13 August 2022, the electricity consumption of the network, using the methodology of de Vries [1], reached a peak, briefly consuming 93.975 Terrawatt hours (TWh) per year on an annualized basis. (McDonald [2] estimates a peak usage of 89 TwH.) An alternative, more conservative methodology of Krause and Tolaymat [3] estimates peak usage at 45% of de Vries [1]. For context, this annualized estimate exceeds the estimated yearly usage by the Philippines in 2018. (US Energy Information Administration [4]).
Vitalik Buterin, founder of the network, had advocated for a transition to proof-of-stake (PoS) as early as 2016. (Buterin [5]) This validation method requires stakers to verify new transactions. Instead of searching randomly for the nonce, stakers place their Ethereum holdings into a smart contract as collateral. If stakers fail to fulfill their validation responsibilities–accidentally or maliciously–they can be punished by losing their staked coins. Stakers for any given block are chosen via a pseudo-random algorithm known as RANDAO. (Randao.org [6]) Edgington [7] provides a more comprehensive discussion about RANDAO, and Park et al. [8] contains details on Ethereum’s implementation of PoS.
Since PoS forgoes the energy-intensive problem solving characteristic of proof-of-work (Baniata and Kertesz [9] show that fog computing techniques can substantially reduce energy consumption in PoW distributed ledgers.), the Ethereum transition to PoS has cut the electricity usage of the network to 0.015 Terra Watts per hour, a 99.98% decrease, as seen in Figure 1.
We describe the first six transition blocks in Table 1. The last block mined under PoW (https://etherscan.io/block/15537393. Accessed on 25 September 2022.) was 15537393 by F2 Pool Old at 6:42:42 AM GMT on 15 September 2022. It included only one ERC-721 (NFT) transaction. The first PoS block (The block was in slot 4700013, epoch 146875. A slot is a time period of 12 s in which a validator can propose a block. There are 32 slots in one epoch.) 15537394 was a normal sized block(https://etherscan.io/block/15537393. Accessed on 25 September 2022.) with 80 transactions, but it included a 45 Ether (ETH) priority fee (tip).
We will drop the transition day, 15 September, analyzing one month event windows preceding and following that date.
2. Data and Methods
This paper will examine the composition of the validator pool, block fees and rewards, and the network speed, on the Ethereum network. Our data sources are the Ethereum blockchain which we obtain from Kaggle. (https://www.kaggle.com/datasets/bigquery/ethereum-blockchain. Accessed on 25 October 2022.) Data from the pre-merge Beacon Chain is from Bitquery. (https://explorer.bitquery.io/eth2. Accessed on 25 October 2022.) We will also compare Ethereum to Polygon and Solana on fees, speed and transfer volumes. The Polygon data are from Quicknode, (https://www.quicknode.com/docs/polygon. Accessed on 25 October 2022.) and the Solana data are from its’ command line interface. (https://docs.solana.com/cli. Accessed on 25 October 2022.) For Solana, we use 25,000 slot slices from each epoch in the month before and after the merge.
Our summary statistics are averages of fees, transactions per day, and transfer volumes. Since all are very large samples, we use t-tests to compare the means before and after the merge and report p-values from the normal distribution.
3. Descriptive Statistics for Ethereum
3.1. Validators
Prior to the merge, blocks were added by the miners. For the period 14 August to 14 September 2022, we computed the number of blocks and associated transactions that each miner completed. The top 10 miners, by blocks completed, are in Table 2. The Herfindahl index for the top ten is 1245. Ethermine has the largest market share at 28.6%.
Blocks are now secured by validators, participants in the Ethereum 2.0 consensus algorithm who have placed at least 32 ETH into the deposit contract (https://etherscan.io/address/0x00000000219ab540356cBB839Cbe05303d7705Fa. Accessed on 25 October 2022.) which we describe in Table 3. A committee of at least 128 validators, selected by RANDAO, are chosen to add a block for any given slot. One participant, called the block proposer, forms the block, a process that entails selecting and verifying a set of transactions has no failures or errors. The block then needs to be confirmed by the remaining validators, called attesters, who check and give their vote of confidence to the block. Finality is achieved at the checkpoint block, the first block in the next epoch, with support from 2/3 of the staked ETH. (https://ethereum.org/en/developers/docs/consensus-mechanisms/pos/finality. Accessed on 25 October 2022.)
The randomness of selection means that validators must have an active system nearly 24/7; they can have some or all of their stake burned (A term used to describe ETH that is cut loose from the network and is thus inaccessible to any user.) and be removed slashed) from the set of validators, for failing to complete an assigned task. As of 1 November 2022, 217 validators have been slashed, (https://beaconcha.in/validators/slashings. Accessed on 1 November 2022.) 24 since the merge.
In order to incentivize ETH holders to stake in the network, validators are compensated in two ways. The block proposer claims the gas fees, net of burning. Validators also receive rewards for attesting to and finalizing blocks. (https://ethereum.org/en/developers/docs/consensus-mechanisms/pos/rewards-and-penalties/. Accessed on 7 October 2022.) This reward is a function of the total network stake, with the return inversely proportional to the square root of the number of validators.
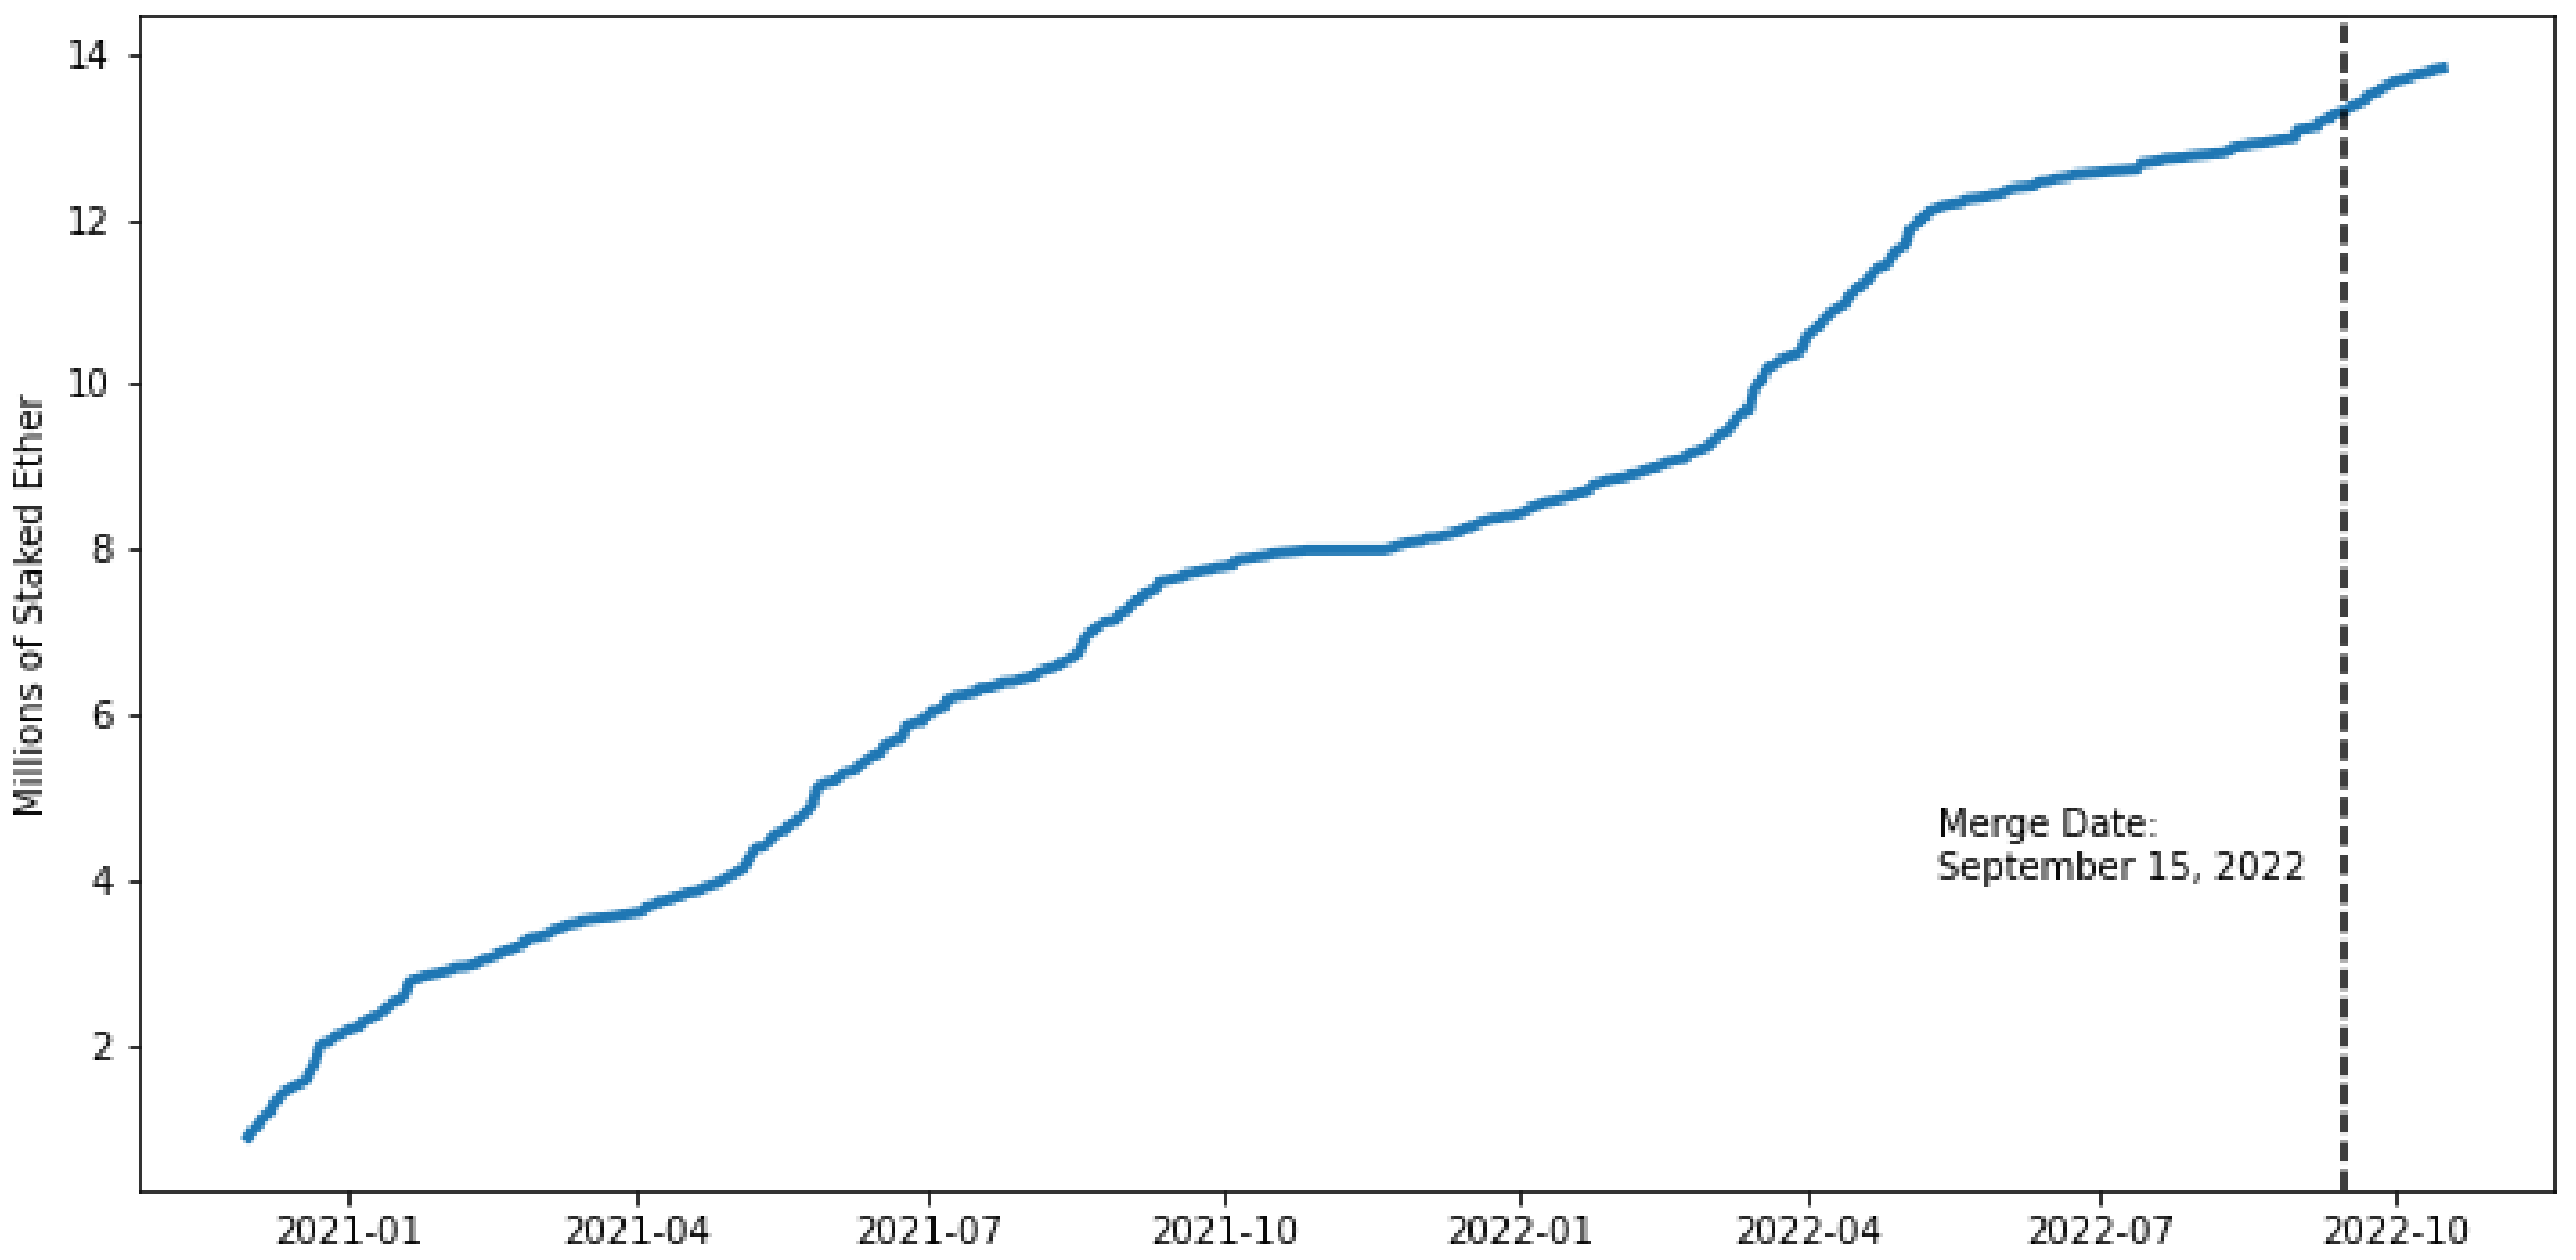
We plot the cumulative deposits into the staking contract in Figure 2. Deposits to the Beacon Chain staking contract began in November 2020. Heading into the merge the total supply in the deposit contract exceeded 13.2 million Ether.
Pintail [11] provides estimates of the returns to staking Ethereum on the Beacon Chain which draws on the Ethereum 2.0 annotated specification of Edgington [7]. With 401,084 validators on the merge day, this model estimates a return of 1.49 ETH over the year, an annualized yield of 4.64%. If the number of validators were to double, the return would fall to 1.05 ETH or just 3.28%.
We computed the number of blocks and transactions that each validator proposed from 16 September to 16 October 2022. The top 10 validators by blocks completed can be seen in Table 4. The Herfindahl index for the top 10 is 1009;the network is 19% less concentrated after the merge.
Moreover, there is no overlap between the pre-merge miners and the post-merge validators. Miners’ comparative advantage is their computing power, but this does not give a meaningful leg-up for PoS validation. Some miners have migrated to other networks that are still using PoW. In fact, the reward for mining an Ethereum Classic or RVN blocks, which still use PoW, dropped roughly 84% and 97%, respectively, within a 24-h period around the merge. (https://www.coindesk.com/business/2022/09/15/ethereum-miners-are-quickly-dying-less-than-24-hours-after-the-merge/. Accessed on 1 October 2022.)
The dominant validators are Flashbots, a research collective designed to mitigate the problem of maximum extractable value (MEV), a measure of the profit a network participant can make through “their ability to arbitrarily include, exclude, or re-order transactions from the blocks they produce.” (https://www.flashbots.net/. Accessed on 25 November 2022.) In other words, since there is no formal regulation around the order of transactions in a block, or which transactions are included in a block, validators could choose to prioritize certain types of transactions, giving those parties systemic advantages when trading. (Jensen [12] points out that the opportunity space is much larger if the manipulable set spans multiple blocks. They estimate that more than 20% of the blocks since the merge share single builder entries.)
In the proof of stake regime, Flashbots has released MEV-Boost, an open-source algorithm which sells blockspace to an open market of builders. On 15 September 2022, 17 epochs after the merge, MEV-Boost was activated. BioXroute (https://docs.bloxroute.com/apis/mev-solution/mev-relay-for-validators. Accessed on 25 November 2022.) and MEV Builder utilize MEV-Boost. (builder 0x69 utilizes two relays, Flashbots and Relayooor, https://medium.com/@builder0x69. Accessed on 25 November 2022.) The four Flashbots addresses have validated 46.6% of the blocks in the month since the merge.
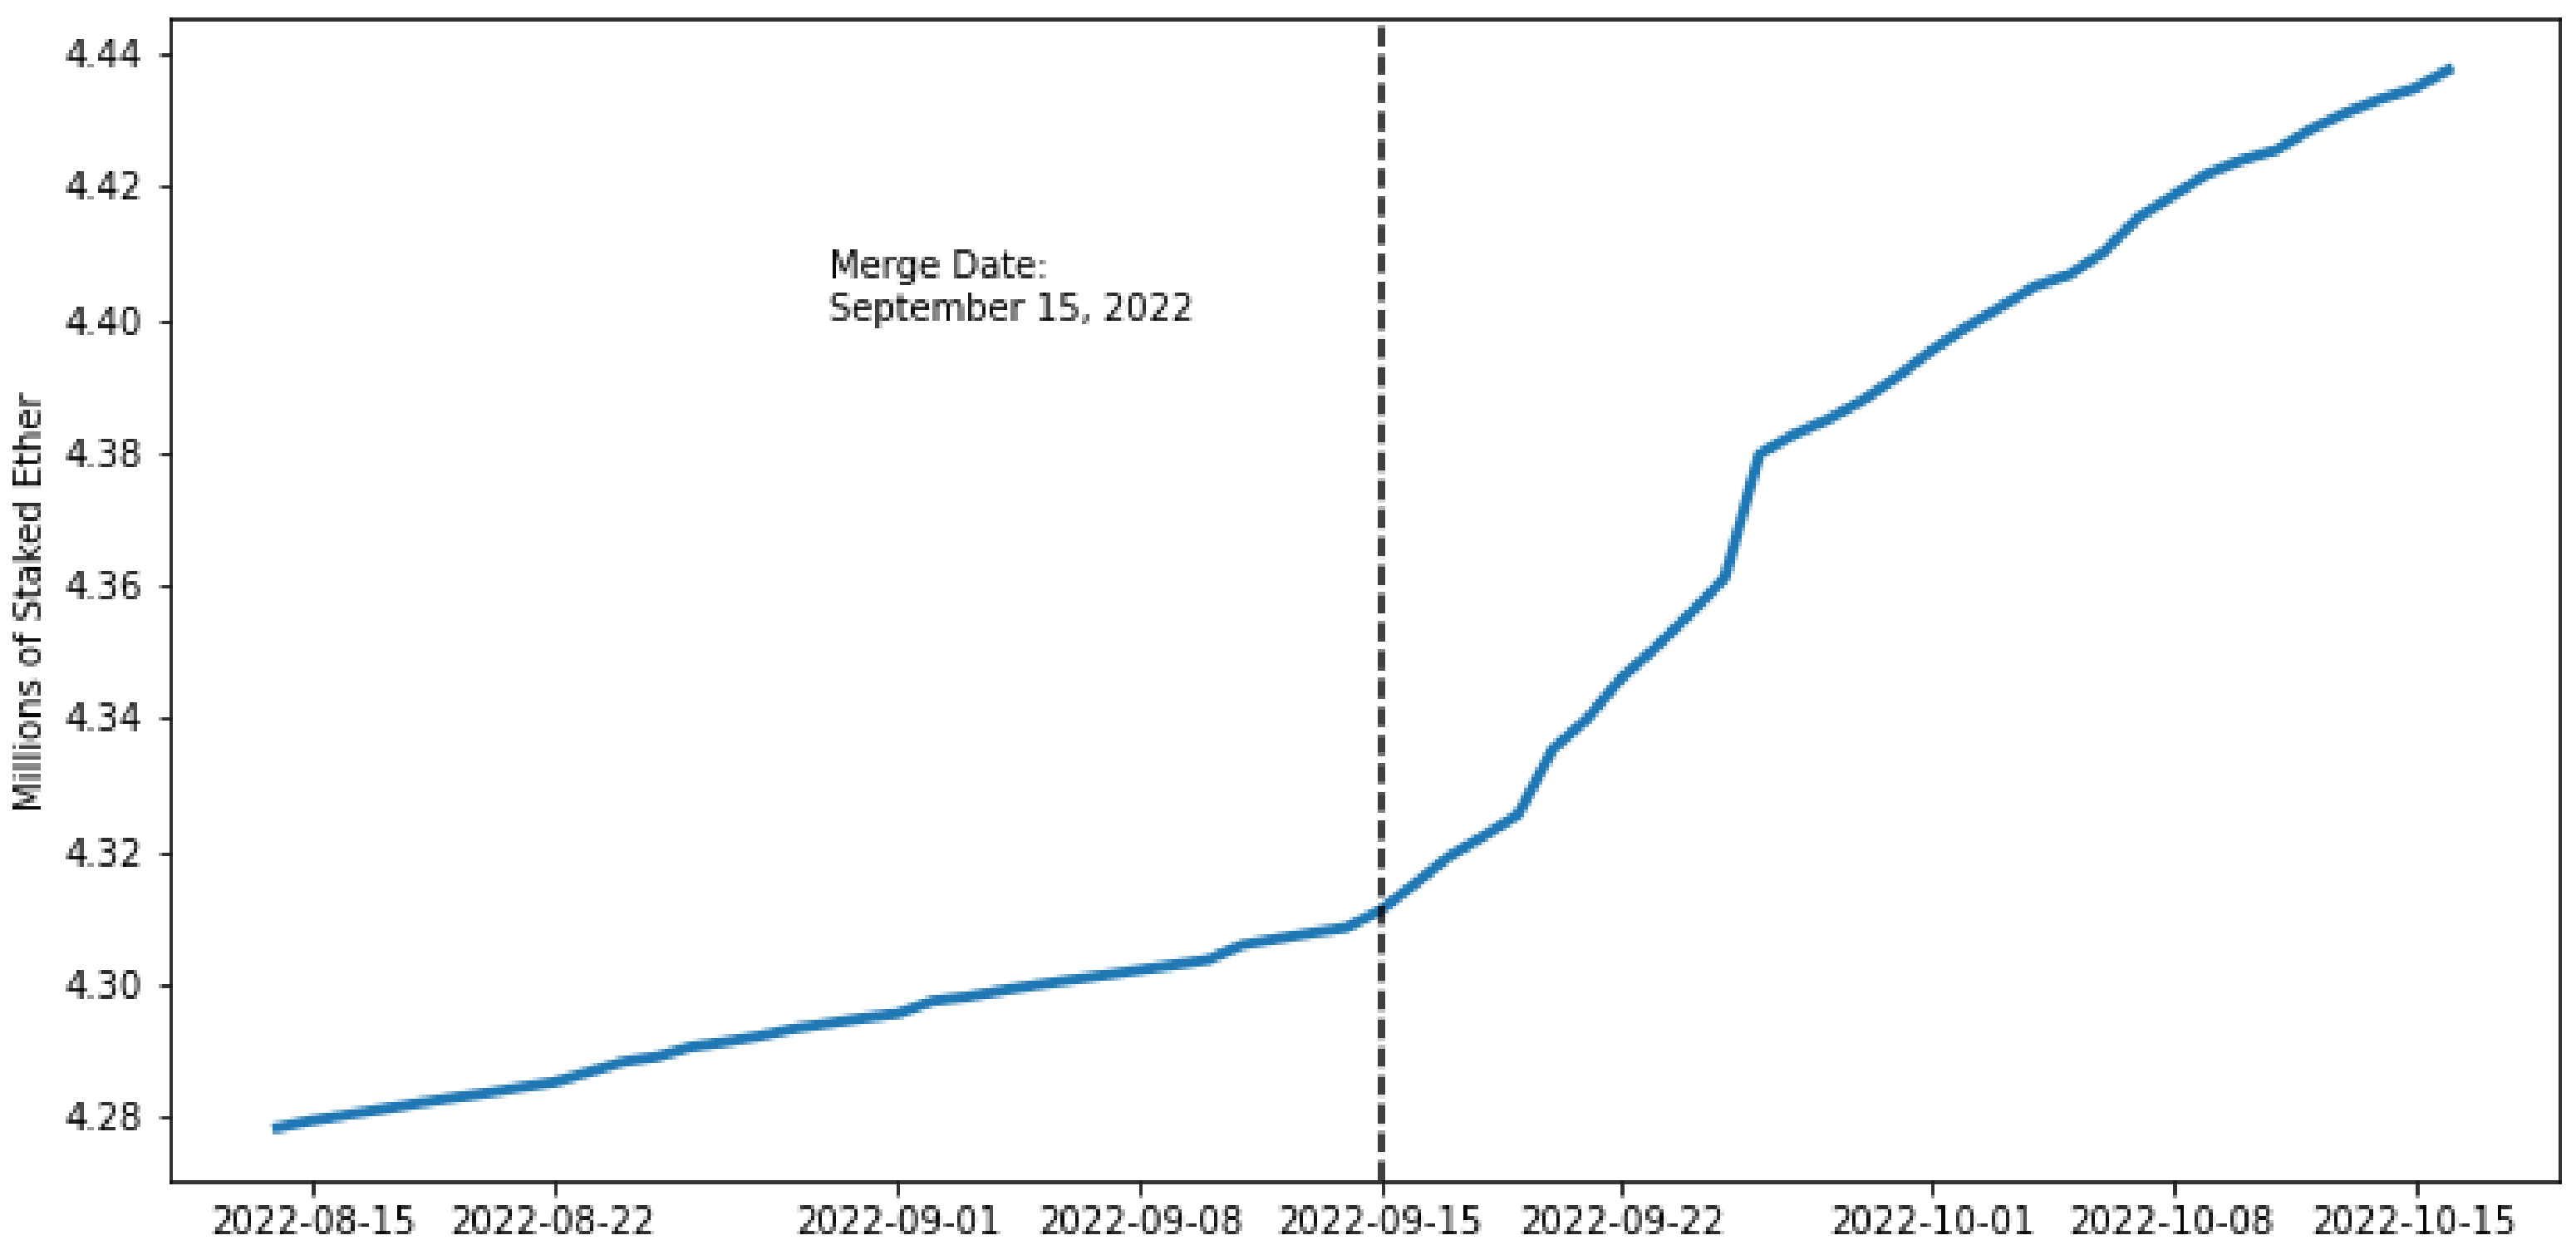
While it may not be computationally intensive, validating requires a large capital commitment, a great deal of technical knowledge, and a round-the-clock connection to the network. There are, however, on- and off-chain methods for retail investors, who would otherwise be locked out due to these stringent demands, to become validators. Validation pools, such as Lido, have been a popular on-chain method of staking–in fact, as seen in Table 4, Lido is the dominant staking pool in the market. Users pool their resources into Lido by purchasing its staking token, stETH. (The hash on the Ethereum Mainnet is 0xae7ab96520de3a18e5e111b5eaab095312d7fe84.) Lido then invests the pooled assets into the staking contract, and distributes the rewards amongst the investors. The cumulative amount staked in Lido can be seen in Figure 3. (Heimbach et al. [13] note that Lido can also be staked, and that nearly 20% was locked into DeFi lending protocols during the merge, creating a potential for mass liquidations.)
There are also off-chain solutions for retail staking, namely through centralized exchanges. As seen on Table 4, Coinbase is the second largest staker in part due to a service that mirrors Lido’s on-chain pooling; Coinbase users can offer any amount of ETH to be pooled and staked in the deposit contract. Other centralized exchanges, like Binance, offer similar services; Kraken offered such a service for the duration of this sample, but have since shut down user stalking pools. Since daily issuance of new ETH to the validators is a function of the total amount of ETH staked, tracking the dominant validators may be important insofar as understanding the growth in ETH supply.
Validators can’t withdraw ETH from the staking contract until the Shanghai upgrade. At the time of the Merge, it was anticipated that the upgrade would take six to eighteen months, and it is now on pace for the lower end of that range, March 2023. (https://www.bloomberg.com/news/articles/2023-01-27/crypto-s-hottest-trade-risks-spurring-another-leverage-bubble#xj4y7vzkg. Accessed on 30 January 2023.)
3.2. Block Income and Creation Speed
Historically, income for miners has come from two sources: block rewards for completing a new block on the chain and transaction fees from on-chain transfers. Since August 2021, after the EIP-1559 upgrade, (https://notes.ethereum.org/@vbuterin/eip-1559-faq. Accessed on 30 September 2022.) base fees from transfers have been burned. A miner’s block income, prior to the merge, consisted of these three parts shown in Equation (1):
Block reward is the number of new ETH minted and given to the party responsible for successfully adding a block to the chain; transaction fees, include the gas, both base and priority fees, from the transactions in the block; burnt gas for each transaction is the base fee in ETH set by the network protocol.
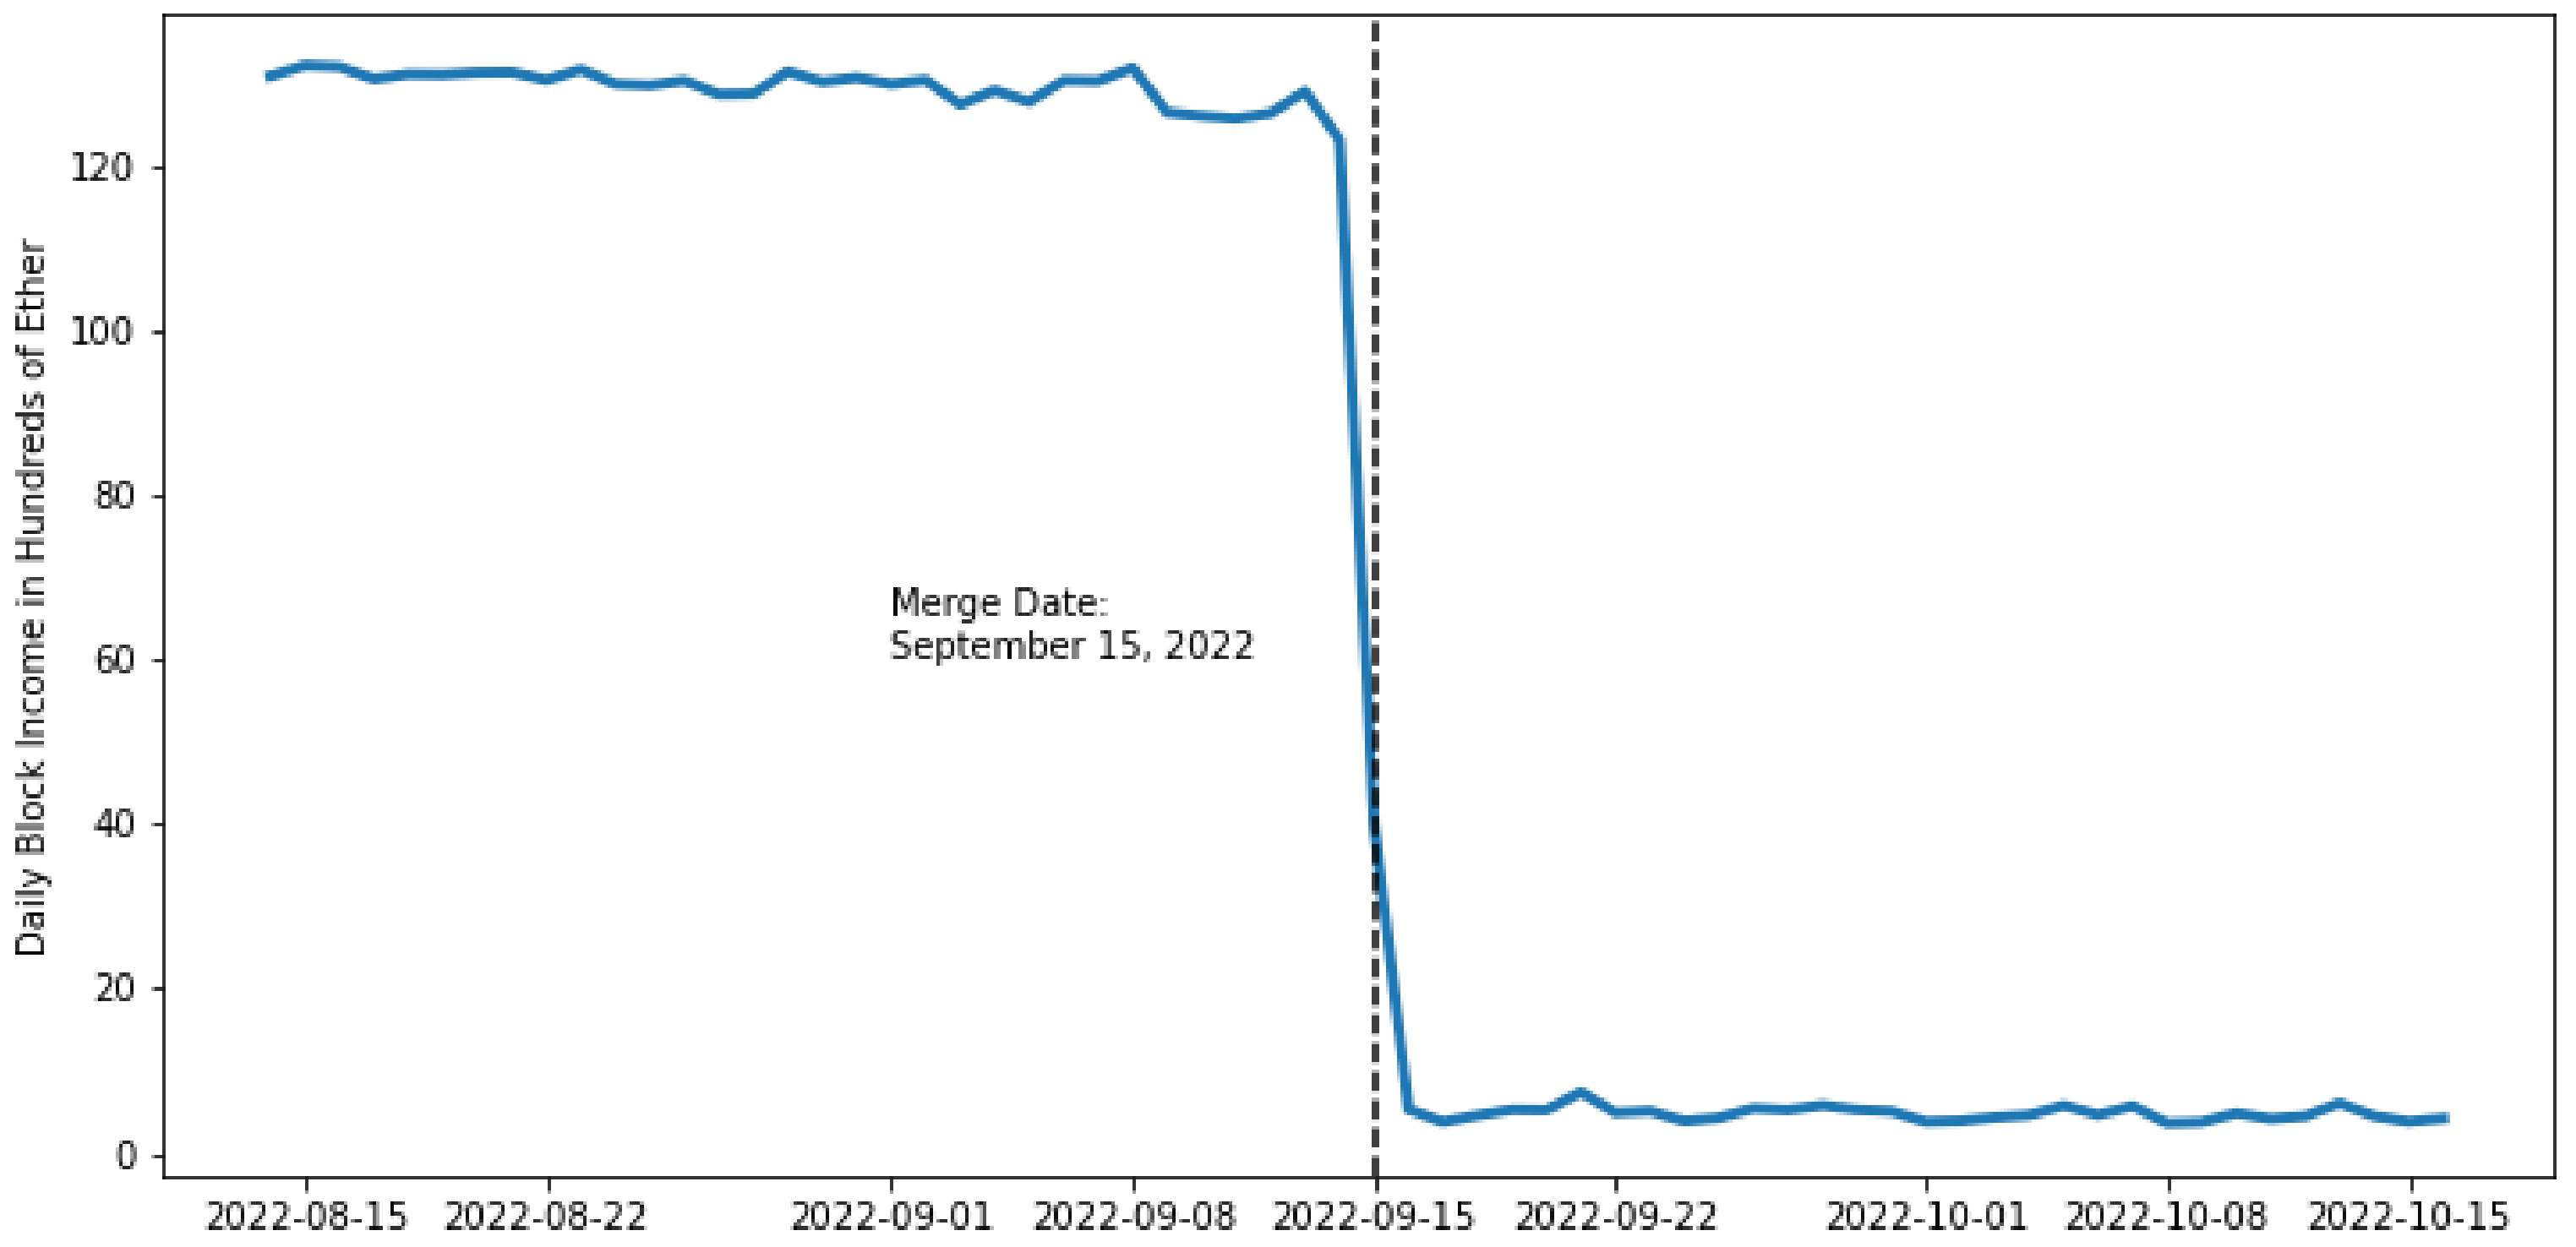
Since the St. Petersburg upgrade in 2019, miners received two ETH for each block they completed. However, the transition to PoS removed this reward altogether. Miner and validators’ total block income before and after the event is plotted in Figure 4.
Table 5 decomposes the decline in block income. There is a slight, statistically insignificant rise in transaction fees for transfers, but it is largely offset by a higher burn rate. The loss of a block completion bonus is the main drag on block income. Validators’ total block income is now only 3% of what miners used to earn.
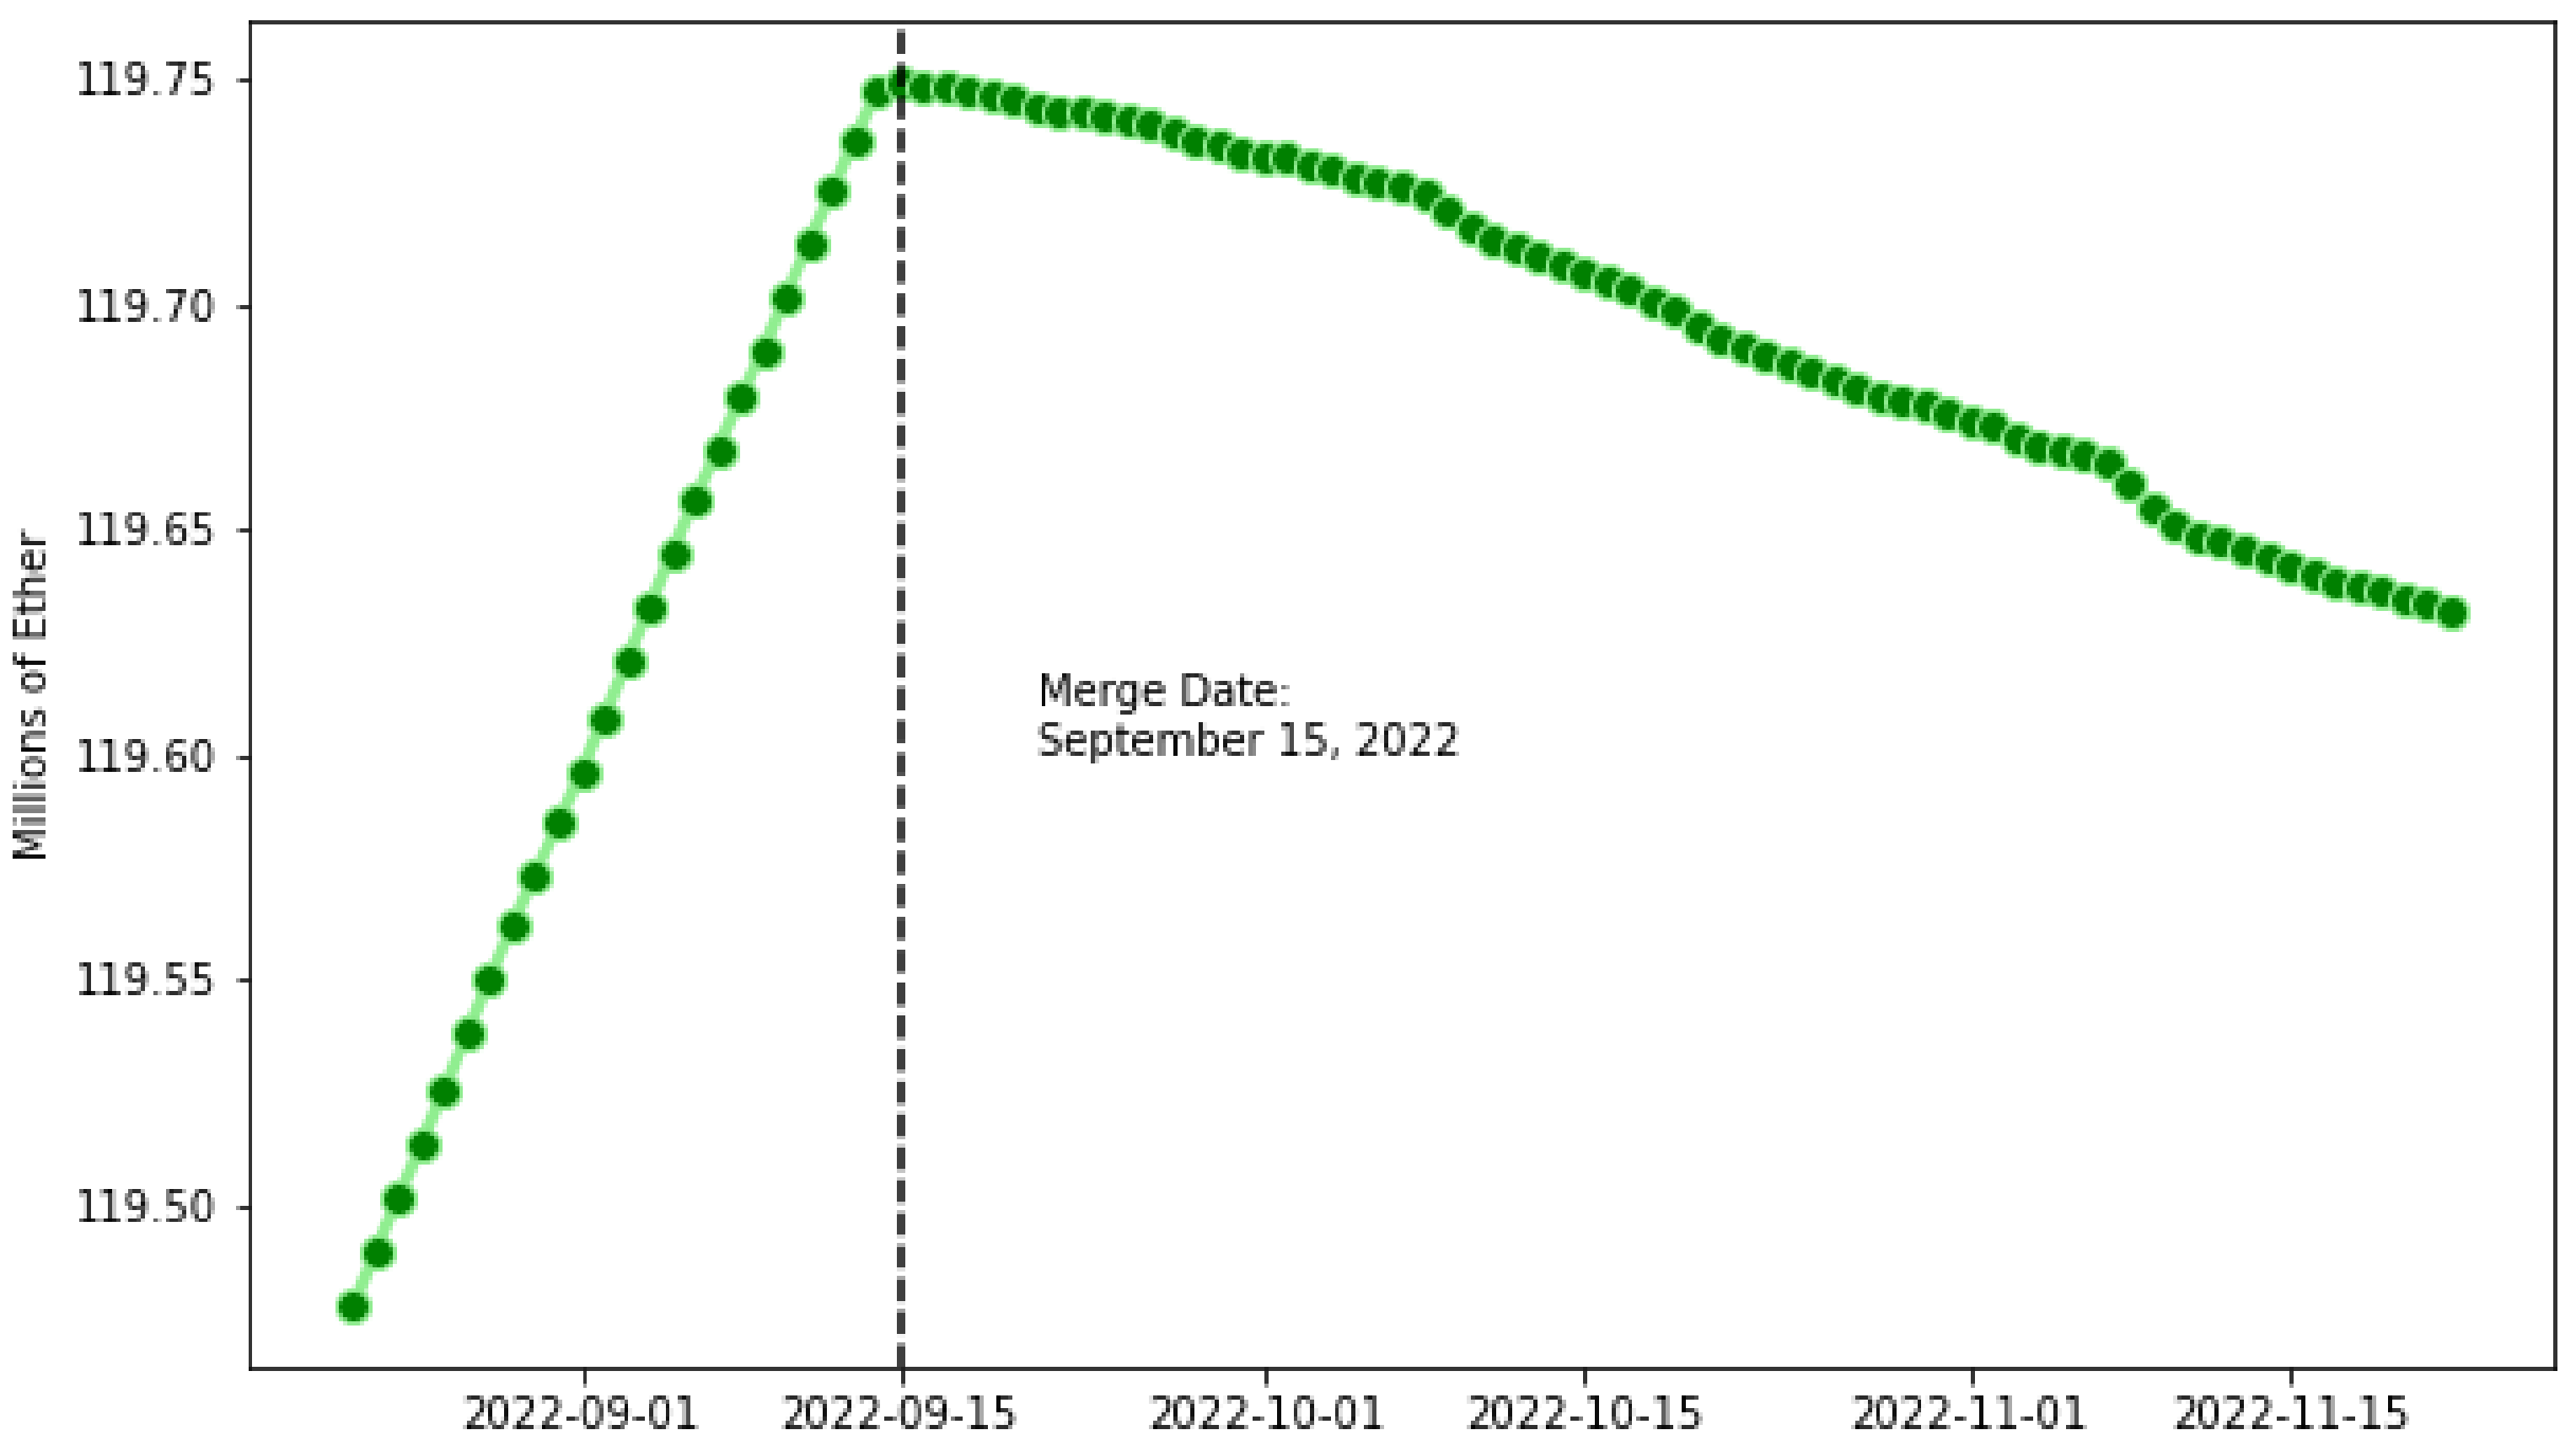
The removal of the block completion reward has also greatly slowed the minting of new ETH. Since the St. Petersburg Upgrade, (The updates went live at block 7,280,000 on 28 February 2019: https://cointelegraph.com/news/ethereums-constantinople-st-petersburg-upgrades-have-been-activated. Accessed on 30 September 2022.) two new ETH were minted as a reward for each completed block; this served as the main driver of ETH supply expansion. Combined with a smaller issuance for ommer blocks (https://ethereum.org/en/glossary/ommer. Accessed on 30 September 2022.) and validators on the Beacon Chain, (https://ethereum.org/en/upgrades/beacon-chain/. Accessed on 30 September 2022.) there was about 5.5 million new ETH minted annually. (https://ethereum.org/en/upgrades/merge/issuance/. Accessed on 30 September 2022.) Since the merge, the two ETH per transaction reward on the execution layer (PoW) are no longer being produced. There is now roughly 1600 new ETH minted each day, which is distributed to the validators in the network. The burn rate can, in principal, exceed the issuance rate, resulting in blocks that deflate total ETH supply. Finally, ETH continues to be staked, removing it from the circulating supply. These factors explain why, as we show in Figure 5, that ethereum supply has been deflationary since the merge.
3.3. Transaction Fees: Ether Transactions
As Donmez and Karaivanov [14] note, miners generally received only the base fee of 21,000 units of gas for ETH transfers between two wallets. The dollar price of the transaction can vary quite widely because: (1) the ETH price of a unit of gas deviates with network congestion and (2) the dollar price of ETH, until recently, was increasing steadily.
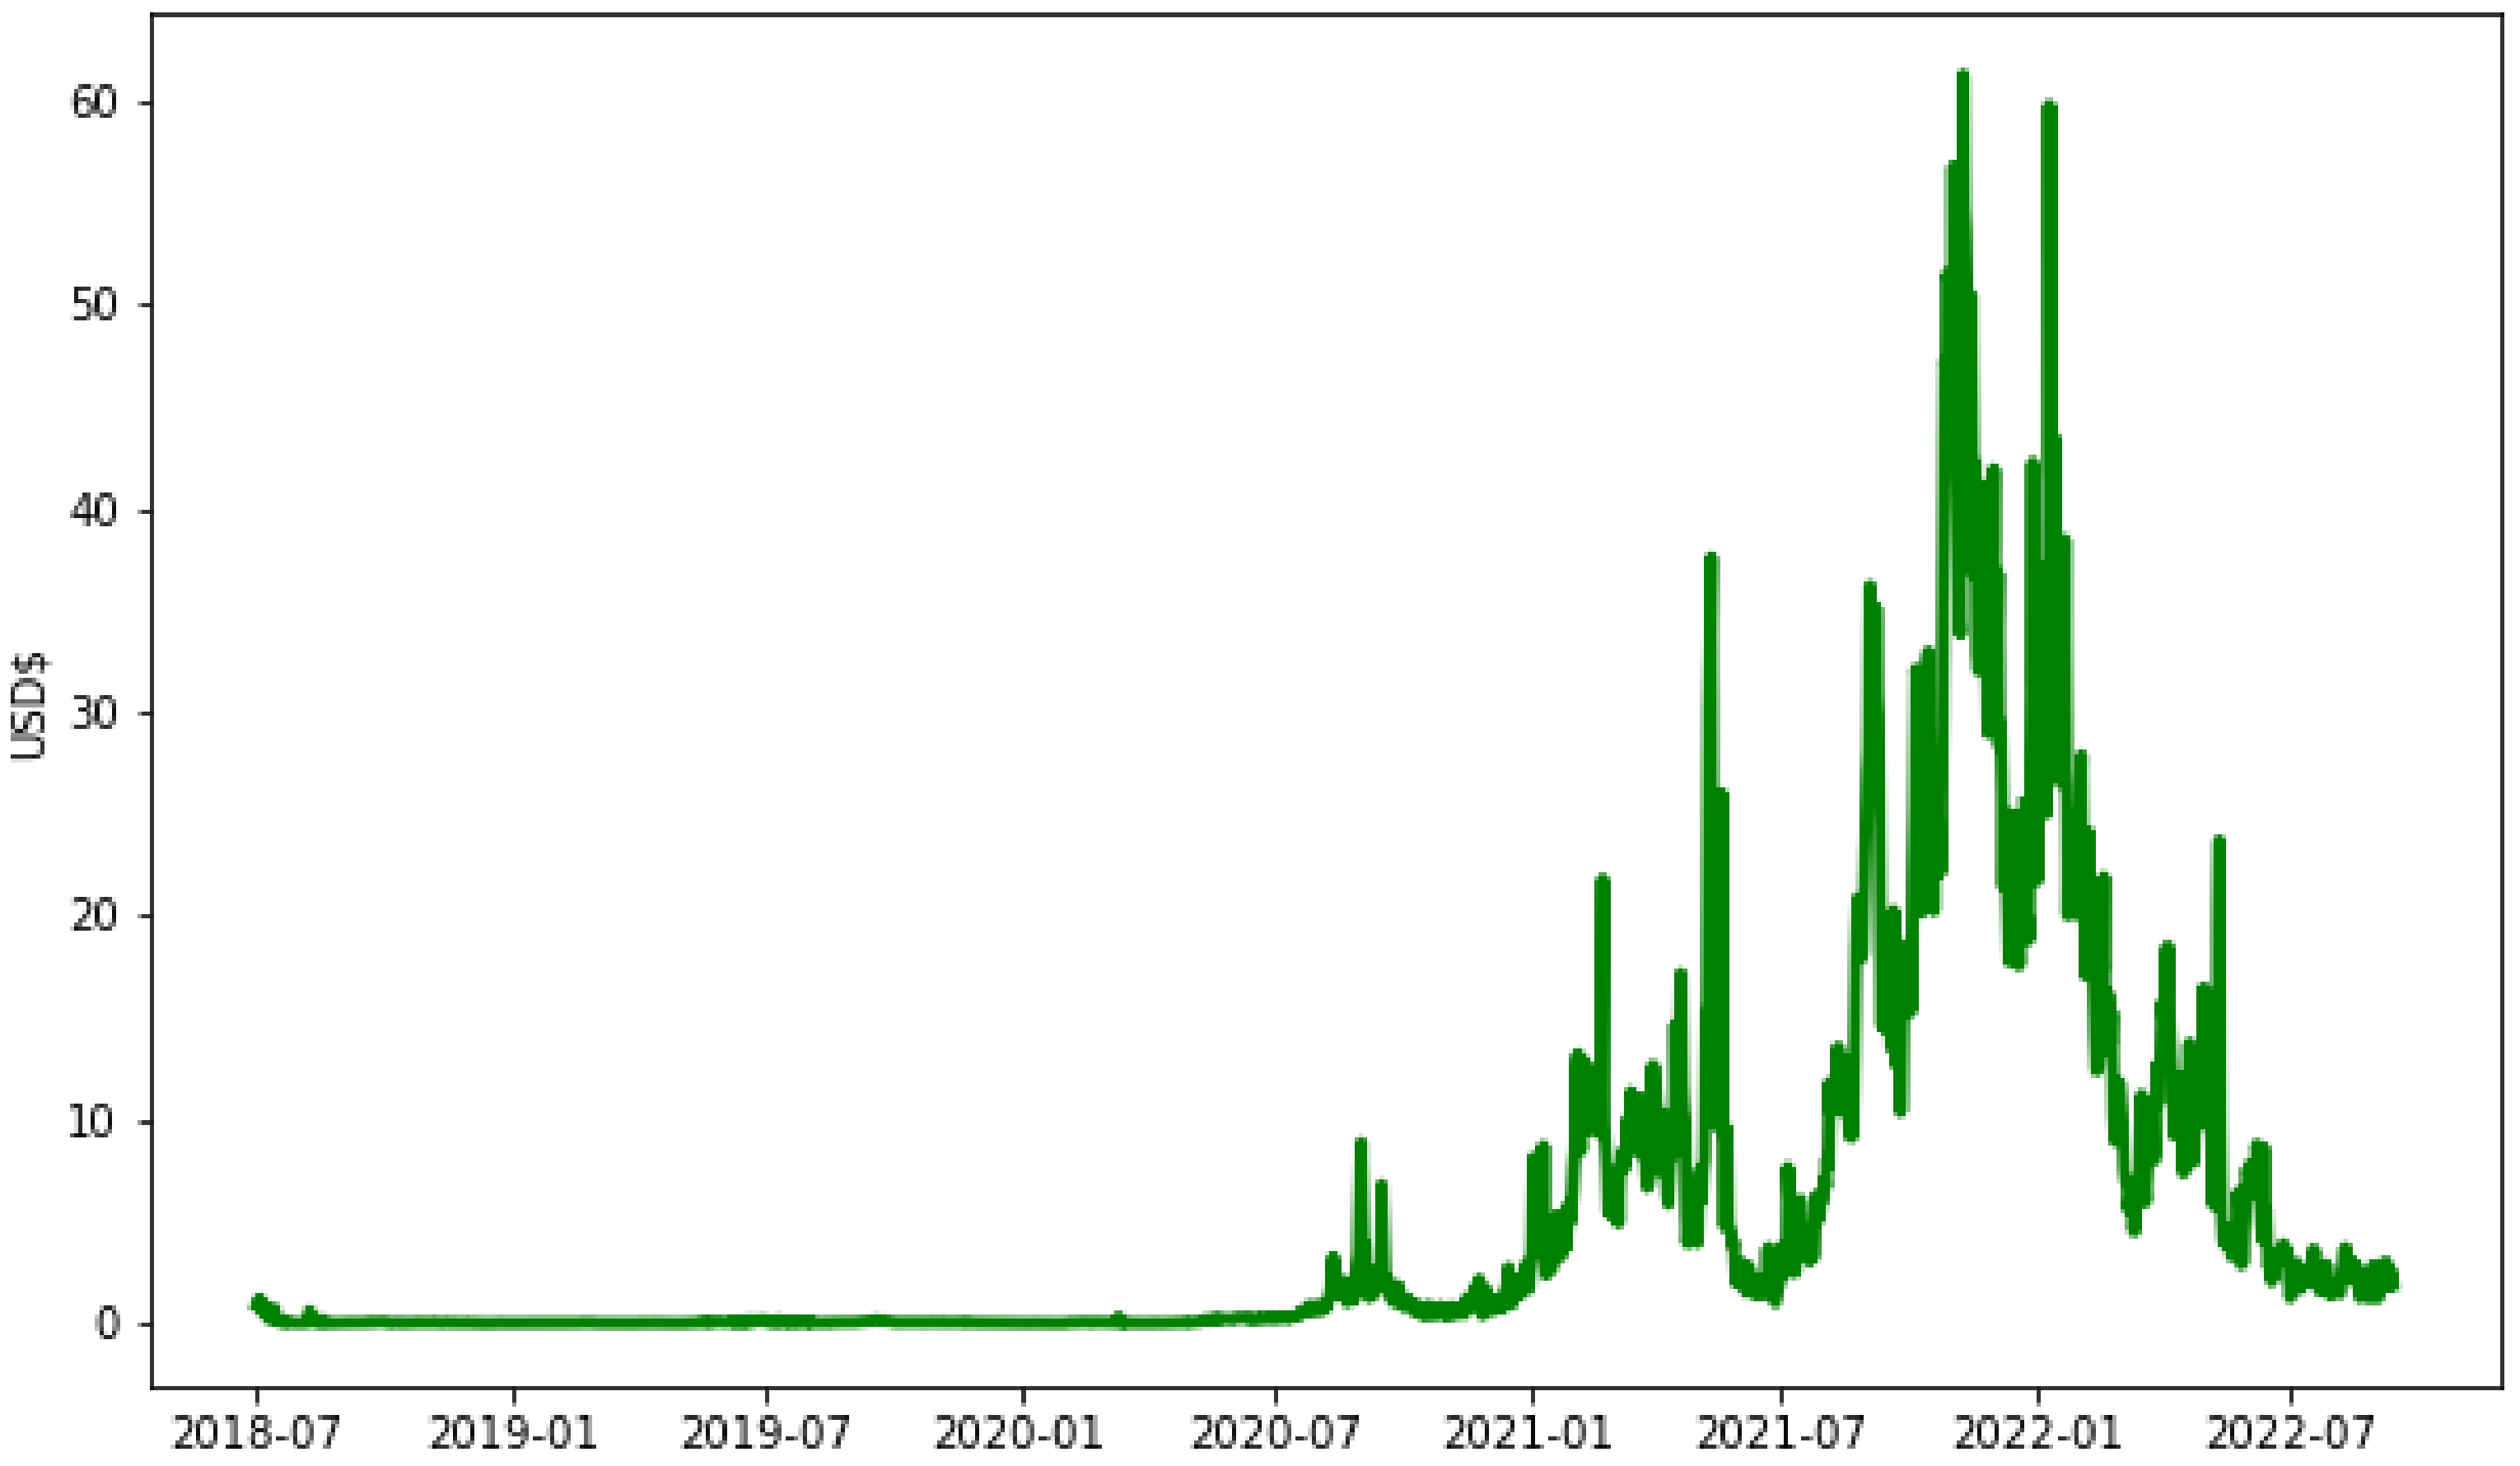
The median fee in Figure 6 peaked at over $28 on 11 May 2021. Following a temporary dip, prices remained over $10 through November 2021, but have fallen since. Going into the merge, the median price was $0.502.
As seen in Table 6, gas price and gas used for ETH transactions have seen statistically significant increases since the merge. That said, given the strong decline in ETH/USD during the event window, there has actually been a slight decrease in the dollar cost of fees, but this change is not statistically significant.
3.4. Transaction Fees: Ethereum Tokens
By construction, ERC-20 tokens live in smart contracts, which introduce more complexity to parse. Thus, fees have typically been higher for token transfers. As seen in Figure 7, token fees peaked at over $61 on 9 November 2021 and medians were still above $20 through May 2021.
We analyze the impact of the merge on ERC-20 transactions in Table 7.
Gas prices are down, gas used on token transactions is up, resulting in a small increase in fees in Ether terms. The decline in ETH/USD leads to the only statistically significant change, a decline in the dollar cost of transfer fees of $0.62.
3.5. Block Creation Speed
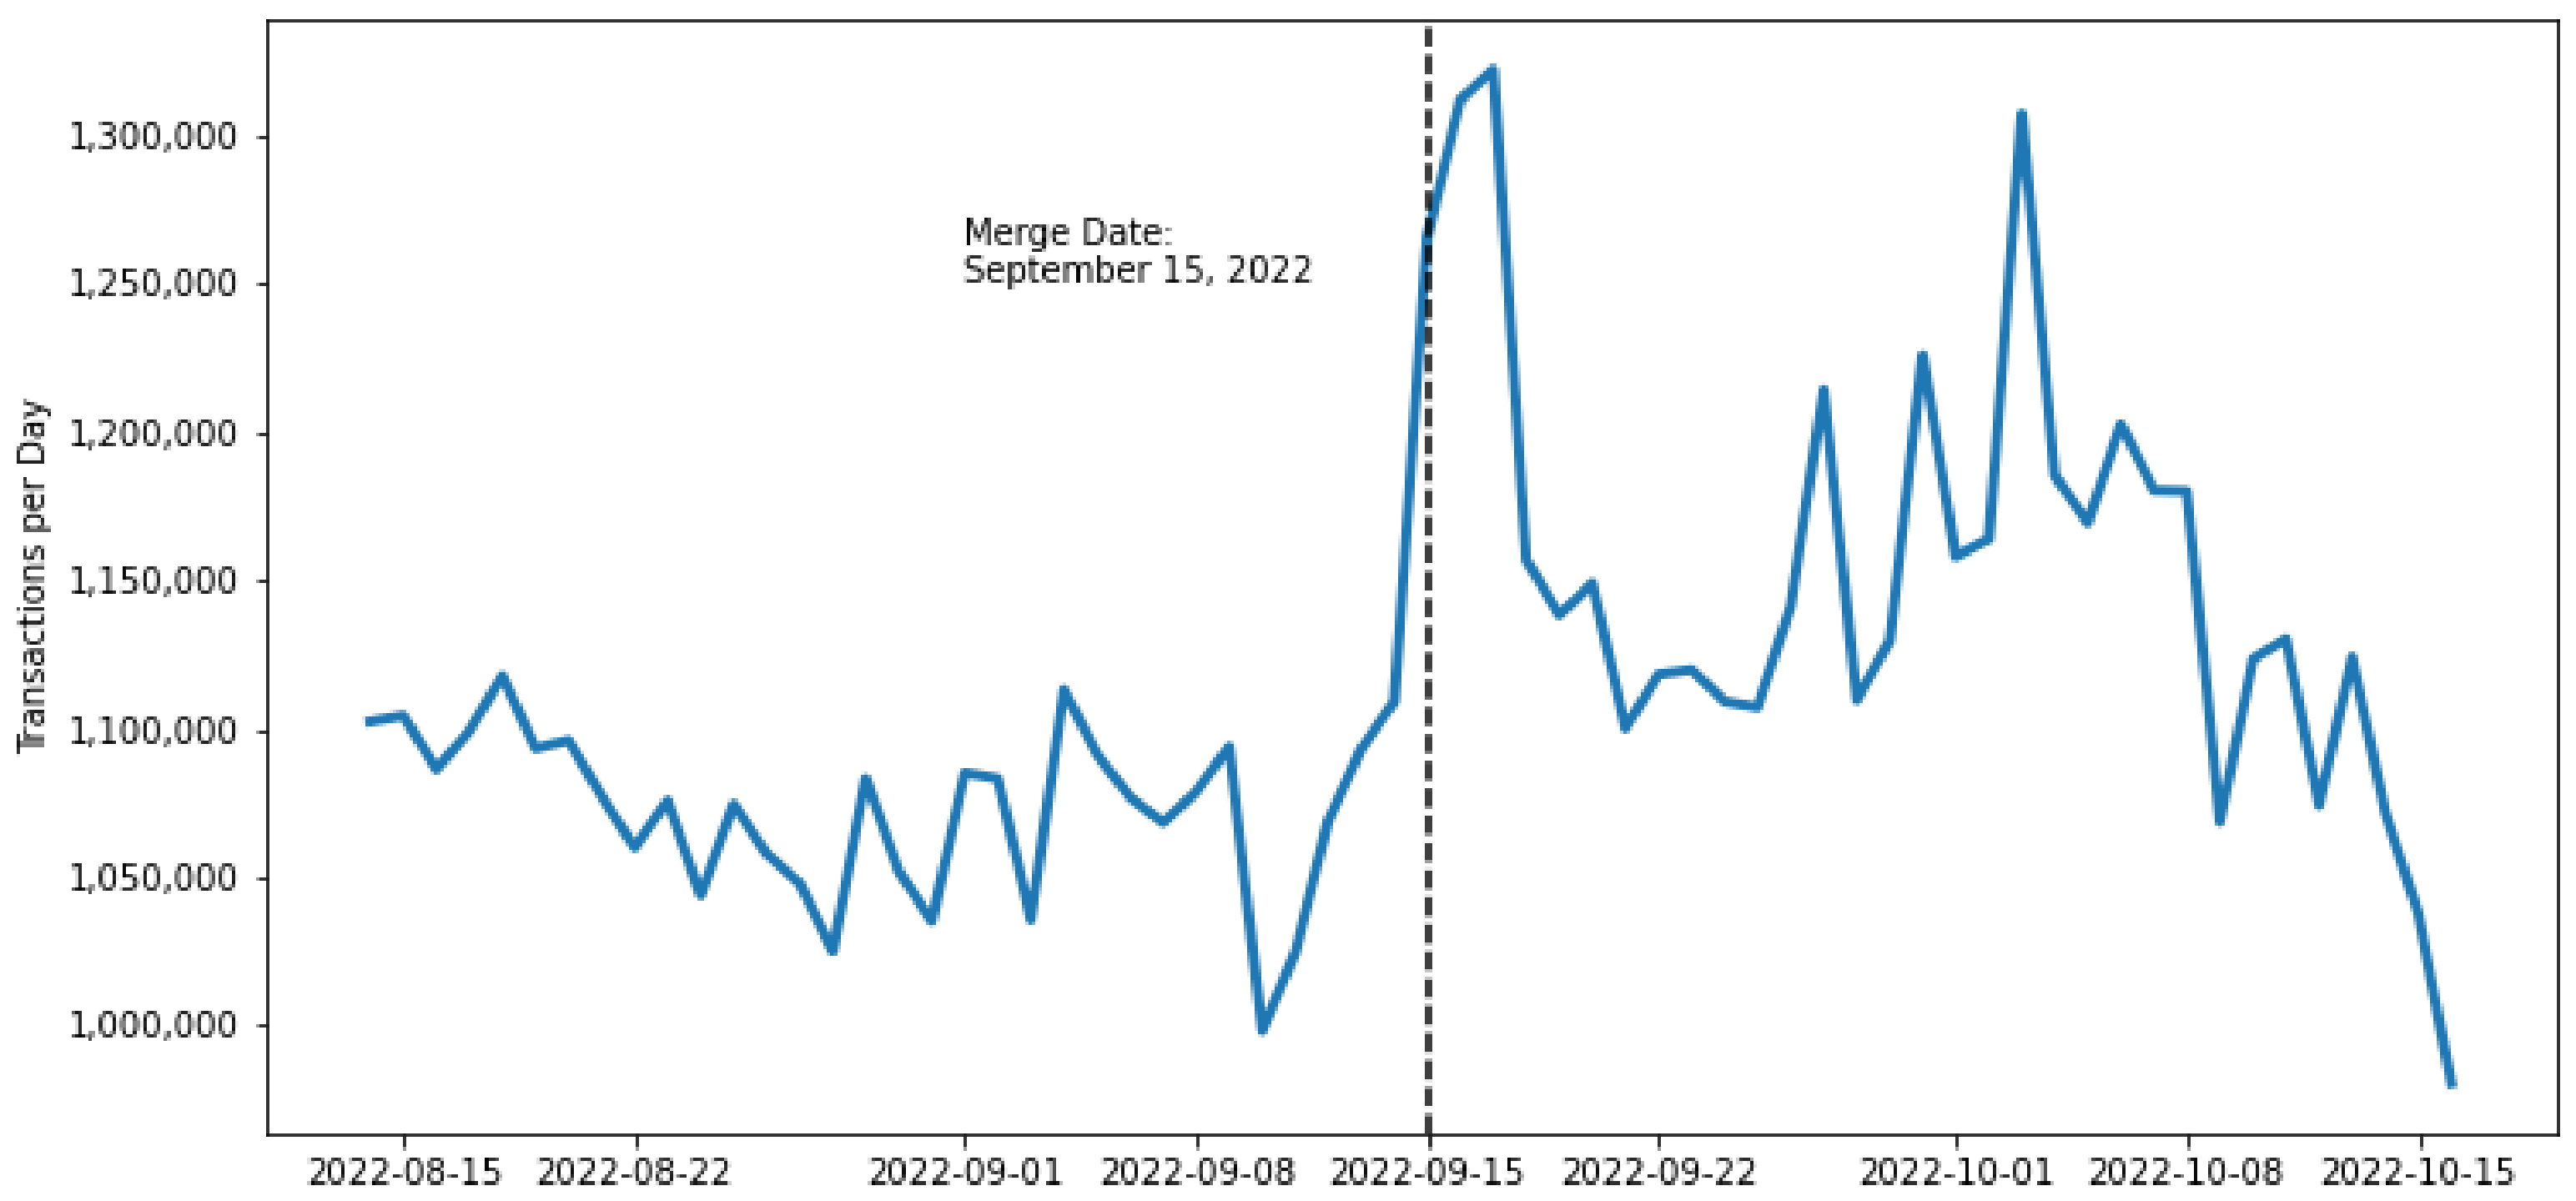
Prior to the merge, blocks were added when a miner group “won the race” to find the nonce. As a result, block creation speed would vary. Except on the rare occasions that a block is skipped, validators produce a new block every twelve seconds. Given this faster speed, as seen in Table 8 and Figure 8, transactions per day are up by 75,000 on average.
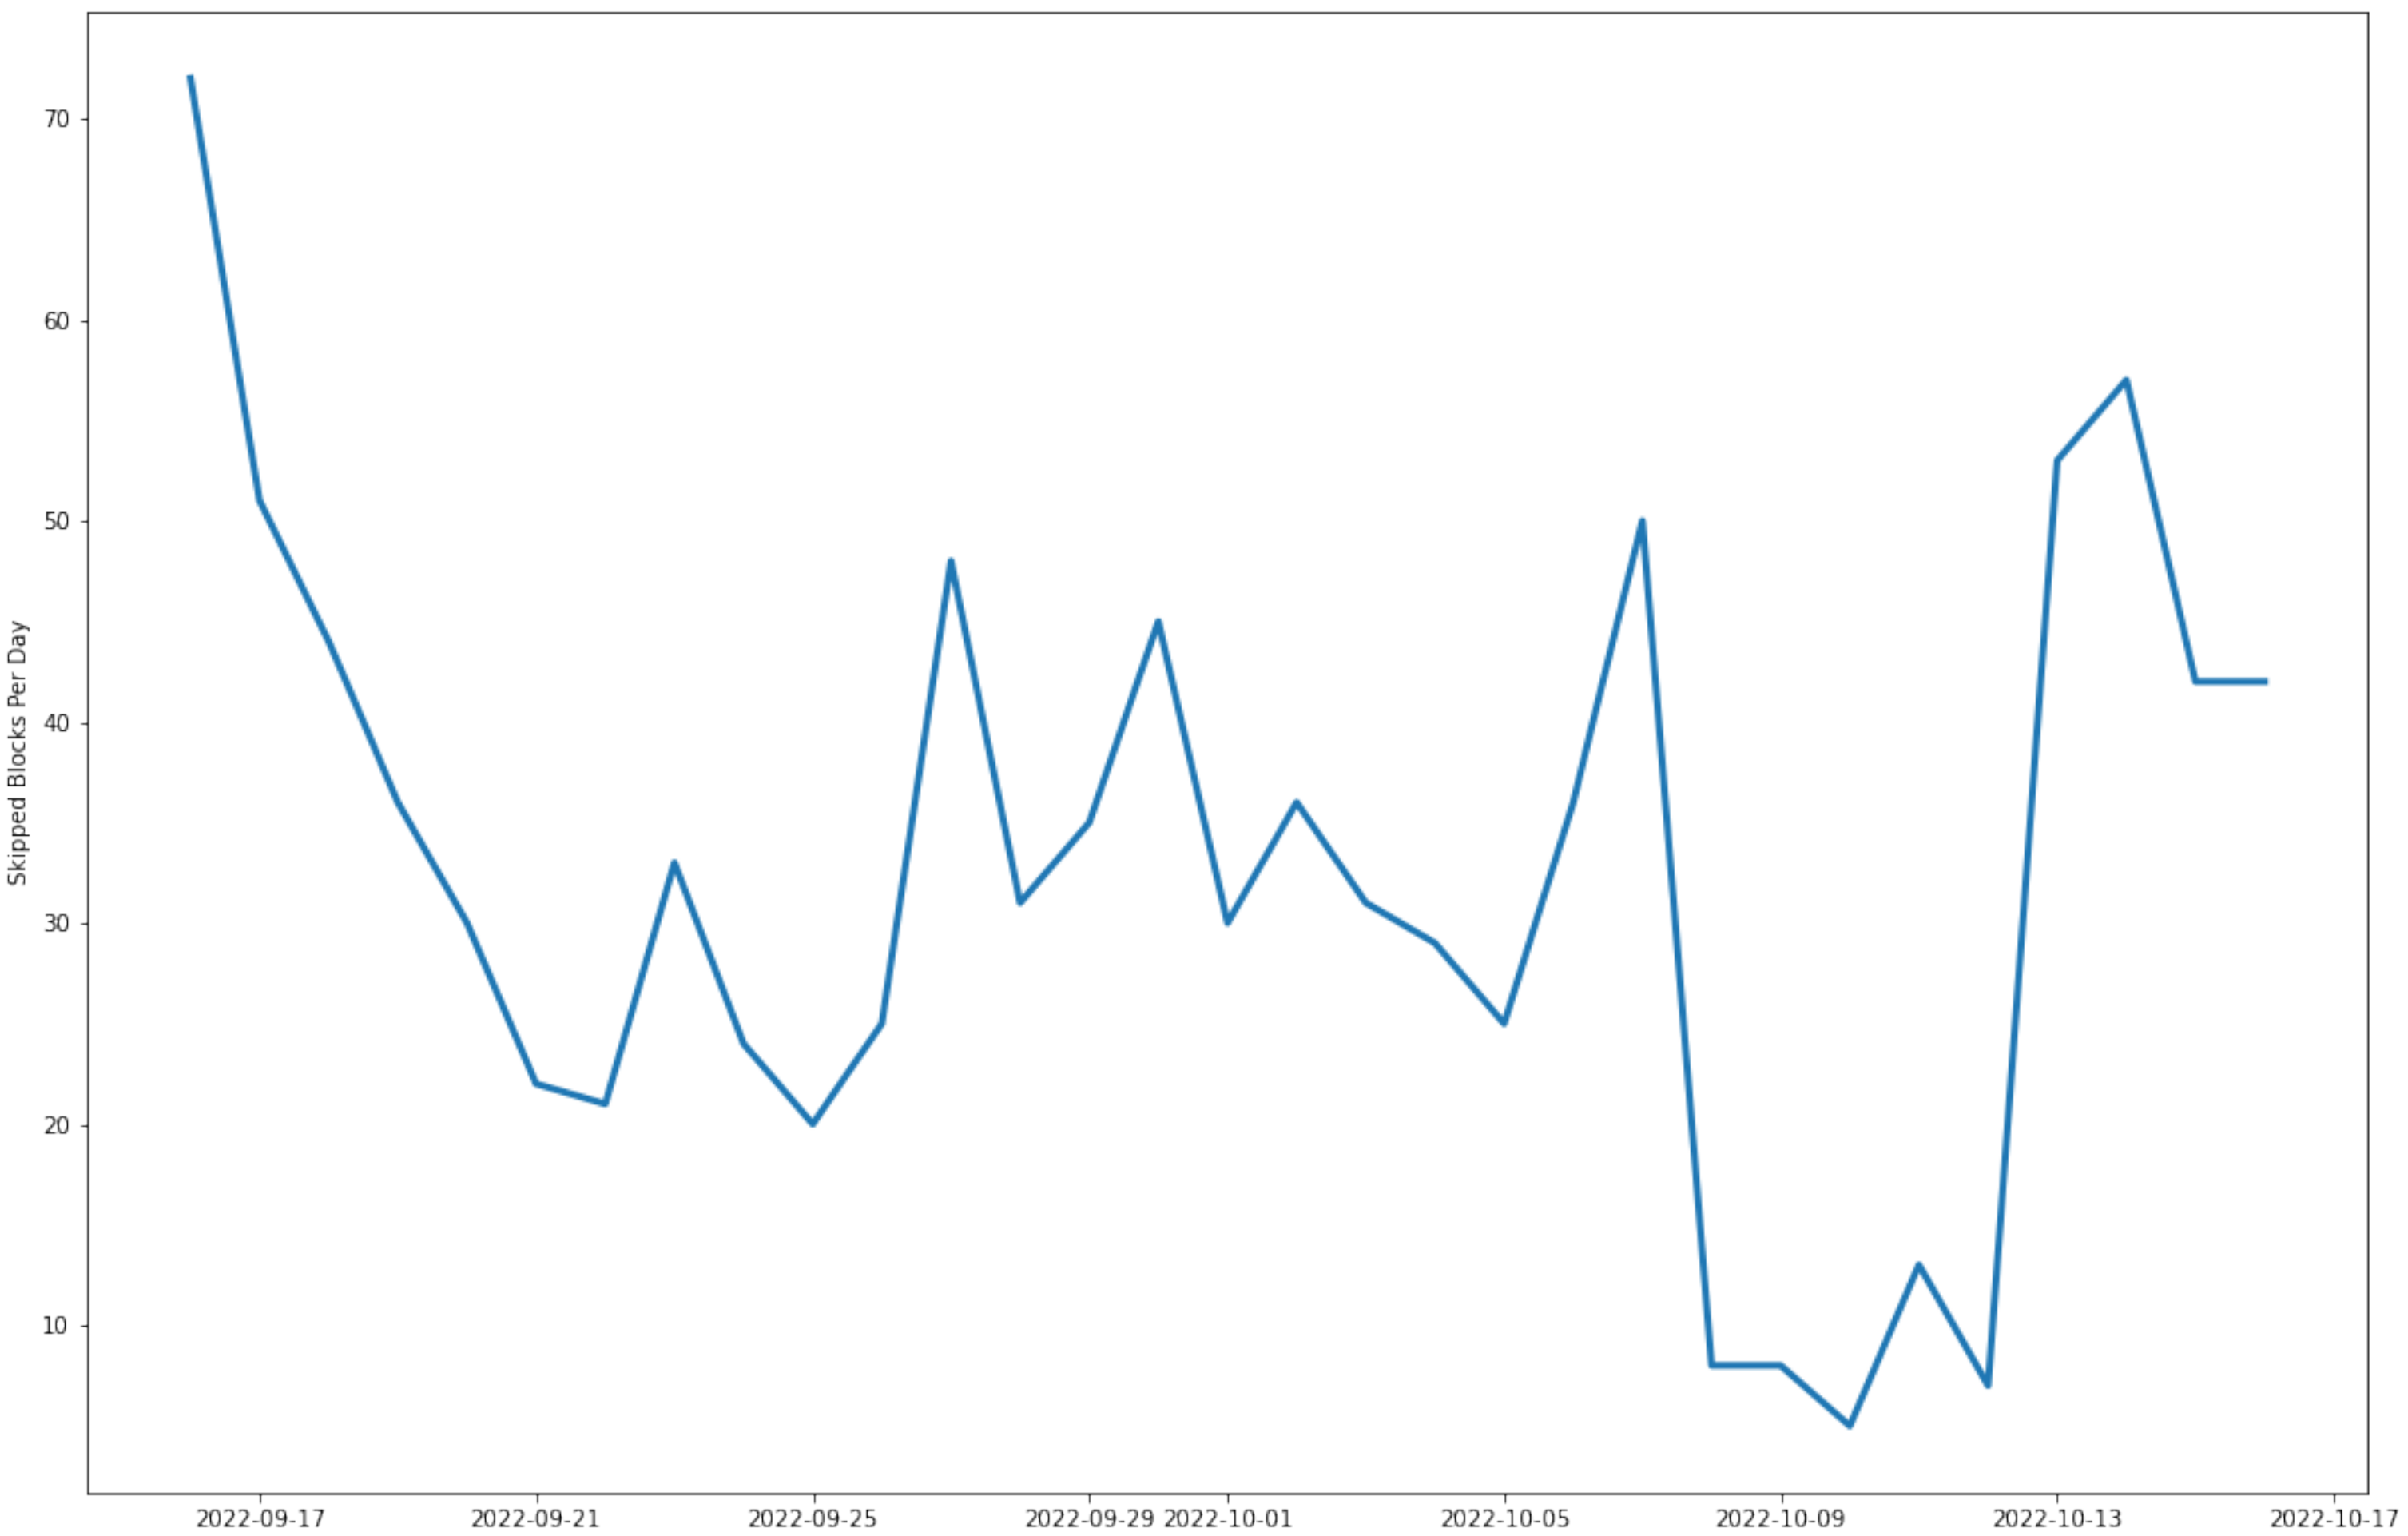
In fact, as seen in Figure 9, there were only 32.5 blocks per day, on average, that were not created exactly 12 s after the preceding block. All these blocks were created 24 s afterwards. This consistency occurs by design: blocks are now added by chosen validators into specific slots, each 12 s apart. The only reason why slots are “skipped”, is due to a failed block creation. JumpCrypto [15] notes that blocks can fail because of honest errors on the part of validators, either because of network failures or storage issues. The more serious concern, they emphasize, is sequential block failure, likely from malicious attacks or poor client implementations among a large number of validators. They report only two delays reaching one minute in over 900,000 blocks since the merge.
Increased and more stable block formation speed could allow for more on-chain activity. Pavloff et al. [16] suggests, however, that there may be limits to how quickly PoS networks can achieve consensus.
4. Descriptive Statistics for Other Networks
4.1. Polygon
Polygon is a layer 2 scaling solution on the Ethereum network. While it exists alongside the original chain, it creates a separate chain that is faster, maintaining higher transactions per second, and lowers fees per transaction.
We analyze Matic only transactions, the utility token on Polygon, and ERC-20 tokens in Table 9.
The merge’s cross network impact lowers Polygon’s Matic fees and raises token fees on the Mainnet. Neither change is statistically significant.
We will next analyze the network speed around the merge, as measured in Table 10.
The number of transactions per day fell by about 98,000 (3%), but this change is not statistically significant.
4.2. Solana
Solana is an open source, permissionless Layer 1 blockchain that relies on proof-of-history. (https://docs.solana.com/introduction. Accessed on 13 March 2023.) Through applications like Wormhole, (https://solana.com/news/wormhole---solana-ethereum-bridge. Accessed on 13 March 2023.) ETH and ERC-20 tokens are readily bridged to Solana. We make the comparison here to Solana because Ethereum’s planned move to sharding has been to match the transaction capabilities and lower fees of Solana. (DigitalTrend [17]).
In Table 11, we report a small reduction in fees, significant at the 1% level.
As for speed, Table 12 shows that the network, prior to the merge, processes almost 40 times as many transactions as Ethereum and 15 times as many as Polygon.
Solana slows by 48% after the merge. This appears to be related to issues to network outages on Solana. (Coin Telegraph, 13 August 2022, https://cointelegraph.com/news/ominous-solana-technicals-hint-at-sol-price-crashing-35-by-september. Accessed on 15 October 2022.) Despite this, Solana remains 19 times faster than Ethereum and eight times faster than Polygon.
5. Transfer Volume Results
We analyze transfer volume on Ethereum, Polygon, and Solana in two major stablecoins (Stablecoins are unique from other assets in that their value is pegged to another asset, typically fiat currency, namely USD. For more information on Stablecoins, see Mizrach [18]), USD Coin (USDC) and Tether (USDT). We choose these tokens because they are issued natively on the three platforms, (USD Coin: https://www.circle.com/en/usdc-multichain/; Tether: https://tether.to/en/transparency/. Both accessed 15 October 2022.) are traded actively, and have a stable value. Ethereum dominates the other two platforms prior to the merge with 89% of the transfer volume in USDC and 76% of the volume in USDT, as seen in Table 13 and Table 14.
Solana’s USDC volume rises more than 500 million per day, and it regains market share after the merge, rising from 6% to 11%.
Solana’s USDT volume average is again the only to rise after the merge. The transfer volume increase of 280 million per day raises its’ market share to 27% after the merge.
6. Discussion
The main social benefit from the merge has been the massive decrease in the amount of energy used by the network; continuation of proof-of-work was likely unsustainable.
Surprisingly though, transaction fees in Ether for both Ether-only and ERC-20 transactions have risen since the merge. However, as per Table 15, declining prices for the utility tokens lower network fees in USD, except for Matic transactions on Polygon.
As seen in Table 16, network activity rose slightly on Ethereum and fell slightly on Polygon. Solana has slowed by almost 50% which may be attributable to major network outages on 30 September and 1 October 2022. (https://status.solana.com/uptime?page=2. Accessed on 30 October 2022.)
7. Conclusions
The transition from proof-of-work to proof-of-stake has also reshaped the entire Ethereum landscape. The composition of block creators has entirely changed; there is not one miner from the PoW regime that is now proposing or attesting to blocks as a validator under the PoS regime. While gas transaction fees for network participants have grown since the merge, so has the amount of ETH burned. Block rewards were many times larger than the daily variable sum, distributed to the validators. Because of the loss of block rewards, increased burn rates, and more staked Ether, the total circulating supply is now deflationary.
There are several questions for future research. What will be the long run return to staking? This will depend upon what happens after the Shanghai upgrade enables stakers to withdraw their ETH. (https://www.bloomberg.com/news/articles/2022-09-14/-illiquidity-risk-is-a-side-effect-of-ethereum-crypto-upgrade. Accessed on 15 September 2022.) A second factor is the frequency of slashes in the validator pool. 216 validators have already been slashed for improper actions as validators. (https://www.blocknative.com/blog/an-ethereum-stakers-guide-to-slashing-other-penalties. Accessed on 15 January 2023).
Will decentralized staking systems like Lido dominate centralized exchanges like Coinbase? Will Ethereum gas fees eventually fall given the reduction in energy needed to secure the network? Will other proof-of-work networks look to transition to proof-of-stake or other less energy intensive models of block formation? Finally, will sharding, which effectively makes individual nodes into their separate blockchains, (https://ethereum.org/en/upgrades/sharding/. It is projected to arrive sometime in 2023. Accessed on 15 September 2022.) enable Ethereum to achieve latencies (Kertesz and Baniata [19] demonstrate that there is a tradeoff between validators’ computational abilities and network latencies.) and fees similar to Solana?
Lastly, major policy questions are still unresolved in the digital asset space. Specifically, Chairman Gensler of the SEC has suggested that staking may qualify certain blockchains as securities, as per the Howey Test, (Paul Kiernan and Vicky Ge Huang, Ether’s New ‘Staking’ Model Could Draw SEC Attention. Wall Street Journal, 16 September 2022. Accessed on 15 October 2022.) though Ethereum is currently classified as a commodity by the Commodity Futures Trading Commission (CFTC). (The CFTC asserts this in their filing again Sam Bankman-Fried: A digital asset is anything that can be stored and transmitted electronically and has associated ownership or use rights. Digital assets … function as mediums of exchange, units of account, and/or stores of value. Certain digital assets are “commodities”, including … ether (ETH) … as defined under Section 1a(9) of the Act, 7 U.S.C. § 1a(9).) Kraken has recently discontinued its Staking-As-A-Service program as part of a $30 million settlement with the SEC. (https://www.sec.gov/news/press-release/2023-25. Accessed on 15 February 2023.) Gensler has made it clear (https://www.sec.gov/news/statement/gensler-statement-custody-021523. Accessed on 15 February 2023.) that centralized exchanges are not “qualified custodians”, so this action against Kraken could potentially be applied more broadly. If the custodial rules were also applied to on-chain assets like Lido, nearly 50% of staked Ether could be impacted.
Author Contributions
Both authors contributed equally to the manuscript. All authors have read and agreed to the published version of the manuscript.
Funding
This research received no external funding.
Data Availability Statement
All of the data are available publicly: (1) the Ethereum network data are from Kaggle; (2) Beacon Chain data are from Bitquery; (3) Polygon data are from Quicknode; (4) The Solana data are from its’ command line interface.
Conflicts of Interest
The authors have no conflict of interest.
References
- De Vries, A. Bitcoin’s Growing Energy Problem. Joule 2018, 2, 801–805. [Google Scholar] [CrossRef] [Green Version]
- McDonald, K. Ethereum Emissions: A Bottom-up Estimate. arXiv 2022. [Google Scholar] [CrossRef]
- Krause, M.J.; Tolaymat, T. Quantification of Energy and Carbon Costs for Mining Cryptocurrencies. Nat. Sustain. 2018, 1, 711–718. [Google Scholar] [CrossRef]
- US Energy Information Administration Electricity Data Page. Available online: https://www.eia.gov/international/data/world/electricity/electricity-consumption (accessed on 15 February 2023).
- Buterin, V. A Proof of Stake Design Philosophy. 2016. Available online: https://medium.com/@VitalikButerin/a-proof-of-stake-design-philosophy-506585978d51 (accessed on 15 September 2022).
- Randao.org. Randao: Whitepaper Verifiable Random Number Generation. 2017. Available online: https://www.randao.org/ (accessed on 15 September 2022).
- Edgington, B. Upgrading Ethereum. Published 16 November 2022. Available online: https://eth2book.info/altair/ (accessed on 25 November 2022).
- Park, D.; Zhang, Y.; Rosu, G. End-to-End Formal Verification of Ethereum 2.0 Deposit Smart Contract; Springer: Berlin/Heidelberg, Germany, 2020; pp. 151–164. [Google Scholar]
- Baniata, H.; Kertesz, A. PF-BVM: A Privacy-aware Fog-enhanced Blockchain Validation Mechanism. In Proceedings of the 10th International Conference on Cloud Computing and Services Science, Prague, Czech Republic, 7–9 May 2021; pp. 430–439. [Google Scholar] [CrossRef]
- Digicomomist. Ethereum Energy Consumption Index. 2022. Available online: https://digiconomist.net/ethereum-energy-consumption (accessed on 15 October 2022).
- Pintail. Beacon Chain Validator Rewards. 2021. Available online: https://pintail.xyz/posts/beacon-chain-validator-rewards/ (accessed on 15 September 2022).
- Jensen, J.R. Multi-block MEV. arXiv 2023. [Google Scholar] [CrossRef]
- Heimbach, L.; Schertenleib, E.; Wattenhofer, R. DeFi Lending During The Merge. arXiv 2022. [Google Scholar] [CrossRef]
- Donmez, A.; Karaivanov, A. Transaction Fee Economics in the Ethereum Blockchain. Econ. Inq. 2022, 60, 265–292. [Google Scholar] [CrossRef]
- JumpCrypto. Bridging and Finality: Ethereum 2023. Available online: https://jumpcrypto.com/bridging-and-finality-ethereum/ (accessed on 12 March 2023).
- Pavloff, U.; Amoussou-Guenou, Y.; Tucci-Piergiovanni, S. Ethereum Proof-of-Stake under Scrutiny. arXiv 2022. [Google Scholar] [CrossRef]
- DigitalTrend. Solana vs. Ethereum: Competing to Power the Future. Seek. Alpha 2021. Available online: https://seekingalpha.com/article/4455342-solana-vs-ethereum-competing-to-power-the-future (accessed on 11 March 2023).
- Mizrach, B. Stablecoins: Survivorship, Transactions Costs and Exchange Microstructure. arXiv 2023. [Google Scholar] [CrossRef]
- Kertesz, A.; Baniata, H. Consistency Analysis of Distributed Ledgers in Fog-Enhanced Blockchains. In Proceedings of the Euro-Par 2021: Parallel Processing Workshops, Glasgow, UK, 22–26 August 2022; pp. 393–404. [Google Scholar]
Figure 1.
Electricity Consumption of the Ethereum Network. Data are collected by Digicomomist [10].
Figure 1.
Electricity Consumption of the Ethereum Network. Data are collected by Digicomomist [10].

Figure 2.
Cumulative Stake in the Ether Deposit Contract.

Figure 3.
Cumulative Supply in the Lido Staking Token.

Figure 4.
Total Block Income in Ether.

Figure 5.
Ethereum Supply. The data are from Coinmetrics.

Figure 6.
Median Fees for Ether Transactions in U.S. Dollars ($USD).

Figure 7.
Median Fees for Ether Token Transactions.

Figure 8.
Transactions per Day.

Figure 9.
Skipped Blocks per Day.


Table 1.
Ethereum Blockchain Pre- and Post-Merge.
| Index | Block_Datetime | Block_Number | Nonce | Miner | Difficulty | Gas_Used | Transaction_Count |
|---|---|---|---|---|---|---|---|
| 1614 | 2022-09-15 06:42:35 | 15537391 | 12406352646189512271 | 0x829bd824b016326a401d083b33d092293333a830 | 11043900012338719 | 16,969,164 | 105 |
| 1615 | 2022-09-15 06:42:36 | 15537392 | 2534119505591571417 | 0xea674fdde714fd979de3edf0f56aa9716b898ec8 | 11049842297455506 | 29,990,952 | 61 |
| 1616 | 2022-09-15 06:42:42 | 15537393 | 7107786832965619657 | 0x829bd824b016326a401d083b33d092293333a830 | 11055787484078698 | 29,991,429 | 1 |
| 1617 | 2022-09-15 06:42:59 | 15537394 | 0 | 0xeee27662c2b8eba3cd936a23f039f3189633e4c8 | 0 | 29,983,006 | 80 |
| 1618 | 2022-09-15 06:43:11 | 15537395 | 0 | 0x0b3b161b8abeb6b04cb95c3e6047f80c120a0292 | 0 | 29,982,083 | 29 |
| 1619 | 2022-09-15 06:43:23 | 15537396 | 0 | 0x388c818ca8b9251b393131c08a736a67ccb19297 | 0 | 29,980,461 | 170 |
Note: Nonce and difficulty, which were critical to proof-of-work, are now empty since they are not part of proof-of-stake. The miner column is now populated by the validator.
Table 2.
Most Active Miners Leading into the Merge.
| Miner Address | Blocks Formed | No. Trans. | Miner Names |
|---|---|---|---|
| 0xea674fdde714fd979de3edf0f56aa9716b898ec8 | 56,960 | 11,437,974 | Ethermine |
| 0x829bd824b016326a401d083b33d092293333a830 | 29,304 | 5,231,405 | F2Pool |
| 0x1ad91ee08f21be3de0ba2ba6918e714da6b45836 | 20,436 | 2,967,793 | Hiveon |
| 0x00192fb10df37c9fb26829eb2cc623cd1bf599e8 | 14,452 | 2,253,984 | 2Miners |
| 0x7f101fe45e6649a6fb8f3f8b43ed03d353f2b90c | 9859 | 1,397,143 | Flexpool |
| 0x2daa35962a6d43eb54c48367b33d0b379c930e5e | 7004 | 1,086,420 | Poolin 2 |
| 0x52bc44d5378309ee2abf1539bf71de1b7d7be3b5 | 5419 | 1,035,186 | Nanopool |
| 0x3ecef08d0e2dad803847e052249bb4f8bff2d5bb | 4432 | 816,551 | Mining Pool Hub |
| 0xb7e390864a90b7b923c9f9310c6f98aafe43f707 | 4390 | 777,536 | Unknown1 |
| 0xcd458d7f11023556cc9058f729831a038cb8df9c | 3803 | 628,777 | Poolin 4 |
Table 3.
Eth 2.0 Deposit Contract.
| Smart Contract Address: | 0x00000000219ab540356cbb839cbe05303d7705fa |
| Name: | Beacon Deposit Contract |
| Creator: | 0xb20a608c624Ca5003905aA834De7156C68b2E1d0 |
| Deployed: | 2020-10-14 |
| Block: | 11,052,984 |
| Transaction hash: | 0xe75fb554e433e03763a1560646ee22dcb74e5274b34c5ad644e7c0f619a7e1d0 |
| Balance on 2022-08-14: | 13,291,512 ETH |
| Balance on 2022-10-16: | 13,836,087 ETH |
Table 4.
Most Active Block Proposers Since the Merge.
| Fee Receiver Address | Blocks Vldtd. | No. Trans. | Validator Name |
|---|---|---|---|
| 0xdafea492d9c6733ae3d56b7ed1adb60692c98bc5 | 45,688 | 8,809,237 | Flashbots |
| 0x388c818ca8b9251b393131c08a736a67ccb19297 | 36,753 | 5,536,598 | Lido Execution Layer |
| 0x4675c7e5baafbffbca748158becba61ef3b0a263 | 32,827 | 4,265,292 | Coinbase |
| 0xf2f5c73fa04406b1995e397b55c24ab1f3ea726c | 10,891 | 2,176,154 | bloXroute: Max Profit |
| 0xebec795c9c8bbd61ffc14a6662944748f299cacf | 10,540 | 1,383,861 | Contract1 |
| 0xe688b84b23f322a994a53dbf8e15fa82cdb71127 | 9197 | 1,221,402 | Address1 |
| 0x690b9a9e9aa1c9db991c7721a92d351db4fac990 | 7903 | 1,694,011 | builder0x69 |
| 0x199d5ed7f45f4ee35960cf22eade2076e95b253f | 5045 | 1,057,766 | bloXroute: Regulated |
| 0x6d2e03b7effeae98bd302a9f836d0d6ab0002766 | 4793 | 587,538 | Address2 |
| 0xb646d87963da1fb9d192ddba775f24f33e857128 | 3577 | 766,706 | MEV Builder |
Table 5.
Daily Block Income Before and After the Merge.
| Measure | Pre- | Post- | t-Stat | p-Val |
|---|---|---|---|---|
| Block Tx Fees (Ether) | 1675 | 1889 | 1.41 | 0.1643 |
| Block Burn Fees (Ether) | 1207 | 1413 | 1.41 | 0.1648 |
| Total Block Income (Ether) | 12,462 | 479 | −300.95 | 0.0000 |
| Total Block Income (USD) | $20,732,030 | $638,820 | −61.52 | 0.0000 |
Table 6.
Ether Transaction Fees Before and After the Merge.
| Measure | Pre- | Post- | t-Stat | p-Val |
|---|---|---|---|---|
| Gas Price (Gwei) | 17.3279 | 22.6959 | 2.76 | 0.0070 |
| Gas Used | 6.8570 | 7.3321 | 3.85 | 0.0002 |
| Fees in Ether | 1.1719 | 1.2872 | 3.60 | 0.0005 |
| Fees in USD | $1.9453 | $1.7031 | −1.62 | 0.0906 |
Table 7.
ERC-20 Token Transaction Fees Pre- and Post-Merge.
| Measure | Pre- | Post- | t-Stat | p-Val |
|---|---|---|---|---|
| Gas Price (Gwei) | 18.8273 | 18.3042 | −0.35 | 0.7246 |
| Gas Used | 1.1104 | 1.1443 | 1.86 | 0.0670 |
| Fees in Ether | 1.9458 | 1.9706 | 0.14 | 0.8868 |
| Fees in USD | $3.2387 | $2.6106 | −2.56 | 0.0131 |
Table 8.
Daily Average Transactions Before and After the Merge.
| Measure | Pre- | Post- | t-Stat | p-Val |
|---|---|---|---|---|
| Transactions per day | 1,073,508 | 1,148,750 | 5.29 | 0.0 |
Table 9.
Transaction Fees on Polygon Before and After the Merge.
| Measure | Pre- | Post- | t-Stat | p-Val |
|---|---|---|---|---|
| Matic Fees in USD | $0.0232 | $0.0242 | 0.28 | 0.78 |
| Token Fees in USD | $0.1333 | $0.1244 | −0.39 | 0.70 |
Table 10.
Polygon Daily Network Volume.
| Measure | Pre- | Post- | t-Stat | p-Val |
|---|---|---|---|---|
| Transactions per day | 2,821,632 | 2,729,498 | −1.49 | 0.14 |
Table 11.
Token Transaction Fees on Solana Before and After the Merge.
| Measure | Pre- | Post- | t-Stat | p-Val |
|---|---|---|---|---|
| Token Fees in USD | $0.0011 | $0.0008 | −3.32 | 0.001 |
Table 12.
Solana Daily Network Volume.
| Measure | Pre- | Post- | t-Stat | p-Val |
|---|---|---|---|---|
| Transactions per day | 42,400,730 | 22,127,360 | −6.89 | 0.000 |
Table 13.
USDC Average Daily Transfer Volume in Billons (ADVbn.).
| USD Coin ADV bn. | Pre | Post | t-Stat | p-Val |
|---|---|---|---|---|
| Ethereum | 13.81 | 11.02 | −1.75 | 0.09 |
| Polygon | 0.63 | 0.47 | −1.88 | 0.07 |
| Solana | 1.00 | 1.53 | 1.65 | 0.12 |
Table 14.
USDT Average Daily Transfer Volume in Billons (ADVbn.).
| Tether ADV bn. | Pre | Post | t-Stat | p-Val |
|---|---|---|---|---|
| Ethereum | 2.97 | 2.75 | −0.97 | 0.34 |
| Polygon | 0.16 | 0.14 | −1.21 | 0.23 |
| Solana | 0.80 | 1.08 | 1.52 | 0.14 |
Table 15.
Fees in USD on Ethereum, Polygon and Solana.
| Pre- | Post- | |
|---|---|---|
| Ether Transactions | $1.9453 | $1.7031 |
| Ethereum Tokens | $3.2387 | $2.6106 |
| Polygon Matic Transactions | $0.0232 | $0.0242 |
| Polygon Tokens | $0.1333 | $0.1244 |
| Solana Tokens | $0.0011 | $0.0008 |
Table 16.
Daily Transaction Volume on Ethereum, Polygon and Solana.
| Transactions per Day | Pre- | Post- |
|---|---|---|
| Ethereum | 1,073,508 | 1,148,750 |
| Polygon | 2,821,632 | 2,729,498 |
| Solana | 42,400,730 | 22,127,360 |
Disclaimer/Publisher’s Note: The statements, opinions and data contained in all publications are solely those of the individual author(s) and contributor(s) and not of MDPI and/or the editor(s). MDPI and/or the editor(s) disclaim responsibility for any injury to people or property resulting from any ideas, methods, instructions or products referred to in the content. |
© 2023 by the authors. Licensee MDPI, Basel, Switzerland. This article is an open access article distributed under the terms and conditions of the Creative Commons Attribution (CC BY) license (https://creativecommons.org/licenses/by/4.0/).
Share and Cite
MDPI and ACS Style
Kapengut, E.; Mizrach, B. An Event Study of the Ethereum Transition to Proof-of-Stake. Commodities 2023, 2, 96-110. https://doi.org/10.3390/commodities2020006
AMA Style
Kapengut E, Mizrach B. An Event Study of the Ethereum Transition to Proof-of-Stake. Commodities. 2023; 2(2):96-110. https://doi.org/10.3390/commodities2020006
Chicago/Turabian StyleKapengut, Elie, and Bruce Mizrach. 2023. "An Event Study of the Ethereum Transition to Proof-of-Stake" Commodities 2, no. 2: 96-110. https://doi.org/10.3390/commodities2020006