1. Introduction
Economic growth and development will come to a country much more quickly if it is endowed with a richness of natural resources. A country’s production, output, and exports depend on its natural resources; hence, natural resources are indispensable for economic production and consumption [
1]. Water, minerals, metals, solar energy, and wind are a few natural resources that produce items that satisfy our need for nourishment [
2]. Humans rely on natural resources. Natural resources play an essential part in our lives; therefore, it is crucial that we conserve and value them, as they are dwindling with time. Consequently, it is crucial to protect these natural riches for future generations [
3]. There are two types of natural resources: biotic and abiotic natural resources. Biotic natural resources are derived from the ecosystem’s live species, which include animals, birds, forests, and sea life. It includes organic materials, such as fossil fuels, coal, and gases, created from the decomposition of once-living species, also known as biosphere or ecosphere natural resources. This type of resource affects the survival of living organisms, because when a country has abundant natural resources and effectively uses them, it achieves wealth, which is beneficial for human survival. In contrast, when a nation has few natural resources and meagrely exploits them, it will experience failure. Abiotic natural resources are those resources that consist of nonliving items found in an ecosystem. Examples of abiotic natural resources include land, metals, water, air, sunshine, minerals, and soil. Abiotic resources consist of all non-organic or non-primary material. Everything not derived from biotic resources or living beings falls under this category. The term describes the land, but not the product it generates. Manufacturing requires various minerals and materials, including gypsum, talc, sand, limestone, and clays, all considered raw materials [
4]. When there are few resources in an economy, natural rivalry for resources occurs, leading to survival of the few who compete while the majority perishes due to resource scarcity. These finite abiotic resources include water, land, and minerals such as iron, copper, silver, and titanium. Developed countries notably have more natural resources and are wealthy in biotic and abiotic natural resources [
5]. When a country is rich in natural resources and uses them in producing and consuming goods (including fossil fuel resources used for transport, production of chemicals, and energy use), the economy grows and develops. Furthermore, biotic and abiotic natural resources are interdependent. Countries that are rich in natural resources but have slow-growing economies are usually less developed, due to an inadequate distribution of resources. The idea that describes this occurrence is the natural resource curse. Therefore, according to this condition, countries with more natural resources can be less developed than countries with fewer natural resources, due to inefficient resource allocation [
6].
Many factors contribute to the worsening status of nations and the natural resource curse theory. However, the primary cause of this worsening state is inefficient resource allocation, which may indicate a lack of technology and poor governance mechanisms in the country [
7]. Large amounts of resources are invested in particular sectors or industries, leading to the deterioration of other areas of the economy and causing long-term economic instability. However, certain nations are wealthy in natural resources and have a high GDP per capita. Five of the top eight countries in terms of natural resource riches are also among the highest-ranking nations in terms of income. One of the side effects of inefficient extraction and allocation of natural resources is the damage to a country’s environment. Most developing nations lack the advanced machinery and technology necessary to efficiently use their natural resources. As a result, they exploit them and destroy their environment, which results in raised GHG emissions [
8]. Pakistan is an Islamic nation in Central Asia, South Asia, and the Middle East, and it possesses abundant natural resources, including the fertile fields of Punjab, the Indus River, and the Arabian Sea. Pakistan is a nation with abundant natural resources and a favourable topography. Pakistan is teeming with wildlife, from dolphins to snow leopards along the Indus River, yet several problems have arisen due to the destruction of their habitats. In addition, Pakistan’s Himalayas, Karakorum, and Hindu Kush mountains act as barriers against monsoon winds from the south. The Baluchistan Plateau is a stunning expanse of land in Pakistan. To the south of Pakistan, the Arabian Sea contains substantial oil and gas reserves. Pakistan is endowed with an abundance of mineral resources that can be utilized to create inexpensive and productive raw materials [
9]. These mineral assets include coal, marble, chromite, limestone, copper, gypsum, gold, mineral salt, clay, ore, silver, silica sand, gems, and precious stones. Most of Pakistan’s energy supply comes from its oil, gas resources, and biomass. Pakistan’s natural gas and oil resources are also abundant. Pakistan has vast agricultural resources. The agriculture industry uses these resources to produce items for domestic use and export agricultural products in huge quantities. Pakistan possesses a reasonable quantity of petroleum and a small quantity of natural gas that can be used to provide energy for industrial manufacturing and fertilizer production [
10]. In 1915, Pakistan discovered for the first time that it was endowed with petroleum and natural gas. In the 1980s, oil deposits were discovered in the Potowar Plateau region and Sindh.
Pakistan‘s forest sector is a significant source of medicine, fuel wood, lumber, food, and natural tourism; it safeguards the local ecosystem. The forest is also vital to wildlife as trees provide food and shelter, and all living things require oxygen. Pakistan has a total forest cover percentage of 1.91%.
The Reko Diq mine is one of Pakistan’s largest gold and copper mines. The Reko Diq mine is located in Baluchistan’s Chaghi District. This mine can produce tonnes of copper and gold, significantly benefiting Pakistan’s economy. The Pothohar Plateau is home to Pakistan’s rock salt, which is essential. These minerals are extremely valuable natural resources for the country’s progress because they contribute to economic production. Coal is primarily used to create energy and power engines. Pakistan’s coal reserves are insufficient to meet current demands. Coal is a natural resource in Pakistan. However, it is not of sufficient grade to power manufacturing engines [
11]. These coal reserves satisfy 10 percent of the country’s needs. As Pakistan is an agricultural nation, its arable land is considered one of its most important natural resources because it significantly contributes to its GDP. In 2005, there were around 30.44 million hectares of cultivated land, but now, there are only 22.1 million hectares of cultivated land. Many factors contribute to the loss of arable land. Pakistan has an abundance of natural resources and has shown positive utilization for production and manufacturing [
12]. When resources are utilized appropriately, a nation can progress toward prosperity and development; therefore, oil prices favour Pakistan’s economic growth. Using natural resources for energy production is one of the causes of environmental degradation in Pakistan, as burning fossil fuels for energy production increases greenhouse gas emissions and promotes environmental degradation [
13].
Based on this critical discussion, the following research questions arise: (1) Does the change in prices of natural resources in Pakistan hurt the environment? Academics and researchers are still talking about the resource price paradox. At the same time, most past research found that unstable resource prices slow a country’s economic growth because they cause environmental damage. Natural resources that cannot be used because they cannot be taken out with technology tend to run out and become more expensive, which is terrible for the environment. The development of cleaner technology for extracting resources would help to reduce damage to the environment and keep the prices of resources stable. (2) How much does continued economic growth, high-tech exports, and FDI damage the environment? In the short term, exports have grown due to the use of natural resources, which has helped the economy grow. Nevertheless, in the long run, this leads to more FDI in the sector, which is bad for overall health as it pollutes the environment and wastes natural resources. (3) Does using more green energy help reduce GHG emissions by keeping natural resources in good condition? Using more renewable energy sources in economic production helps to protect natural resources and reduce carbon emissions, which is good for the country’s health. The stated research questions were formed into study objectives:
- (i)
To examine the natural resources price paradox and link it with Pakistan’s GHG emissions to substantiate the resource curse hypothesis.
- (ii)
To analyze the impact of high-tech exports and inbound FDI on GHG emissions to verify technology-embodied emissions and pollution haven hypothesis, and
- (iii)
To examine the role of renewable energy supply in sustaining resource commodity prices to mitigate GHG emissions.
The stated objectives were achieved by utilizing sophisticated statistical techniques to reach some sustainable suggestions.
2. Literature Review
The resource curse paradox is widely discussed in the literature [
12]. Commodity pricing has adversely affected economic growth and environmental degradation, causing more health damage worldwide. The resource curse hypothesis is mainly evident in resource-abundant economies, leading to more adverse environmental consequences. The following literature highlighted the main concern that helped to identify the existing policy gap and help move toward sustaining resource prices. Haseeb et al. [
14] investigated the effect of natural resources on economic growth, using time series data from 1970 to 2018 in the top five natural resource-rich Asian economies. The results showed a positive relationship between the stated factors and verified the resource blessing hypothesis, except for India, where the impact of resource wealth on economic growth was negative and cursed. The study concluded that the government must adopt policies that effectively utilize resource capital for economic development. Nathaniel [
15] investigated the connection between the natural resources, intellectual capital, output growth, and ecological footprint in ASEAN nations from 1990–2016. The results indicated that resource capital and wealth output harmed the natural environment. Even human capital could not reduce environmental degradation on the premises of the underutilization of natural resources. In Lao, PDR, and Thailand, natural resources had no detrimental impact on the environment; however, in other ASEAN nations, they were damaging. Effective policymaking can prevent environmental degradation and sustain natural and intellectual resource capital.
Zhang et al. [
16] examined the relationship between resource capital and environmental degradation in Pakistan from 1985 to 2018. The results showed that, in the presence of an EKC, carbon emissions increased due to a lack of human capital formation and meagre economic growth. The research concluded that future generations could minimize their environmental impact through education and strict enforcement of government rules in Pakistan. Lee et al. [
17] postulated that ecological footprint, international migrant stocks, industrial value added, and population expansion affected natural resource capital. The study surveyed a large cross-section of 138 nations and their results confirmed their hypothesis. Their conclusion was that international migration should be capped as it endangers ecological stability. Abbasi et al. [
18] identified the impact of resource depletion, energy consumption, population growth, economic expansion, and industrial value added on CO
2 emissions in the UK from 1970 to 2019. In the short term, all these factors increased carbon emissions, but in the long term, energy efficiency, cleaner production, and population ingenuity led to a sustainable environment. According to the findings, the government of the United Kingdom has put significant emphasis on policies and programs that will positively impact environmental sustainability in the long run. Dagar et al. [
19] determined the relationship between capital formation, land and resources, commercial production, sustainable energy resources, total reserve, and environmental deterioration in 38 OECD countries from 1995 to 2019. Even though other factors, such as economic growth, manufacturing output, and total reserves, were the primary drivers of environmental degradation, using clean energy and resource extraction was a necessary preliminary step in ensuring environmental sustainability. According to the findings, the OECD’s environments are deteriorating and can only be reversed through strict policy mandates. Asif et al. [
20] investigated the effect of natural resource rents, domestic investment, trade openness, and per capita income on Pakistan’s financial development. The study covered the years 1975 through 2017. In the short run, natural resource rent positively affects a country’s financial development, confirming the natural resource abundance theory. However, natural resource rent harms financial development in the long run, supporting the natural resource curse hypothesis. In conclusion, countries afflicted by the resource curse should regulate effective government policies and maintain reasonable spending levels. Zaidi et al. [
21] examined the effects of globalization, natural resources, and human capital on economic growth in thirty-one OECD nations. This study spanned the years 1990 to 2016. Results showed that nation GDP growth and financial deepening were positively impacted by internationalization, environmental assets, and intellectual resources. Protecting globalization, encouraging the growth of financial institutions, and optimizing the use of Earth’s resources are all desirable goals.
The stated literature review focused on the three main aspects of the resource commodity market: (i) the impact of natural resource market on economic development, (ii) resource pricing, and (iii) the pollution damage function. The hypothesis of this study is as follows:
H1: Price paradox in the resource market is anticipated to negatively react to environmental quality, supporting the pollution resource curse hypothesis.
Shen et al. [
22] investigated the connection between natural resource rents, green investment, financial development, energy use, and carbon emissions in thirty Chinese provinces from 1995 to 2017. The results showed a positive correlation between CO
2 emissions and energy consumption, resource income, and productivity expansion, and a negative correlation between green investment and carbon intensity. It was proposed that the country should limit its CO
2 emissions by encouraging green investments and supporting measures beneficial for environmental sustainability. Yasmeen et al. [
23] analyzed the effect of natural resources, energy consumption, and gross capital formation on Pakistan’s economic growth from 1990 to 2018. The result substantiates the resource curse hypothesis in the country. The openness of renewable, non-renewable, and financial resources positively affected economic growth. However, financial openness could not transform the natural resource curse hypothesis into a blessing hypothesis. According to the research, a country can escape its “resource curse” if its leaders implement sound policies and efficiently use its natural assets. Usman et al. [
24] investigated the relationship between financial development, energy consumption, natural resources, and globalization on economic growth and environmental quality in the eight Arctic countries from 1990 to 2017. The data showed that the Arctic economy benefitted from financial expansion, resource endowment, globalization, and power consumption, but suffered less environmental sustainability. Consequently, such regulations were put in place to protect the environment, but they did not significantly affect economic development. Rahim et al. [
25] found the dynamic relationship between economic output, resource endowment, intellectual capital, financial soundness, manufacturing output, innovation process, and foreign trade in the panel of Eleven nations from 1990 to 2019. The resource curse still affected the Next Eleven countries, even though their natural resources are rented to help their economies grow. Human capital development helped reduce the resource curse, and natural resources, manufacturing, scientific advancement, and open markets contributed to economic prosperity. Based on these results, various policies were put into place to foster greater development of human resources, which in turn helped to break the resource curse and stimulated other aspects of economic growth in the Next Eleven countries.
Anyanwu et al. [
26] analyzed the effect of income inequality on economic development in a wide panel of resource-rich and resource-poor nations between 1988 and 2012. The results indicated that countries with plentiful natural resources had income inequality, which negatively affected their economic progress. The study concluded that lowering income disparity was necessary to boost economic growth, even when ample resources were available. Sun and Wang [
27] proposed a link between natural resources, environmental pollution, and economic development across 30 Chinese regions and utilized data from 2000 to 2019. The findings confirmed that these regions were afflicted by the resource curse, as the exploitation of natural resources hurt the environment and economic growth. China should take action to reduce the damaging consequences of natural resource extraction. Between 1980 and 2018, Xiaoman et al. [
28] analyzed the effect of natural resource abundance and economic globalization on environmental quality in the Middle East and North Africa (MENA). Their conclusions pointed to globalization and an abundance of natural resources as the means to improve environmental quality. However, environmental sustainability should not be pursued at the expense of free commerce, urbanization, and economic expansion. Natural resource abundance and economic globalization forge a connection between environmental viability and commercial openness. The research shows that if a country wants to attain environmental sustainability, it must put decent policies in place. Zia et al. [
29] investigated the influence of economic expansion, natural resources, human capital, and financial development on China’s ecological footprint from 1985 to 2018. The EKC for the country showed that the ecological footprint grew in tandem with the nation’s stock of environmental assets, intellectual resources, economic deepening, and wealth creation. The study showed that a nation has to implement programs to increase environmental awareness among its citizens if it wants to reduce its environmental impact. The relationship between economic growth and environmental sustainability was hypothesized by Kurniawan et al. [
30]. This analysis encompassed 140 nations and covered the period from 1990 to 2014 for analysis. The data confirmed the long-term effects of economic expansion and population density on natural capital. Nevertheless, tremendous pressure is being placed on natural capital due to the growing population. According to research findings, effective natural resource management strategies must be implemented to achieve sustainable development. Agboola et al. [
31] studied Saudi Arabia’s power usage, fuel rents, air pollution, productivity growth, and environmental resource from 1971 to 2016. The data showed that increased energy use was associated with more severe environmental impacts in the short and long term. There is, nonetheless, a positive link between total resource extraction and carbon emissions. This research concluded that Saudi Arabia has taken action to improve its economy and environment.
The literature comes to the conclusion that the deployment of green energy infrastructure would help to improve environmental quality and sustaining resource pricing worldwide. Based on the findings, the study’s second hypothesis is as follows:
H2: Renewable energy supply will likely improve environmental quality and sustain resource pricing.
Ozturk et al. [
32] showed that Pakistan, India, and China’s economic expansion quadrupled their carbon emissions. As countries economically improve, environmental damage will double. The study showed that the energy intensity of Pakistan, India, and China increased environmental harm. Governments should implement a strict carbon emissions controlling system and link it with emissions cap trading to minimize environmental hazards. Khan et al. [
33] analyzed the effects of energy transitions, energy consumption, natural resources, and urbanization on ecological footprints and economic growth. This study covered OECD nations between 1990 and 2015. The findings confirmed that increasing energy transitions, renewable energy consumption, and natural resources increased environmental quality. In contrast, urbanization and non-renewable energy increased both environmental deterioration and economic growth. The research found that countries should prioritize energy sustainability, green commerce, and technology. Shittu et al. [
34] highlighted the connection between natural resources, environmental performance, energy security, and environmental degradation. The research was conducted in 45 Asian nations with abundant natural resources, and 1990 to 2018 was the timeframe covered by this study. The study found a negative association between natural resource rent, energy security, and ecological impact, as well as the fact that a growing population contributed to environmental degradation. Finally, the study concluded with helpful suggestions for environmental sustainability that governments could implement. In the presence of population expansion and industrial value added, Yang and Khan [
35] investigated the relationship between economic growth, urbanization, and environmental sustainability. Using data from 1992 to 2016, the analysis was conducted on thirty IEA member countries. The study concluded that biocapacity and capital formation promoted environmental degradation in the short term, whereas industrial value added and capital formation promoted environmental sustainability in the long term. Other variables diminished long-term environmental sustainability. The study concluded that policymakers must enact policies that promote ecological consciousness and a higher standard of living. The government should stop urbanization as it hurts the environment. Khan et al. [
36] investigated the influence of natural resources, financial development, and economic expansion on the ecological footprint. This research was carried out in Malaysia, and the scope of this study spanned from 1980 to 2019. The results indicated that all three factors positively affected the ecological footprint, but the economy followed an EKC in the long run. In conclusion, it is necessary to raise awareness among the Malaysian populace and adopt policies that increase environmental sustainability.
Sinha and Sengupta [
37] demonstrated the connection between natural resource rents and human development. The research was undertaken in 30 Asia-Pacific nations. The period span covered by this study was from 1996 to 2016. The human development index (HDI) grew when natural resource rent increased; however, an increase in the rent collected from the pool of natural resources decreased HDI. In conclusion, policy suggestions that maintain development should be embraced. Guan et al. [
38] investigated the connection between the resource curse hypothesis, globalization, human capital, and economic growth. China was where the study is undertaken, from 1971 to 2017. Results demonstrated the existence of the natural resource curse theory in China, whereas other factors boosted economic progress. To manage natural resources, a country should promote globalization and create human capital based on these results. Hassan et al. [
39] examined the effects of globalization and natural resources on economic development. Pakistan was the subject of this study, using data from 1970 to 2014. The results indicated that globalization and natural resources contributed to Pakistan’s economic progress. The report found that the nation should improve exports, technological prowess, and energy security to achieve environmental sustainability. Mehmood et al. [
40] highlighted the impact of natural resources and population ageing on carbon emissions. Using data from 1990 to 2020, the study was conducted on the G-11 nations. The EKC was shown to be present in the economies of these countries, and the results indicated that a dwindling population would lead to lower carbon emissions. The findings suggested that, in order to achieve sustainable development, appropriate policies needed to be formulated. For environmental sustainability, countries should acquire less energy from fossil fuels. Aslan and Altinoz [
41] investigated the relationship between natural resources, gross capital formation, globalization, and economic expansion. The research covered emerging nations on the European, Asian, African, and American continents, utilizing data from 1980 to 2018. There seems to be a causal link between the growth of globalization and the expansion of the Earth’s natural resources. However, the depletion of natural resources retards economic growth. The study found that successful policies should be regulated to maintain economic development. Khan et al. [
42] used data from 1990 to 2018 to study whether there was a link between the expansion of the Pakistani economy and the country’s overall energy consumption. The research results indicated that economic development and energy efficiency were intertwined. The takeaway was that these kinds of regulations are implemented so the economy can transition toward using alternative energy sources. The goal of Khan et al. [
43]’s study was to establish a link between the overexploitation of natural resources, expansion of the tourist industry, and increase in energy consumption and carbon dioxide emissions. A total of 51 “Belt & Road” project countries were the subject of this study. This study covered the time period from 1990 to 2016. The results suggested that natural resources boost tourism, energy use, and greenhouse gas emissions. The natural resource curse is when nations with abundant natural resources experience declining revenue as their resource wealth grows. The research finds that governments need to produce funding for environmental sustainability and boost tourism to expand their economy as natural resources enhance tourism on the one hand but reduce income and raise carbon emissions on the other.
This literature review suggests that growth-specific factors, technological advancement, and overseas investment jeopardize the global decarbonization agenda; hence, green policies are needed to mitigate carbon emissions. Based on the discussion, our study’s final hypothesis was formed:
H3: Continued economic growth, high-tech exports, and inbound FDI will likely negatively impact environmental quality.
Based on substantial discussion of the research theme, the study’s contributions are listed as follows:
- (I)
The literature has been mainly confined to using different natural resources for pollution damage functions [
44,
45]. At the same time, a limited number of studies have examined natural resource pricing [
46,
47], which is covered in this study and helps to assess the price paradox in the resource commodity market, leading to the deterioration of environmental quality and economic outcomes.
- (II)
The use of renewable energy in pollution is primarily explored in different economic settings and have reached some favourable outcomes relating to the decarbonization agenda, by increasing the share of alternative energy uses in conventional energy grids [
48,
49,
50]. However, a limited number of studies have explored its greening impact under the resource price volatility that may give differential impacts on environmental quality [
51,
52]. Our research has examined both factors, which were previously disregarded, to obtain conclusions about the nation, and
- (III)
The literature widely assessed the EKC hypothesis concerning environmental quality and per capita income of countries [
53,
54,
55]. Inbound FDI and technological factors were further evaluated to assess technology-embodied emissions and the pollution haven/halo hypothesis [
56,
57,
58]. However, the literature has been limited to assessing the factors’ role under the resource price paradox, which is crucial to assess the ecological sustainability agenda, meeting the requirements of the COP26 agenda.
Thus, these three distinct points contribute greater insight into the case of Pakistan, and our suggested outcomes will help generalize policy formulations across Asian economies.
3. Materials and Methods
The study used GHG emissions as a response variable of the study. The total natural resource rents were used to assess the price volatility in the natural resource commodity market and served as an essential predictor of GHG emissions. As explanatory variables, other factors included renewable energy demand, high-technology exports, and inbound FDI. The GDP per capita served as a controlled variable of the study. Data were collected from the World Bank [
59] database and missing data were filled in using the preceding and succeeding values.
Table 1 shows the list of variables for ready reference.
Pakistan’s economic development depends on various factors, including the country’s natural resources, renewable energy sources, high-tech usage, and overseas investment. However, the country’s environment suffers due to the widespread application of these factors, which raises the GHG volume and exploits the ecosystem [
60]. As Pakistan is primarily an agricultural economy, environmental degradation hurts the country’s economic growth. Furthermore, rising temperatures brought on by environmental deterioration and subsequent floods, droughts, and water supply problems harm human health. Greenhouse gases released into the atmosphere increase global temperatures, endangering human life by making it more challenging to sustain many infectious illnesses. The fast growth of the human population puts a strain on the planet’s natural resources, which drives up the rate of carbon dioxide emissions from burning fossil fuels used in power plants. Radiant heating alters weather patterns, which boosts evaporation in the atmosphere and, therefore, the productivity of farms. However, this also leads to increased precipitation, which may have negative consequences for people, their property, and the economy [
61]. As agriculture is the backbone of Pakistan’s economy, the country’s environmental stability is crucial to its development. If pollution continues to worsen, it will hurt Pakistan’s economy and the health of its citizens [
62]. This research investigated what elements affect environmental sustainability to assess the influence of natural resources on environmental deterioration.
3.1. Theoretical Framework
Price Paradox in Natural Resource Markets
Many countries heavily depend on the export of a small number of products or the sale of natural resources. Commodity price fluctuations and general economic unpredictability may be particularly damaging to the economies of developing countries. There are a few notable exceptions, but generally speaking, studies of the “resource curse” paradox look at the significant adverse effects of resource wealth [
63]. Natural resources are endowments that a nation has, by virtue of its geography, and may be used for the benefit of its people. Air, water, sunshine, rainforests, land, coal power, metal, gemstones, fuel, chemicals, farmland, and precious minerals are all resources. In the absence of these basic necessities—air, water, sunshine, energy, and food—it is impossible to sustain life. The inhabitants of a nation may improve their standard of living and the economy by making better use of the country’s natural resources, which are essential to meeting basic human requirements and creating a thriving economy. There are many kinds of natural resources in Pakistan that may be used to make things. Natural gas, oil, gold, coal, petroleum, and limestone are all examples of these resources. Agriculture relies on the country’s natural resource of fertile land to cultivate goods, which feeds the population and boost the economy via exports. When a country’s development slows despite a wealth of natural resources, this is called the resource curse hypothesis [
64]. The natural resource curse theory posits that nations develop at a slower rate than those with less natural resources because of poor use of these resources or because authorities place too much emphasis on one industry at the expense of others. Natural resource-rich nations that make good use of their resources tend to economically prosper over the long haul. However, economic development suffers when a nation is endowed with plentiful natural resources but fails to effectively distribute them. If that happens, the nation’s wealth in natural resources becomes a burden [
65].
3.2. Econometric Framework
Parameters may be accurately estimated using ordinary least squares (OLS) regression, and the connection between independent (predictor) and dependent (regressed) variables can be determined. It is a model; thus, it has certain ideal assumptions that, if met, would result in the most accurate possible estimates. Outliers in the OLS model that vary from other data points owing to variability in data or inaccuracy may be identified using influence statistics. Four different ways influence statistics may be shown visually:
- (1)
R-Student;
- (2)
Hat matrix;
- (3)
DFFITS;
- (4)
COV RATIO.
Data significantly out of the norm are visually represented as outliers in influential statistics. Significant changes to the regression model’s coefficient parameters may be attributed to these outliers. Data outliers occur during the estimation of the regression equation, and it is possible to identify these data anomalies using influence statistics. These outliers clearly stand out in this graphical portrayal. An examination of influence statistics reveals the estimated parameters modified by the presence of outliers and how removing those outliers modifies the results. In specific research, the abrupt rise in GHG emissions and natural resource price accounts for the outliers in Pakistan’s resource modeling, leading to worse economic and environmental consequences.
High leverage values, also shown by leverage graphs, are outliers in the dataset. Each estimating variable may be graphically shown in its own leverage plot. Position in the dataset is graphically represented by a graph of leverage. The various leverage points for each value are on the x-axis of the leverage plot, whereas the y-axis displays the standardized residuals. When we modify or replace those points from the data, it impacts overall model fitness; therefore, the leverage plot shows us which data points are furthest from other observations and have the most influence on model fitness. Leverage graphs are used to verify whether our model correctly represents the relevant input variables. These numbers may be seen in the upper left or lower right corner of a leverage plot, depending on how far they are from the regression line. RLS regression is the robust least squares method.
3.2.1. Robust Least Squares (RLS) Regression
When a model has outliers that ordinary least squares (OLS) cannot account for, the robust least squares (RLS) estimator is utilized. The robust least square estimator identifies and removes these outliers from the data set. This is because the approach is well-suited to dealing with such extreme cases. M-estimation, S-estimation, and MM-estimation are the three types of robust least squares used to deal with outliers. Suppose the presence of outliers causes problems for the model. In that case, we may utilize robust least square estimators to get rid of them instead of OLS, as they are less susceptible to distortion by the data that generate problems for the model. Huber [
66] presented the M-estimation method as part of the robust least squares estimation. M-estimation means “maximum-likelihood type”. Outlier independent variables may be identified and removed using this strategy, which helps to mitigate excessive residuals. S-estimator, proposed by Rousseeuw and Yohai [
67], is another robust least square estimation technique. This technique may be quite helpful in dealing with extreme independent variable values and reducing high leverage points. Yohai [
68] presented the third approach of the robust least square estimator. It handles both S-estimator and M-estimator outliers, i.e., outliers in both dependent and independent variables. Equation (1) shows the variables for estimation by RLS procedure, i.e.,
where GHG is GHG emissions, PVNR is price volatility in natural resources, REC is renewable energy consumption, HTE is high-tech exports, FDI is inbound FDI, GDPPC is GDP per capita, α’s represent parameters, ∂ shows the first derivative, and ƹ shows the error term.
3.2.2. VAR Granger Causality
The Granger causality test determines the direction of any observed causation between two variables. The utility of one variable in making predictions about another is measured using Granger causality analysis. Each variable may have one of three forms of causality:
- (I)
One-way relationship: To establish unidirectional causation from Y to X, we need to show that Y Granger causes X, but X does not cause Y.
- (II)
Reverse causation: To establish unidirectional causation from X to Y, we need to show that X Granger causes Y, but Y does not cause X.
- (III)
Bidirectional causality: It occurs when Y Granger causes X and X Granger causes Y.
- (IV)
Deficiency of a causal relationship: When neither X nor Y causes the other, or when there is no other way to explain the absence of a correlation between the two, we say that no causality exists between the two variables.
For Granger causality, the VAR framework in Equation (2) has been shown for reference, i.e.,
Equation (3) shows Granger causality for multivariate system, i.e.,
where ‘t − 1′ is time lagged and β is coefficients.
3.2.3. Impulse Response Function (IRF)
An impulse response function describes a system for which the output is determined by applying an impulse as input. In the future, say 10 or 20 years from now, the IRF offers directions, which may be either positive or negative responses or relations. Graphs are traditionally used display and evaluate impulse reactions, and they always reflect the impact that an impulse of one standard deviation has on the related variable. Briefly, the IRF is a graphical representation of the reactions of economic variables to an exogenous stimulus.
3.2.4. Variance Decomposition Analysis (VDA)
Variance decomposition analysis (VDA) is a promising candidate among the many forecasting methods. The amount of variation in the dependent variable that can be attributed to shifts in the independent variable is determined using a variance decomposition study. Time series analysis uses variance decomposition to anticipate future uncertainty by providing magnitude variance after estimating a vector autoregressive (VAR) model. The analysis and understanding of vector auto-regressive models are simplified by using this technique (VAR). The graphical method is also used to display the variance decomposition.
Equation (4) shows the VDA operator, i.e.,
where Var is variance and E is mean expectations.
4. Results
Table 2 shows the descriptive statistics of the variables. The mean value of GHG emissions, resource pricing, and renewable energy demand was 47.432%, 1.315% of GDP, and 51.739% of GDP. The high-technology exports increased along with an increase in inbound FDI and the country’s per capita income. In comparison, it damaged the natural environment by increasing GHG emissions in a country. The price volatility in natural resources also puts pressure on environmental quality, transmitted into the pollution haven hypothesis and technology-embodied emissions. The trend analysis helps to estimate the correlation matrix for assessing the direction and magnitudes between the variables.
Table 3 shows the correlation matrix, which shows that an increase in resource pricing, high-technology exports, inbound FDI, and continued economic growth positively correlates with GHG emissions. This verified the resource pricing curse hypothesis, technology-embodied emissions, pollution haven hypothesis, and growth-associated emissions in a country. The negative correlation between renewable energy demand and GHG emissions substantiated the carbon neutralization phenomena by increasing the share of alternative energy sources in national energy grids. Inbound FDI and continued economic growth were significant predictors that increased resource pricing in a country. Continued economic growth was a significant predictor that attracted more foreign investment and cleaner technology to a country.
Before applying the RLS estimator, the study applied influence statistics and leverage plots to assess the possible number of outliers affecting the regression model and their appearance in the studied variables.
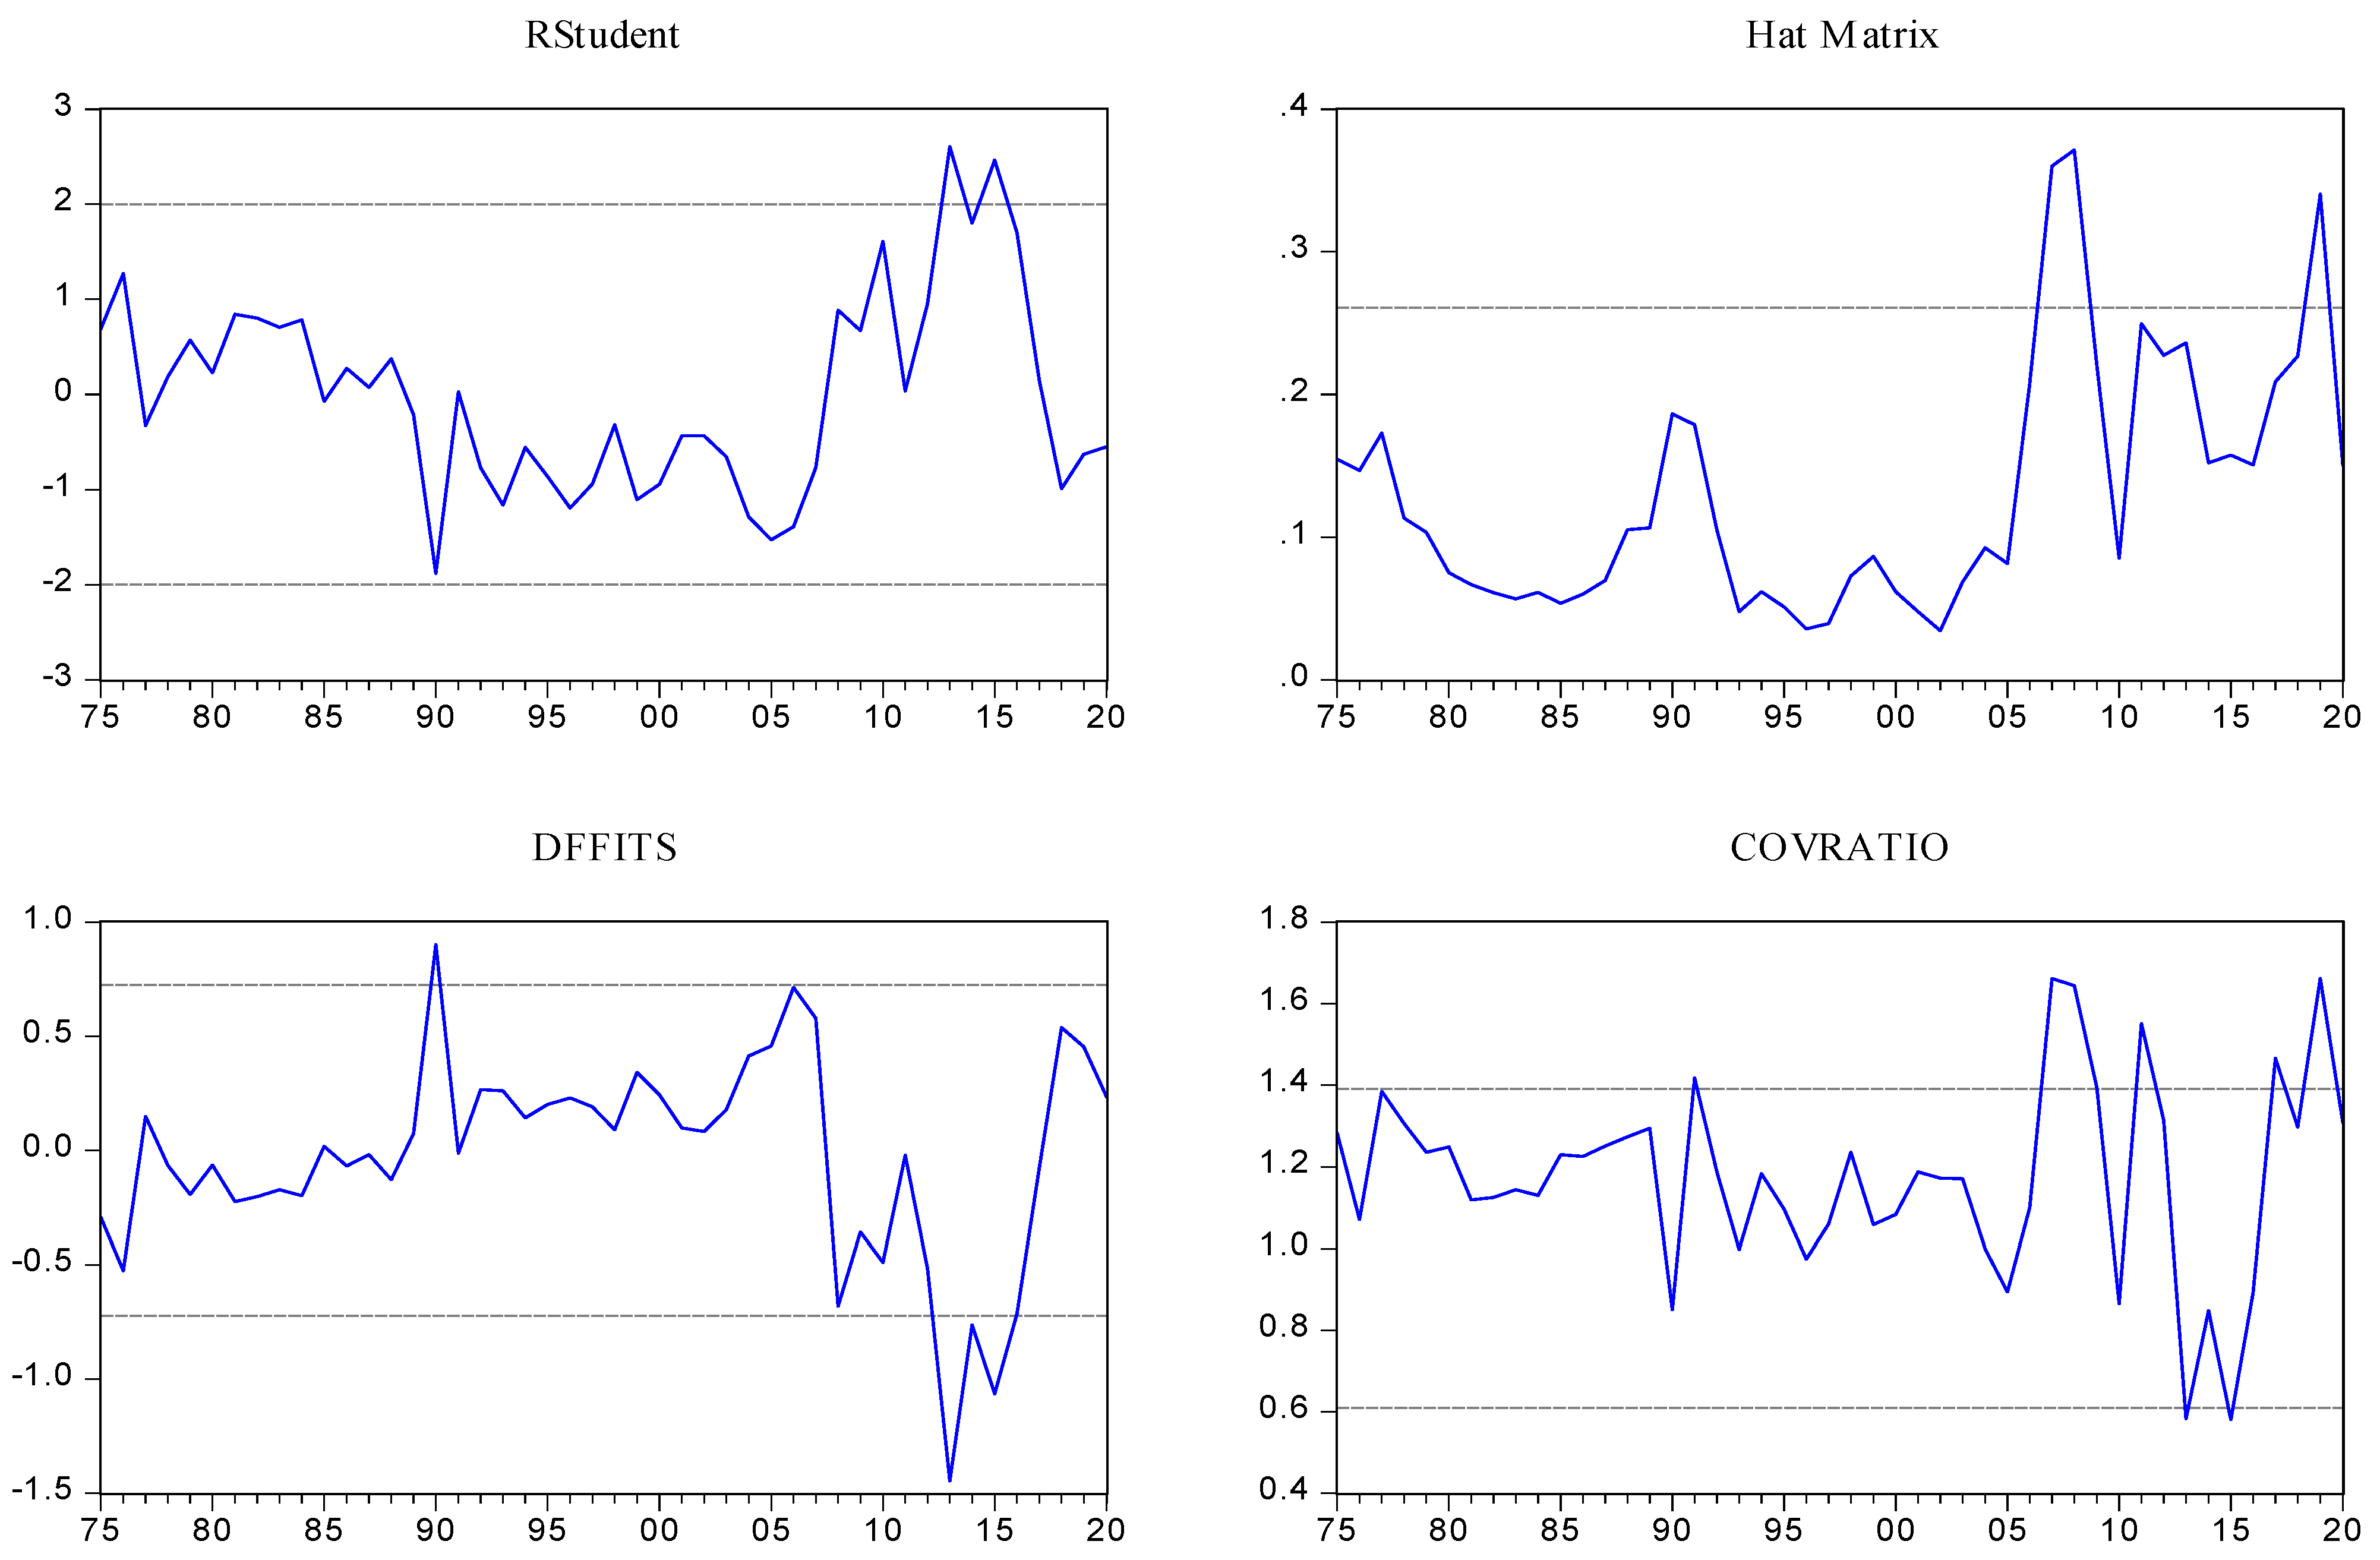
Figure 1 shows the influence statistics for ready reference.
The RStudent influence statistics showed two outliers that appeared in the years 2013 and 2015. Hat matrix influence statistics showed three outliers found in 2007, 2008, and 2019. DFFITS influence statistics showed four possible outliers found in 1990, 2013, 2014, and 2015. Finally, COVRATIO influence statistics showed five outliers in 2007, 2008, 2011, 2017, and 2019.
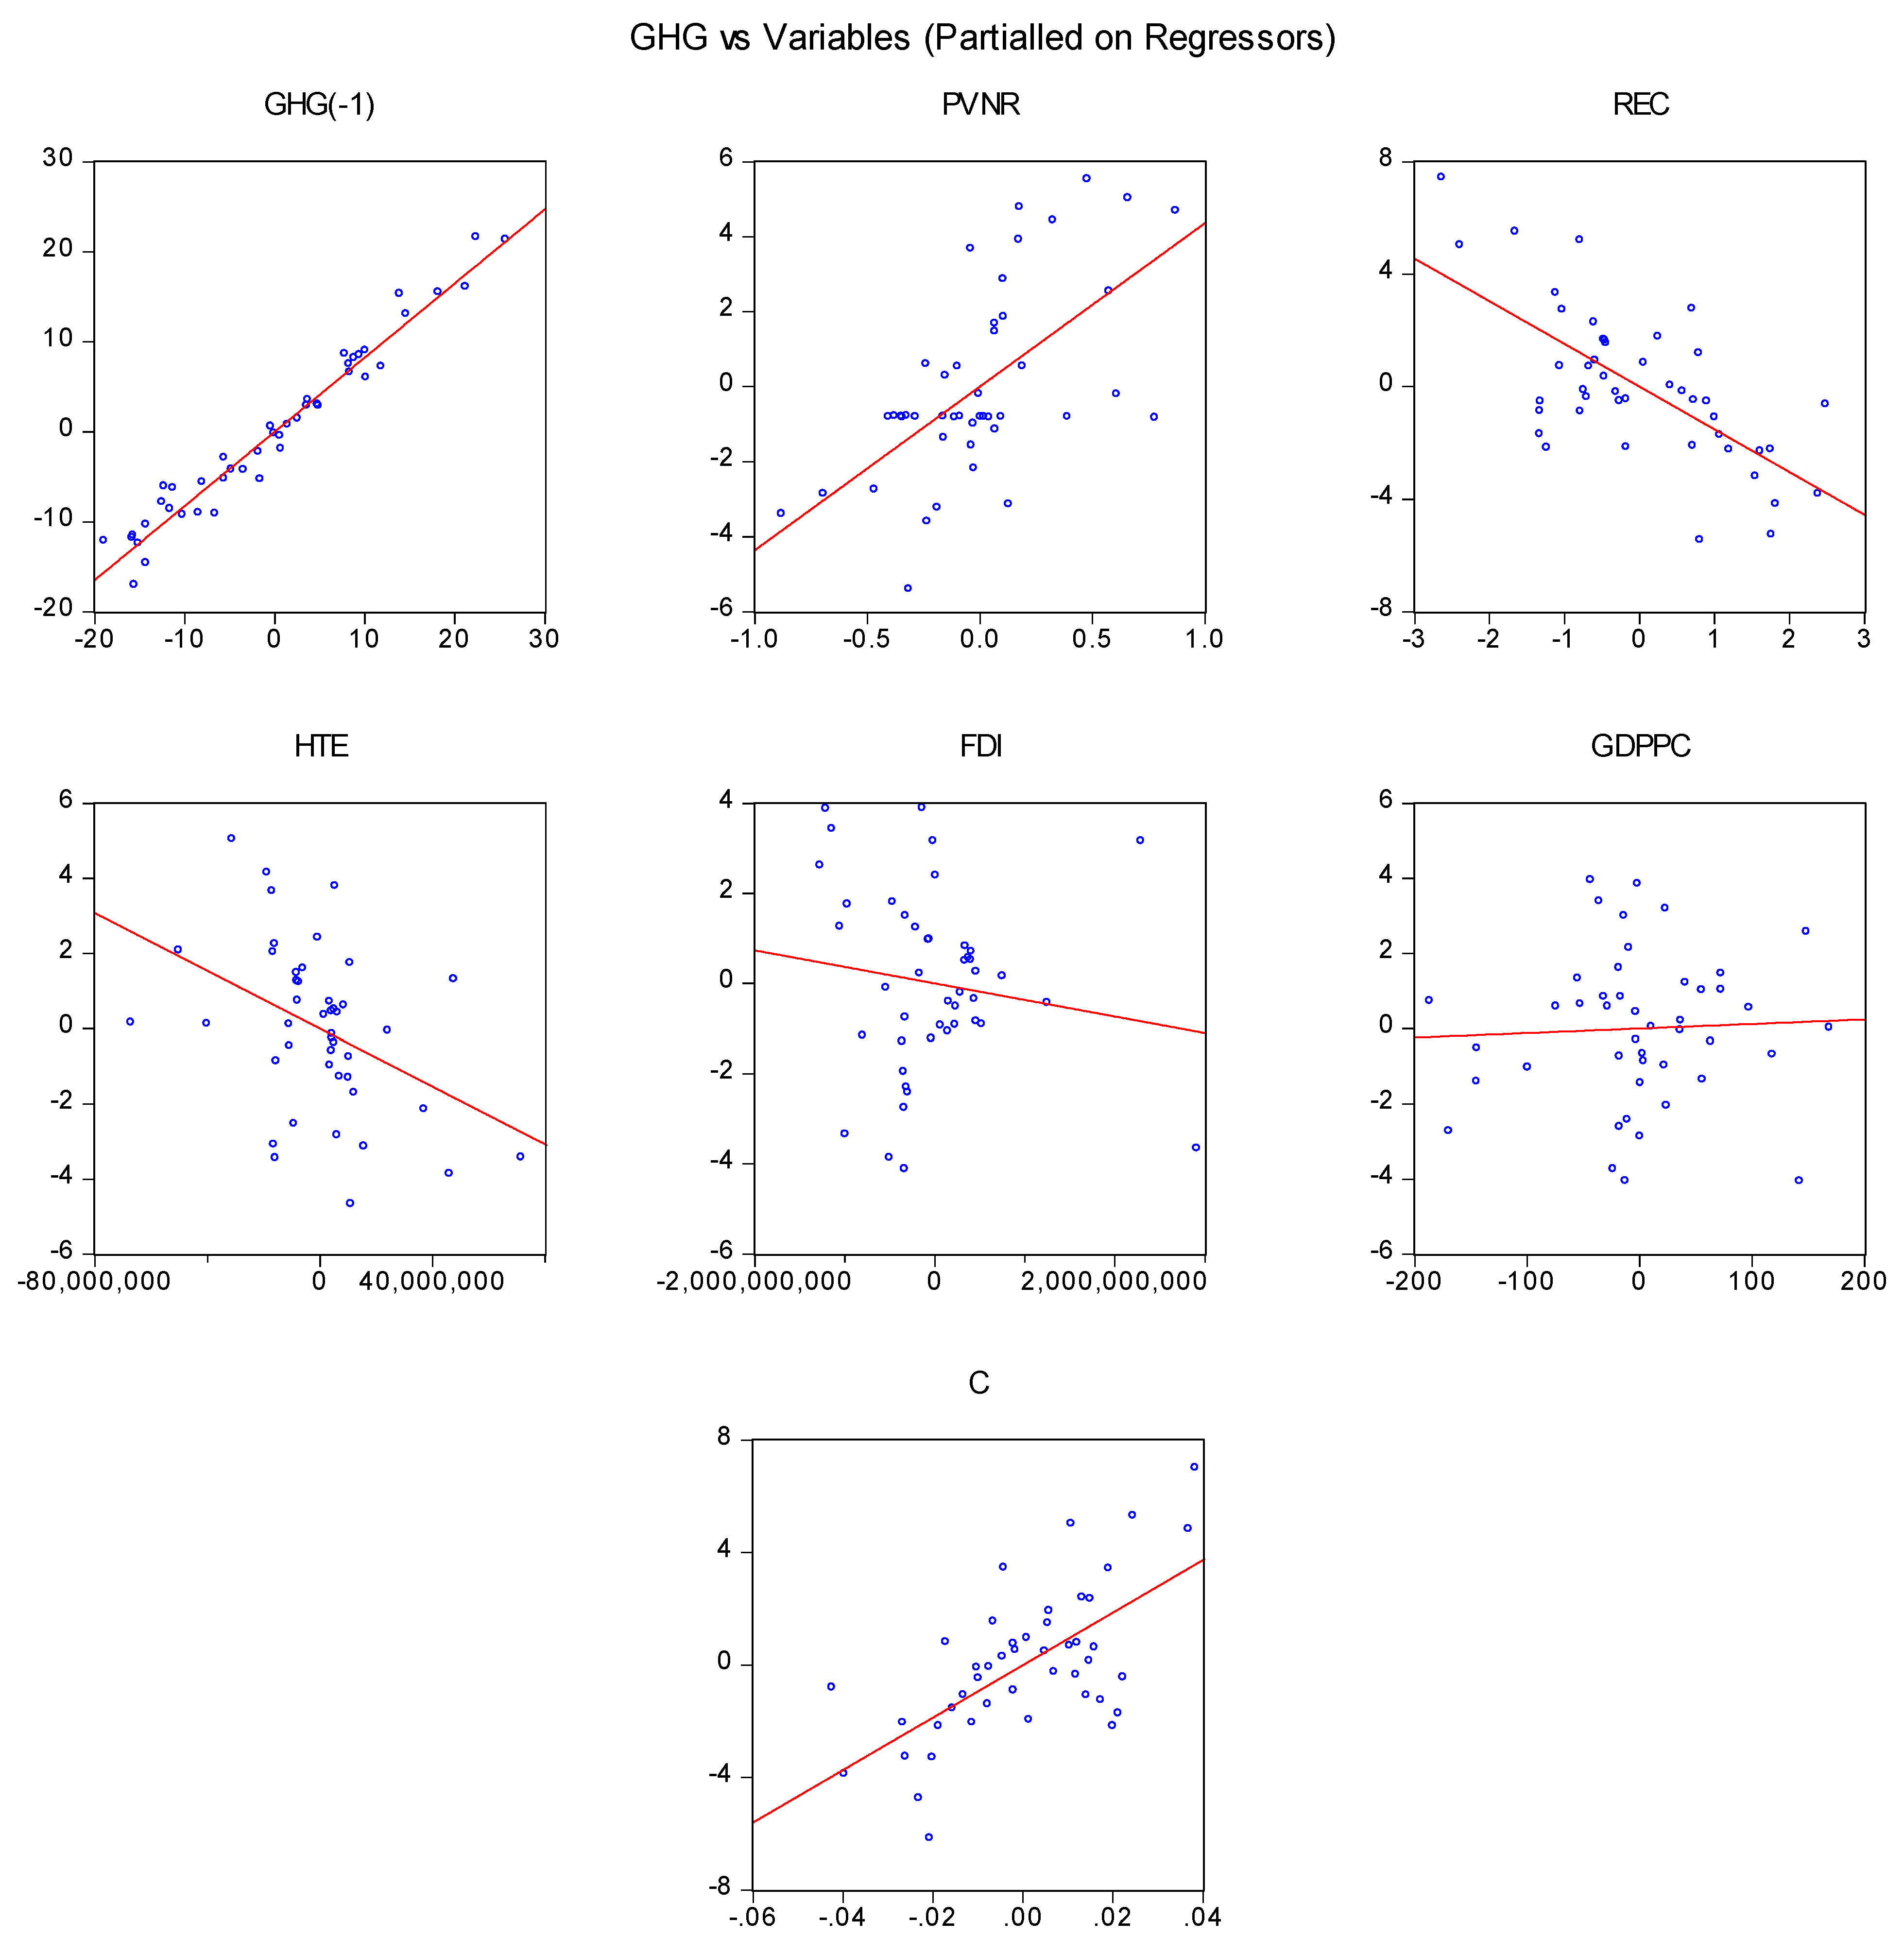
Figure 2 shows the leverage plots of the variables.
It would be simple to spot outliers with the help of leverage graphs. Each point on the X-axes of these leverage plots represents its leverage, and each point on the Y-axes represents its standardized residual. For this reason, there is a high-leverage anomaly in the upper right corner of the leverage plot of natural resource rents. A graph of resource pricing factors showed greater volatility in resource prices over time, which displayed a broad dispersion of values on both the left and right sides. Outliers in the use of renewable energy were seen in the upper left corner, far from the red line (true regression line). Some extreme values were also be seen above the red line in GDP statistics. High-tech exports had atypically high values in the upper right and left corners. Foreign direct investment (FDI) data had some unusually high and low points, up in the upper left, far off the red line. Finally, there were no noticeable outliers in the data set for GHG emissions. Thus, this suggested that the S-estimator in the RLS approach would do better than the M- and MM-estimators.
Table 4 shows the RLS estimates.
The findings demonstrated that resource price volatility and continued economic growth strained the environment by increasing GHG emissions. According to elasticity calculations, when resource prices and economic growth rose by 1%, the resulting increase in GHG emissions was 0.247 and 4.703 percent, respectively. These results imply that more unsustainable consumption patterns continue if resource prices increase, stressing the environment. A cleaner energy agenda and eco-friendly technological progress leading to a sustainable solution for nation development are supported by the rising demand for renewable energy and export of high-tech goods. More than three times as much green energy is required to lower GHG emissions, attributed to the effect of cleaner manufacturing technologies. The model was free of normality and heteroskedasticity problems. The estimations of the VAR Granger causality are shown in
Table 5.
The Granger estimates confirmed the following relationships:
- (i)
Renewable energy demand Granger caused GHG emissions, resource pricing, and inbound FDI, verifying unidirectional causality between the variables. Further, it implied a country’s energy-led emissions, resource pricing, and inbound FDI hypotheses.
- (ii)
The unidirectional causality ran from high-tech exports to GHG emissions and GDP per capita, substantiating a country’s technology-embodied emissions and technology-led growth hypothesis.
- (iii)
The GHG emission-led resource pricing and emissions-led inbound FDI substantiated a country’s resource curse hypothesis and pollution haven hypothesis.
- (iv)
Economic growth Granger caused renewable energy demand and inbound FDI, which confirmed the growth-led energy and overseas investment hypotheses in a country, and
- (v)
There was a unidirectional relationship running from resource pricing to inbound FDI, implying that resource pricing influenced overseas investment in a country.
Causality estimates would be helpful for policy formulation and reaching some conclusive sustainable outcomes.
Table 6 shows the IRF estimates.
The results suggested that resource pricing and economic growth would likely increase GHG emissions for the next ten years. On the other hand, renewable energy demand, high-technology exports, and inbound overseas investment would likely decrease GHG emissions over time. The following possible implications may emerge with this exercise:
- (i)
The increase in price volatility will likely lead to the over-exploitation of natural resources, leading to environmental damage in a country. Furthermore, continued economic growth exhaust natural resources through the extensive use of natural resources in the manufacturing process, and thus, it has exacerbated the GHG emissions in production.
- (ii)
Green energy sources will likely play an essential role in lessening environmental damage and improving air quality in the coming years. Technological innovation will likely play an essential role in sustaining environmental quality and resource price stability in search of clean and green energy.
- (iii)
Inbound FDI in cleaner technology advancement would assist in moving towards sustainable financing in resource commodity markets, which would help to achieve a green developmental agenda.
Table 7 shows the VDA estimates of GHG emissions for ready reference.
The results suggested that high-technology exports would likely exert a greater variance shock, i.e., 20.354% on GHG emissions, followed by resource pricing, 3.201%, GDP per capita, 2.458%, and renewable energy demand, 2.399%, for the next ten years. The least influenced would be the inbound FDI, which would likely influence GHG emissions with a variance error shock of 1.771% over the time horizon.


