Article

Development of a Dynamically Adaptable Routing System for Data Analytics Insights in Logistic Services

by
Vasileios Tsoukas
,
Eleni Boumpa
,
Vasileios Chioktour
,
Maria Kalafati
,
Georgios Spathoulas
and
Athanasios Kakarountas
*
Department of Computer Science and Biomedical Informatics, University of Thessaly, 35 131 Lamia, Greece
*
Author to whom correspondence should be addressed.
These authors contributed equally to this work.
Analytics 2023, 2(2), 328-345; https://doi.org/10.3390/analytics2020018
Submission received: 2 December 2022 / Revised: 6 March 2023 / Accepted: 4 April 2023 / Published: 13 April 2023

Abstract

:
This work proposes an effective solution to the Vehicle Routing Problem, taking into account all phases of the delivery process. When compared to real-world data, the findings are encouraging and demonstrate the value of Machine Learning algorithms incorporated into the process. Several algorithms were combined along with a modified Hopfield network to deliver the optimal solution to a multiobjective issue on a platform capable of monitoring the various phases of the process. Additionally, a system providing viable insights and analytics in regard to the orders was developed. The results reveal a maximum distance saving of 25% and a maximum overall delivery time saving of 14%.

1. Introduction

Smart transportation and resolving routing problems are the greatest concerns for smart cities. Modern societies require intelligent software and services to improve and provide a more eco-friendly delivery process. Various economic and environmental issues, such as enhancing the quality of residents’ everyday life and lowering wasted fuels and CO 1 and CO 2 emissions, as well as minimizing transportation expenses and reducing traffic problems, have developed this demand.
The Vehicle Routing Problem (VRP) [1] refers to the basic routing problem that is one of the most crucial difficulties that logistics organizations face today. Originally, the VRP addressed a problem in which consumers must be serviced by several fleets of vehicles at the lowest cost while staying consistent with operational objectives and side limitations. Consequently, the problem is based upon the assumption that a fleet departs from a depot, distributes items to consumers within a predetermined urban network, and then returns back to the depot [2].
The aforementioned difficulty generates a complicated problem in which various criteria and constraints, including the needs of each customer, must be considered simultaneously. Thus, there are a number of factors and restrictions originating from real-world situations that logistics organizations confront, which have resulted in the research community defining a number of VRP variations [1]. The Capacitated Vehicle Routing Problem (CVRP), the Vehicle Routing Problem with Time Windows (VRPTW), and the Green Vehicle Routing Problem (GVRP) are three of the most researched variants of the VRP.
In the CVRP, all clients correspond to predetermined and non-splittable deliveries, the vehicles are similar and based at a central depot, vehicle capacity constraints are enforced, and the goal is to reduce the cost required to service all customers [3]. The VRPTW [4] is an extension of the CVRP in which service must begin within an appropriate time window, and the vehicle shall remain at the customer’s location during service. Lastly, the GVRP considers the decrease in greenhouse gas emissions during the proper routing of vehicles for delivering goods [5].
This work proposes a platform that provides an efficient solution for the VRP and its derivatives, including the CVRP and the GVRP. The proposed approach takes into account all phases of the order-setting procedure and product delivery to the consumer. The proposed platform leverages the K-means algorithm to define distinct geographical delivery zones in a dynamic manner, assigning the optimal batch of orders to the allocated vehicles and routing the itinerary based on the current traffic circumstances. The system delivers the optimal route in terms of total distance and CO x emissions, while only making a single stop at each client node and beginning and terminating the delivery operation at the same central node.
The contributions of this work are as follows:
  • Analysis of the existing routing services;
  • Introduction of a new system capable of solving the VRP and several of its variants;
  • An analytical comparison between the proposed system and other existing routing services.
The remainder of this paper is structured as follows: In Section 2, a brief overview of the existing routing services is provided. Section 3 presents the proposed system, namely Smart Delivery. Section 4 provides the experimental results regarding the comparison of the system with real data and other routing systems. Finally, Section 5 concludes with a discussion regarding the VRP and the proposed solution.

2. Existing Routing Services

Various research and commercial solutions for vehicle routing and delivery systems have been developed over the years. In the following sections, Section 2.1 and Section 2.2, respectively, various research routing systems that have been proposed and commercial systems that are available in the market are presented.

2.1. Research Solutions

Pang et al. [6] implemented an optimal routing system according to the preferences of the vehicle driver. In this system, a hybrid fuzzy–neural approach is used that combines the advantages of both fuzzy systems and neural systems, which further enhances the intelligence of the dynamic route guidance system modeling the decision-making process in route selection. This approach is general in the sense that fuzzy rules can handle any number of feasible paths when given the start–end path pair. In addition, the proposed approach can process multiple objectives for route selection, such as travel time, route distance, traffic congestion, route view, and so on. In this system, six main objectives for route selection are defined, which act as fundamental factors in the adaptive route selection algorithm.
Kanoh and Nakamura [7] proposed the use of a genetic algorithm that adopts the viral infection model. The proposed method uses viruses as domain-specific knowledge. Thus, a segment of an arterial road is considered a virus, and a population of viruses is created in addition to a population of routes. The experiments used real road maps for navigation systems in Japan, and the results showed that contaminations are an effective solution to the problem of dynamic route selection. Furthermore, the proposed strategy is not problem-specific and can be effectively used in other optimization problems.
Eggenkamp and Rothkrantz explored the potential of artificial intelligence, and particularly expert systems, in path planning using dynamic data [8]. They presented an expert system built to perform dynamic routing and a dynamic route planner using a traditional shortest path algorithm. Furthermore, the capabilities of an expert system for dynamic path planning were studied, and a comparison was made between Dijkstra’s shortest path algorithm and the expert system. The expert system showed great potential as it not only performs much better in terms of computation time, but the routes it returns are also as good as the routes calculated by the conventional shortest path algorithm. Additionally, the expert system shows great potential when real-time constraints are set. The expert system first generates all possible solutions and then calculates their travel time one by one. Once the travel time of a solution is calculated, the solution becomes available. The major disadvantage of the expert system approach is the construction of the rules, as it is a very intensive and time-consuming process.
In another work [9], a practical method for dynamic route planning that uses a virus genetic algorithm is proposed, with the aim of finding the minimum time route from the starting point to the end of a trip. The proposed method includes the complexity of Dijkstra’s algorithm, applications in real road networks, and route guidance in dynamic environments. To evaluate the proposed method, experiments were carried out in both static and dynamic environments. The results of the experiments led to the conclusions that (i) the virus genetic algorithm has almost the same performance in terms of running time compared to the Dijkstra algorithm; (ii) the virus genetic algorithm is superior in terms of the computational time that is required to respond to changes in information coming from the road. Practically, this means that the virus genetic algorithm is a more efficient solution to real-time path-planning problems.
Kanoh and Hara [10] formulate the path planning problem as a dynamic multiobjective problem and suggest that it can be solved using a genetic algorithm. There are three objective functions to be optimized simultaneously in this problem: (i) the length of the route, (ii) the travel time that changes rapidly with time, and (iii) the ease of driving. The proposed solution provides an optimal set of routes, using both the predicted movement and a hybrid genetic multiobjective algorithm (a combination of a genetic and the Dijkstra algorithms), so that the driver can choose a favorite route from a set of feasible routes.
The INSIGMA project [11] is an advanced information system for tracking vehicles and detecting threats while they are moving. The first and main goal of this project is the analysis of traffic parameters based on dynamic maps. A dynamic map is defined as the representation of roadway infrastructure combined with up-to-date information on road traffic intensity and historical traffic data. Such a combination includes information stored in a database, as well as a representation of a map which can be presented to the end user through an interface. Algorithms for dynamic route optimization are implemented in the system, which assists traffic control systems and is particularly useful in urban environments. The second goal of the project is the development of automatic methods for observing moving objects (vehicles) and recording their parameters. The application of such systems aims to provide low-level data for the creation of dynamic maps. In addition, the search system will allow interfaces to define route optimizations, smart tracking, and other services.
An intelligent trip modeling system is presented in [12], which was developed using Machine Learning (ML) to predict the travel speed profile for a selected route, based on traffic information that is available at the start of the trip. The system contains neural networks to predict short-term traffic speed based on the day of travel, congestion levels, and the distances between individual sensor locations along the route. The proposed intelligent travel modeling system was trained and evaluated using 10 months of traffic data from the California freeway performance measurement system on a 26-mile route containing 52 sensors along its length. The experimental results showed that the proposed system could provide accurate predictions of dynamic traffic changes and trip speed at the start of the trip.
A new model for a path planning system based on multi-agent reinforcement learning algorithms is presented in [13]. A combination of Q-value-based dynamic programming and Boltzmann distribution was used to solve vehicle delay problems by studying the weights of various parameters of the road network, such as weather, traffic, road safety, and the fuel capacity of the vehicle, to create a priority route for the vehicles. The most important part of this study is the use of a multi-agent system with learning capabilities in order to make decisions about vehicle routing between cities. The evaluation of this system was carried out using a series of case studies focused on Malaysian road networks and showed that agent technology is suitable for solving communication problems in a distributed rapid transit network. The innovation of this study is the use of multi-agent reinforcement learning for route planning systems, which can be used to provide access to data resources of rapid transit networks.
A dynamic urban route planning algorithm for real-time traffic density distribution in a city is proposed in [14]. The proposed framework tries to minimize the number of congested traffic nodes by even and real-time traffic distribution using traffic diversion hints, thereby achieving the reduction in dense air pollution at traffic nodes. The proposed framework is based on an Internet of Things (IoT) architecture for real-time traffic and geographic data to reduce the amount of air pollution and reduce the exposure time of vehicle occupants to it. The proposed approach is based on the cost function for pollution levels, nodes connectivity, and route type as key parameters, without, however, ignoring the possible measurement of the shortest distance. Thus, this proposed framework provides suggestions for alternative routes by compensating for the additional distance with the least exposure of commuters to pollution, thus minimizing the total cost function of time, distance, and pollution.
In [15], a hybrid dynamic routing system was developed that interacts with the current traffic information of the city, and its traffic history, while predicting the future traffic flow of the city. The algorithm of the present system is implemented using the dynamic Dijkstra algorithm in a three-dimensional graph (3D graph), in which the x and y axes map the Dutch highway network, while the z-axis represents time. This dynamic routing system is provided as a website by the Knowledge-Based System Group (KBS) of the Delf University of Technology, as well as a mobile phone application. The graphical environment of the system numbers all the roads and arterial roads of the Netherlands. After the user enters the departure time, the starting point, and the destination of the route, the system calculates the shortest route in time and colors it in red on the representation map of the road network.
Kong et al. [16] proposed a two-phase approach for dynamic route planning for shared metro buses, namely SubBus. First, based on a passenger behavior analysis, they identify the multidimensional properties to predict passenger travel requirements, such as the distribution and volume of passengers at different time intervals. Then, they designed a dynamic programming algorithm to obtain the optimal routes based on the prediction results. The proposed approach consists of three main components: (i) data preprocessing, (ii) travel demand prediction, and (iii) dynamic route planning. Based on actual shared metro bus data, extensive experiments were conducted to prove that the proposed approach could effectively generate operating routes to optimize the operating status of shared buses and promote their deployment. A resident travel behavior analysis was performed to extract multiple important features and predict passenger flow using an ML method. Although the data are very erratic, the forecast accuracy at many stations can reach 80%. Based on the set of candidate origin points and the set of candidate routes generated, the optimal routes for the shared buses were obtained from the designed dynamic programming algorithm. The results of the experiments revealed that the planned routes have a shorter operating distance and more passengers than the actual routes. Thus, the proposed SubBus approach can generate routes for the shared metro buses to optimize their operating status.
Hybrid-VITS [17] is a hybrid system consisting of vehicular ad hoc networks (VANETs), traffic servers, and a 5G-based cellular public transport system. The system, considering the traffic congestion in urban areas, calculates the optimal route to re-plan the routes based on the shortest path algorithm, and a load balancing technique is adopted to avoid further congestion. The Hybrid-VITS architecture includes vehicles, roadside units, vehicular traffic servers, and a 5G-based cellular base station. Vehicles are equipped with onboard units, which are responsible for the communication between vehicles and road units. Vehicles perceive and send the information (speed, density, and location) periodically to other vehicles and to the nearest road unit. In addition, the cellular public transport system based on 5G that was implemented consists of mobile remote monitoring and taxi management. As soon as the vehicles perceive the congestion, a warning message is generated and sent to the road units. If a taxi (hypernode) receives the warning message, it immediately uploads the warning to the database, which forwards it to the vehicle traffic servers. Road units share the warning message, which contains segment ID and congestion removal time, with other road units through the proposed common base mechanism and vehicle traffic servers.
In [18], a Recurrent Neural Network (RNN) based on the default logic for route planning is proposed and consists of three parts. The first part is the default path design theory, which does not impose loops on the generated paths. The second part is the RNN, based on default reasoning, to suggest the default rules. The RNN outputs the probability distribution of the defaults used afterward, so the proposed method is a probabilistic method. The third part is the map model update algorithm to improve the accuracy of default reasoning in dynamic environments. The training of the proposed RNN is simple, as no statistical computation is required for its training. The time complexity of the proposed method during testing is O( ρ 2), where ρ is the length of the optimal path for two given nodes. To evaluate the proposed method, a new map model named BJ was constructed, which simulates the complex urban environments of the city of Beijing in China. Extensive experiments on the BJ map model in both static and dynamic environments have shown the effectiveness and accuracy of the proposed method.
Abdelrahman et al. [19] presented a dynamic, personalized route planning framework based on crowd-sensed vehicle data. The proposed system utilizes the data coming from the vehicles and from various smart devices and creates a database that contains properties of different parts of the road networks. Additionally, driver behavioral information, along with the environmental context of those behaviors, is used to build a probabilistic safety database. Thus, road information and driver profiles are used to provide route navigation options that are now based on personalized levels of safety and road comfort within a large number of environmental attributes. A case study for a real-life system operation scenario from point A (origin) to point B (destination) was carried out in the city of Kingston, Ontario. This case study highlights the difference between the conventional best route suggested by Google Maps and the best route based on route quality and hazard level provided by the proposed system. In this case study, in a driving scenario, Google Maps suggested three possible routes, according to the estimated travel time and distance of points A and B, taking into account the real-time road traffic.

2.2. Commercial Solutions

The company FarEye [20] has created an intelligent delivery management platform that is efficient, self-sustaining, and profitable and can be leveraged by various types of delivery businesses, helping them to operate faster, implement changes in the delivery process, and keep the delivery ecosystem flexible. This platform is a customizable delivery management platform based on Software-as-a-Service (SaaS), and is a complete delivery solution that consists of the following three parts: (i) the Intelligent Delivery Orchestration, which enables businesses to meet ever-increasing expectations and achieve operational efficiency based on routing with ML-based methods; (ii) the Intelligent Delivery Visibility, which achieves an enhanced visibility of deliveries in real-time, across all modes of transportation, enables customers to have reliable information, and achieves the timely delivery of shipments in the first, intermediate, and last mile of delivery; and (iii) the Intelligent Delivery Experience, which provides personalized experiences to customers/receivers of deliverables.
Another commercial solution that provides both route planning solutions and rescheduled optimization of the delivery process is the OptimoRoute service [21]. OptimoRoute takes into account all the needs of each route automatically and provides the most efficient routes in a user-friendly way. This service has various features for planning each route. It can automatically redesign and reschedule routes if factors change during route execution, as OptimoRoute’s route management software sends real-time updates and exact arrival times to dispatchers, drivers, and recipients of a deliverable. The solution offered by the OptimoRoute service is already used by various businesses of all sizes, as well as various categories, such as distribution, retail, healthcare, laundry, cleaning and maintenance services, waste collection, transport companies, sales services, pharmacies, etc.
Nextmv [22] is a startup company that offers a Software Development Kit (SDK) and Application Programming Interface (API) and provides decision automation and optimization for vehicle routing, staff scheduling, distribution of expenses, etc. Nextmv’s decision automation stack is easy to use either as is or with appropriate customizations to account for various solution paradigms, such as decision diagrams, as well as unique constraints and business Key Performance Indicators (KPIs). Additionally, it provides the ability to visualize routes in various ways, such as through Open-Source Routing Machine, Google Maps, MapBox, OpenStreetMap, geojson.io, or even something that a developer may have developed in-house.
Another smart delivery solution is provided by the Sqilline company with its Smart Delivery service [23]. Sqilline’s Smart Delivery service is a mobile phone solution to make the delivery, loading, and unloading of goods faster, safer, and more transparent. This service significantly reduces delivery time, increases driver accountability, and ensures customer satisfaction, while giving real-time feedback to the customers on their order’s status. This service also works offline, so that the driver can work with a delivery document without the need for an Internet connection. In addition, it reduces the cost of filing, processing, and handling paper documents.
The Mendix company [24] offers its own smart delivery management platform. The proposed solution of the Mendix company provides the possibility to the companies that use it to plan their routes, to fulfill the deliveries of their orders, and to assign their data, for the execution of their deliveries, to the various infrastructures that the company has and offers. The features of this platform are (i) real-time data; (ii) route optimization; (iii) QR scanning; and (iv) integration with human capital management.
The Milkman Home-Delivery Platform for last-mile operations [25] is another service that offers businesses that require product delivery various optimizations for it. The optimizations offered by Milkman are (i) real-time capacity analysis; (ii) route optimization; (iii) optimization of operations throughout the supply chain, from retailers to order delivery drivers; and (iv) last-mile delivery service.
Pickpack [26] provides a robust real-time optimization algorithm for delivery routes that increase order efficiency and ensure that orders and drivers arrive accurately. The service algorithm takes into account deliveries with pickups and deliveries for local delivery services, one pickup and multiple deliveries for logistics companies and retail, delivery times, vehicle capacity, on-demand deliveries, priority stops, traffic on roads, the speed of the respective drivers, and the shift times, the breaks, and the remaining service time of the respective drivers, etc. The Pickpack service provides a powerful real-time route optimization algorithm based on artificial intelligence for deliveries, which increases the efficiency of deliveries and ensures the best possible driver and vehicle for each delivery. Finally, this service provides two applications for mobile phones, one application for drivers and one application for customers. The driver application provides the user with real-time optimization of driver tasks and routes to save labor time, fuel and vehicle costs, detailed job information, estimated delivery time, distance and status update, easy communication with the shipper and customers, help to navigate pick-up/drop-off points, and support working offline. Additionally, the customer application provides the user with real-time tracking of both the order and the driver, the real-time estimated delivery time and distance, the details of the shipment distributor, as well as the ability to contact him, and automatic status updates and proof of delivery.
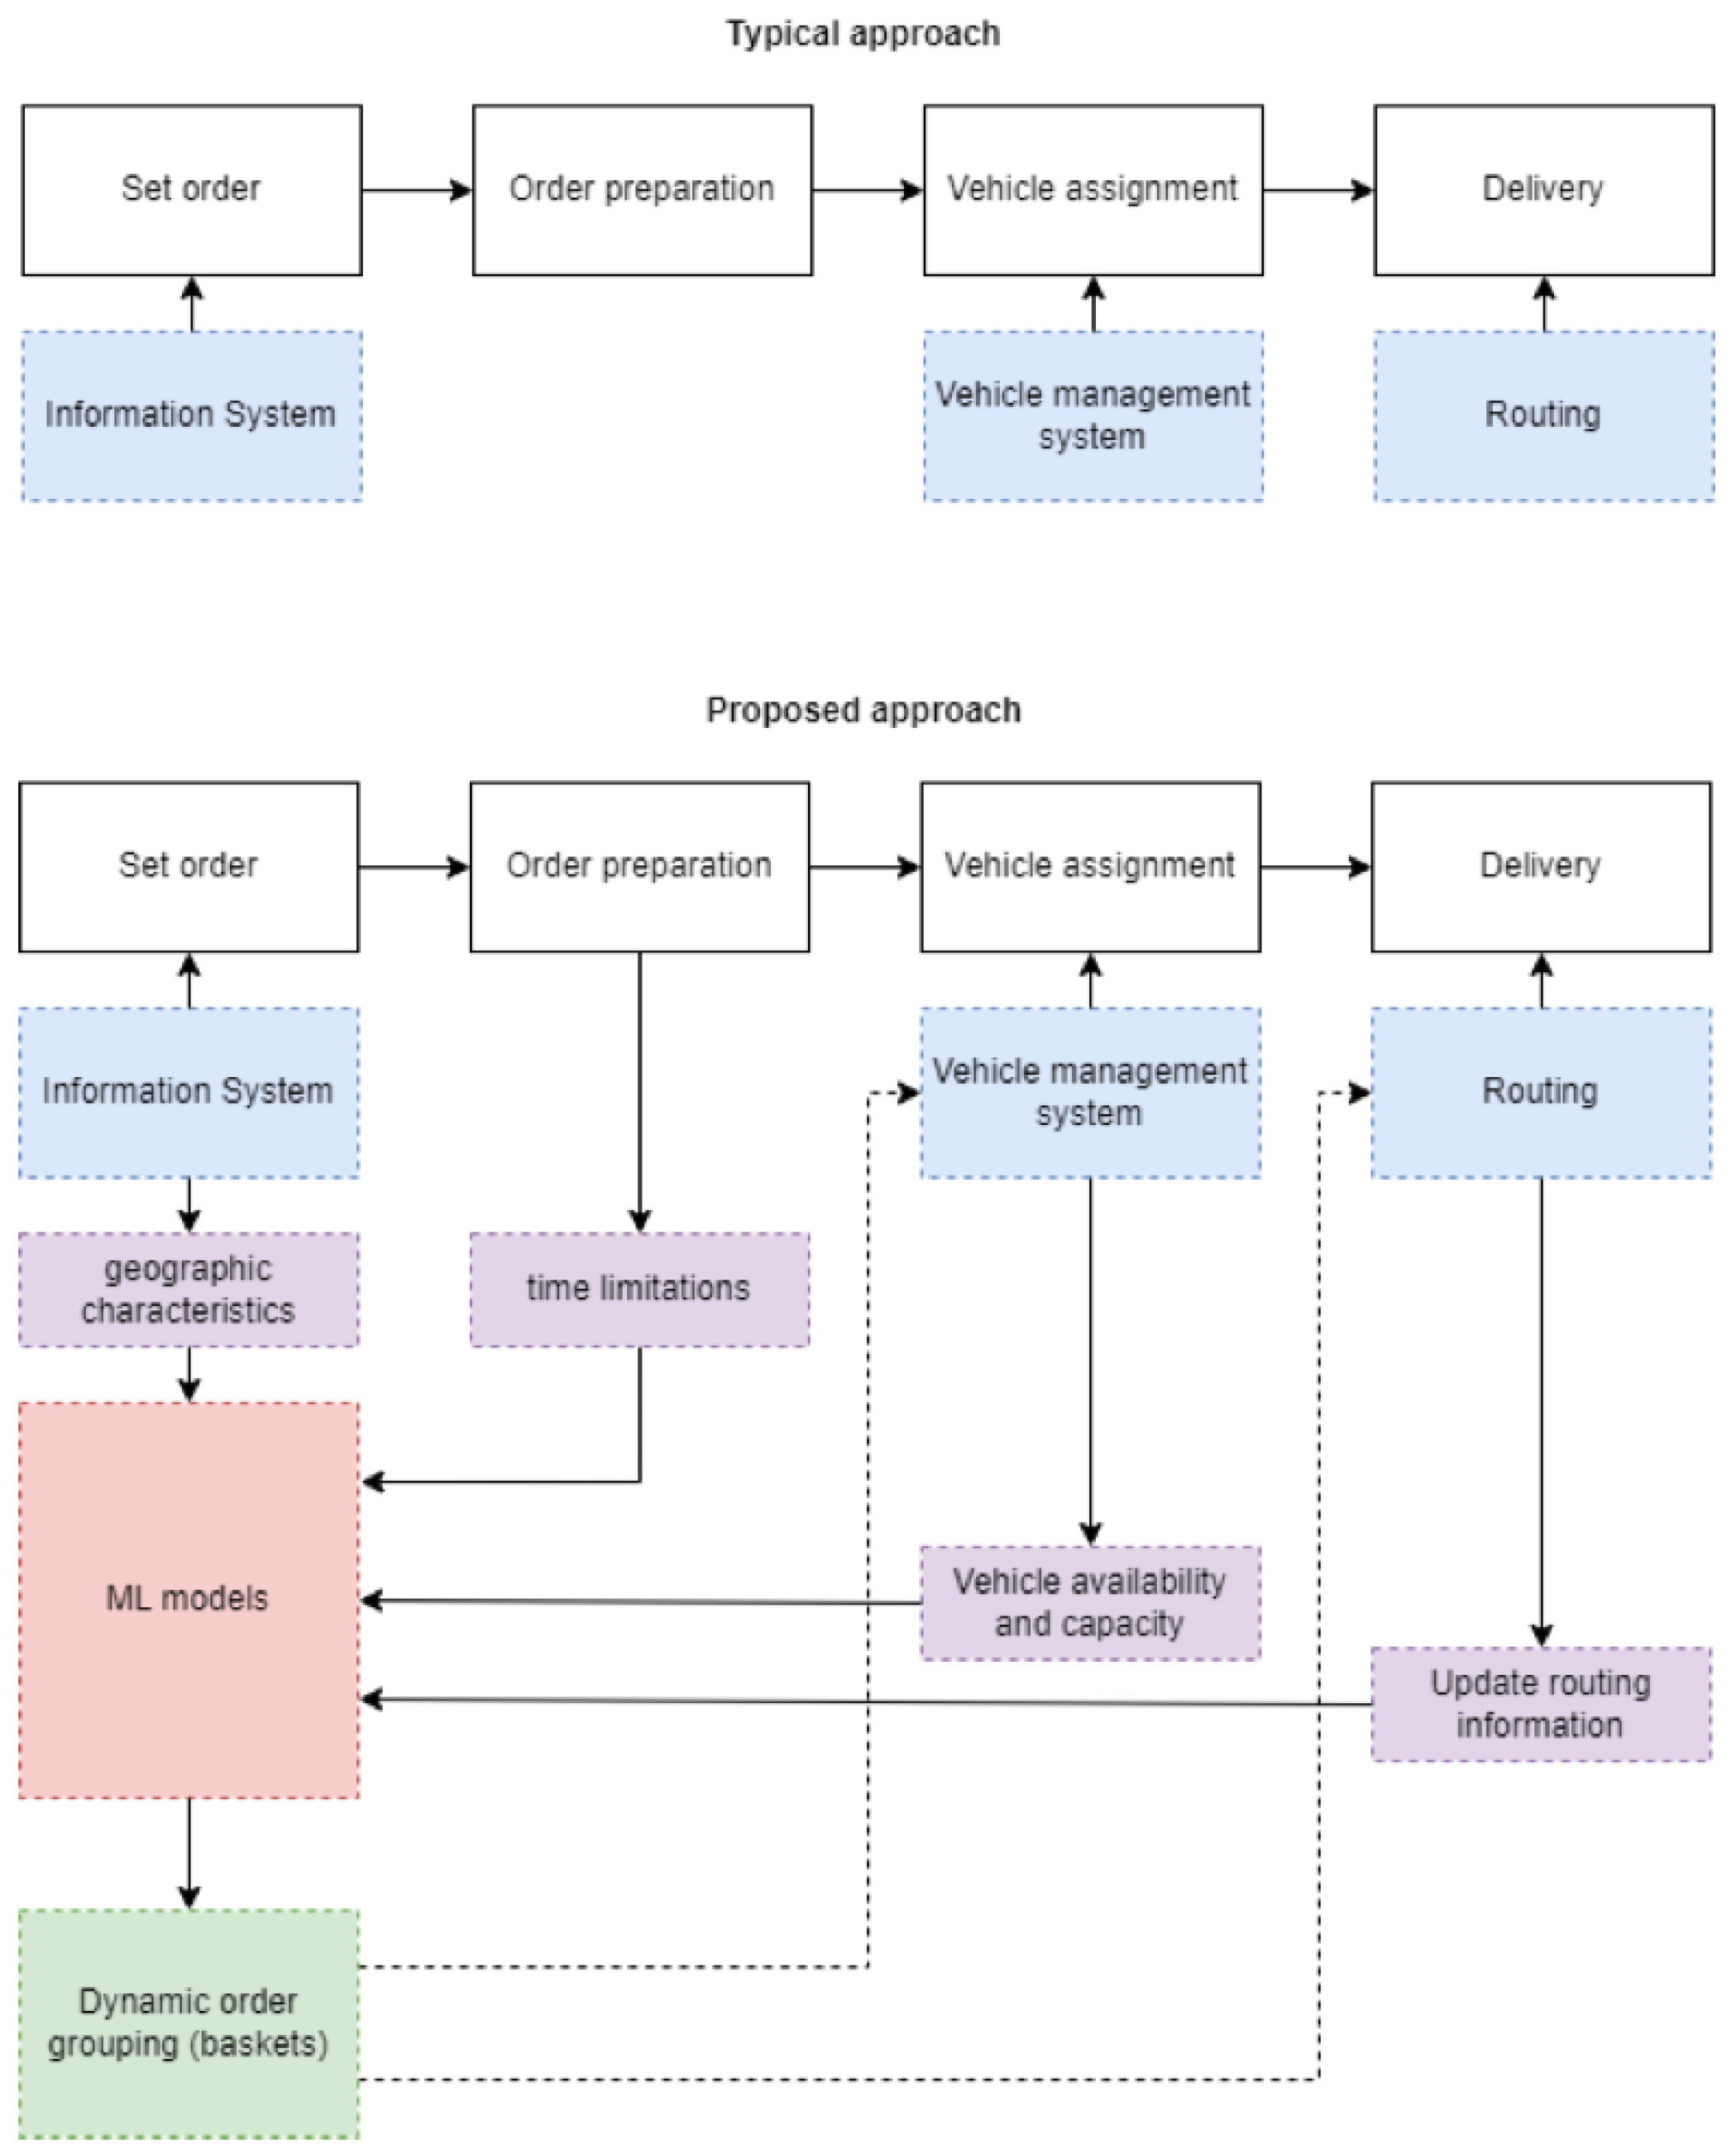
The examination of the aforementioned routing services led to the identification of a number of critical considerations for the design of a contemporary VRP system. Several of the examined systems provide a route without managing the first steps of the procedure, which are the management of vehicle capacity and the dynamic out-of-order batching of geographic locations based on vehicle capacity. Creating batches is a crucial step in the approach suggested in this paper. In addition, the vast majority of systems use a single algorithm to determine the ideal route. As will be further discussed in the following paragraphs, Smart Delivery is built on an ensemble scheme of algorithms to present users with the optimal path. Moreover, given that the translation of data in order to gain valuable insights is currently one of the most important processes, it appears to be optimal to provide businesses with an all-in-one solution consisting of a routing system and an analytics system.

2.3. Proposed System

On the basis of the aforementioned findings, we can conclude that there are multiple efforts to solve the problem of VRP, but they are either only efficient under strictly defined special circumstances or do not cover all the different sub-problems that need to be tackled. Based on this conclusion, we initiated the design of a framework capable of delivering an efficient solution for the VRP and its variants, including the CVRP and the GVRP. One of our main objectives was to build a system that would be able to enhance the day-to-day operations of a business in a specific sector by serving all the needs that may arise in routing operations. The optimal dynamic batching of the orders can greatly boost the efficient operation of a business in the domain as it can greatly reduce cost and CO2 emissions. The proposed system takes into account the quantity and capacity of the available vehicles and, according to that, creates the optimal batches of orders to facilitate the routing step that comes afterward. Additionally, the system dynamically assesses its operation and adapts its future decisions based on its effectiveness. Finally, an analytics workflow is introduced to provide businesses with valuable insight into their processes and enable the optimization of their operation.

3. Overview of the Smart Delivery System

In the following paragraphs, the proposed system’s fundamental philosophy and architecture are described. In addition, the technologies employed in the design and development of the system are discussed in two subcategories: front-end and back-end. Furthermore, a brief overview of the ensemble scheme’s algorithms as well as the technologies utilized in the system is provided.

3.1. System’s Architecture

Regarding the system, the goal is to encompass all phases of the procedure, from placing an order to delivering the items to the customer. The different steps of the procedure, from the initial order placement through the delivery of the items, are performed consecutively and without interaction. The four fundamental processes considered by the proposed system are the following:
  • The initial placement of the order,
  • The preparation of the order,
  • The assignment of the vehicle,
  • The delivery of the order, which also involves the routing of the vehicle.
During the initial phase, the proposed approach groups geographic regions into clusters to reduce the distance between distribution sites. The above-mentioned clusters have been either generated by information collected through previously placed orders or are generated dynamically throughout the day. During the system’s operation, dynamic clustering is applied to enable the transition to current information and to establish a suitable dataset for training the platform’s ML algorithm. The algorithm which is applied to define regional delivery zones is the K-means. The quantity of clusters is restricted by the number of cars, which do not service a specific location but instead follow a path that is dynamically determined based on vehicle availability. More precisely, the number of clusters to be formed, n, is initially set by the system’s user, who is responsible for selecting the current availability of the vehicles at the time of the order processing. The number of iterations for a single run was set to 10. The technique begins with the determination of the cluster centroids, followed by the calculation of the distance between the points and centroids in order to allocate each object to the centroid that is geographically nearest. The recalculation of all positions is then continued until no further modifications are possible. The preceding process is required to advance to the second stage, in which the modified Hopfield is applied.
In the second step, a modified Hopfield model is performed simultaneously, comprehensively investigating batch configurations while considering the possibility of products being dispatched out of queue order. Each problem variable is defined by a node in the modified Hopfiled. The weight values of the links between variables also characterize their relationships. Positive weight values indicate relationships between variables that are mutually supportive, whereas negative weight values indicate relationships that are inhibitive. Minimizing the objective function is the process of optimizing the neural network. The connection weights are created by first initializing the distance matrix and then defining a square N×N transposition matrix, where N denotes the number of orders. The energy function is then created to store the connection of weights that will be subsequently calculated. Thus, a CVRP criterion is satisfied by the discovery of batches that maximize the number of items contained while the distance to be traveled is reduced. The order preparation procedure must complete the preceding task within a precisely set time frame. This restricts the time required from placing an order to having it prepared for the delivery process.
The main innovation of the present work is the platform called Smart Delivery, which offers the previously specified services and has the presented features. During every phase of order processing, the time periods necessary to complete computations are defined. The orders are batched dynamically out of order depending on the capacity of the vehicles set by the administrator of the platform, the geographic areas of the orders, and either the quickest route to follow with the least emissions feasible (GVRP) or the enterprise that employs the platform’s rigorous time quality guidelines (VPRTW-based solution). The routing is founded on an ensemble scheme, traffic statistics, arrival time estimates, and distance per point estimates, which are acquired from Google and the Here framework that is used to visualize the route. Under the same platform, it is feasible to service either the CVRP, the GVRP, or the VRPTW, depending on the optimization settings used and taking into account the load capacity within each vehicle. The proposed approach is depicted in Figure 1.
In addition, a subsystem of the primary application was developed to display various statistics and diagrams. The analytics subsystem, which is depicted in Figure 2, is able to provide the user of the platform with vital information regarding vehicle availability and overall product preparation in order to be adequately prepared for the order. An experiment was run on the basis of the orders that were retrieved from an actual coffee shop for the duration of a day. This will reflect the information of real orders and products that will be fed into the analytics subsystem for further processing and analysis by the research team. This information is essential for the development of the proposed system in this work. Some of the information and its graphical representation provided by the system includes, but is not limited to, the type of the product, an analysis of the pricing and which product earns more money for the coffee company, the days with the most orders, and the time of day the orders were received, broken down into four distinct subcategories: “Early Morning”, “Morning”, “Noon”, and “Afternoon”. The majority of the previously described data can be exported as a .csv file for further analysis.

3.2. The Front-End of the System

Initially, a mockup of the front-end of the application was created to kick off the development process. An early mockup of the main application’s screen is depicted in Figure 3.
Regarding the front-end, the elements were rendered using Hypertext Markup Language (HTML). The HTML was styled with Cascading Style Sheets (CSS), and the required scripting was implemented with Javascript. To enhance the system’s design and make it mobile-friendly, the Bootstrap framework and Material Kit, which was designed for it, were employed. After successfully executing the algorithms that produce the optimal route, the Here framework was leveraged to construct the interactive map as depicted in Figure 4.

3.3. The Back-End of the System

The following technologies were utilized for the programming and data-level subsystems that provide the front-end with information to be presented. The two main languages that were used were Python and Hypertext Preprocessor (PHP). For the two e-commerce digital sites, the WordPress framework was employed.
Regarding the analytics subsystem, it was purely developed in Flask. Flask web framework [27] is a Python module that facilitates the creation of web applications. It aims to keep the application’s core simple and flexible, with a minimal, easily extendable core. Instead of a database abstraction layer, Flask provides extensions to add database functionality to an application. It is simple to begin programming and developing applications because there is no steep learning curve. Additionally, it is extremely clear, which enhances readability.

3.4. Algorithms and Ensemble Scheme

The system’s main component is an ensemble scheme comprising multiple algorithms capable of locating the best routing option. The scheme includes, but is not limited to, the cheapest insertion algorithm, a widely used heuristic for the traveling salesman problem (TSP) [28], the nearest-neighbor algorithm [29], a greedy algorithm capable of solving the TSP by finding the shortest edges connecting the current node with the unvisited ones, and parallel-savings-based heuristics [30] for producing effective solutions regarding finding the fastest route with limited computation requirements.
In addition, a modified Hopfield network, as described in [31], was used to comprehensively explore configurations of batches, taking into account the out-of-order queue delivery of products. A Hopfield network is defined as a dynamic network that iteratively converges from an unknown input state and operates as an energy-minimizing function. Moreover, it is identified as a weighted network in which the network’s output is transmitted back to the neurons, and each link has a specific weight. A completely linked Hopfield network is illustrated in Figure 5, in which a Hopfield implementation regarding a three cities TSP is depicted. In the aforementioned case scenario, the network consists of nine neurons, which are depicted as circles in the figure. This is explained since the total numbers of cities n, in this case n = 3, form a network of n by n neurons.
In addition, the K-means algorithm was utilized first to define geographic service zones. The number of clusters is restricted by the number of available cars, which do not service a specific location but instead follow a path that is dynamically determined based on the vehicle’s availability set in the initial phase. Clustering techniques [32] use the data distribution’s inner principle and develop rules for grouping data with comparable features. This procedure partitions a given sample based on clustering criteria without previous information on the dataset. In a perfect clustering situation, each cluster consists of examples of comparable data that are vastly distinct from occurrences of other clusters. Such a dissimilarity metric depends on the algorithm’s underlying data and purpose.

4. Experimental Results and Comparisons

As part of the tests to verify the proper operation of the proposed Smart Delivery system, with regard to determining the ideal route for the delivery of products/packages by a fleet of transport vehicles, a number of tests to determine the optimal route were conducted. Real data from a transport logistics company headquartered in Central Greece, the Regional Unit of Fthiotis, and specifically the city of Lamia, were utilized in the simulations performed to assess the validity of the proposed system’s operation. The beginning points and intermediate stations/points for all routes were based in the city of Lamia. The test dates spanned one month, from 17 August 2022 to 10 September 2022, in Eastern European Summer Time (EEST), UTC + 3, which is normally a period of clear weather, indicating that the weather circumstances were quite suitable for determining the ideal running time for each route. In addition, because there was no information about the specificity of the products/packages to be delivered, all products/packages were treated with the same level of specificity in all experiments.
It was observed that drivers assumed they had sufficient knowledge to choose the optimal route and that they did not need to utilize a software platform for assistance. The gathered data were entered into the platform in real time to ensure that any recommendations matched the actual road conditions, as opposed to a simulation run afterward with incorrect traffic data. This review method yielded a number of considerations that would be valuable to the platform in the future. Initially, there were recurrent clients or orders, which might facilitate the dynamic batch process as the system could anticipate daily fresh orders within a specific time frame. Second, vehicles did not always follow the rules of the road, resulting in shorter routes (either in terms of distance or time) as a consequence of either exceeding the speed limit or utilizing private roads or bypasses that are not accessible to the general public. The prior routes were excluded from the test since the platform adheres to driving regulations and is unaware of any private roads. The third consideration has already been noted, namely that the daily traffic statistics are always varied, and therefore simulations cannot be conducted after the fact; rather, the batching and routing of orders must be completed concurrently with the actual delivery of products. A few certain locations were either inaccessible or lacked parking, which considerably increased the time required to deliver the products. These routes were likewise excluded from the study, as such dynamic circumstances cannot be foreseen, and there was no error in the driver selection. Since such difficulties could not be expected, the platform may have indicated a shorter time, even though the path may have been the same. As discussed in [33], rescheduling the delivery in order to reduce the total transportation cost and continue with the successful delivery of the shipment is a potential response to an unforeseen event or a failed delivery. This implementation will be researched further so that it can be incorporated into a future upgrade of the proposed system. Another possible approach that could be applied in the final version of the proposed system is the adoption of time frames by changing the time window for delivery to include a deduction of the vehicle’s parking time until the time it is prepared to begin a new route.
Over 10,000 orders were recorded and submitted to the platform throughout its trial. Nearly 89% of them were utilized for the study since the remainder were deemed to violate norms for fair comparison or to be biased in favor of the platform. It was intriguing that approximately 15% of the orders were unique, given that the majority of orders were repeated daily. For assessment purposes, nine distinctive itineraries (consisting of several orders/routes) were chosen, which were repeated virtually daily, and the findings may be statistically assessed. In the remaining scenarios, the platform led to improved itineraries and vehicle assignments. However, it was unclear if this was related to temporal conditions or the platform’s design efficiency. The total time and distance required to deliver orders to customers are the two primary parameters for evaluating the system’s performance. The reduction in the total time distance is regarded as the most important factor for the system, as a result of which the total CO 2 emissions will be decreased correspondingly. The following results are divided into two different categories, static and dynamic routing, which are offered as options from the system.

4.1. Static Routing Results

The presented values indicate the average value of the itinerary based on data recorded in real time. Figure 6 depicts the average distance given for each route, based on both actual data and data from the proposed platform. It should be noted that the routes were distinct and that the system advised the optimal route based on current traffic circumstances. As seen in Figure 7, the distance is decreased, indicating that optimization is achievable, despite the fact that the professional drivers initially said there was no other route to the one they chose. It is also notable that the proposed framework does not report a static route, but rather a fresh one each time the quickest route for the current traffic circumstances is requested. Furthermore, reducing the traveled distance decreases fuel usage and CO 2 emissions incidentally.
Figure 8 depicts the total duration recorded for each itinerary based on both actual data and data from the proposed framework. It should be noted that the routes were distinct and that the system advised the optimal route based on current traffic circumstances. Figure 9 demonstrates that the total time required to complete the itinerary was significantly reduced. The primary advantage of shortening the itinerary is increased vehicle availability within the required time range.
In Figure 10, the total improvement in travel time for each route is expressed as a percentage. Specifically, for each itinerary, 1 through 9, the sum of all the disparities between the actual duration of the route and the duration calculated by the Smart Delivery system is displayed.
Figure 11 depicts the overall distance improvement for each route as a percentage. Specifically, for each itinerary (itinerary 1–itinerary 9), the total of all the disparities between the actual route distance and the route distance projected by the proposed Smart Delivery system is displayed, multiplied by 100.

4.2. Dynamic Routing Results

Two comparison analyses were conducted for the second set of experiments, which involved the dynamic design of the routing path. The first comparison study focused on the total improvement in journey time routing for each origin. For each of the nine alternative beginning locations, a comparison was made between the routing time improvement of the system, which involved a static routing process, and the dynamic routing time improvement of the system. The result regarding the first itinerary is presented below.
Figure 12 compares, in minutes, the overall routing time improvement in static routing (first bar of the diagram) with the overall dynamic routing time improvement (second bar of the diagram) for itinerary 1, as derived by the proposed Smart Delivery routing system.
Meanwhile, Figure 13 compares, in meters, the overall routing distance improvement in static routing (first bar of the diagram) with the overall dynamic routing distance improvement (second bar of the diagram) for itinerary 1, as derived by the proposed Smart Delivery routing system.

5. Discussion

The suggested system addresses the issue of multiple order placement and delivery to numerous locations. It provides an effective answer to the VRP by considering the four steps of the procedure (from setting the order to the final delivery of the goods). At each level of the process, the proposed platform employs ML to anticipate the availability of vehicles. In addition, it evaluates batches of items, arranging them in geographical regions out of order to reduce the additional distance that must be traveled between the delivery locations.
Real-world data were utilized in the evaluation of the platform. Lastly, the platform offers dynamically shorter routes in terms of overall distance and total time, which can benefit the business financially by achieving lower fuel consumption and, in terms of quality metrics, by reducing the delivery time for products. The test results of the proposed platform indicated a range of 2.19 percent to 25.61 percent for the total distance reduction and 2.42 percent to 14.22 percent for the overall time reduction of the delivery procedure.

Author Contributions

Conceptualization, V.T. and G.S.; methodology, V.T., V.C. and M.K.; software, V.T.; validation, V.T., E.B. and V.C.; investigation, V.T. and E.B.; data curation, V.T; writing—original draft preparation, V.T., E.B. and G.S.; writing—review and editing, V.T., E.B., G.S. and A.K.; visualization, V.T. and E.B.; supervision, G.S. and A.K.; project administration, A.K.; funding acquisition, A.K. All authors have read and agreed to the published version of the manuscript.

Funding

This research has been co-financed by the European Regional Development Fund of the European Union and Greek national funds through the Operational Program Competitiveness, Entrepreneurship and Innovation, under the call RESEARCH—CREATE—INNOVATE (project code: T1EDK-02266).

Institutional Review Board Statement

Not applicable.

Informed Consent Statement

Not applicable.

Data Availability Statement

The data presented in this study are available on request from the corresponding author.

Conflicts of Interest

The authors declare no conflict of interest.

Abbreviations

The following abbreviations are used in this manuscript:
VRPVehicle Routing Problem
CVRPCapacitated Vehicle Routing Problem
VRPTWVehicle Routing Problem with Time Windows
IoTInternet of Things
KBSKnowledge-Based System
VANETsVehicular ad hoc networks
RNNRecurrent Neural Network
SaaSSoftware-as-a-Service
APIApplication Programming Interface
KPIsKey Performance Indicator
HTMLHypertext Markup Language
CSSCascading Style Sheets
PHPHypertext Preprocessor
TSPTravelling Salesman Problem
EESTEastern European Summer Time

References

  1. Konstantakopoulos, G.D.; Gayialis, S.P.; Kechagias, E.P. Vehicle Routing Problem and Related Algorithms for Logistics Distribution: A Literature Review and Classification. Oper. Res. Int. J. 2022, 22, 2033–2062. [Google Scholar] [CrossRef]
  2. Moghdani, R.; Salimifard, K.; Demir, E.; Benyettou, A. The Green Vehicle Routing Problem: A Systematic Literature Review. J. Clean. Prod. 2021, 279, 123691. [Google Scholar] [CrossRef]
  3. Toth, P.; Vigo, D. Models, Relaxations and Exact Approaches for the Capacitated Vehicle Routing Problem. Discret. Appl. Math. 2002, 123, 487–512. [Google Scholar] [CrossRef] [Green Version]
  4. Cordeau, J.-F.; Desaulniers, G.; Desrosiers, J.; Solomon, M.M.; Soumis, F. VRP with Time Windows. In The Vehicle Routing Problem; Society for Industrial and Applied Mathematics: Philadelphia, PA, USA, 2001; pp. 157–193. [Google Scholar]
  5. Sabet, S.; Farooq, B. Green Vehicle Routing Problem: State of the Art and Future Directions. IEEE Access 2022, 10, 101622–101642. [Google Scholar] [CrossRef]
  6. Pang, G.; Takabashi, K.; Yokota, T.; Takenaga, H. Adaptive Route Selection for Dynamic Route Guidance System Based on Fuzzy-Neural Approaches. IEEE Trans. Veh. Technol. 1999, 48, 2028–2041. [Google Scholar] [CrossRef]
  7. Kanoh, H.; Nakamura, T. Knowledge Based Genetic Algorithm for Dynamic Route Selection. In Proceedings of the Fourth International Conference on Knowledge-Based Intelligent Engineering Systems and Allied Technologies (KES’2000), Brighton, UK, 30 August–1 September 2000; Volume 2, p. 619. [Google Scholar] [CrossRef]
  8. Eggenkamp, G.; Rothkrantz, R. Intelligent dynamic route planning. In Proceedings of the 13th Dutch-Belgian Artficial Intelligence Conference, Amsterdam, The Netherlands, 25–26 October 2001. [Google Scholar]
  9. Kanoh, H. Dynamic Route Planning for Car Navigation Systems Using Virus Genetic Algorithms. Int. J. Knowl.-Based Intell. Eng. Syst. 2007, 11, 65–78. [Google Scholar] [CrossRef] [Green Version]
  10. Kanoh, H.; Hara, K. Hybrid Genetic Algorithm for Dynamic Multi-Objective Route Planning with Predicted Traffic in a Real-World Road Network. In Proceedings of the 10th Annual Conference on Genetic and Evolutionary Computation (GECCO’08), Atlanta, GA, USA, 12–16 July 2008; pp. 657–664. [Google Scholar] [CrossRef] [Green Version]
  11. Chmiel, W.; Kadluczka, P.; Ernst, S. A Multicriteria Model for Dynamic Route Planning. In Proceedings of the 4th International Conference, MCSS 2011, Krakow, Poland, 2–3 June 2011. [Google Scholar] [CrossRef]
  12. Park, J.; Murphey, Y.; McGee, R.; Kristinsson, J.; Kuang, M.; Phillips, A. Intelligent Trip Modeling for the Prediction of an Origin–Destination Traveling Speed Profile. IEEE Trans. Intell. Transp. Syst. 2014, 15, 1039–1053. [Google Scholar] [CrossRef]
  13. Zolfpour-Arokhlo, M.; Selamat, A.; Mohd Hashim, S.; Afkhami, H. Modeling of Route Planning System Based on Q Value-Based Dynamic Programming with Multi-Agent Reinforcement Learning Algorithms. Eng. Appl. Artif. Intell. 2014, 29, 163–177. [Google Scholar] [CrossRef]
  14. Vamshi, B.; Prasad, R.V. Dynamic Route Planning Framework for Minimal Air Pollution Exposure in Urban Road Transportation Systems. In Proceedings of the 2018 IEEE 4th World Forum on Internet of Things (WF-IoT), Singapore, 5–8 February 2018; pp. 540–545. [Google Scholar] [CrossRef]
  15. Rothkrantz, L. Hybrid Dynamic Route Planners. In Proceedings of the 19th International Conference on Computer Systems and Technologies, Ruse, Bulgaria, 16–17 June 2018; pp. 12–19. [Google Scholar] [CrossRef]
  16. Kong, X.; Li, M.; Tang, T.; Tian, K.; Moreira-Matias, L.; Xia, F. Shared Subway Shuttle Bus Route Planning Based on Transport Data Analytics. IEEE Trans. Autom. Sci. Eng. 2018, 15, 1507–1520. [Google Scholar] [CrossRef]
  17. Ahmad, A.; Din, S.; Paul, A.; Jeon, G.; Aloqaily, M.; Ahmad, M. Real-Time Route Planning and Data Dissemination for Urban Scenarios Using the Internet of Things. IEEE Wirel. Commun. 2019, 26, 50–55. [Google Scholar] [CrossRef]
  18. Callejas-Molina, R.; Díaz-Carmona, J.; Vazquez-Leal, H.; Mayorga-Cruz, D.; Lopez-Leal, R. Exploring a Novel Electrical-Modeling-Based Route Planning for Vehicle Guidance. Math. Probl. Eng. 2020, 2020, 1–20. [Google Scholar] [CrossRef]
  19. Abdelrahman, A.; El-Wakeel, A.S.; Noureldin, A.; Hassanein, H.S. Crowdsensing-Based Personalized Dynamic Route Planning for Smart Vehicles. IEEE Netw. 2020, 34, 216–223. [Google Scholar] [CrossRef]
  20. First Choice for Last Mile. FarEye. Available online: https://fareye.com/ (accessed on 29 November 2022).
  21. OptimoRoute|Delivery Route Planning & Field Service Scheduling. OptimoRoute. Available online: https://optimoroute.com/ (accessed on 29 November 2022).
  22. Route Planning, Logistics, Optimization API & SDK|Nextmv. Available online: https://www.nextmv.io/ (accessed on 29 November 2022).
  23. Smart Delivery. Sqilline. Available online: https://sqilline.com/products/smart-deliveries/ (accessed on 29 November 2022).
  24. Smart Delivery Management. Mendix. Available online: https://www.mendix.com/solutions/smart-delivery-management/ (accessed on 29 November 2022).
  25. Last Mile | Milkman Data-Driven Operations & Machine Learning. Milkman. Available online: https://www.milkmantechnologies.com/last-mile-operations/ (accessed on 29 November 2022).
  26. Delivery Logistics Management Software & Route Optimization Tracking App|Pickpack. Available online: https://pickpackage.com/el/ (accessed on 29 November 2022).
  27. Welcome to Flask—Flask Documentation (2.2.x). Available online: https://flask.palletsprojects.com/en/2.2.x/ (accessed on 29 November 2022).
  28. Hassin, R.; Keinan, A. Greedy Heuristics with Regret, with Application to the Cheapest Insertion Algorithm for the TSP. Oper. Res. Lett. 2008, 36, 243–246. [Google Scholar] [CrossRef] [Green Version]
  29. Gutin, G.; Yeo, A.; Zverovitch, A. Exponential Neighborhoods and Domination Analysis for the TSP. In The Traveling Salesman Problem and Its Variations; Gutin, G., Punnen, A.P., Eds.; Combinatorial Optimization; Springer US: Boston, MA, USA, 2007; pp. 223–256. [Google Scholar] [CrossRef]
  30. Altinkemer, K.; Gavish, B. Parallel Savings Based Heuristics for the Delivery Problem. Oper. Res. 1991, 39, 456–469. [Google Scholar] [CrossRef]
  31. Sarvepalli, S.K. Solving Travelling Salesman Problem (TSP) Using Hopfield Neural Network (HNN) and Simulated Annealing (SA); Liverpool Hope University: Liverpool, UK, 2015. [Google Scholar] [CrossRef]
  32. Ahmed, M.; Seraj, R.; Islam, S.M.S. The K-Means Algorithm: A Comprehensive Survey and Performance Evaluation. Electronics 2020, 9, 1295. [Google Scholar] [CrossRef]
  33. Zhang, M.; Wang, N.; He, Z.; Jiang, B. Vehicle routing optimization for hazmat shipments considering catastrophe avoidance and failed edges. Transp. Res. Part Logist. Transp. Rev. 2021, 150, 102337. [Google Scholar] [CrossRef]
Figure 1. The proposed system’s architecture for the entire process of delivery service.
Analytics 02 00018 g001
Figure 2. The analytics subsystem of the proposed Smart Delivery project. The Comparison of Quantity Sold and Revenue Generated for Coffee and Snacks is displayed. More specifically the first graph shows the percentage of quantity sold by item type, with blue representing coffee and red representing snacks, the second graph displays the revenue generated by item type, with blue representing coffee and red representing snacks, the third graph represents the quantity of items sold per month, with the option to choose the month to be displayed, the fourth graph shows the sales per day and the daily trend of items sold, while the last one depicts the distribution of sales during early morning, morning, evening, and noon.
Analytics 02 00018 g002
Figure 3. Early mockup of the framework’s main screen.
Analytics 02 00018 g003
Figure 4. The interactive map with the optimal route produced by the proposed system. The left side of the view showcases the points and the routes while the right side provides analytical directions in addition to the total time and travel distance required to successfully deliver the orders.
Analytics 02 00018 g004
Figure 5. An example of a Hopfield implementation in an n = 3 cities TSP.
Analytics 02 00018 g005
Figure 6. The comparison to actual itineraries demonstrates that the proposed platform suggests more efficient routes, reducing the overall distance, based on the current traffic circumstances. The diagram displays the values of nine randomized routes, one for each of the nine bases.
Analytics 02 00018 g006
Figure 7. The comparison to actual itineraries demonstrates that the proposed platform suggests more efficient routes, reducing the overall distance, based on the current traffic circumstances. The graph illustrates the disparity in the values of each route in regard to total distance reduction measured in meters.
Analytics 02 00018 g007
Figure 8. The comparison to actual itineraries demonstrates that the proposed platform suggests more efficient routes, hence reducing the overall travel time, given the present traffic circumstances. The graph depicts the values of nine random routes, one from each of the nine bases.
Analytics 02 00018 g008
Figure 9. The comparison to actual itineraries demonstrates that the proposed platform suggests more efficient routes, hence reducing the overall travel time, given the present traffic circumstances. The graphic illustrates the disparity in the values of each route in regard to the total time reduction measured in minutes.
Analytics 02 00018 g009
Figure 10. The percentage of time savings related to the proposed Smart Delivery system for each route.
Analytics 02 00018 g010
Figure 11. The percentage of distance reduction related to the Smart Delivery system for each route.
Analytics 02 00018 g011
Figure 12. Static routing compared to dynamic routing time improvement.
Analytics 02 00018 g012
Figure 13. Static routing compared to dynamic routing distance improvement.
Analytics 02 00018 g013
Disclaimer/Publisher’s Note: The statements, opinions and data contained in all publications are solely those of the individual author(s) and contributor(s) and not of MDPI and/or the editor(s). MDPI and/or the editor(s) disclaim responsibility for any injury to people or property resulting from any ideas, methods, instructions or products referred to in the content.

