
Metric Ensembles Aid in Explainability: A Case Study with Wikipedia Data

1
Department of Computer Science, North Carolina State University, Raleigh, NC 27695, USA
2
Department of Computer Science, Smith College, Northampton, MA 01063, USA
*
Author to whom correspondence should be addressed.
Analytics 2023, 2(2), 315-327; https://doi.org/10.3390/analytics2020017
Submission received: 1 February 2023
/
Revised: 13 March 2023
/
Accepted: 21 March 2023
/
Published: 7 April 2023
(This article belongs to the Special Issue Selected Papers from the 2022 Summer Conference on Applied Data Science (SCADS))
Abstract
:In recent years, as machine learning models have become larger and more complex, it has become both more difficult and more important to be able to explain and interpret the results of those models, both to prevent model errors and to inspire confidence for end users of the model. As such, there has been a significant and growing interest in explainability in recent years as a highly desirable trait for a model to have. Similarly, there has been much recent attention on ensemble methods, which aim to aggregate results from multiple (often simple) models or metrics in order to outperform models that optimize for only a single metric. We argue that this latter issue can actually assist with the former: a model that optimizes for several metrics has some base level of explainability baked into the model, and this explainability can be leveraged not only for user confidence but to fine-tune the weights between the metrics themselves in an intuitive way. We demonstrate a case study of such a benefit, in which we obtain clear, explainable results based on an aggregate of five simple metrics of relevance, using Wikipedia data as a proxy for some large text-based recommendation problem. We demonstrate that not only can these metrics’ simplicity and multiplicity be leveraged for explainability, but in fact, that very explainability can lead to an intuitive fine-tuning process that improves the model itself.
1. Introduction
We are interested in the problem of scanning a large corpus of text data to find items to recommend to a user, given some set of example data. In particular, we are concerned with two key aspects of this problem:
- 1.
- To what extent is the model’s particular selection of items from the corpus explicable to the user?
- 2.
- Are the metrics of similarity that the model optimizes for ones that are sufficiently close to the user’s preferences – in other words, how do we quantitatively specify, as closely as possible, a qualitative and subjective notion of “quality” in the eyes of the end user?
There is a wealth of prior literature discussing the first of these issues. Oftentimes, this literature involves post hoc explainability tools, which take as input some “black box” model, then perturb its inputs and assess counterfactual responses the model could have given in order to assess which aspects of the input were most important. An example of this type of method can be seen in [1].
For the latter of these issues, one particularly well-documented approach is to take an ensemble of metrics, as heuristics approximating the un-measurable goal that is to be optimized: this turns out to be less difficult to “hack” than a single heuristic, even if the single heuristic is relatively sophisticated, and the individual heuristics in the ensemble relatively simple.
However, previous work has not addressed the potential for metric ensembles to address the former of these problems, which is what we do in this work. We will first review the motivation behind metric ensembles as improving robustness over single-metric models. We will then cover the variety of ways in which this has been implemented in prior literature. We will then demonstrate a new method for using metric ensembles as a tool not just for robustness, but also for both explainability and model fine-tuning by an end user. We do this via a preliminary toy model using Wikipedia data.
2. Related Work
Here, we review the literature surrounding the problems with optimizing for single metrics, and the benefits of ensemble and related methods for dealing with these.
2.1. Single Metrics Are a Problem
There is a wide array of previous literature discussing the potential of machine learning models to overfit the metrics on which they are trained, with adverse consequences. Ref. [2] gives a good summary of many of these issues. It includes examples particularly relevant to recommender systems, such as the documented potential for a recommender system to have radicalizing effects [3]. Recommender systems, particularly those trained exclusively on accuracy metrics, have also been found to foster addictive behaviors [4]. Many of the beyond-accuracy metrics discussed previously in this paper are often used with the intention of counteracting these sorts of tendencies. These tendencies have been noted to be particularly strong when relying on what are often called “revealed-preference” metrics: those signals which are not taken from direct, intentional human feedback, but rather from human behavior (click data, dwell time, etc.) that is merely assumed, under some model, to reveal some underlying preference structure. Ref. [5] gives a detailed analysis of the effects of this increasing reliance on revealed-preference metrics from an anthropological perspective.
To optimize for a single metric based explicitly on human feedback, however, is also gameable: ref. [6], for example, demonstrates empirically that direct human feedback is not mathematically rational, and can be gamed or inconsistent with itself based on alternate framing of issues. The issues, then, run deeper.
This general problem is often referred to in the literature within the context of Goodhart’s law. First coined in [7], it states that “any observed statistical regularity will tend to collapse once pressure is placed upon it for control purposes”. Phrased more concisely in [8], it states “when a measure becomes a target, it ceases to be a good measure”. Any quantifiable metric (i.e., “minimize L2 loss between predicted click rate and actual click rate given the titles of news articles on MIND”) [9] is necessarily just an approximation for some fuzzy, only partially-defined goal that we really want (“recommend an article the user wants to read”). As such, Goodhart’s law states that, as a model optimizes for this quantifiable metric, the metric itself will tend to no longer serve as a reliable proxy for our true goal. As expounded on in [2], this is a ubiquitous problem for AI and leads to the sort of adverse effects documented in, i.e., [3,4].
Goodhart’s law is explored in more detail in [10], which demonstrates that it is actually a cluster of four mathematically distinct statistical tendencies. Ref. [11] develops a simple model of metric alignment with a goal, and shows that, given a very general set of assumptions, optimizing for an incomplete heuristic to some “true” utility function will invariably lead to an arbitrary loss in true utility. Ref. [12] discusses this mismatch between actual normative value and engagement metrics, and also presents a model by which some “anchor” metric can be used to estimate the strength of each other metric in predicting value using a Markov model. Of course, this approach still requires the assumption that there is some quantifiable and known metric that is able to be used as the “true” value of some subset of the data, and if this assumption is made erroneously then Goodhart effects between the assumed “true” metric and the actual desired goals are still to be expected. The base idea of this paper, however, of analyzing multiple metrics’ correlations with each other in order to minimize these effects, holds a lot of promise and is relevant for any model that seeks to optimize an ensemble of metrics.
2.2. Ensembles Address This Problem
There is a large body of prior work suggesting that ensemble methods – using either multiple models, or a model trained on multiple metrics – do a lot towards mitigating the problems outlined in Section 2.1, and often outperform their single-model, single-metric counterparts. Some of this work focuses on independent models each of which maps onto some single metric, but with somewhat uncorrelated noise that cancels out in aggregate. Ref. [13], for example, gives a defense of the “robust beauty” of improper model ensembles for regression problems: that is to say, it shows that a large ensemble of models, even if evenly rated without respect for any a priori superiority of one metric over another, will often outperform human clinical judgment. Ref. [14], which specifically discusses the general case of using recommender systems for an intelligence analyst, mentions that hybrid systems, which combine both collaborative and content-based methods through some “decision fusing method”, such as a neural ensemble or weighted sum, are of particular interest. Ref. [2], after a broad discussion on the problems single metrics pose for AI development, explicitly proposes metric ensembles as a solution, citing arguments made in [15] regarding metric-gaming. Ref. [16], speaking of neural network ensembles, shows that in the general case, assuming uncorrelated errors between models (something also emphasized, and referred to as “diversity” in other work, i.e., [17], though this is in a different sense of the word than that used elsewhere in this paper), we can expect the mean squared error from some true value function of a constant-weight linear sum model the be in expectation that of any individual model, where N is the number of models in the ensemble. This lessening of divergence between the ensemble model and the true value it is estimating, then, leaves less room for Goodhart effects.
Note that, while some of this work focuses on metric ensembles (e.g., [2]), others focus on ensembles of models trained on a single metric (e.g., [13,16]). This research on model ensembles is directly applicable to metric ensembles; however, a model trained on some metric can be viewed as a new proxy metric that imperfectly approximates the metric on which it is trained. This view is, in fact, taken in any work which trains a neural network to approximate human feedback, then uses that trained network as part of the loss function for a new model (e.g., [18]). Any research that demonstrates the efficacy of model ensembles, then (of which there is much), implicitly demonstrates the efficacy of metric ensembles as well. In Section 2.3, we briefly review some of the work in this area that is most potentially relevant to our stated interest.
2.3. A Brief Literature Review of Neural Network Ensembles
Neural network ensemble research is often split into two categories: that which deals with regression problems and which deals with classification problems. Insights from both can be mapped onto metric ensemble research because the eventual “goal” can be treated as either a binary (“give a ‘good’ recommendation”) or a scalar (“recommend the item that will return the highest utility for the user”).
For regression problems, Ref. [19] gives a thorough survey on regression ensemble models, and specifically methods of optimizing their weights. This is often done in some sort of linear sum with static weights, but more complex models are also reviewed that dynamically adjust model weightings [20]. In terms of these static weight papers, ref. [17] building on the work of, e.g., [16], demonstrates a way to optimally set the weights between a set of regression models using some preexisting estimation of their accuracy (a test on some small training set for which “true” labels are known, for instance) plus their correlations with each other on another (potentially much larger) unlabeled set of data. It is likely relevant to some eventual model that weighs metrics together in an ensemble.
For classification problems, refs. [21,22,23] all follow a line of work that shows how to both determine the accuracy of a set of models and determine the best set of weightings between them in an ensemble model, using solely their agreement with each other on unlabeled data. This is incredibly relevant, because quantitative metrics, by their very nature, are simply proxies for some qualitative value that we actually care about, but can never directly access—this means that in the realm of metrics, unless we are willing to make additional assumptions (see the “anchor variable” method in [12] for an example), we can only ever have access to “unlabeled” data. Ref. [21] demonstrates the efficacy of this method on two distinct real-world datasets, suggesting generalizability, and [22,23] expand on the method. Note that they show their method does not necessarily need the assumption that the errors of the models being used are uncorrelated from each other: this makes their result potentially quite general. An incorporation of a weighting method used in these papers, at least for all metrics that can be reasonably approximated as “classifiers”, would likely result in an ensemble-based model that is strictly better than one which simply uses a naive linear sum, as in [13] (this is despite the fact that unweighted sums with many ensembled, noisy metrics are, themselves, already surprisingly robust).
2.4. Weak Supervision as an Extension of Metric Ensembles and Data Augmentation
Another field of research that is suggestive of the potential for metric-ensemble methods in a large-scale text-based recommendation model is that of weak supervision. The idea behind this field of research is that there are many areas (intelligence reports being one of them) in which labeled data is hard to come by, and difficult/costly to create (requiring special expertise/security clearances on the parts of the labelers, for example), but in which unlabeled data is much more plentiful and comparatively easy to curate. When this is the case, many weak heuristics/metrics can be applied to an unlabeled dataset, which is then combined in some way to create “noisy” labels for training a model. This allows for large datasets to be curated, in a way that is not prohibitively costly.
One particularly promising tool out of this field is Snorkel [24], which is an open-source tool allowing for easy programming of these heuristics. It automatically combines these into a generative model that resolves inconsistencies between heuristics [25], and applies noisy labels to the dataset. It is for classification heuristics only at the moment, but this itself already has lots of potential for a large-scale text-based recommender system (classifications such as “relevant” and “not relevant” might be sufficient, for example), and the general framework of Snorkel could be potentially extended to regression problems for any metrics that absolutely must be framed this way. In fact, the (regression-based) simple metrics implemented in Section 3 are inspired, in part, by the approach of Snorkel, and thus demonstrate the potential efficacy of such an approach.
A subfield of weak supervision that may be of particular relevance to the development of a large-scale text-based recommender system is Positive-Unlabeled (PU) learning. PU learning studies the case where a large, unlabeled dataset, along with a small dataset with only positive labels, is available. Ref. [26] gives a good survey of this field. Given that we are likely to have access to a body of reports an analyst has already labeled (either implicitly or explicitly) as “useful”, this could be treated as the positive-labeled data, and the aggregate of existing other reports/intelligence sources could then be treated as the unlabeled portion. Such an approach is promising for this particular domain.
2.5. Metrics for an Eventual Large-Scale Ensemble-Based Text Recommender System
Many metrics could be potentially useful as part of a larger ensemble for an eventual large-scale text-based recommender system. One of the most common is click rate accuracy for, i.e., news articles based on title, such as those often used with the MIND dataset [9]. Note that accuracy metrics that take the actual body of articles themselves are also worth considering, though these are less present in the literature. There are also accuracy metrics that look at, e.g., dwell time, and potentially other analyst-specific actions such as adding a report to an ongoing portfolio: these could be linked together and incorporated into a Markov model, building on the work of [12]. Relying solely on accuracy metrics has been shown to cause unforeseen issues, however, as is discussed in [27]. Instead, metrics such as diversity and novelty ought to be incorporated, in order to prevent the sort of Goodhart effects discussed in earlier sections. An overview of such diversity metrics, and others, can be found in [28]: note however that the straightforward incorporation of these as a tool for training, or for direct recommendations, comes up against two problems. First, diversity metrics are often calculated based on a slate of recommended candidates, or a candidate and some background distribution of candidate characteristics, and therefore have a different domain than most other metrics, which have some characteristics of a particular candidate and user pair as their domain. This means they cannot be straightforwardly combined—i.e., in a weighted sum—with most other metrics. Second, most of the literature seems to involve using them as a post hoc evaluative tool, rather than as some additional reward for a training loop. Both of these should be kept in mind, although neither of these claims applies to all papers cited in the survey.
Another general type of metric that could be used to train a model and compiled it into an ensemble is human feedback. Training a model on human feedback is common in the literature, and often can be used to minimize Goodhart effects. Some of the literature, actually, has been training on an ensemble of human feedback for multiple different qualitative metrics: “helpfulness” and “harmlessness” for an AI assistant [29]. This itself can be conceptualized as an ensemble method and provides similar benefits.
Of course, human feedback is often costly to obtain and deploy at scale. Obtaining explicit feedback on just a subset of training data, as part of a weak supervision method, has been shown to be helpful, and indeed can be incorporated into Snorkel [24]. Another option is to train a model to approximate human feedback, and then deploy that model’s approximation as the signal itself at scale during training [18].
3. Metric Ensembles Aid in Explainability: A Demonstration with Wikipedia Data
In Section 2, we reviewed some of the literature illustrating how ensemble methods can provide many benefits over non-ensemble metrics for optimization problems (including recommender systems), such as the decreased chance of overfitting and robustness to Goodhart effects. In addition to these benefits in prior literature, however, we have also developed a working theory of metric ensembles’ utility in supporting explainability. We developed a working prototype to demonstrate this potential, using Wikipedia pages as a rough proxy for the kinds of linked data that an analyst might encounter.
Recommender models that are fit to a single, complex metric can be a black box. For example, assume we have a model trained on the MIND dataset, such as NMRS, which was designed to maximize click rate based on the article title. If we then deploy this model to recommend new articles based on a user’s prior clicks, the resulting recommendations do not come with any inherent explanation for why they were recommended, beyond the explainability inherent to the structure of the model and the objective itself (“presumably, it thinks this user would be likely to click on these article titles”). This characteristic can be particularly problematic when the model provides recommendations that miss the mark, especially in applications where the consequences for missed information are high; because the user is not provided with an explanation, “oddball” recommendations can quickly contribute to the erosion of trust in the system [30].
However, consider an alternative where instead of using a single black-box metric to measure fitness, we employ a suite of several complementary metrics or datasets and train different models to optimize for each of them. In cases where the individual models diverge in their evaluation of a candidate article, then the very fact that these metrics were divergent tells us something about the article itself, and the particular ways in which it is potentially useful: the ensemble model can simply report, for its top candidates, which particular metrics that candidate satisfies, and to what degree. This gives the analyst a better idea about the “reasoning” behind the recommendations, which in turn can help to both generate confidence in the model when it is performing well and preserve trust in cases where it has failed. Moreover, a deeper understanding of why a given recommendation was made affords opportunities for additional model tuning and refinement.
The degree to which this information adds value is directly related to the choice of the metrics themselves: by selecting metrics that are individually understandable (e.g., “This article mentions an entity of interest” or “This article came from a trusted source”), the overall explainability of the ensemble is preserved. One potential pitfall of this method is that many useful metrics are not easily interpretable to a non-expert: however, the negative effects are likely mitigated by the fact, discussed above, that many “bad” (and therefore possibly simple) metrics used in an ensemble can reliably outperform a single metric (or human expert) in isolation [13].
3.1. Recommending Wikipedia Articles: A Toy Example
We devised a toy example to demonstrate this potential aid in explainability that metric ensembles could provide. In this toy model, Wikipedia pages serve as the proxy for intelligence items an analyst might want to consider reading. We accessed these through the Wikipedia python library, which is capable of pulling all the content of articles, as well as the metadata, such as links to other articles, article categories, etc. In this problem formulation, we prepared a list of pages that were in the example corpus: pages that we know the user is interested in or has added to their portfolio. There is also a secondary list of candidate pages: these are pages that need to be evaluated for similarity to the corpus along some ensemble of metrics. The goal, then, is to find which of the candidate pages is the best recommendation given the pages in the corpus, and deliver some insight, based on the metric ensemble used, about why this recommendation was made.
As a beginning proof of concept, we used an example corpus that consisted of just two Wikipedia pages: the entries for apples (accessed on 20 February 2023) and oranges (accessed on 20 February 2023). All pages referenced were accessed in July of 2022. The task of collecting candidates on which to run a model and give recommendations was considered outside of the scope of this demo, at least as an automatic process: our solution here was to just select a plausibly related page, collect all the pages linked to from that page into a list, and consider that list the list of candidate pages. This was done as a pre-processing step. For the candidate pages corresponding to the aforementioned corpus of apples and oranges, we used every page linked to by the page for bananas (accessed on 20 February 2023).
We then evaluated each candidate page according to five relatively naïve metrics:
- Shared Links: this metric counts how many pages linked from the candidate are also linked in the corpus, and double-counts links that were linked by multiple items in the corpus.
- Links To Corpus: this metric counts how many pages within the corpus, if any, are linked to by the candidate.
- Linked From Corpus: aptly named, this metric counts how many pages in the corpus, if any, link to the candidate article.
- Shared Categories: this metric counts how many article categories (such as “Edible fruits”, “Staple foods”, or “Articles lacking reliable references from April 2022”) are shared between the candidate and pages in the corpus, double counting where appropriate.
- Large Article: this metric just counts the word length of the page content. Intuitively, this metric is assuming that larger articles are “more important”, and disincentivizes recommending stubs.
These metrics were chosen primarily for ease of explainability and base plausibility, rather than being individually robust: this was done, in part, to highlight the way in which individually insufficient metrics, in an ensemble, can often generate plausible recommendations by “covering” each others’ insufficiencies. There are, of course, many other similar metrics we could have chosen, and future work will involve a more robustly-motivated and wider selection of base metrics. These metrics were calculated over all the candidates, and then each candidate was given a percentile score for each metric indicating where it fell on that metric relative to the other candidates. This was done as a normalization step, ensuring that metrics that were naturally high (such as Large Article) would not artificially wash out potentially relevant information measured by other metrics. This was not a trivial choice: another approach could have been to normalize all metrics to a Gaussian with a mean of 0 and a standard deviation of 1. A metric ensemble using this normalization method would likely have a tendency to more greatly favor candidates that are an outlier in one metric, but unimpressive in the others. A comparison between normalization methods, however, is left to future work.
Once the percentiles were calculated, we found a total score for each candidate by summing the individual metrics—initially, this aggregation was performed with constant weights. We then sorted the candidate list by this final score to obtain a top ten and bottom ten list of candidates: those pages are the most and least likely to be good recommendations, according to this model. These recommendations can be seen in Table 1.
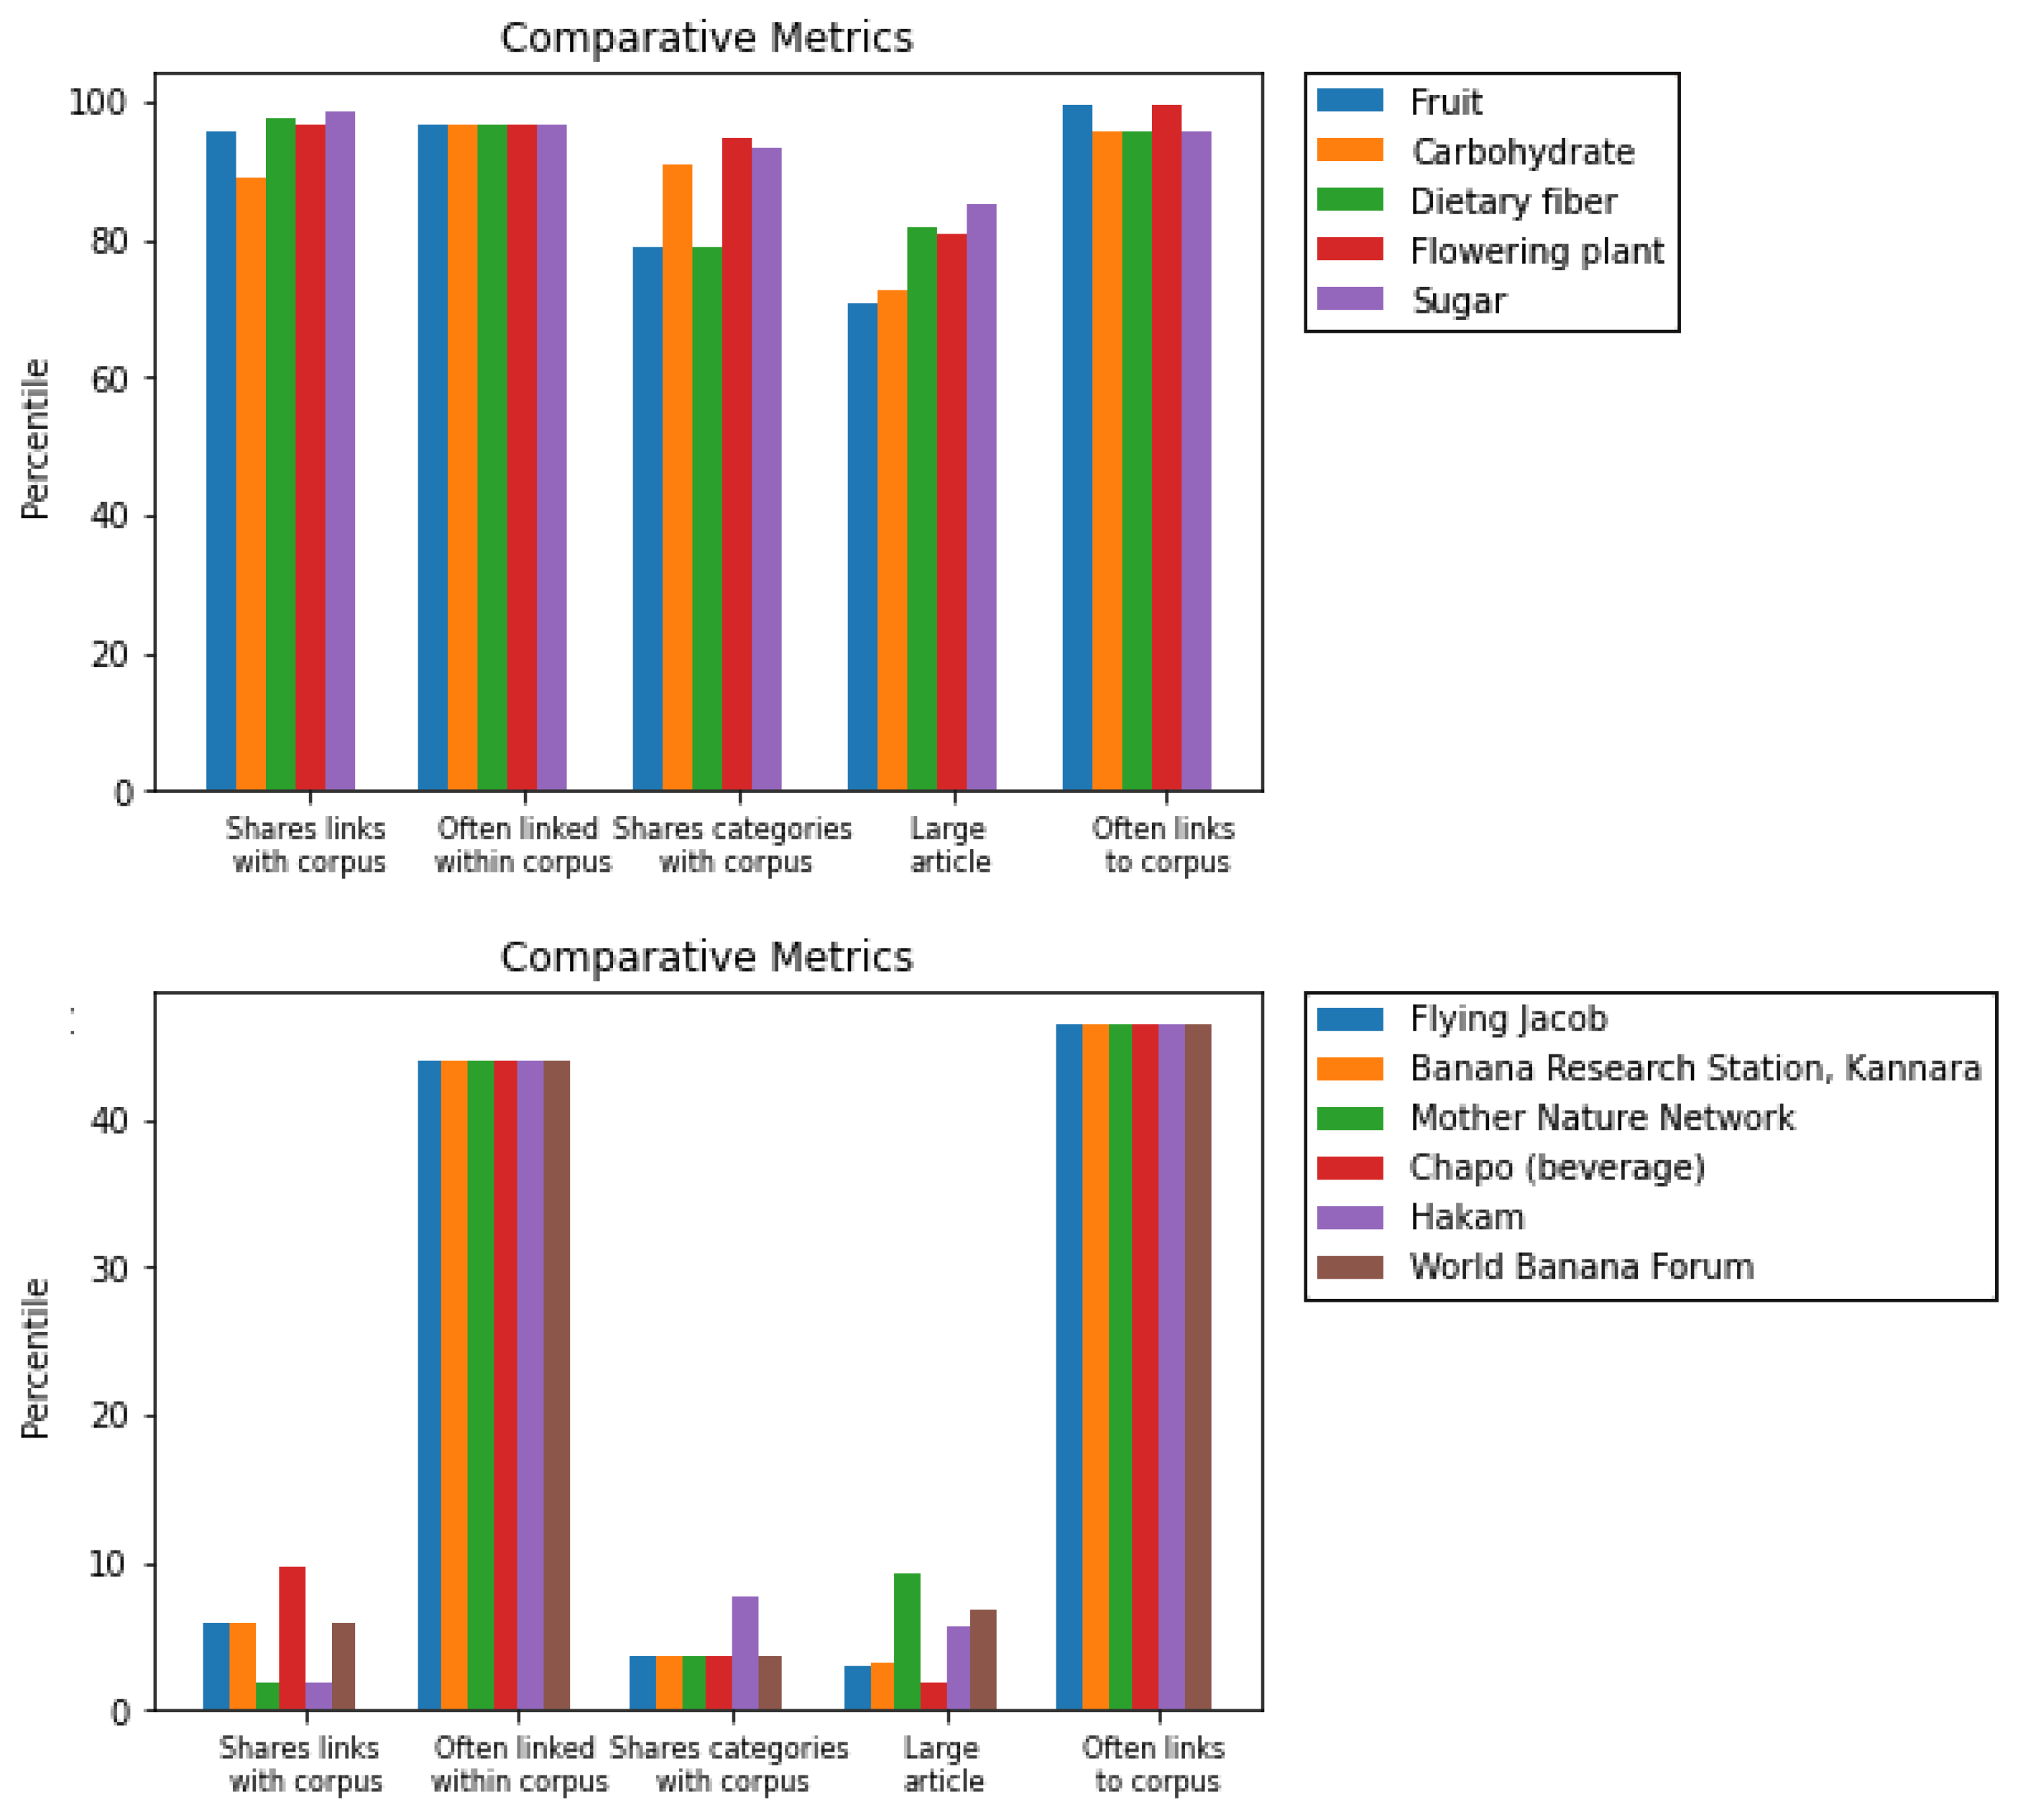
From a glance, it can be seen that the model is performing passably well: at least, the top 10 recommendations seem clearly more relevant than the bottom 10. For further insight into this model, however, we can plot the relative percentiles of each metric for any set of candidates we want to compare. Such plots, generated for the top 5 and bottom 6, respectively, are shown in Figure 1.
There are a few things of note from these “explainability plots.” Firstly, you’ll notice the rather homogeneous scores in the “Often Links to Corpus” and “Often Linked Within Corpus” metrics. Because the corpus in this toy example only had length 2, these could each only take on 3 possible values: 0, 1, or 2. Thus, they are somewhat noisy signals, and maybe ought to be deprioritized. Given this post hoc feedback (something that a human subject expert, such as an analyst, could very well provide an analogous version of in real-time), we can drop both these metrics from the weighting, and generate a new set of recommendations, seeing if that changes things for the better. A set of recommendations given when both these metrics are dropped is shown in Table 2.
There are a few things to note about this table, particularly in comparison with the top recommendations in Table 1. There is a significant de-emphasis on nutritional pages such as “Carbohydrate” and “Dietary Fiber”. There are certain changes that seem distinctly reasonable: the inclusion of “Coconut” and “Banana”, for instance, or the elevated rankings of “Maize”, “Plant”, and “Soybean”. Other inclusions seem more suspect, however: particularly the new additions of “Biodiversity”, “Fungus”, “North America”, and, most puzzling of all, “Cat”. These inclusions may be taken to indicate that the intuitive iterative change we made was not entirely successful in improving the overall ensemble. This could be an indictment of the method as a whole, of the specific metrics we are using, or of the fact that we iterated by removing two metrics entirely, rather than by simply adjusting their weights downward: after all, doing so would cause us to lose some of the benefits of ensemble methods that we are trying to gain in the first place.
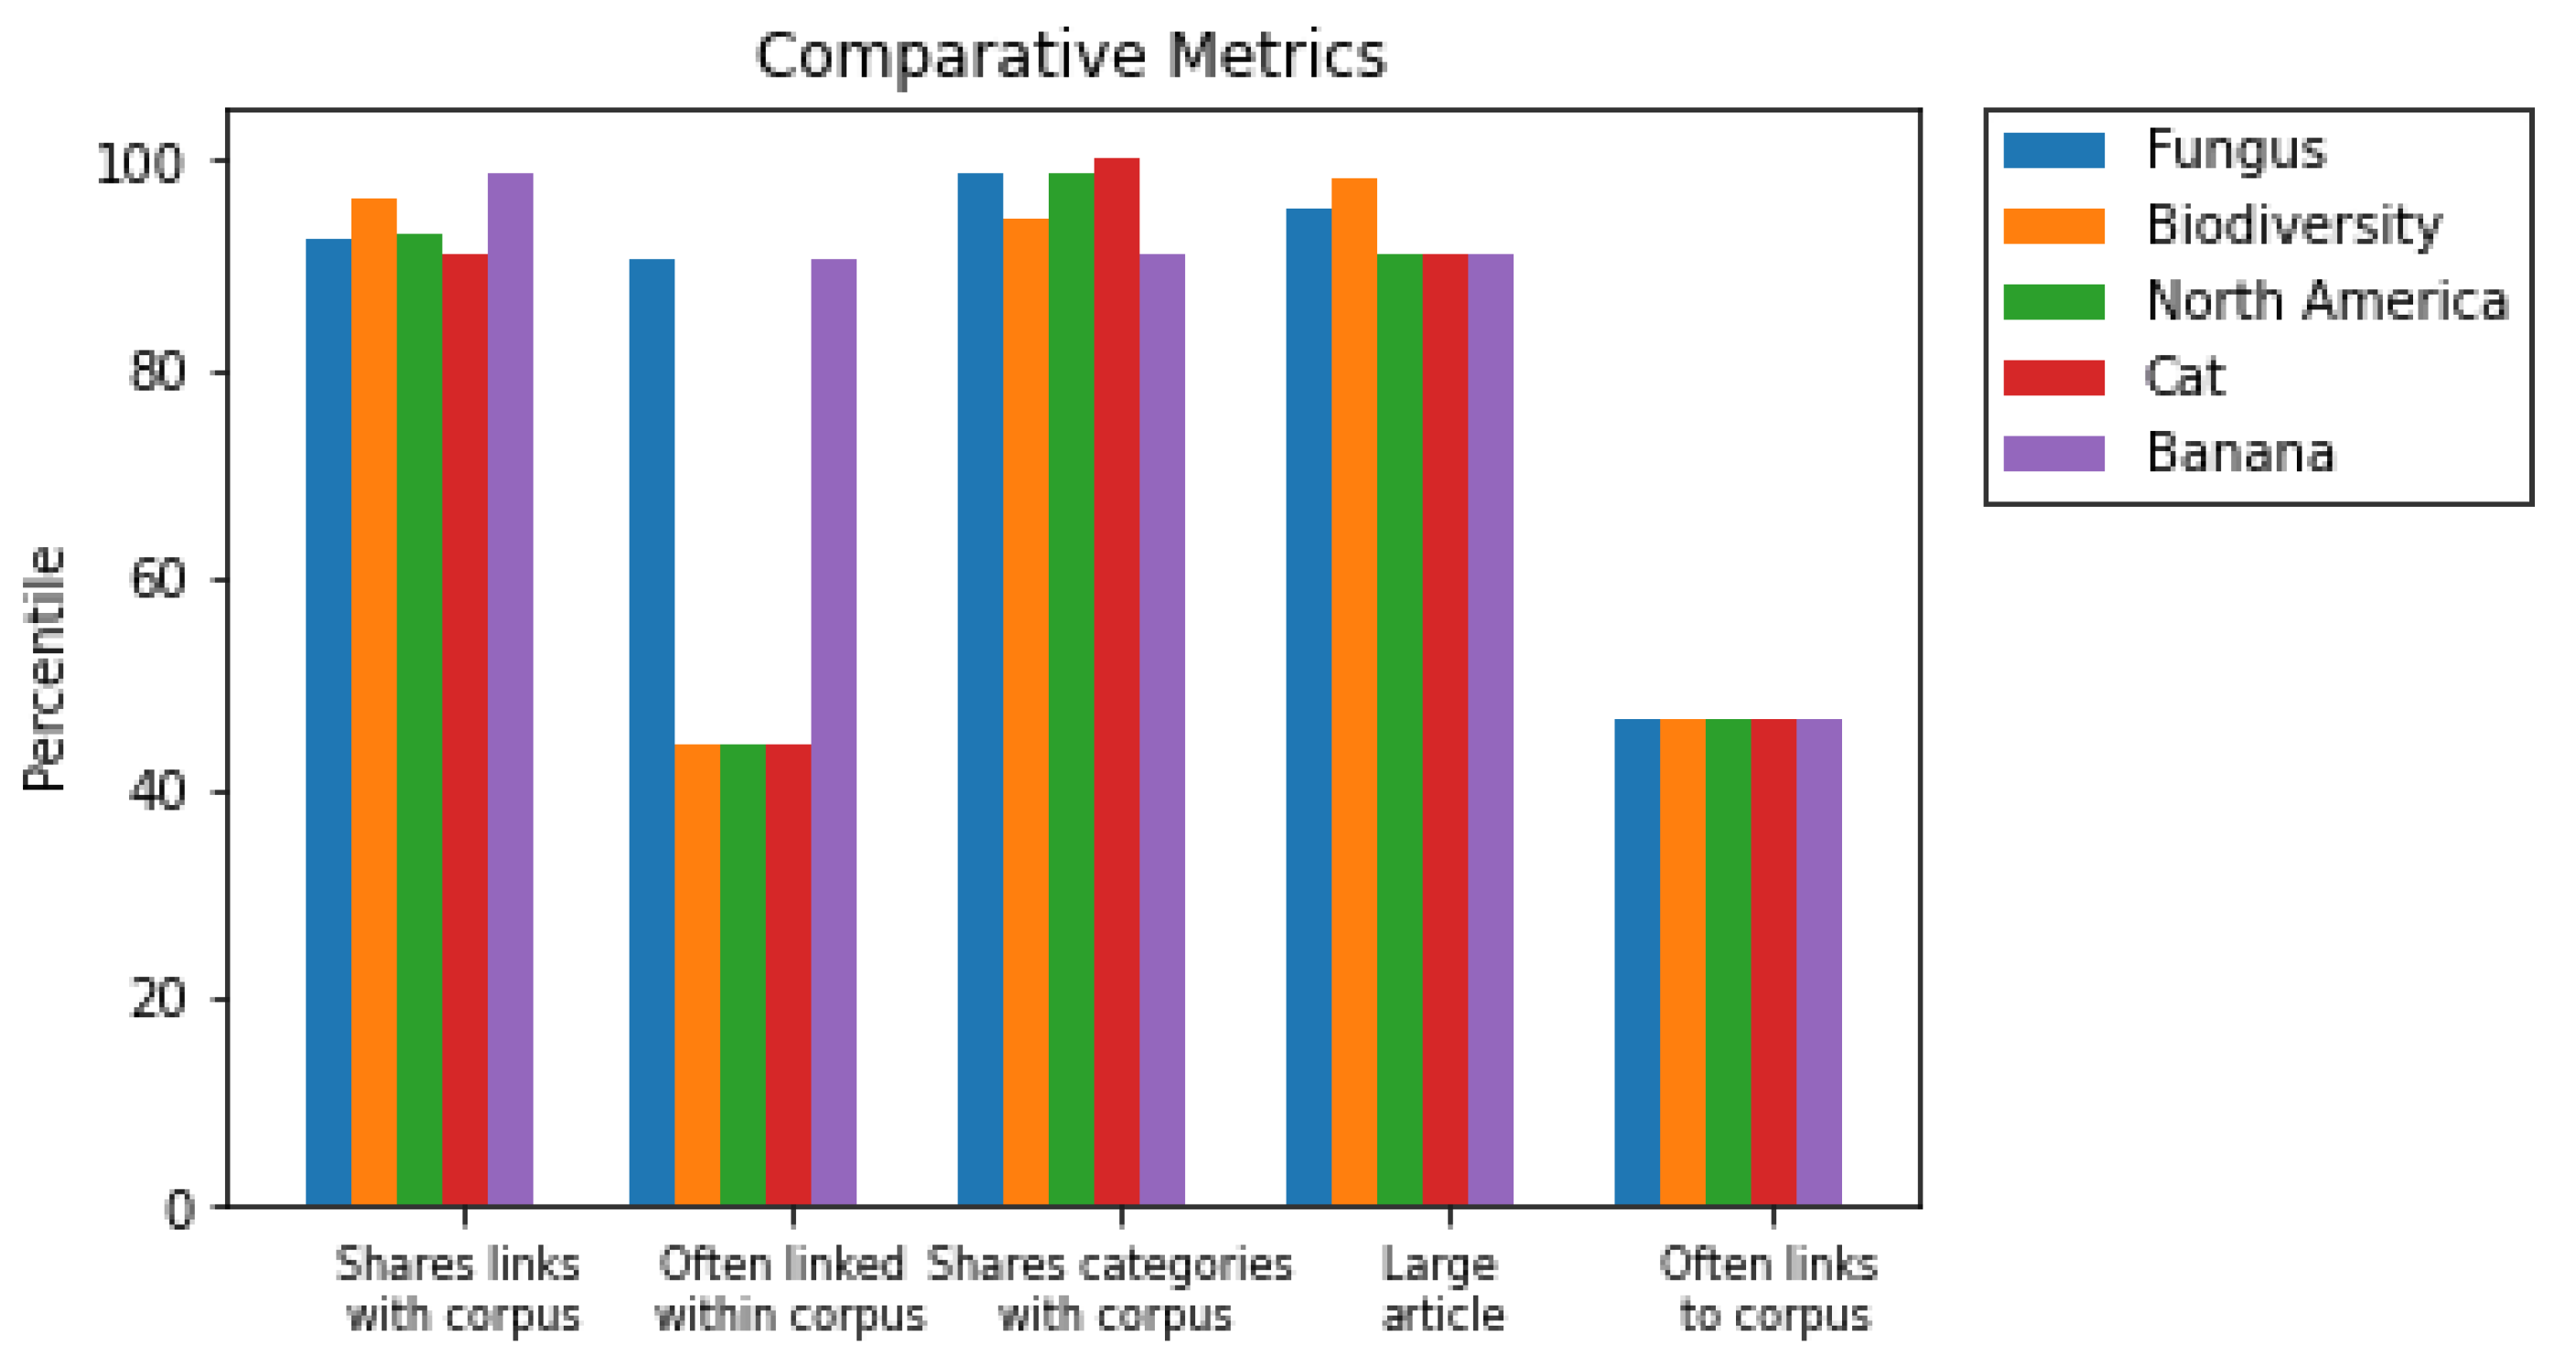
These a priori diagnoses, however, can be investigated further due to the inherently explainable nature of the metric ensemble model. We can plot these potentially problematic recommendations against one of the recommendations that we (as the stand-in for a fruit “subject matter expert”) deem as particularly desirable: banana, for instance. Such a plot is depicted in Figure 2.
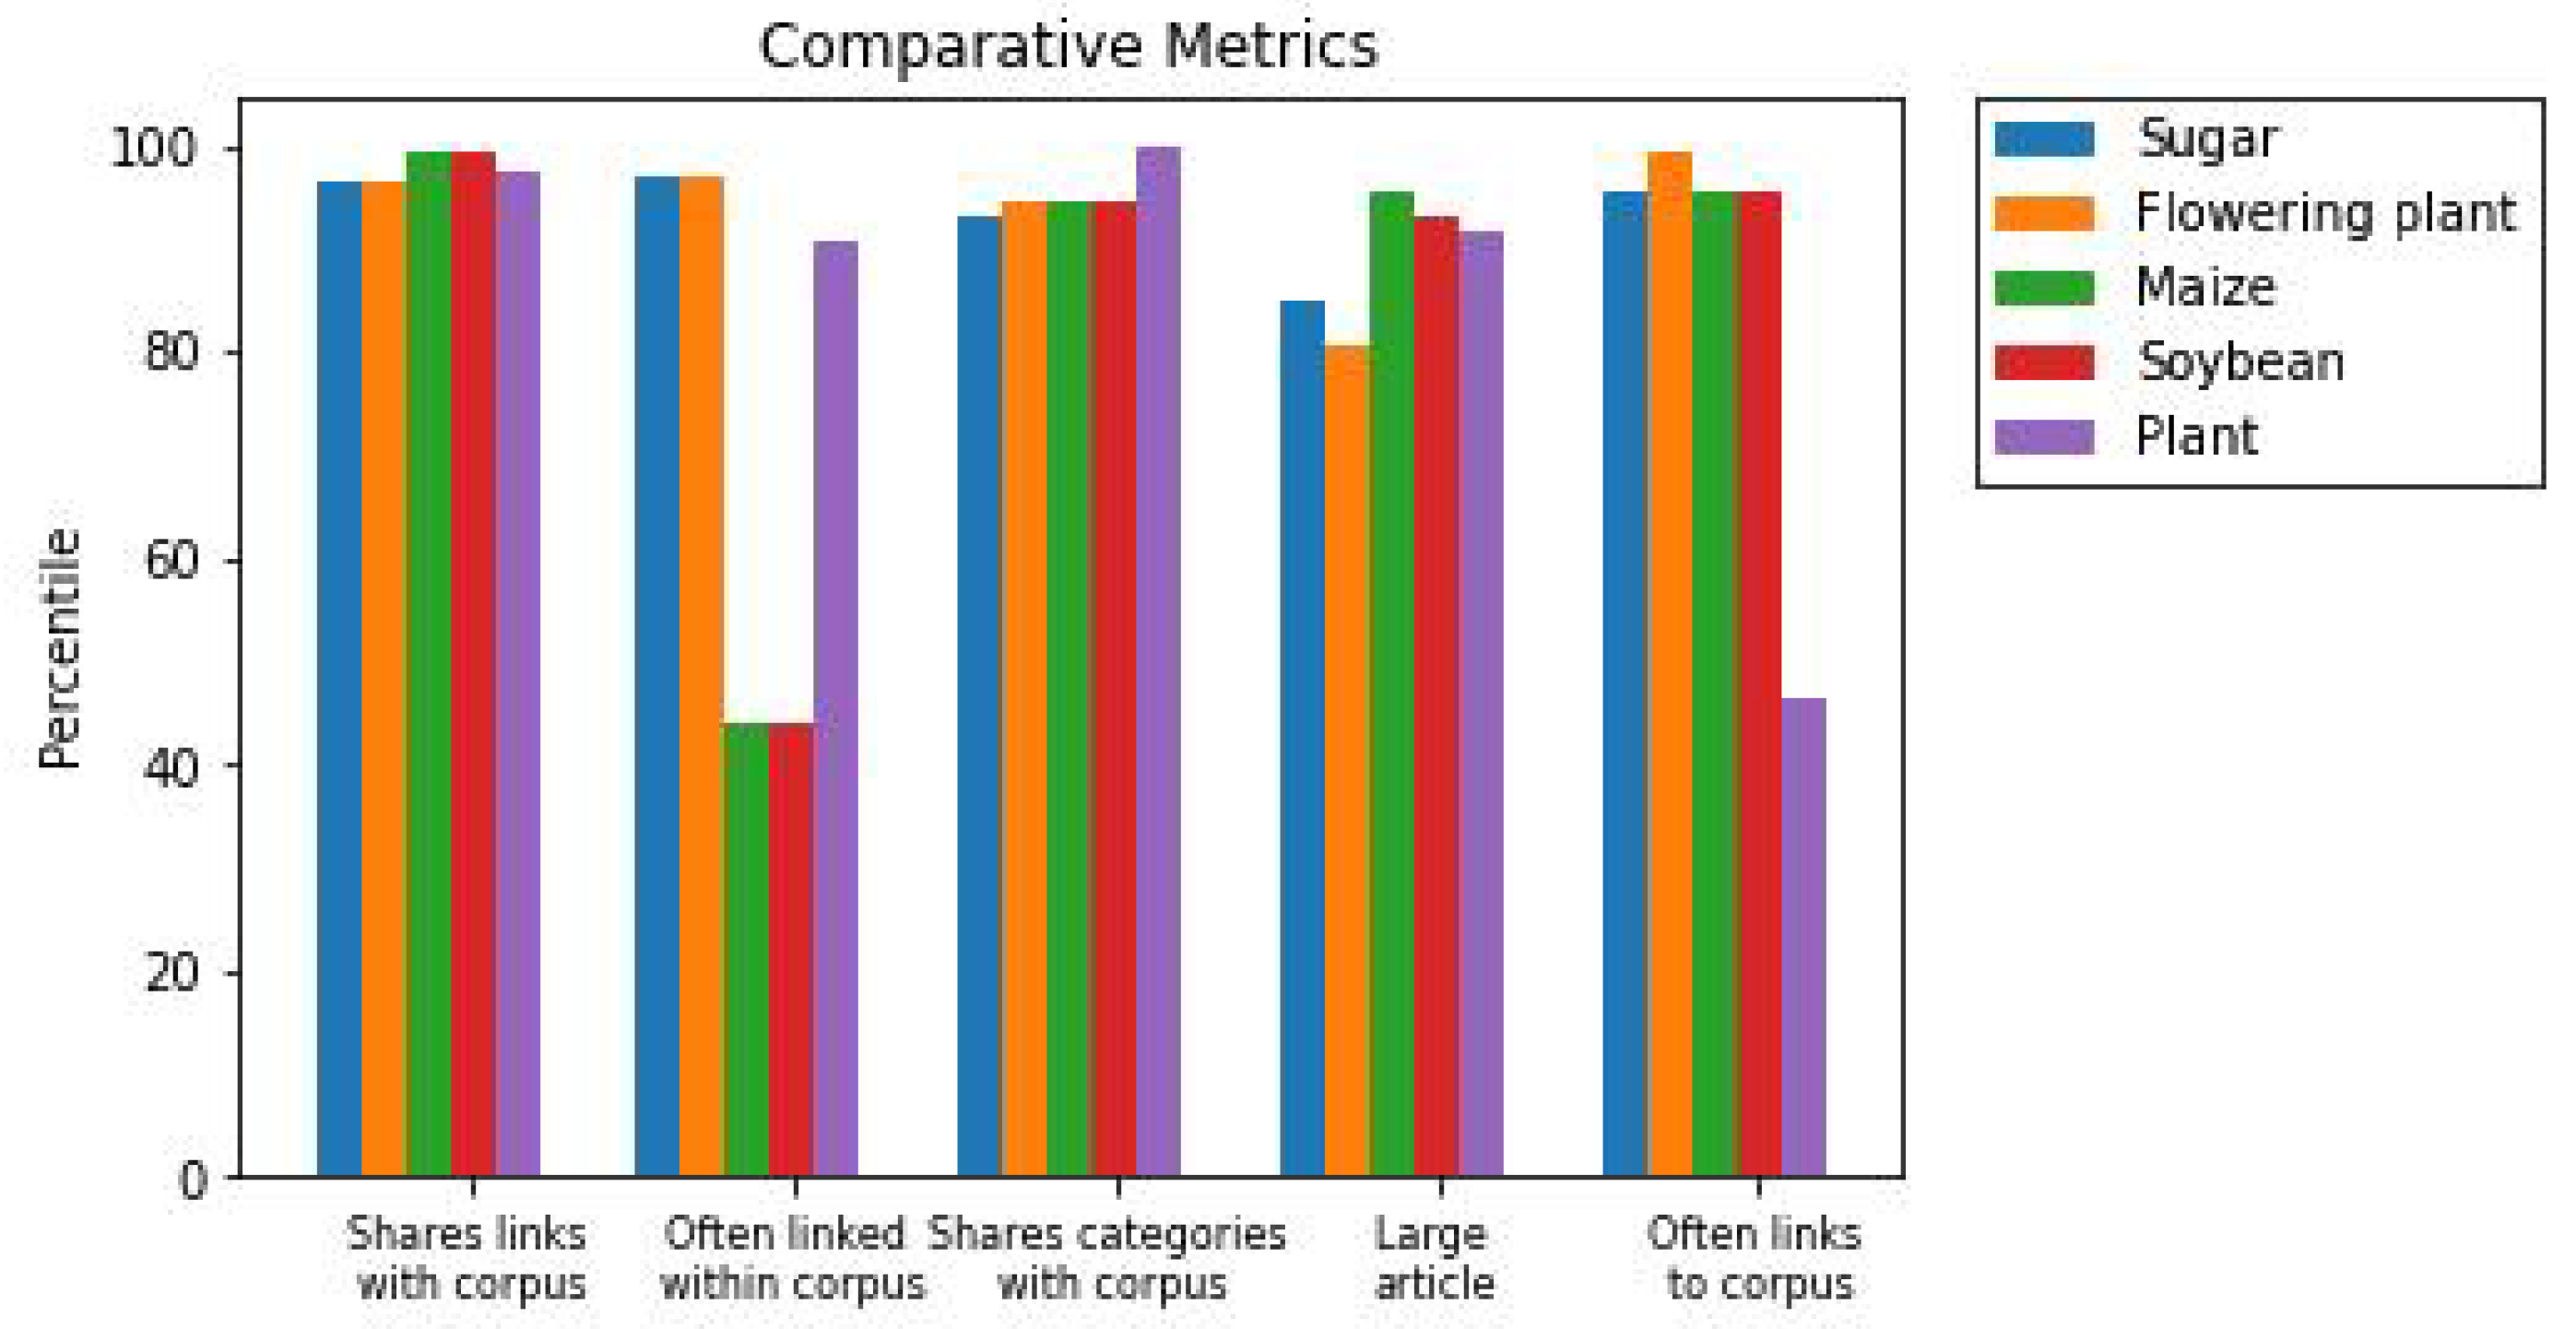
Here, we see that “Banana” ranks above all of the suspect recommendations in the “Shares links” metric, but below all of them in the remaining two metrics we used for the ranking. We also see that it performs either average or better than average in the two metrics that we dropped from consideration: an indication that, perhaps, we dropped these metrics prematurely. We can, then, iterate the weights by which we generate recommendations another time: say, set the weight for “Shares links” at 2, the weights for “Links to corpus” and “Linked from corpus” to 0.5, and the others to 1. This incorporates our insight gained from the previous two iterations, and thus hopefully approximates some iterative process that leverages the inherent explainability of ensembles to incorporate domain expert feedback. A plot of the top 5 recommendations under this new rating is depicted in Figure 3, and a comparison of the top recommendations for each iteration is shown in Table 3.
Hopefully, it is apparent that the final iteration is more plausible than the other two: it is the only iteration, for instance, in which the page for “Banana” ranks above that for “Fungus”.
3.2. Further Extensions and Discussion
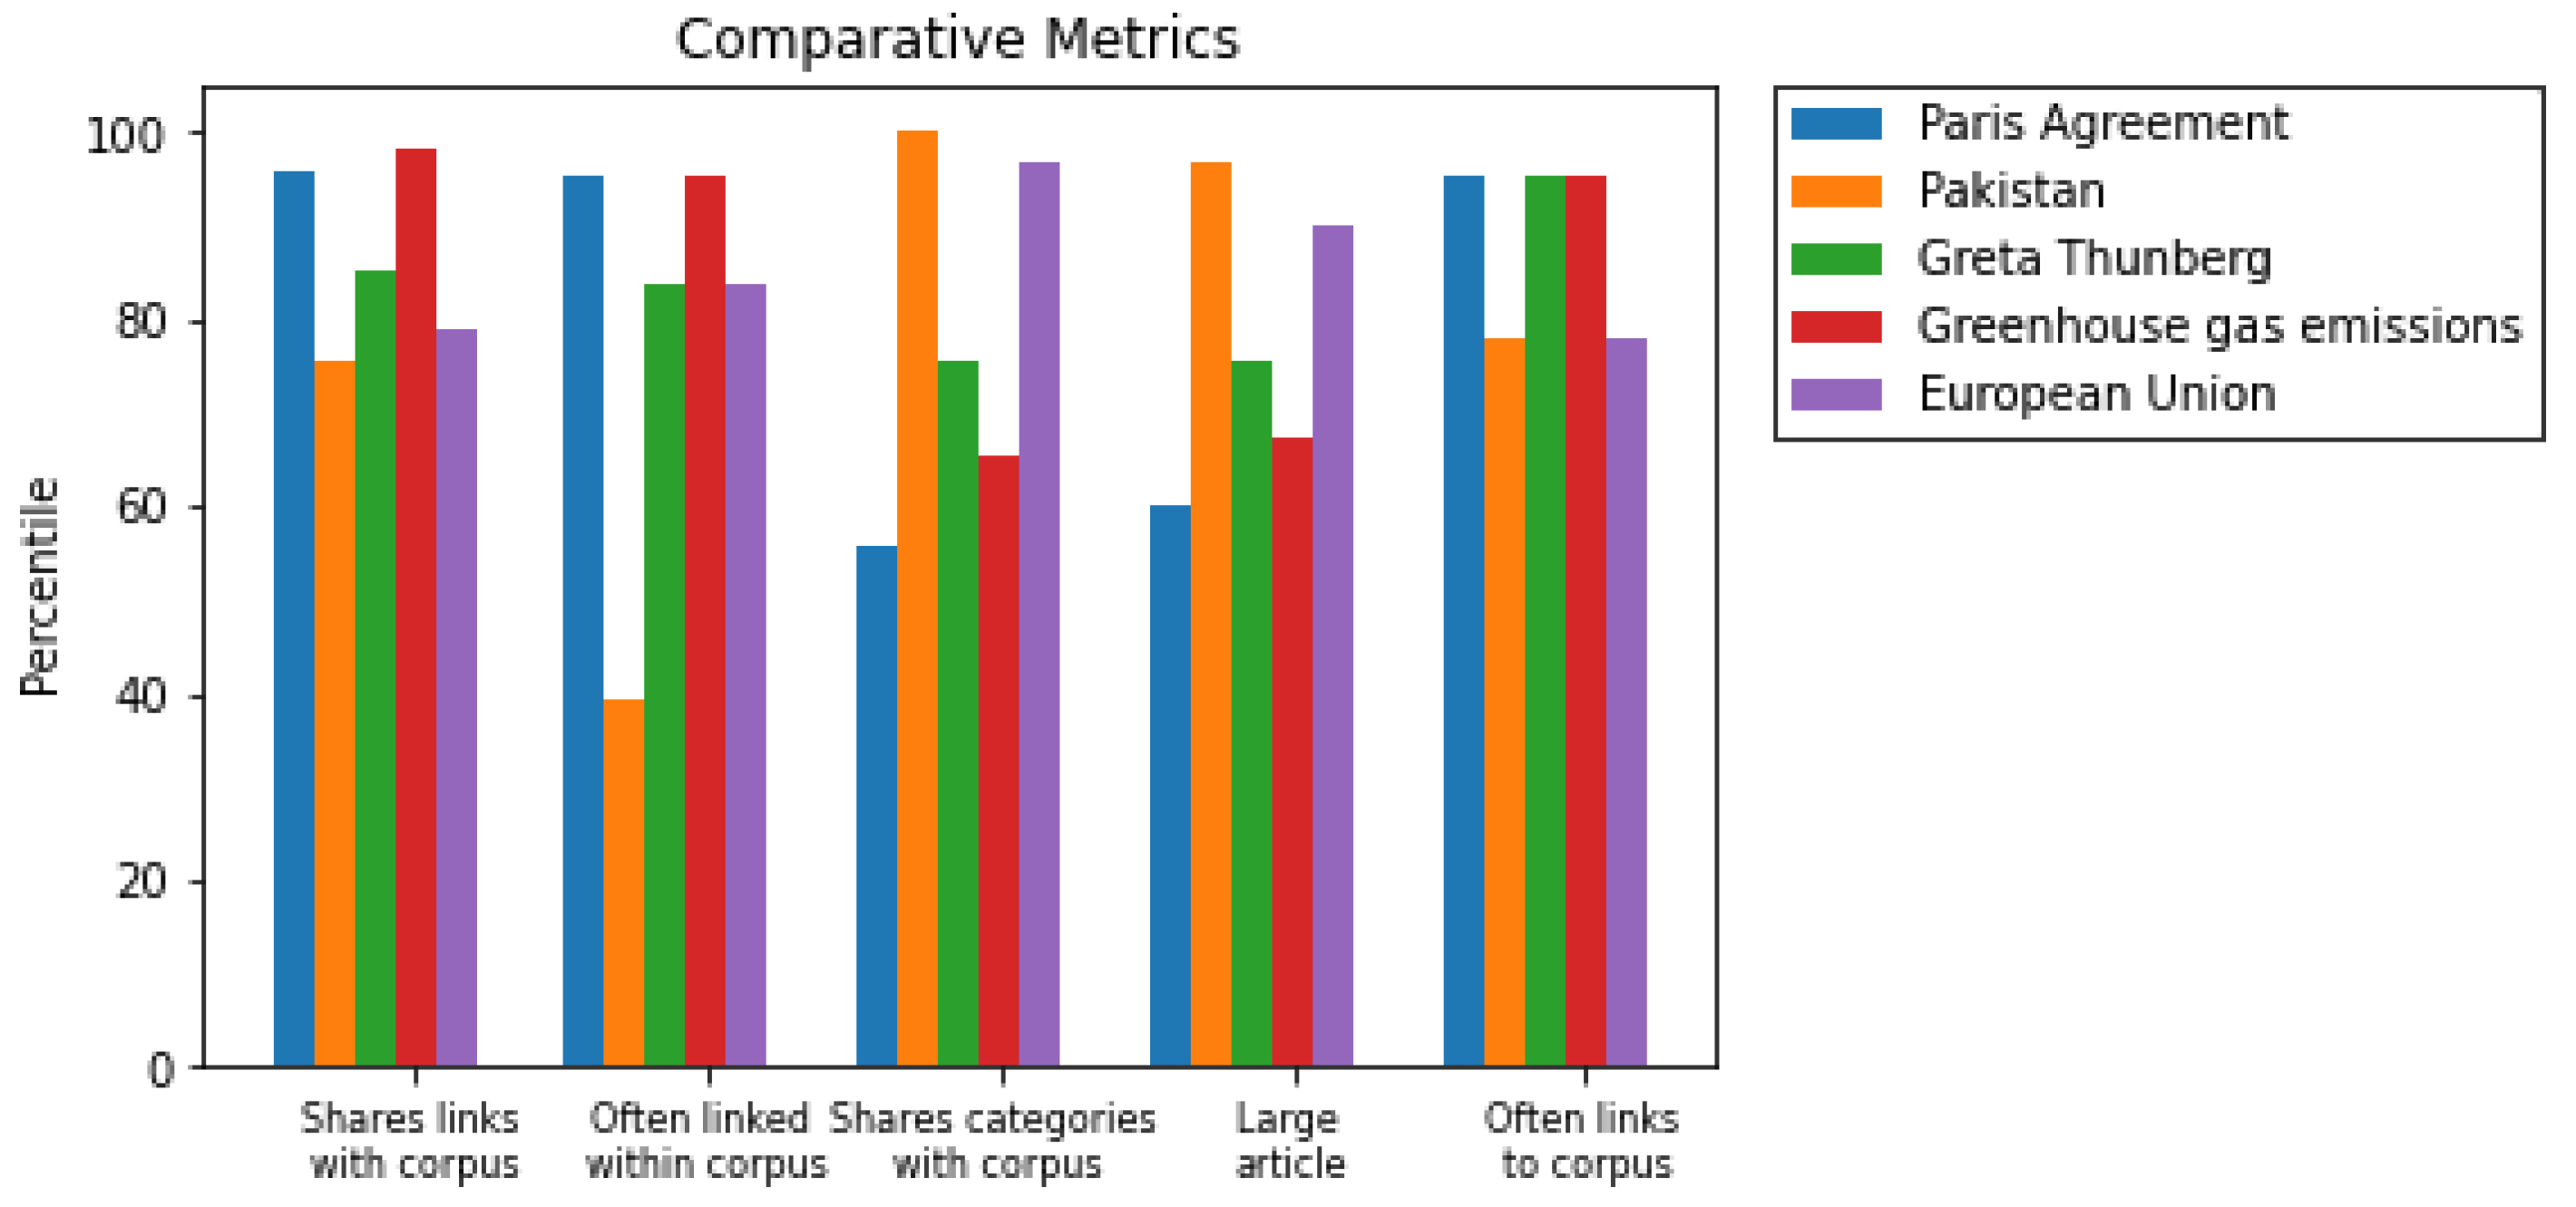
It is a fair question, of course, whether this demo can plausibly map onto a more realistic scenario, seeing as most intelligence analysts are working with a vastly different domain of data than Wikipedia pages on fruit. In order to test a perhaps more realistic example, we assembled a new corpus, consisting of the pages for “climate change”, “fossil fuel”, and “solar panel”. For the candidate pages to be recommended, we took every page linked to the page for the 2019 UN Climate Action Summit. The top 10 recommendations from this process are depicted in Table 4, and a metric-based explainability chart for the top recommendations are in Figure 4.
These recommendations seem roughly reasonable, particularly considering the simplicity and individual noisiness of each of the ensembled metrics. The comparative chart seems to suggest that “Pakistan” and “European Union”—two of the recommendations that are arguably not as relevant—are both particularly high in the “Large Article” and “Shares Categories” metrics. This suggests that perhaps a domain expert in this area could use a similar explainability chart to adjust the recommendation ratings accordingly. Brown et. al. [31], for instance, demonstrated that leveling human expert domain knowledge through a simple interface can, in just a few iterations, successfully distinguish between important metrics and those that are irrelevant. Or perhaps this knowledge could simply be incorporated to give the user an intuitive understanding of the source of the feedback, with different icons associated with heaviness toward a particular metric beside a recommendation, and this intuitive “weights adjusting” could go on flexibly inside the user’s head, as they learn which icons tend to be relevant in which scenarios, rather than as part of some explicit human-in-the-loop system. There is a myriad of ways to incorporate the explainability of this model: this demonstration is simply meant to illustrate its potential, and the specifics of how to best incorporate such a thing are left to future work.
One plausible objection to this toy demo might be that the candidate lists, in both of the examples given, have been taken from the links of pages that we would a priori already expect to be somewhat related to the corpus: bananas are relatively related to apples and oranges after all, etc. Might this pre-selection be responsible for a large part of the effectiveness of the technique, effectively lending the metric ensemble an illusion of effectiveness simply by being fed a list of candidates that are already quite plausible? To test this, we can generate a candidate list from a page that is, on its face, wholly unrelated to the corpus, and run this through the model. We ran the links from the page for banana through the model with the climate change-related corpus in order to test this: if it gave significantly worse performances than the other tests we have run thus far, then that would be an indication that we were failing to account for the extent to which our pre-selection of candidate pages was giving the model a boost in terms of making plausible recommendations. The top ten candidate pages from this are shown in Table 5.
This table shows that indeed, this model seems to function plausibly well even with a non-ideal list of candidate pages, and a handful of noisy metrics. Such results indicate the strong potential of ensemble metric methods for both the effectiveness and explainability, of a large-scale text-based recommender system.
Another point of note, and possible objection to the efficacy of this method at scale, is that the individual metrics chosen here are, by themselves, rather explainable. It could be argued that this inherent explainability is doing much of the heavy lifting and that if more complex, internally opaque metrics were instead used—say, a large neural model trained to predict click rate based on the title for some corpus of similar data (the MIND dataset for instance)—much of the explanatory value of this method would be lost, as such a model itself is not easily translated into a heuristic in the same way as, i.e., Shared Links.
We argue, however, that these complex models are themselves inevitably trained on comparatively simple metrics (click rate prediction, in this example). Because of this, when these models are deployed as part of a larger metric ensemble, their output can be used as a proxy for the simpler, more inherently explicable metric they were themselves trained on. The click rate predictor model, for example, could be explained to the end user as “Likelihood Users Similar To You Would Click This Title”. Obviously, the exact phrasing of this reduction of a complex model to its proxy would not be a trivial choice, and would inevitably depend on the expected knowledge level of the end user using the software. We imagine there to be a likely trade-off in these situations between the simplicity (and thus explanatory power) of the explanation linked with a more complex metric and its accuracy at encapsulating that same metric, but such a trade-off is something that can be explicitly managed depending on a given complex metric and use-case. Certainly, the exact best practices for navigating these issues are an important topic for future work.
4. Conclusions
Prior work has demonstrated that metric ensembles are a powerful tool for improving over single-metric models in terms of performance. We demonstrate that, in addition to these performance benefits, they are also a powerful tool to enhance the explainability and real-time adaptability of a model. While the demonstration given is obviously very limited in scope, we believe that it makes a succinct and compelling case for metric ensembles as a tool for explainability. In future work, it is essential to demonstrate this principle in a systematic way. Additional experiments on a large text corpus such as MIND [9] with both accuracy- and non-accuracy-based metrics would test the feasibility of applying this method at scale.
Author Contributions
Conceptualization, G.F.; methodology, G.F.; software, G.F.; writing—original draft preparation, G.F.; writing—reviewing and editing, G.F. and R.J.C.; visualization, G.F.; supervision, R.J.C. All authors have read and agreed to the published version of the manuscript.
Funding
This material is based upon work supported in whole or in part with funding from the Laboratory for Analytic Sciences (LAS). Any opinions, findings, conclusions, or recommendations expressed in this material are those of the author(s) and do not necessarily reflect the views of the LAS and/or any agency or entity of the United States Government.
Data Availability Statement
All materials required for replication of these experiments are available in this repository: https://github.ncsu.edu/gforbes/Metric-Ensembles (accessed on 20 February 2023).
Conflicts of Interest
One of the authors (R. Jordan Crouser) is guest editor of this special issue, and has recused himself from any adjudication of this work. The authors declare no further conflict of interest.
References
- Ribeiro, M.T.; Singh, S.; Guestrin, C. “Why Should I Trust You?”: Explaining the Predictions of Any Classifier. In Proceedings of the 22nd ACM SIGKDD International Conference on Knowledge Discovery and Data Mining, San Francisco, CA, USA, 13–17 August 2016; pp. 1135–1144. [Google Scholar]
- Thomas, R.L.; Uminsky, D. Reliance on metrics is a fundamental challenge for AI. Patterns 2022, 3, 100476. [Google Scholar] [CrossRef] [PubMed]
- Ribeiro, M.H.; Ottoni, R.; West, R.; Almeida, V.A.; Meira, W., Jr. Auditing radicalization pathways on YouTube. In Proceedings of the 2020 Conference on Fairness, Accountability, and Transparency, Barcelona, Spain, 27–30 January 2020; pp. 131–141. [Google Scholar]
- Hasan, M.R.; Jha, A.K.; Liu, Y. Excessive use of online video streaming services: Impact of recommender system use, psychological factors, and motives. Comput. Hum. Behav. 2018, 80, 220–228. [Google Scholar] [CrossRef]
- Seaver, N. Captivating algorithms: Recommender systems as traps. J. Mater. Cult. 2019, 24, 421–436. [Google Scholar] [CrossRef]
- Tversky, A.; Kahneman, D. The framing of decisions and the psychology of choice. In Behavioral Decision Making; Springer: Berlin/Heidelberg, Germany, 1985; pp. 25–41. [Google Scholar]
- Goodhart, C.A. Problems of monetary management: The UK experience. In Monetary Theory and Practice; Springer: Berlin/Heidelberg, Germany, 1984; pp. 91–121. [Google Scholar]
- Strathern, M. ‘Improving ratings’: Audit in the British University system. Eur. Rev. 1997, 5, 305–321. [Google Scholar] [CrossRef]
- Wu, F.; Qiao, Y.; Chen, J.H.; Wu, C.; Qi, T.; Lian, J.; Liu, D.; Xie, X.; Gao, J.; Wu, W.; et al. MIND: A Large-scale Dataset for News Recommendation. In Proceedings of the ACL 2020, Online, 6–8 July 2020. [Google Scholar]
- Manheim, D.; Garrabrant, S. Categorizing variants of Goodhart’s Law. arXiv 2018, arXiv:1803.04585. [Google Scholar]
- Zhuang, S.; Hadfield-Menell, D. Consequences of misaligned AI. Adv. Neural Inf. Process. Syst. 2020, 33, 15763–15773. [Google Scholar]
- Milli, S.; Belli, L.; Hardt, M. From optimizing engagement to measuring value. In Proceedings of the 2021 ACM Conference on Fairness, Accountability, and Transparency, Virtual, 3–10 March 2021; pp. 714–722. [Google Scholar]
- Dawes, R.M. The robust beauty of improper linear models in decision making. Am. Psychol. 1979, 34, 571. [Google Scholar] [CrossRef]
- Buczak, A.L.; Grooters, B.; Kogut, P.; Manavoglu, E.; Giles, C.L. Recommender Systems for Intelligence Analysts. In Proceedings of the AAAI Spring Symposium: AI Technologies for Homeland Security, Stanford, CA, USA, 21–23 March 2005; pp. 25–31. [Google Scholar]
- Likierman, A. The five traps of performance measurement. Harv. Bus. Rev. 2009, 87, 96–101. [Google Scholar] [PubMed]
- Perrone, M.P.; Cooper, L.N. When Networks Disagree: Ensemble Methods for Hybrid Neural Networks; Technical Report; Brown Univ Providence Ri Inst for Brain and Neural Systems: Providence, RI, USA, 1992. [Google Scholar]
- Krogh, A.; Vedelsby, J. Neural network ensembles, cross validation, and active learning. Adv. Neural Inf. Process. Syst. 1994, 7, 231–238. [Google Scholar]
- Christiano, P.F.; Leike, J.; Brown, T.; Martic, M.; Legg, S.; Amodei, D. Deep reinforcement learning from human preferences. Adv. Neural Inf. Process. Syst. 2017, 30, 4299–4307. [Google Scholar]
- Shahhosseini, M.; Hu, G.; Pham, H. Optimizing ensemble weights and hyperparameters of machine learning models for regression problems. Mach. Learn. Appl. 2022, 7, 100251. [Google Scholar] [CrossRef]
- Shen, Z.Q.; Kong, F.S. Dynamically weighted ensemble neural networks for regression problems. In Proceedings of the 2004 International Conference on Machine Learning and Cybernetics (IEEE Cat. No. 04EX826), Shanghai, China, 26–29 August 2004; IEEE: New York, NY, USA, 2004; Volume 6, pp. 3492–3496. [Google Scholar]
- Platanios, E.A.; Blum, A.; Mitchell, T.M. Estimating Accuracy from Unlabeled Data. In Proceedings of the UAI, Quebec City, QC, Canada, 23–27 July 2014; Volume 14, p. 10. [Google Scholar]
- Platanios, E.A.; Dubey, A.; Mitchell, T. Estimating accuracy from unlabeled data: A bayesian approach. In Proceedings of the International Conference on Machine Learning, PMLR, New York, NY, USA, 20–22 June 2016; pp. 1416–1425. [Google Scholar]
- Platanios, E.; Poon, H.; Mitchell, T.M.; Horvitz, E.J. Estimating accuracy from unlabeled data: A probabilistic logic approach. Adv. Neural Inf. Process. Syst. 2017, 30, 4361–4370. [Google Scholar]
- Ratner, A.; Bach, S.H.; Ehrenberg, H.; Fries, J.; Wu, S.; Ré, C. Snorkel: Rapid training data creation with weak supervision. In Proceedings of the VLDB Endowment. International Conference on Very Large Data Bases, Rio de Janeiro, Brazil, 27–31 August 2018; NIH Public Access: Bethesda, ML, USA, 2017; Volume 11, p. 269. [Google Scholar]
- Bach, S.H.; He, B.; Ratner, A.; Ré, C. Learning the structure of generative models without labeled data. In Proceedings of the International Conference on Machine Learning, PMLR, New York, NY, USA, 20–22 June 2017; pp. 273–282. [Google Scholar]
- Bekker, J.; Davis, J. Learning from positive and unlabeled data: A survey. Mach. Learn. 2020, 109, 719–760. [Google Scholar] [CrossRef] [Green Version]
- Raza, S.; Ding, C. News recommender system: A review of recent progress, challenges, and opportunities. Artif. Intell. Rev. 2022, 55, 749–800. [Google Scholar] [CrossRef] [PubMed]
- Kunaver, M.; Požrl, T. Diversity in recommender systems—A survey. Knowl.-Based Syst. 2017, 123, 154–162. [Google Scholar] [CrossRef]
- Bai, Y.; Jones, A.; Ndousse, K.; Askell, A.; Chen, A.; DasSarma, N.; Drain, D.; Fort, S.; Ganguli, D.; Henighan, T.; et al. Training a Helpful and Harmless Assistant with Reinforcement Learning from Human Feedback. arXiv 2022, arXiv:2204.05862. [Google Scholar]
- Zhang, Y.; Chen, X. Explainable recommendation: A survey and new perspectives. In Foundations and Trends® in Information Retrieval; Now Publishers, Inc.: Delft, The Netherlands, 2020; Volume 14, pp. 1–101. [Google Scholar]
- Brown, E.T.; Liu, J.; Brodley, C.E.; Chang, R. Dis-function: Learning distance functions interactively. In Proceedings of the 2012 IEEE Conference on Visual Analytics Science and Technology (VAST), Seattle, WA, USA, 14–19 October 2012; IEEE: New York, NY, USA, 2012; pp. 83–92. [Google Scholar]
Figure 1.
The (top) and (bottom) recommendations compared with each other along each metric used.

Figure 2.
Four “problematic” recommendations (according to a subject matter expert) contrasted with a recommendation deemed particularly good.
Figure 2.
Four “problematic” recommendations (according to a subject matter expert) contrasted with a recommendation deemed particularly good.

Figure 3.
Metric-based explanations for the final top 5 recommendations after iterative weight adjustment.
Figure 3.
Metric-based explanations for the final top 5 recommendations after iterative weight adjustment.

Figure 4.
Metric-based explanations for the climate corpus from the UN Summit page.


Table 1.
Top ten “best” and “worst” recommendations for the corpus [apples, oranges] from the links on the bananas page according to the initial model, with even weights for each metric.
Table 1.
Top ten “best” and “worst” recommendations for the corpus [apples, oranges] from the links on the bananas page according to the initial model, with even weights for each metric.
| Rank | Highest Scoring | Lowest Scoring |
|---|---|---|
| 1 | Sugar | Flying Jacob |
| 2 | Flowering Plant | Banana Research Station, Kannara |
| 3 | Dietary Fiber | Mother Nature Network |
| 4 | Carbohydrate | Chapo (beverage) |
| 5 | Fruit | Hakam |
| 6 | Maize | World Banana Forum |
| 7 | Soybean | Cayeye |
| 8 | Plant | Banana Custard |
| 9 | Fungus | Tacacho |
| 10 | Tomato | Bluggoe |
Table 2.
Top ten “best” recommendations for the corpus [apples, oranges] from the links on the bananas page using an even weighting of the metrics “Shared Links”, “Shared Categories”, and “Large Article”.
Table 2.
Top ten “best” recommendations for the corpus [apples, oranges] from the links on the bananas page using an even weighting of the metrics “Shared Links”, “Shared Categories”, and “Large Article”.
| Rank | Highest Scoring, 2nd Iteration |
|---|---|
| 1 | Coconut |
| 2 | Maize |
| 3 | Biodiversity |
| 4 | Plant |
| 5 | Soybean |
| 6 | Fungus |
| 7 | Tomato |
| 8 | North America |
| 9 | Cat |
| 10 | Banana |
Table 3.
Top ten “best” recommendations for the corpus [apples, oranges] from the links on the bananas page for each iteration of metric weights.
Table 3.
Top ten “best” recommendations for the corpus [apples, oranges] from the links on the bananas page for each iteration of metric weights.
| Rank | 1st Iteration | 2nd Iteration | Final Iteration |
|---|---|---|---|
| 1 | Sugar | Coconut | Sugar |
| 2 | Flowering Plant | Maize | Flowering Plant |
| 3 | Dietary Fiber | Biodiversity | Maize |
| 4 | Carbohydrate | Plant | Soybean |
| 5 | Fruit | Soybean | Plant |
| 6 | Maize | Fungus | Tomato |
| 7 | Soybean | Tomato | Dietary Fiber |
| 8 | Plant | North America | Banana |
| 9 | Fungus | Cat | Fungus |
| 10 | Tomato | Banana | Fruit |
Table 4.
Top ten “best” recommendations for the corpus [“climate change”, “solar panel”, “fossil fuel”] from the links on the page “2019 UN Climate Action Summit”, using the final iterative weighting from the fruit example.
Table 4.
Top ten “best” recommendations for the corpus [“climate change”, “solar panel”, “fossil fuel”] from the links on the page “2019 UN Climate Action Summit”, using the final iterative weighting from the fruit example.
| Rank | Page |
|---|---|
| 1 | European Union |
| 2 | Greenhouse Gas Emissions |
| 3 | Greta Thunberg |
| 4 | Pakistan |
| 5 | Paris Agreement |
| 6 | Carbon Neutrality |
| 7 | Hungary |
| 8 | France |
| 9 | United States |
| 10 | Russia |
Table 5.
Top ten “best” recommendations for the corpus [“climate change”, “solar panel”, “fossil fuel”] from the links on the page for “Bananas” using the final iterative weighting from the fruit example.
Table 5.
Top ten “best” recommendations for the corpus [“climate change”, “solar panel”, “fossil fuel”] from the links on the page for “Bananas” using the final iterative weighting from the fruit example.
| Rank | Page |
|---|---|
| 1 | Biodiversity |
| 2 | Plant |
| 3 | Developing Country |
| 4 | Drought |
| 5 | Eutrophication |
| 6 | Agriculture |
| 7 | North America |
| 8 | London |
| 9 | Photosynthesis |
| 10 | Water Purification |
Disclaimer/Publisher’s Note: The statements, opinions and data contained in all publications are solely those of the individual author(s) and contributor(s) and not of MDPI and/or the editor(s). MDPI and/or the editor(s) disclaim responsibility for any injury to people or property resulting from any ideas, methods, instructions or products referred to in the content. |
© 2023 by the authors. Licensee MDPI, Basel, Switzerland. This article is an open access article distributed under the terms and conditions of the Creative Commons Attribution (CC BY) license (https://creativecommons.org/licenses/by/4.0/).
Share and Cite
MDPI and ACS Style
Forbes, G.; Crouser, R.J. Metric Ensembles Aid in Explainability: A Case Study with Wikipedia Data. Analytics 2023, 2, 315-327. https://doi.org/10.3390/analytics2020017
AMA Style
Forbes G, Crouser RJ. Metric Ensembles Aid in Explainability: A Case Study with Wikipedia Data. Analytics. 2023; 2(2):315-327. https://doi.org/10.3390/analytics2020017
Chicago/Turabian StyleForbes, Grant, and R. Jordan Crouser. 2023. "Metric Ensembles Aid in Explainability: A Case Study with Wikipedia Data" Analytics 2, no. 2: 315-327. https://doi.org/10.3390/analytics2020017