

A Brief Survey of Methods for Analytics over RDF Knowledge Graphs


Abstract
:1. Introduction
2. Background and Related Surveys
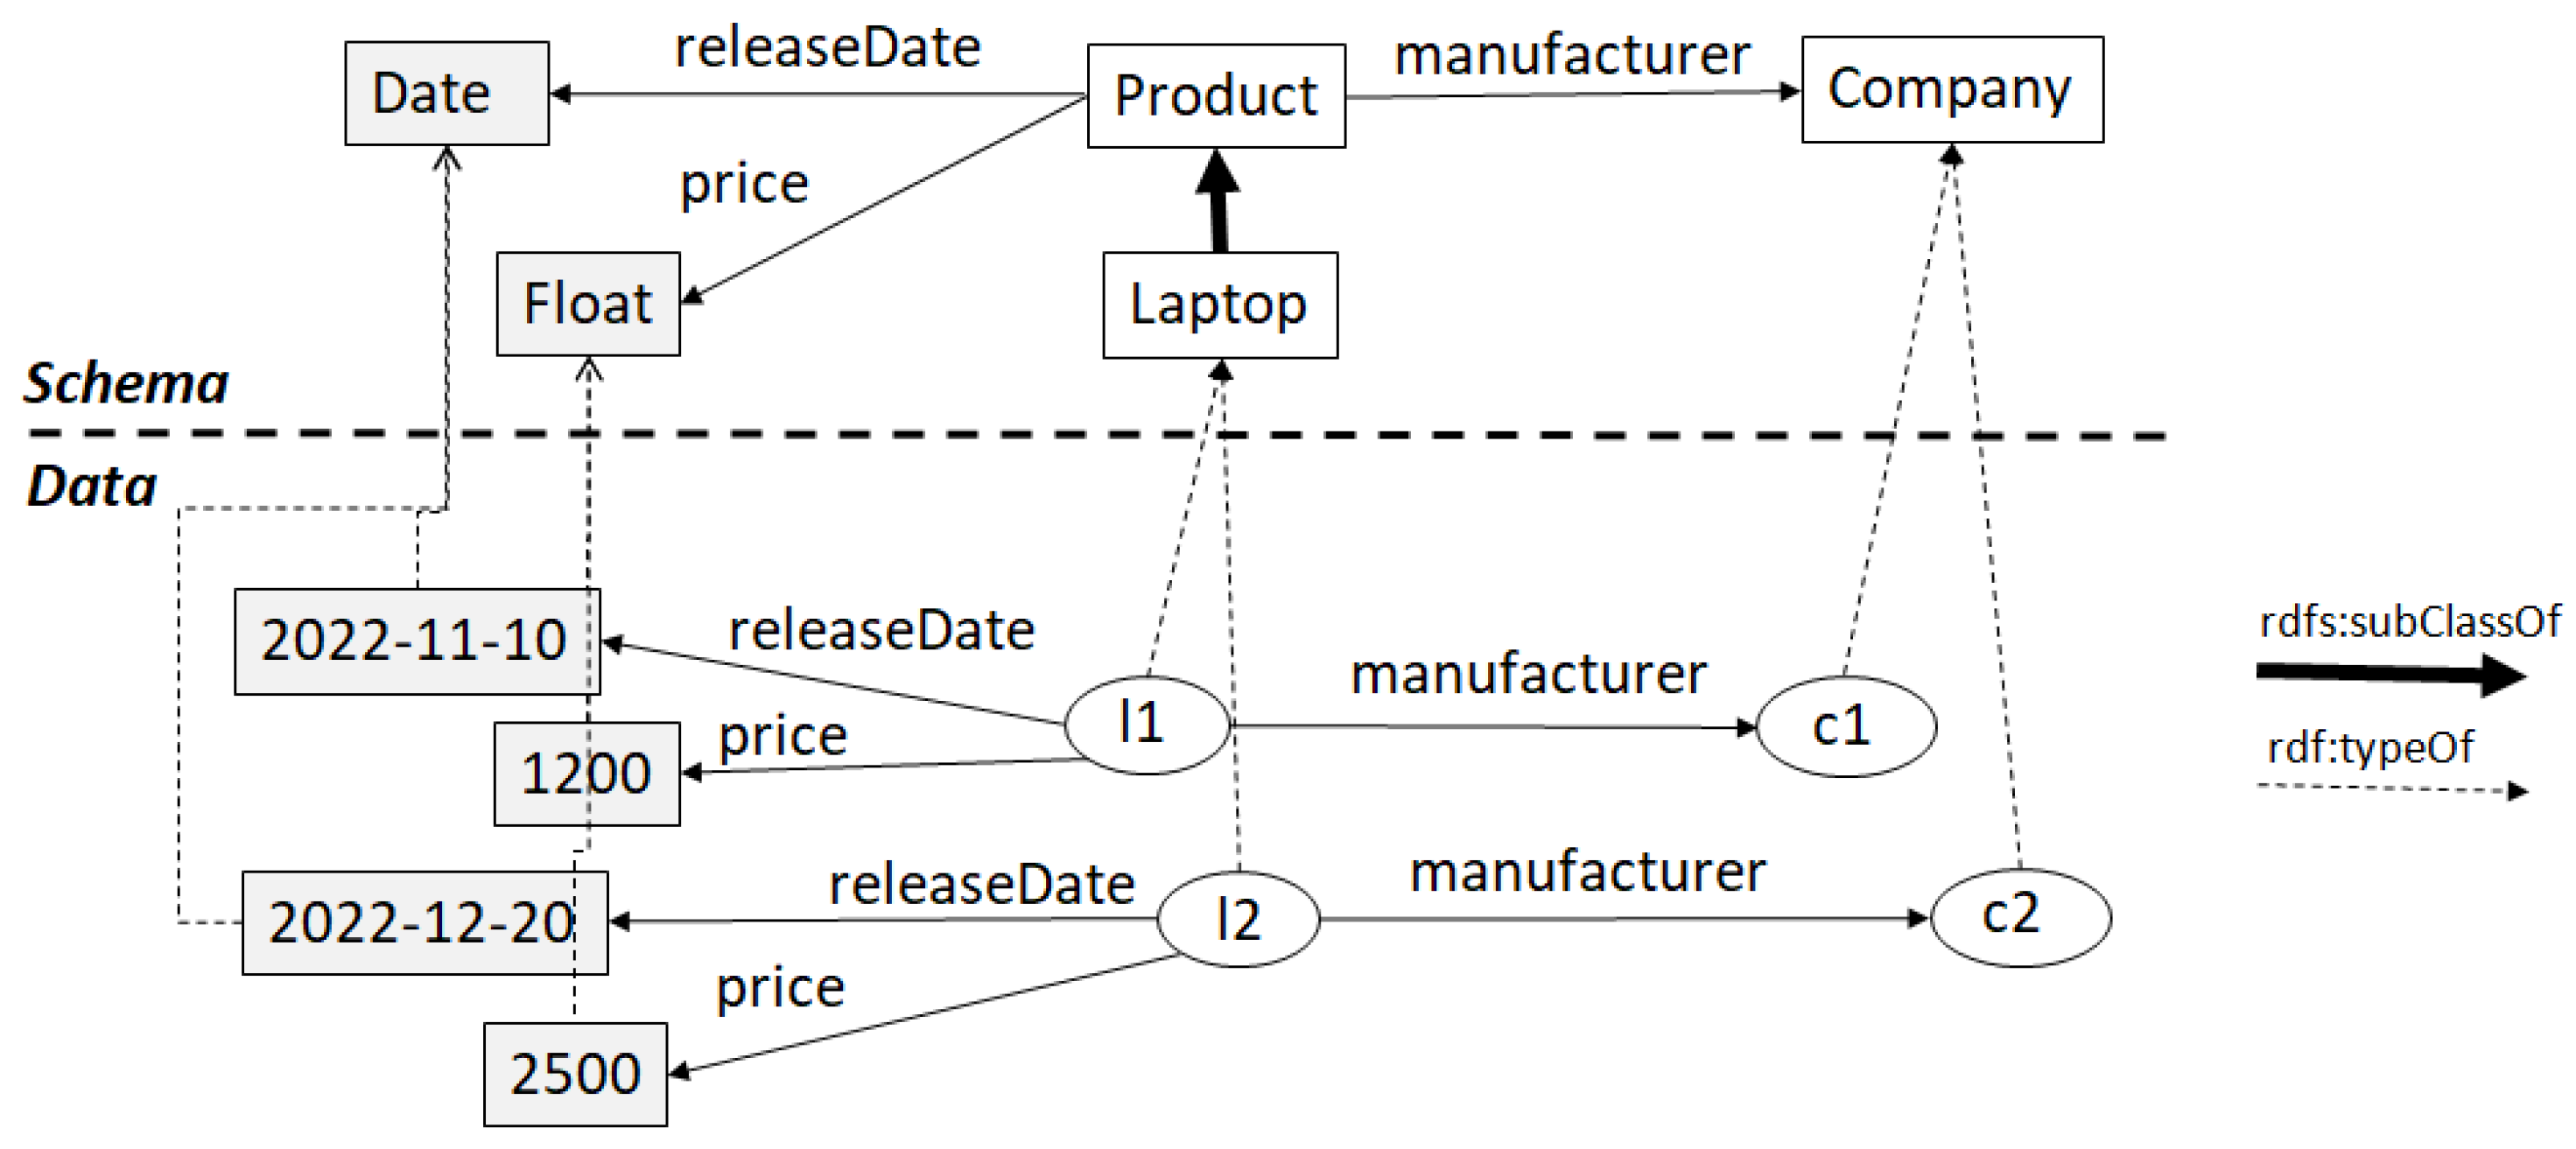
2.1. Resource Description Framework (RDF)
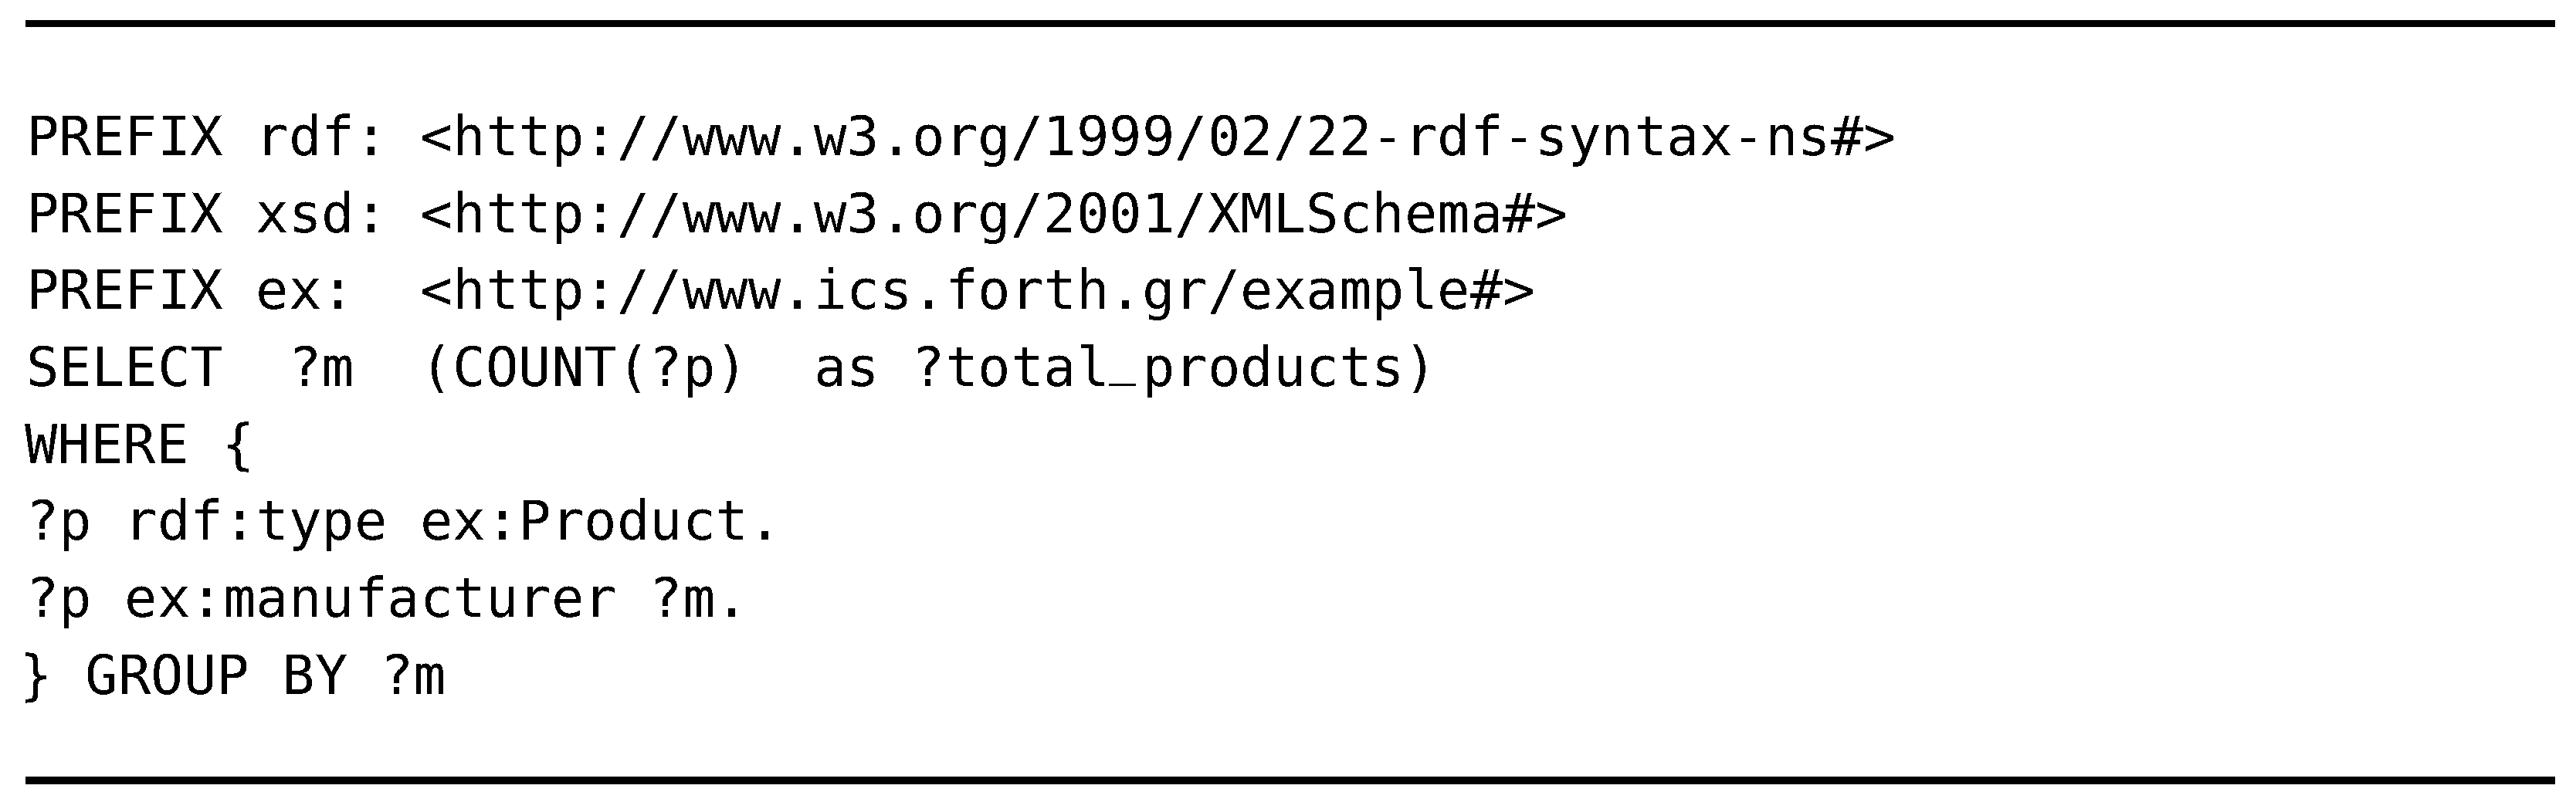
2.2. SPARQL
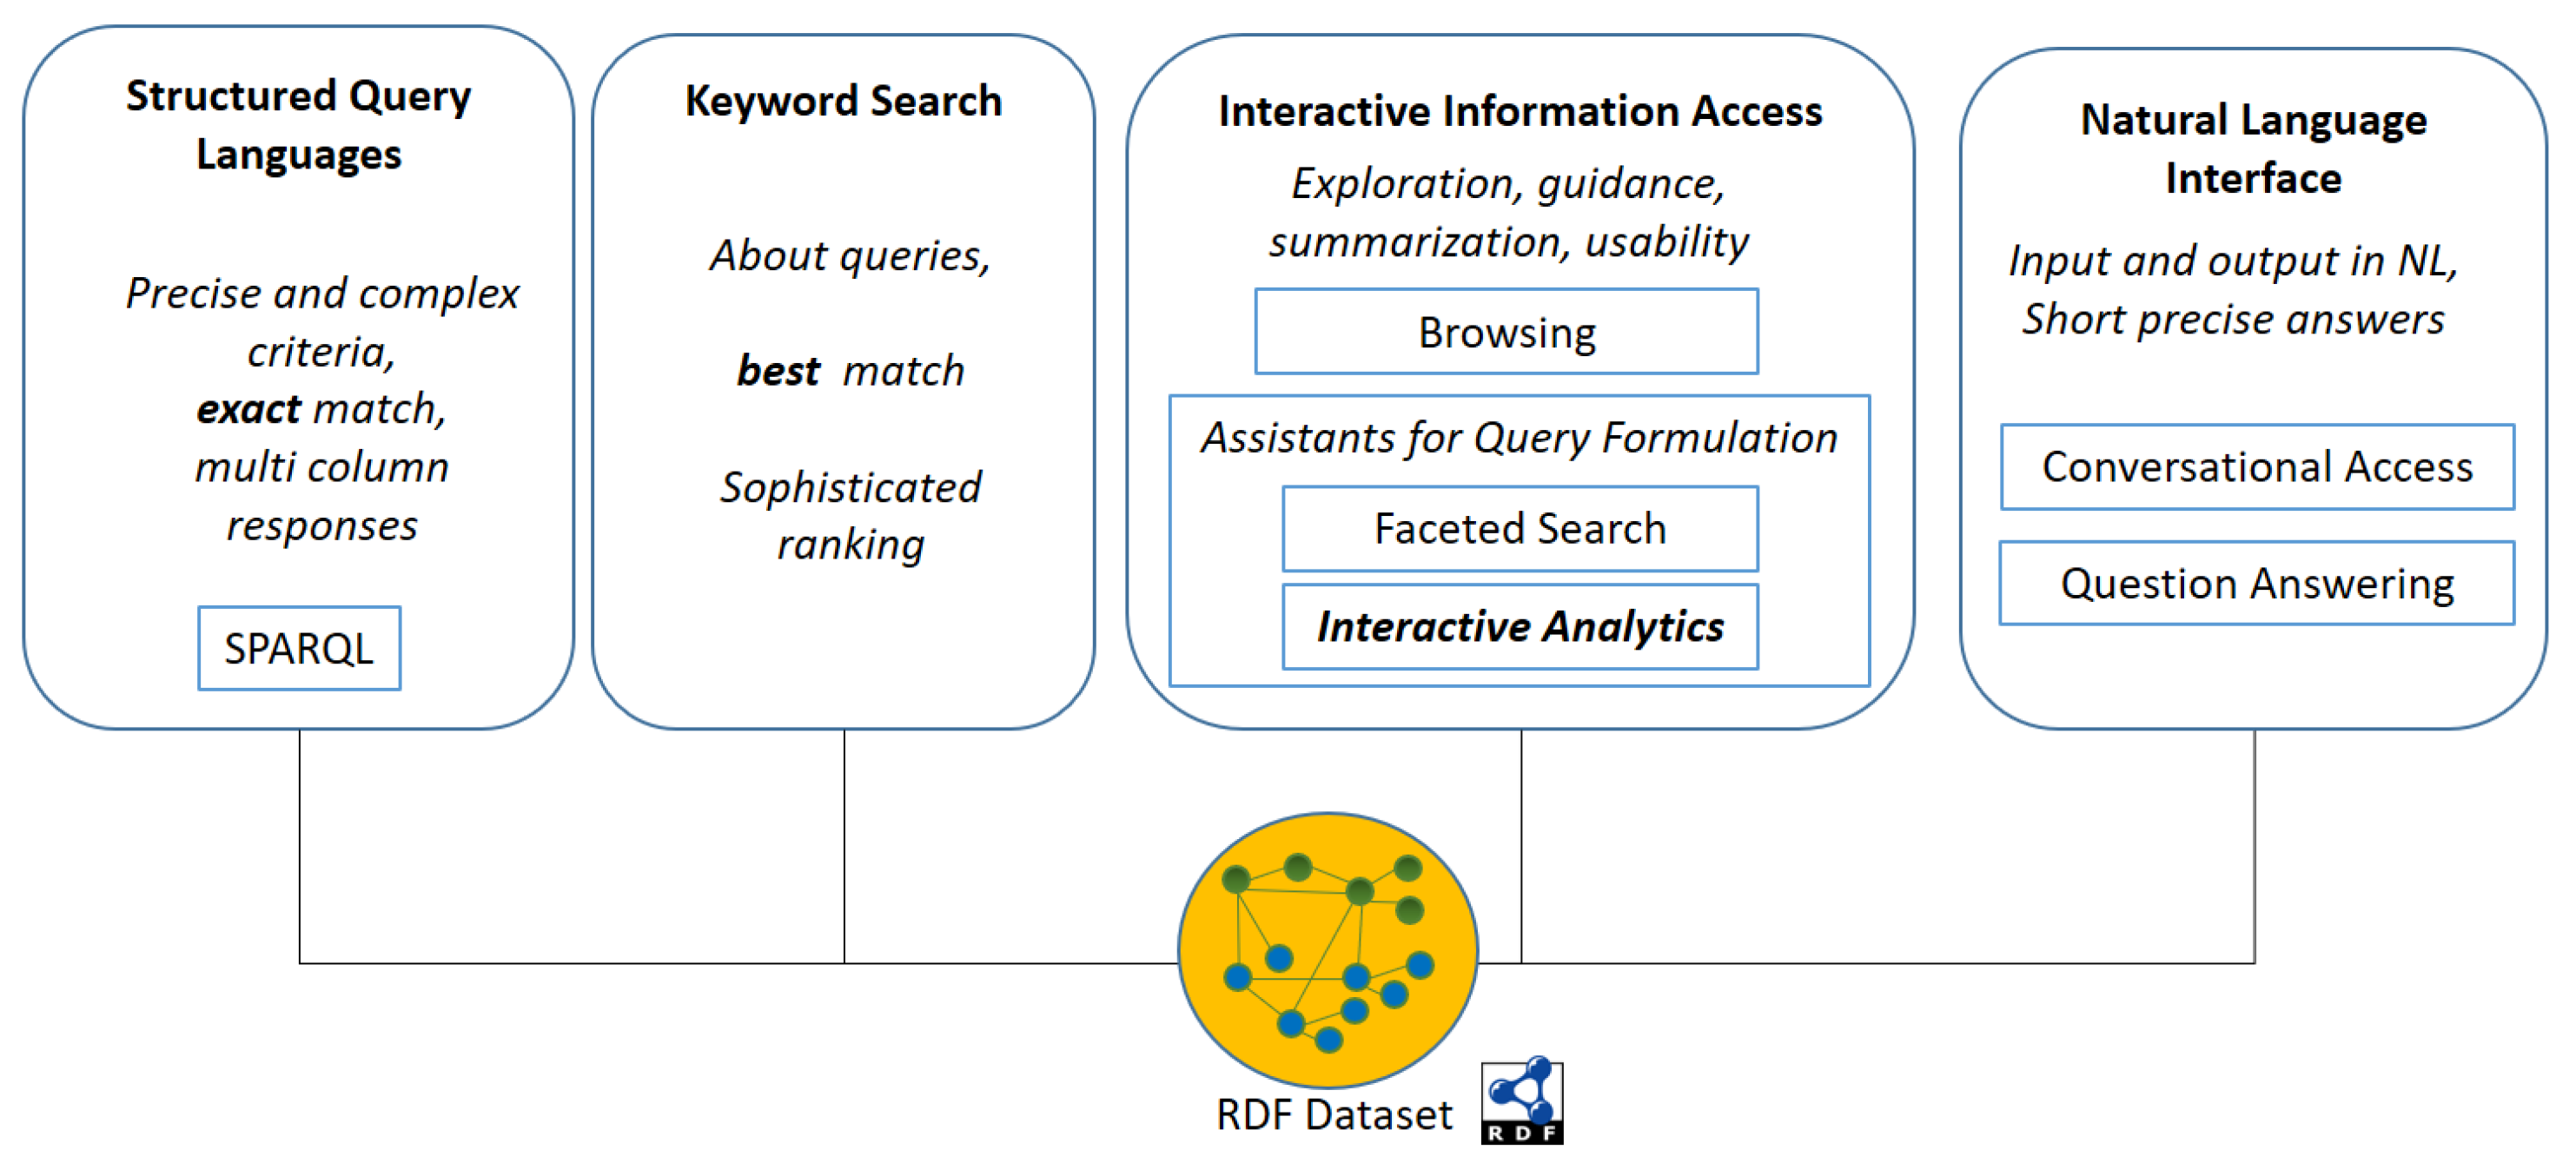
2.3. Access Methods over RDF
2.4. OLAP (OnLine Analytical Processing)
2.5. Related Work: Past Surveys
3. RDF and Analytics: Challenges and General Approaches
3.1. Challenges
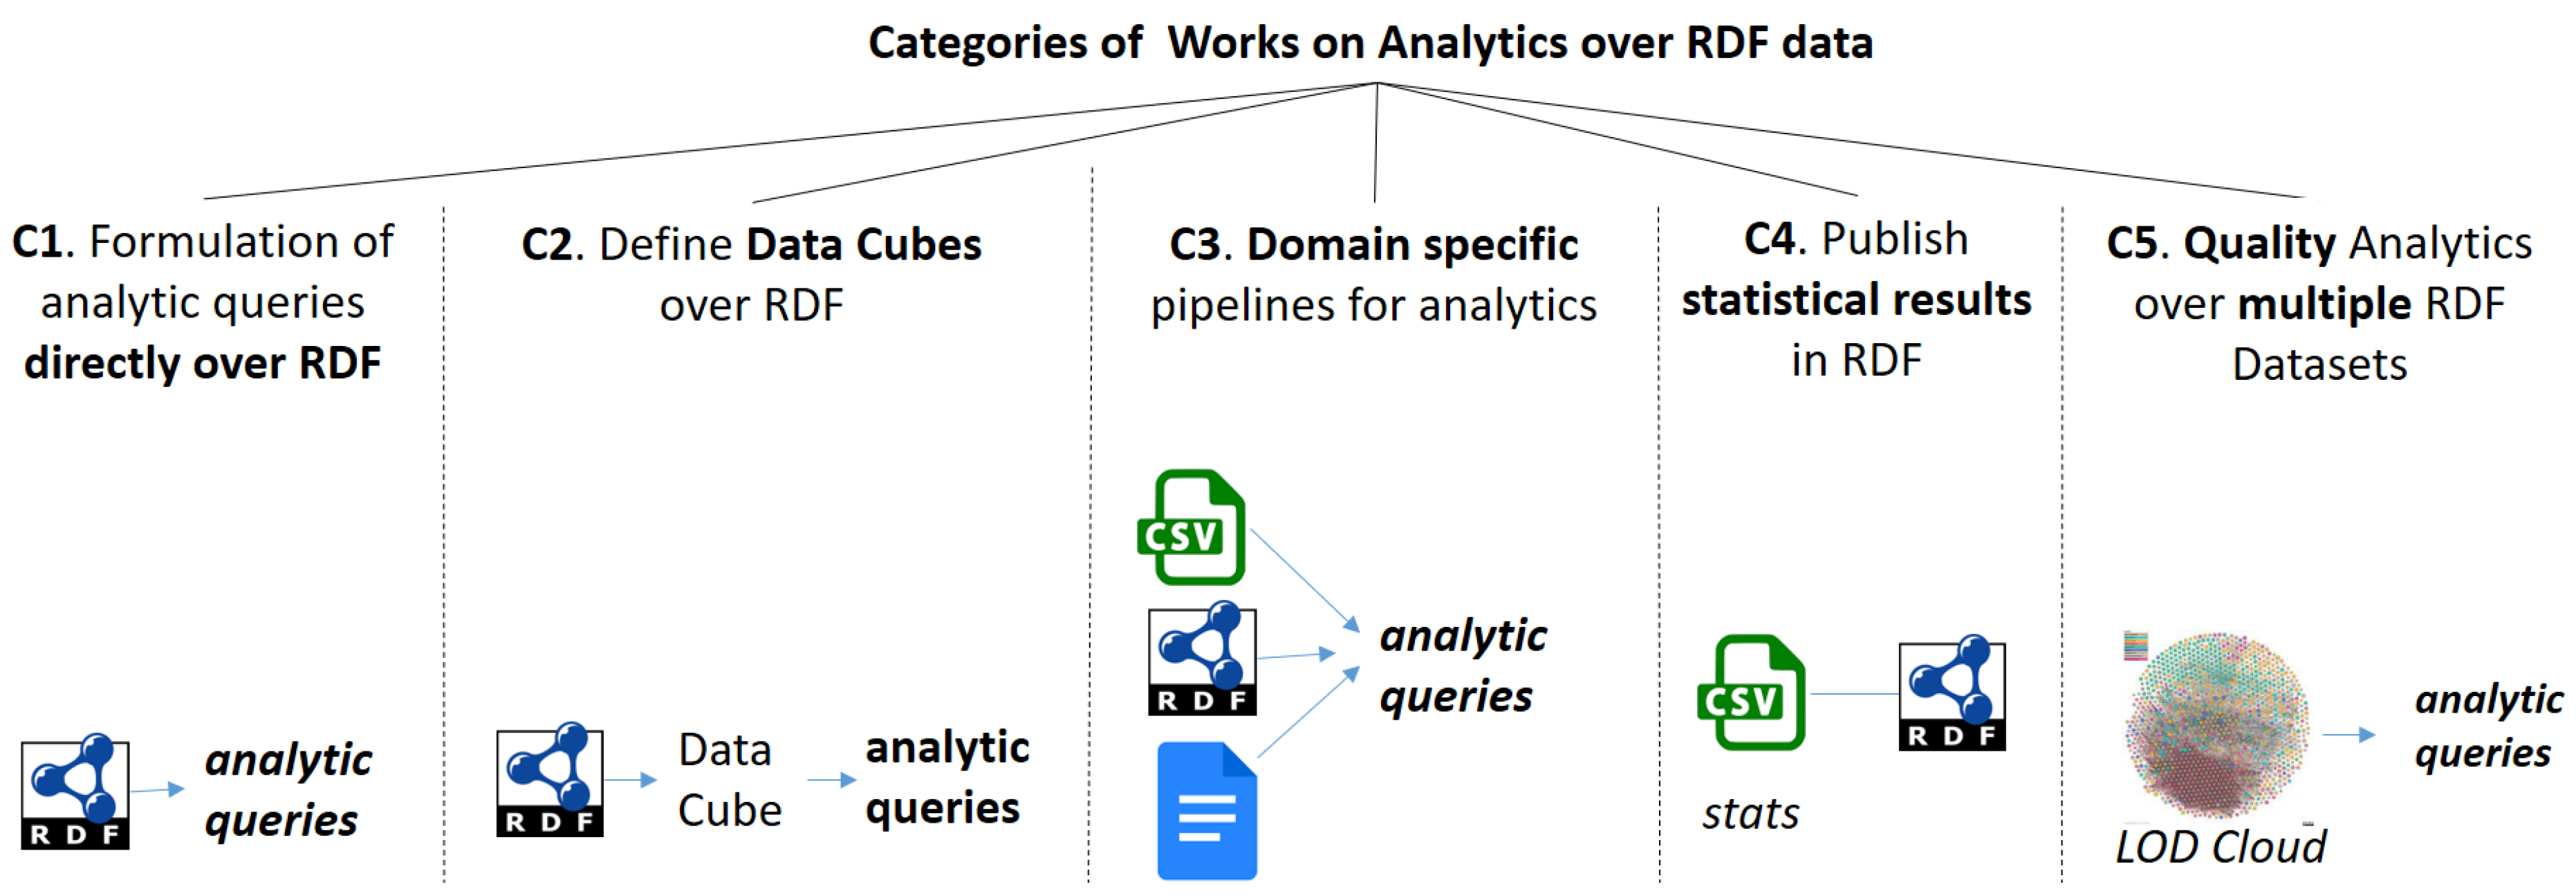
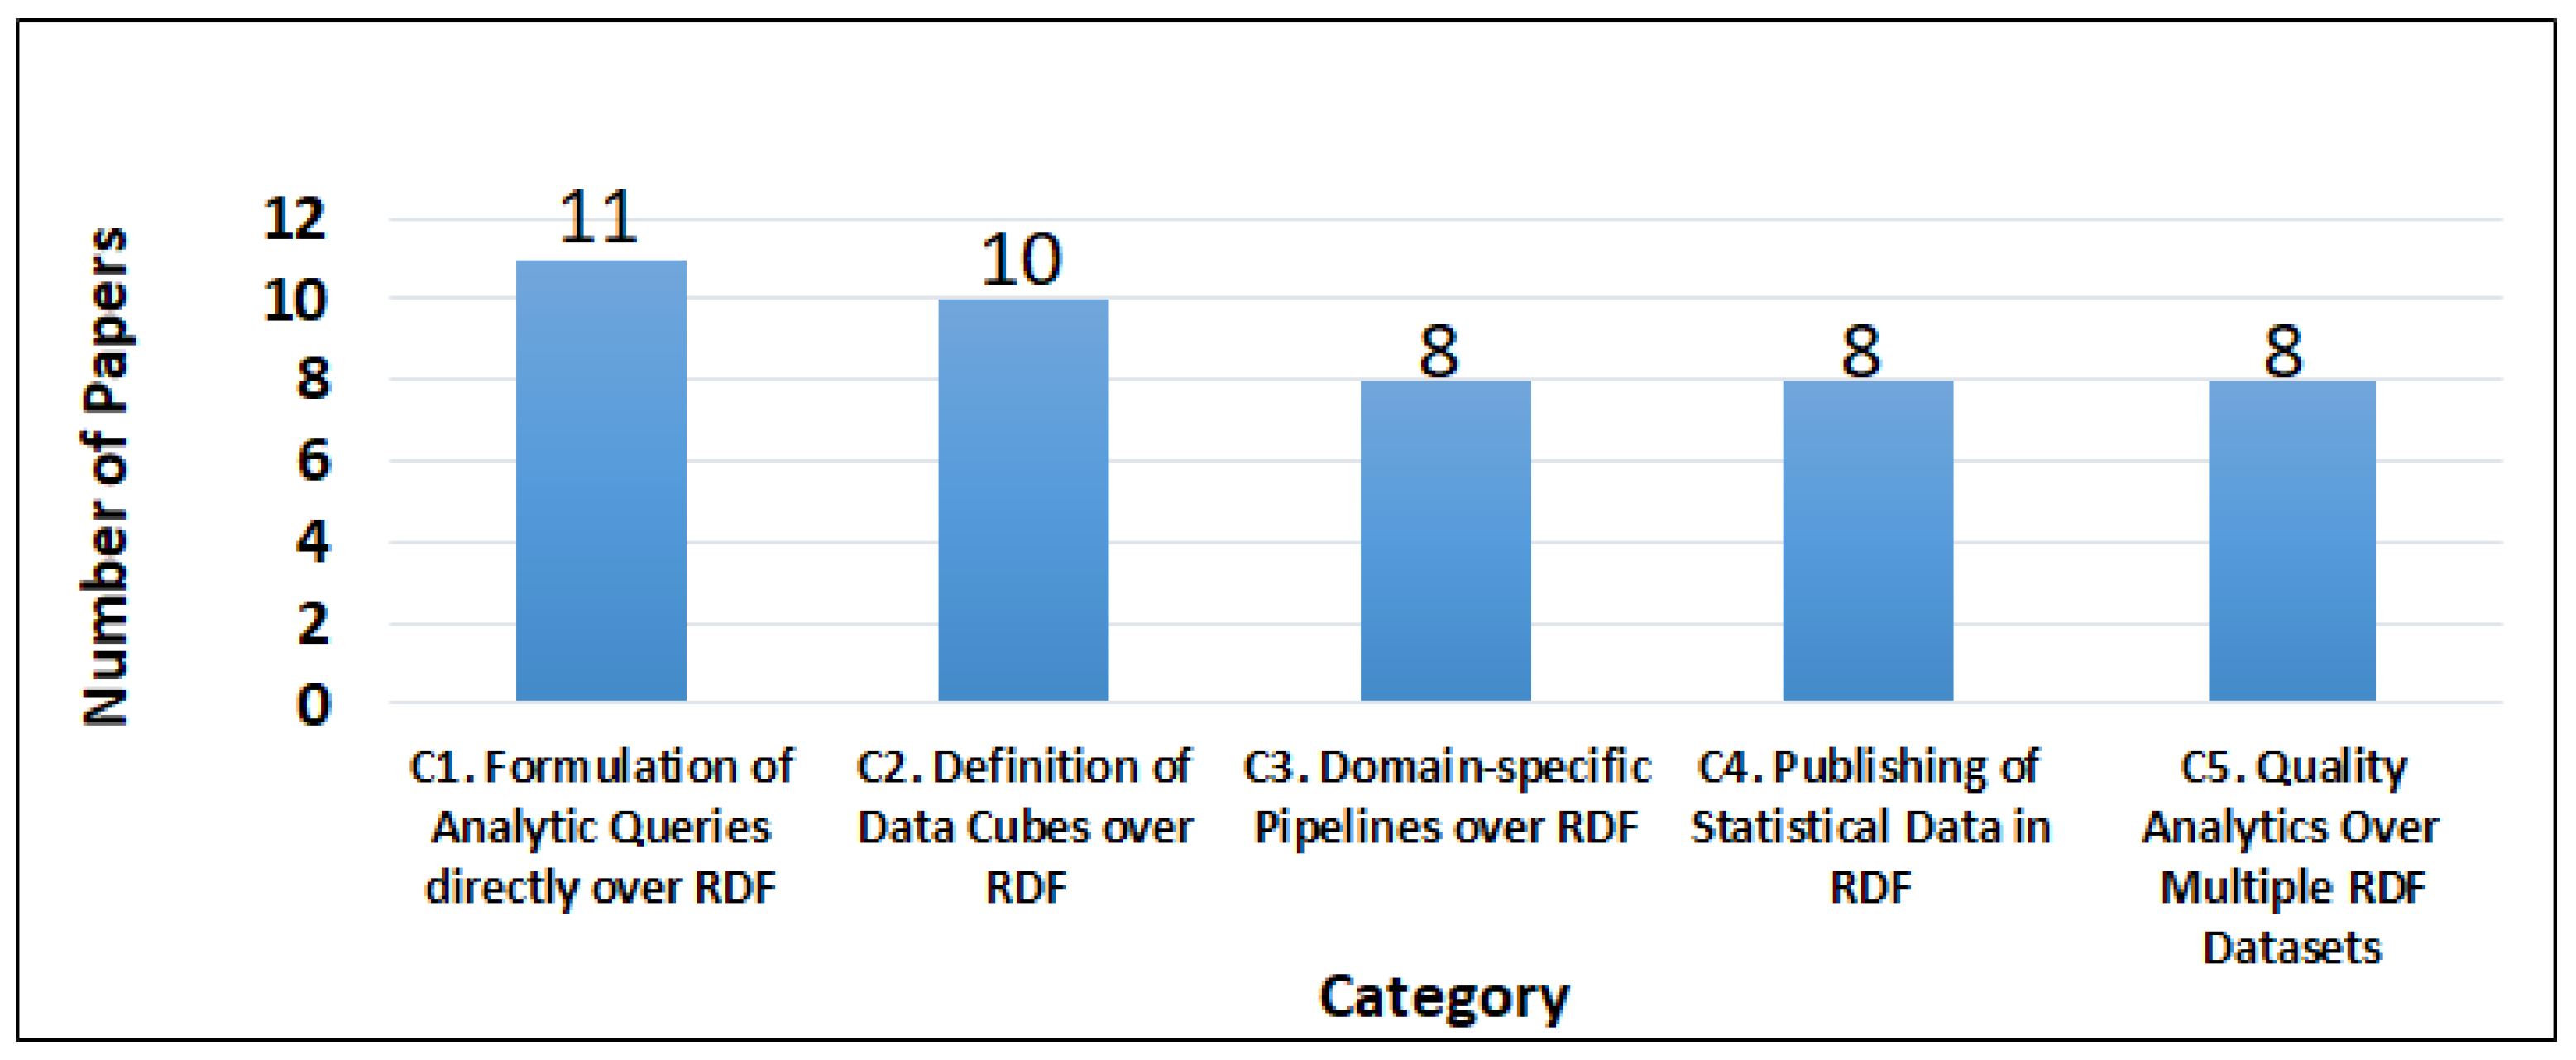
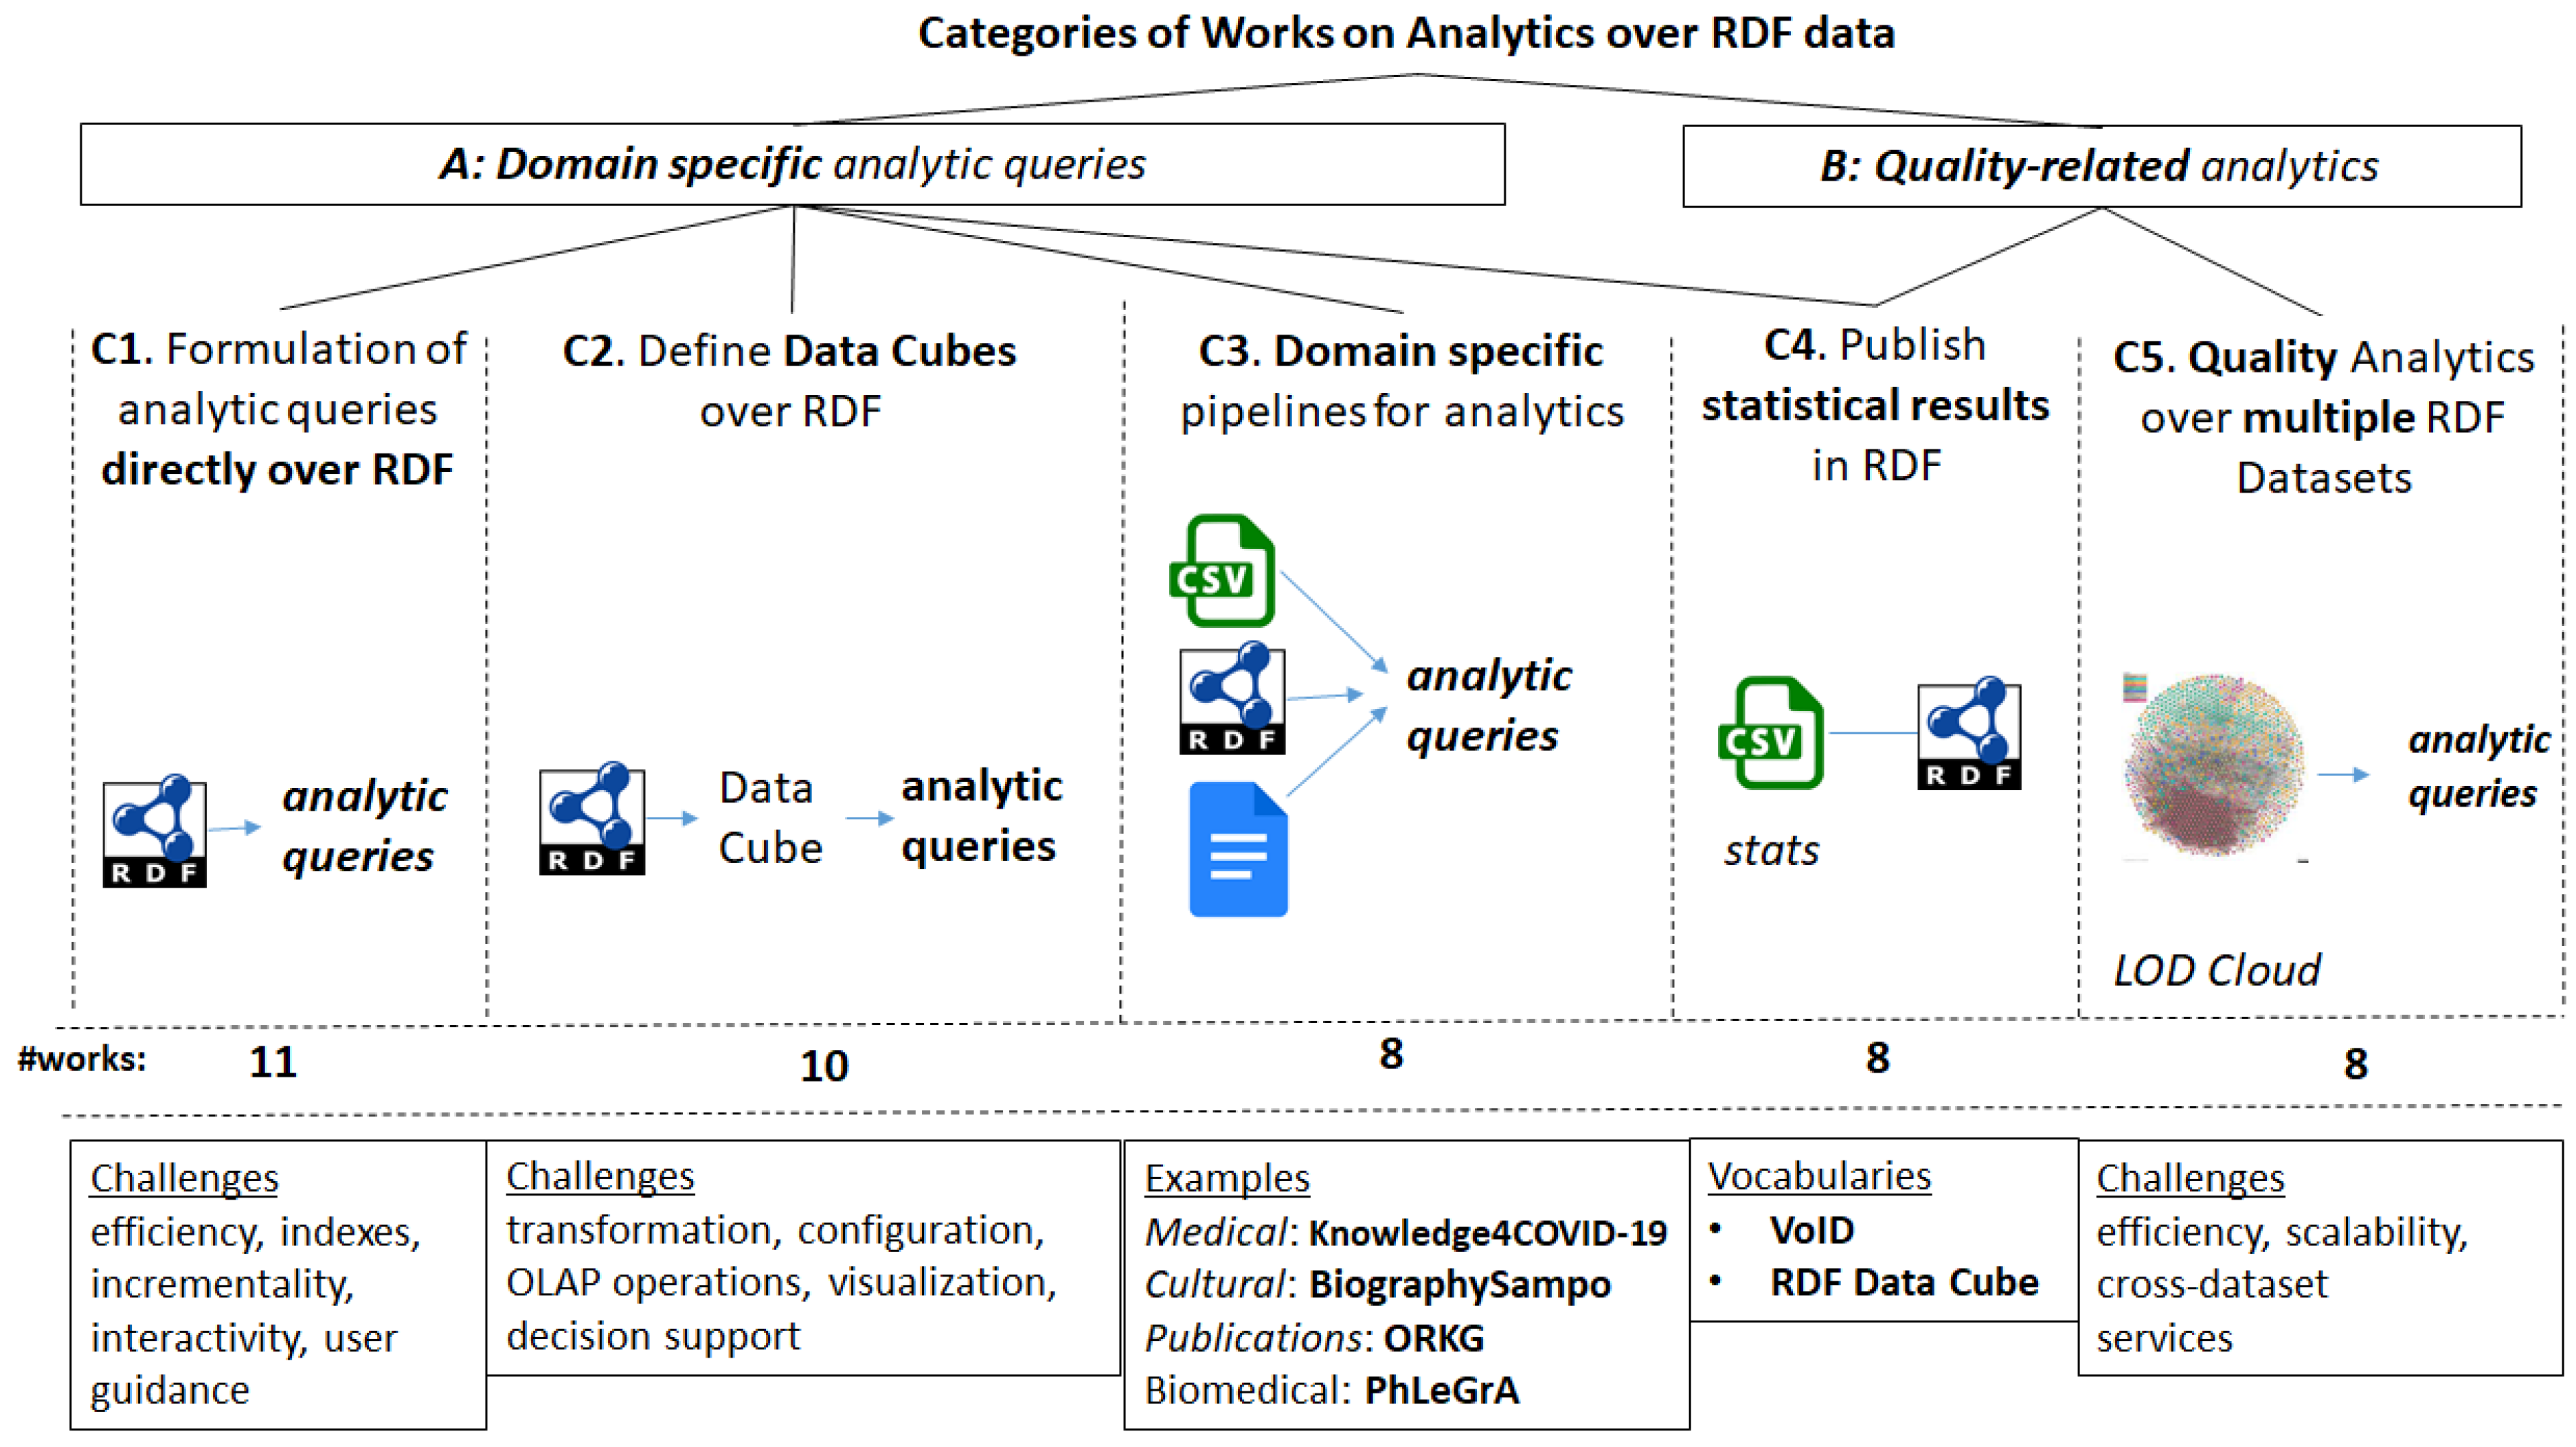
3.2. Categories of Works (Related to RDF and Analytics)
3.3. Categories of Analytic Queries
- (A)
- Domain specific analytic queries that are related to the core information needs for which the KG was constructed, and they are expressible in SPARQL. These queries are mainly used in categories C1-C3. Some indicative examples of such queries, from various domains, expressed in natural language, follow:
- -
- E-Commerce: “average price of laptops made in 2022 from US companies that have 2 USB ports and an SSD drive manufactured in Asia grouped by manufacturer”.
- -
- Cultural domain: “all paintings of El Greco grouped by exhibition country”.
- -
- Health/Covid: “top countries with daily new covid19 cases per 1 million of population”.
- -
- Energy: “energy spent at the University of Crete in the winter months group by hour”.
- -
- Transportation: “average number of vehicles on Athens avenues during the morning peak hours (from 7 a.m. to 10 a.m.) in December of 2022”.
- -
- Education: “average time spent on a task group by the frequency of participation in the course and the social status of the student”.
- -
- Sports: “total goals and clean sheets of players of Spanish and England UEFA Champions League teams from 2021 to 2022”.
- (B)
- Quality-related analytics (e.g., connectivity, data uniqueness, data verification) of one or more KGs, e.g., through statistics or specialized metrics. They are mainly used in categories C4–C5. Examples of such queries are given below:
- -
- Coverage of a dataset: “How many unique triples DBpedia offers for the entity Aristotle?”
- -
- Connectivity between Datasets: “Give me the number of common entities among DBpedia, Wikidata and National Library of France”
- -
- Distribution of specific elements, such as properties, classes, namespaces, for detecting power-law cases in a KG or at the whole Linked Open Data (LOD) Cloud: “Is there a power-law distribution for the ontologies that are used from the LOD Cloud datasets?”.
- -
- Dataset Discovery: “Which dataset is the most relevant for the entity Socrates (e.g., offering the most triples)?”.
- -
- URI Quality: “What is the percentage of URIs that are dereferenceable and not broken?”
4. Survey of Works and Systems
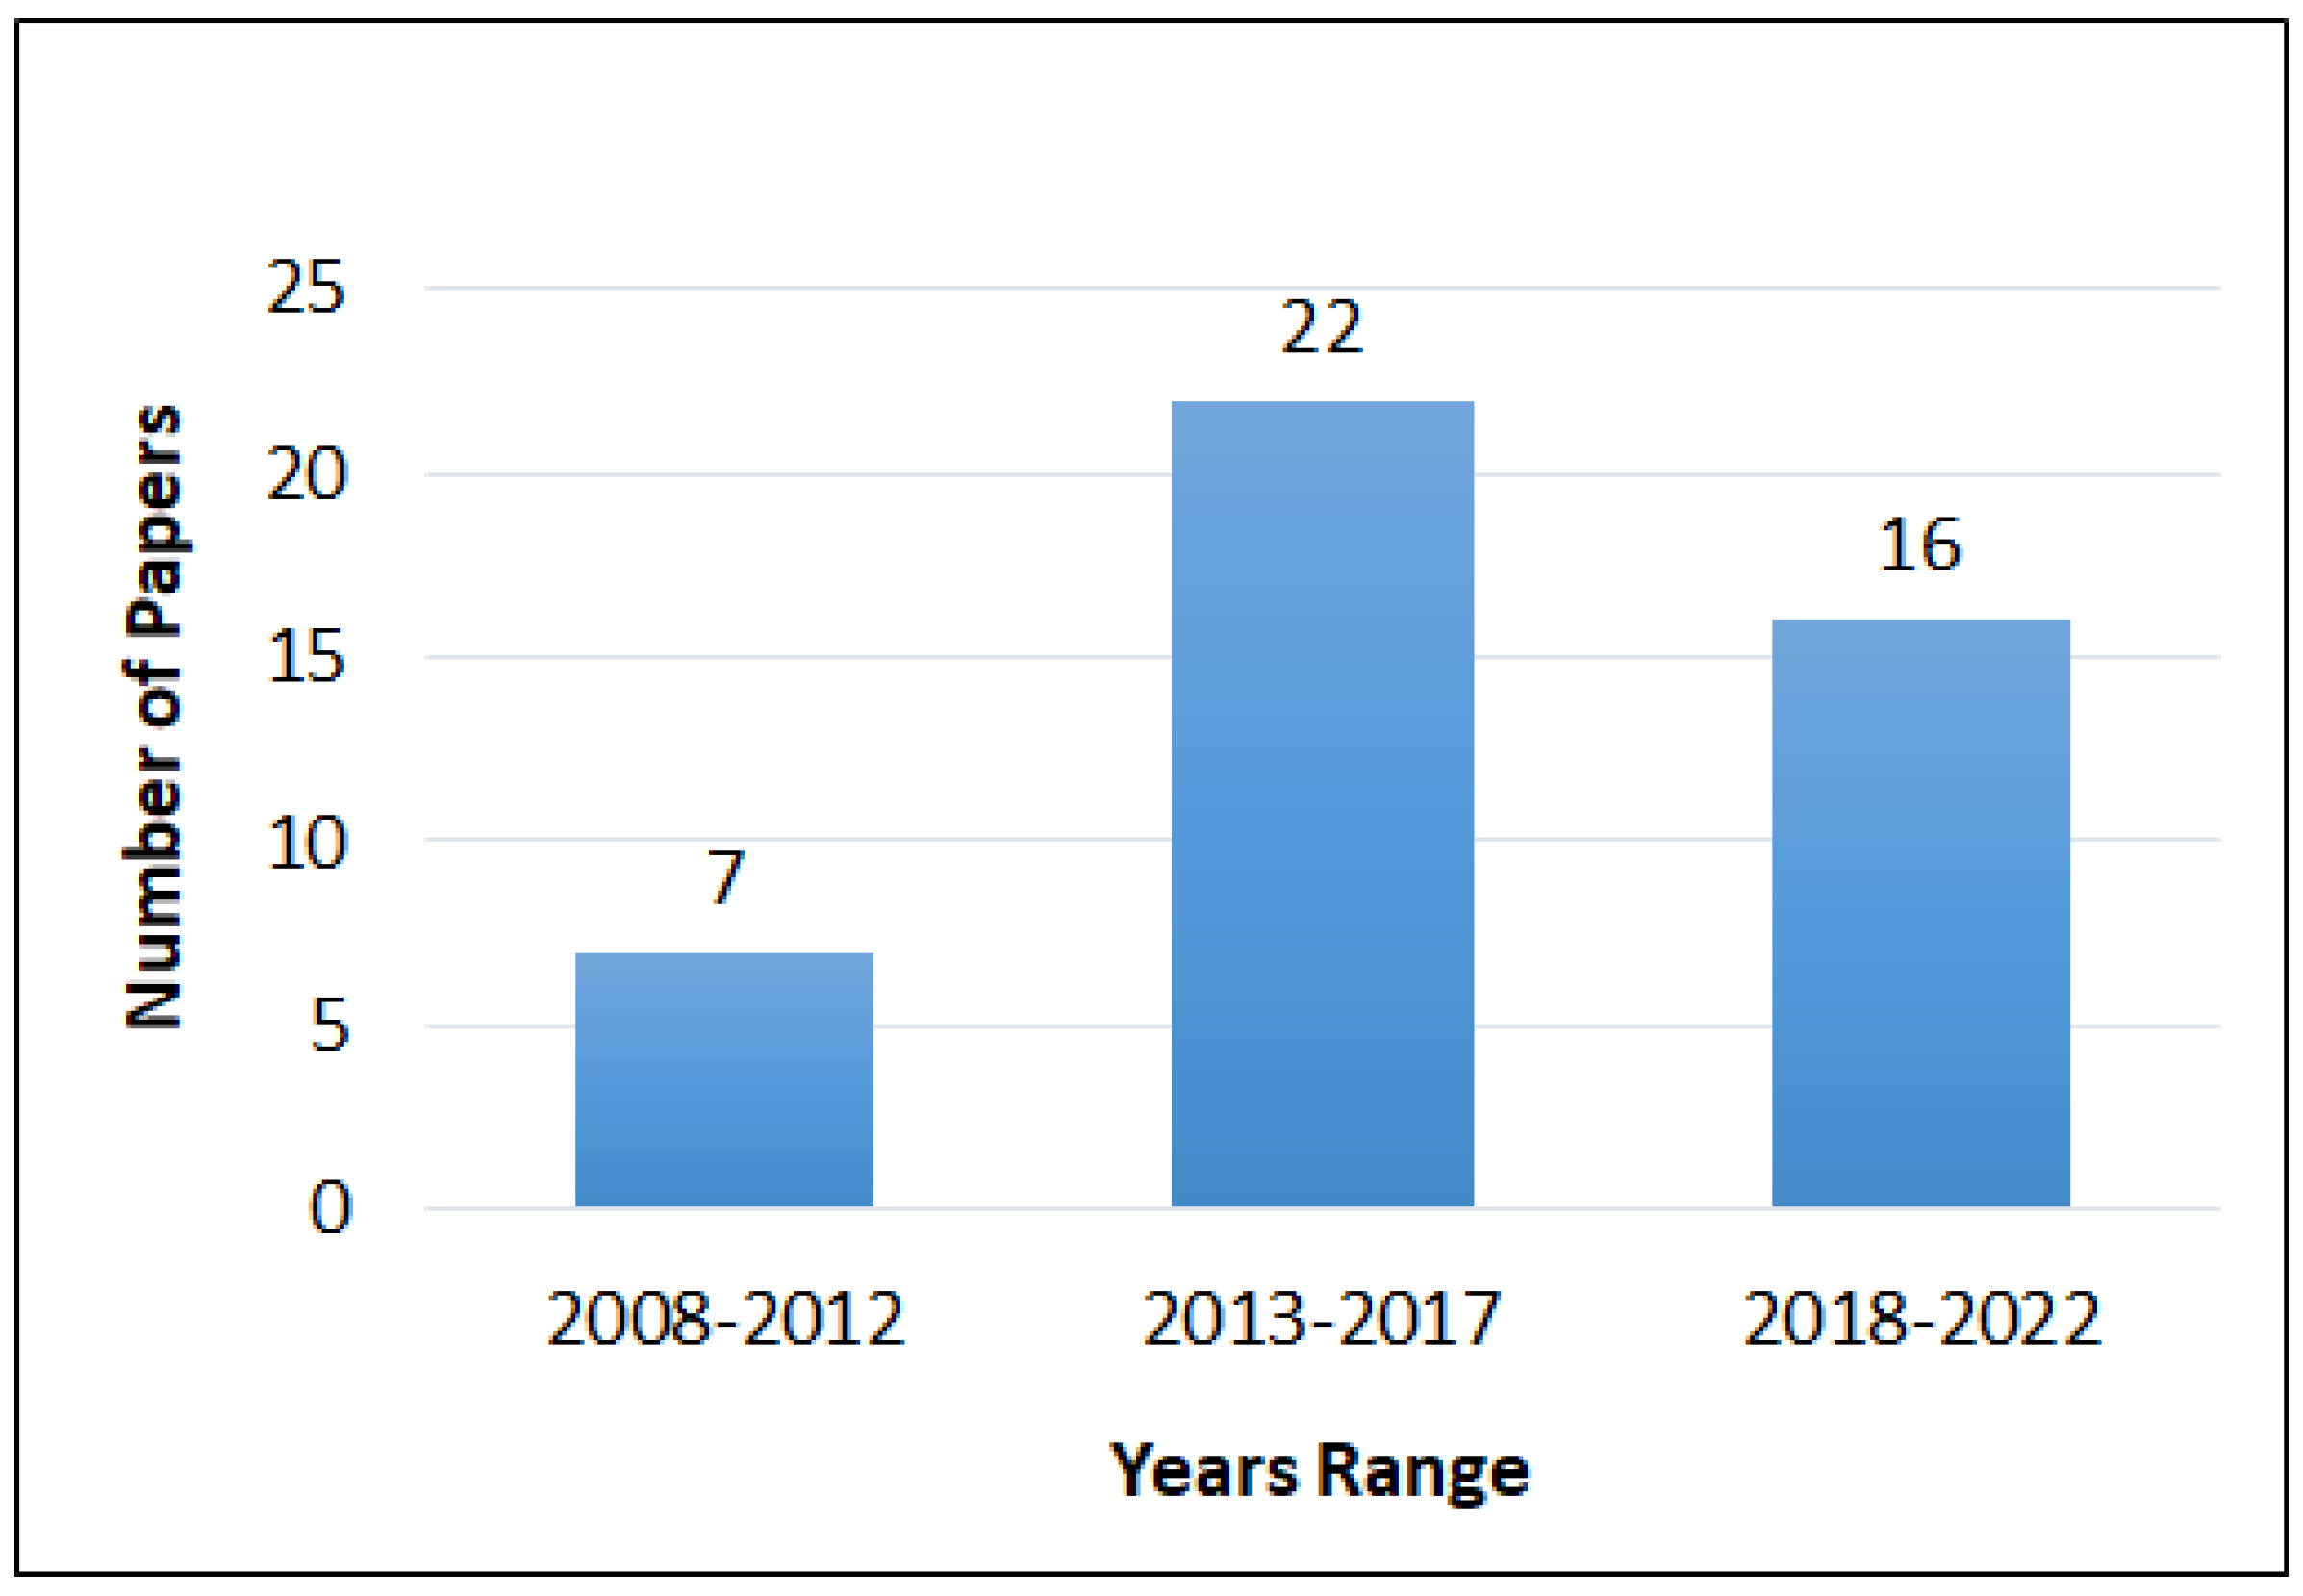
4.1. Methodology and Statistics
4.2. C1. Formulation of Analytic Queries Directly over RDF
- Ref. [35] presents a language, called RAPID, for efficient expression of complex analytical queries over RDF data. The approach is based on integrating RDF-sensitive and advanced analytical query operators for analytical processing called MD-join (which decouples the grouping and the aggregation clauses in query expressions) into Map-Reduce frameworks.
- Ref. [36] focuses on RDF data that include several chain and star patterns. In particular, all patterns in the latter category can be processed concurrently using grouping-based operators, for minimizing the I/O costs, by computing sequentially the individual star patterns.
- Ref. [37] introduces SynopsViz, a Web-based visualization tool for scalable multilevel charting and visual exploration of large RDF and Linked datasets. It performs a hierarchical aggregation, it incrementally retrieves data and generates visualizations based on user interaction. It provides statistical information collected over the dataset (number of triples, blank nodes, classes, subclasses, etc.) but they are usually listed in tabular format, leaving their interpretation to analysts. It obtains computed statistics about the data being queried, such as: mean, variance, minimum and maximum values, etc. However, aggregate functions such as SUM and AVG are not supported. In the end, even though it is specialized in gathering statistical data about the dataset, it is not meant for traversing the dataset. Information displayed are not single resources but a series of aggregated measures calculated over them. Finally, there is no evaluation report about this tool.
- Ref. [38] proposes some techniques, to handle SPARQL queries with aggregate operators over dynamic RDF datasets, efficiently. It stores RDF data as a large graph, and represents a SPARQL query as a query graph. To achieve efficient and scalable query processing, it implements pattern matching queries with the help of two index structures: a VS*-tree, which is a specialized B+-tree, and a trie-based T-index.
- Ref. [39] proposes a set of query processing strategies for executing aggregate SPARQL queries over federations of SPARQL endpoints by materializing the intermediate results of the queries. However, participating sources in a federation might be unavailable at some point. Data and schemata of the sources might have evolved since the federation was created; thus, integration rules might no longer be valid or history of the data will be lost.
- Ref. [40] shows how to process aggregate queries by using materialized views—named queries whose results are stored in a system (since they are typically much smaller in size than the original data and can be processed faster). These results are then used for answering subsequent analytical queries.
- Ref. [41] describes a possible extension of SemFacet [46] to support numeric value ranges and aggregation. The focus is on theoretical query management aspects, related to faceted search; however, it lacks an interface and implementation. From the mockups of the GUI, it seems that no count information is provided, whereas explicit path expansion is not supported. On the contrary, the authors use the notion of “recursion” to capture reachability-based facet restrictions. Since this approach is not implemented, no evaluation results are available.
- Ref. [42] presents Spartex, a vertex-centric framework for complex RDF analytics, that extends SPARQL to combine generic graph algorithms (e.g., PageRank, Shortest Paths, etc.) with SPARQL queries. It employs graph exploration and uses intervertex message passing during the query evaluation.
- Ref. [43] mentions that the existing federated RDF systems support only basic queries in SPARQL 1.0 and cannot be compatible with complex queries in SPARQL 1.1 well, such as aggregate queries. For this reason, proposes a query decomposition optimization method, which allows combine triple patterns with the same multisources into one subquery. The schema can reduce the number of remote requests to improve the query efficiency by reducing the number of subqueries.
- Ref. [44] proposes an approach for guided query building that supports analytical queries in natural language and can be applied over any RDF graph. The implementation is over the SPARKLIS editor [47], and it has been adopted in a national French project (http://data.persee.fr/explore/sparklis/?lang=en, accessed on 1 January 2023). During the query formulation, no count information is provided, reducing in this way the exploratory characteristics of the process. The authors report positive evaluation results as regards the expressive power of the interactive formulator which works well on large datasets and is easier to use than writing SPARQL queries.
- Ref. [45] describes how a high-level functional query language, called HIFUN [48], can be exploited for applying analytics over RDF data. Rules for translating analytical HIFUN queries to SPARQL are presented. However, the interactive formulation of such queries and the evaluation part are missed from that study.
4.3. C2. Definition of Data Cubes over RDF
- Ref. [49] introduces Graph Cube to support OLAP queries effectively on large multidimensional networks. However, it usually ignores semantic information in heterogeneous networks. The experimental studies conducted shows that this tool supports decisions on large multidimensional networks, effectively.
- Ref. [50] introduces Linked Data Query Wizard, a Web-based tool for displaying, accessing, filtering, exploring, and navigating Linked Data which are expressed in data cube format and stored in SPARQL endpoints. The main innovation of the interface is that it turns the graph structure of Linked Data into a tabular interface and provides easy-to-use interaction possibilities. It supports filtering of the columns (e.g., by a keyword or a numeric value) and simple aggregations. However, the tables are limited to the presentation of the direct neighborhood of entities (columns are entity properties, and column values are the objects of those properties) rather than results of arbitrary queries. Table cells can contain sets of values but not multicolumn tables. The results of the conducted user study showed that the tool had a few weak spots that could be improved, but in general it is usable, both for experts and nonexperts in computer science.
- Ref. [51] presents Payola, a framework for Linked Data analysis and visualization. The goal is to provide end users with a tool enabling them to analyze Linked Data in a user-friendly way and without knowledge of SPARQL query language. This goal can be achieved by populating the framework with variety of domain-specific analysis and visualization plugins Although it encourages collaboration between users, e.g., experts can edit visualizations and SPARQL queries and lay-users can consume a result, it neglects to provide a complete representation of the dataset that is necessary for expressing the queries. At the same time, the amount of manual configuration and the necessary transformation steps between different abstractions might be considered a shortcoming by nontechnical users. Regarding the evaluation of this tool, there is a concise report where the test users asked a couple of questions regarding usability of it and concludes that work on the usability is needed.
- Ref. [52] presents Vis-Wizard, a Web-based visualization system able to analyze multiple datasets using brushing and linking methods i.e., combining different visualizations to overcome the shortcomings of single techniques. The tool was designed for two different tasks: (i) explore endpoints like DBpedia and (ii) explore datasets that contain statistical data. Vis-Wizard allows users to group data and aggregate values providing multiple interactive widgets. According to [59], the online version reports a multitude of errors that prevented users to analyze the different visualizations that the tool offers. In fact, console errors rose and no charts appeared. Regarding endpoints like DBpedia, the tool works fine, but the tabular layout they implemented results to be a little messy at first. The evaluation conducted regarding the usability of the Vis-Wizard shows that while several usability issues still need to be fixed, the overall advantage is observable.
- Ref. [53] proposes algorithms that use the materialized result of an RDF analytical query to compute the answer to a subsequent query. The answer is computed based on the intermediate results of the original analytical query. However, the approach does not propose any algorithm for view selection. It is applicable for the subsequent queries and not to an arbitrary set of queries [40]. In addition, no evaluation is reported.
- Ref. [54] studies the improvement of SPARQL queries over QB4OLAP [60] (an extension of the RDF Data Cube Vocabulary https://www.w3.org/TR/vocab-data-cube/, accessed on 1 January 2023) to fully support OLAP multi-dimensional models and operators) data cubes. The idea behind the proposed approach is to directly link facts (observations) with attribute values of related level members. Although preliminary results in an evaluation study show an improvement in queries performance, this approach prevents level members from being reused and referenced, breaking the Linked Data nature of QB4OLAP data instances.
- Ref. [55] proposes CubeViz, a user-friendly exploration and visualization platform for statistical data represented adhering to the RDF Data Cube vocabulary. If statistical data is provided adhering to the Data Cube vocabulary, CubeViz exhibits a faceted browsing widget allowing to interactively filter observations to be visualized in charts. However, it does not support aggregate functions, such as SUM, AVG, MIN and MAX, and blank nodes. According to [61] if the created RDF Data Cube is sparse, it is possible to receive an empty result set after using the data selection component of CubeViz. As a consequence, CubeViz is not able to process all kinds of valid Data Cubes. In a domain-agnostic tool such as CubeViz, it is not feasible to integrate static mappings between data items and their graphical representations. Most of the chart APIs have a limited amount of predefined colors used for coloring dimension elements or select colors completely arbitrarily. Finally, this paper does not provide any information about the evaluation of this tool. It contains only a link to an online demonstrator letting users evaluate it.
- Ref. [56] presents multidimensional and multiview graph data using MapReduce-based graph processing. The goal is to facilitate the analytics over the ER graph through summarizing the process graph and providing multiple views at different granularities. The technique, however, always materializes the result as paths with respect to a single entity identifier. The experiments conducted over real-world data sets, showed that the proposed approach performs well.
- Ref. [57] introduces Microsoft Power BI, a business intelligence platform that provides nontechnical business users with tools for aggregating, analyzing, visualizing and sharing data. Power BI’s user interface is intuitive mainly for users familiar with Excel. It assumes that the ingested data has been cleaned up well in advance, while there is also a limit on its size (cannot import large data sets). After the data hit the limit, you have to upgrade to the paid version of Power BI. The generated reports and dashboards can be shared only with those users who have the same email domains or the ones who have their email domains listed in your Office 365 tenant. At last, regarding the evaluation of that tool, there are provided comparative studies with other analytics tools as described in [62,63].
- Tableau (https://www.tableau.com/, accessed on 1 January 2023) [58] is a visualization tool capable of delivering interactive visualizations in no time by using drag and drop. It offers a wide variety of options including pie, bar and bubble charts, maps, heat maps, scatter plots making use of which informative dashboards can be created instantly from diverse datasets. It performs aggregations, highlighting or drilling down in charts with much ease that even novice users can create visualizations to illuminate facts in a huge data set. Tableau can be used to define and calculate new variables and perform simple data manipulations with usage of mathematical formulae like excel. However, initial data processing is needed which requires professional kit knowledge, while only column charts can be used for visualizing the results for free. Finally, no evaluation report is provided, however, there are available comparative studies with other tools [64,65].
4.4. C3. Domain-Specific Pipelines over RDF
- Medical Domain. PhLeGrA [66] has integrated data from several large scale biomedical datasets, for analyzing associations between drugs, i.e., for improving the accuracy of predictions of adverse drug reactions. Moreover, ref. [67] collects both structured and unstructured data for creating an aggregated KG about cancer data. The objective is to provide cancer data analytics through several services, such as treatment sequence analysis, data discrepancy analysis and others. Moreover, ref. [68] created a KG, from over 50,000 articles related to coronaviruses, by using linked data techniques. The produced RDF dataset can be used for producing analytics through several extraction and visualization tools, e.g., it is feasible to analyze the number of articles that comention cancer types and viruses of the corona family. Finally, ref. [69] describes a framework called Knowledge4COVID-19, that integrates several RDF sources of COVID-19 related data. The resulting KG is exploited from machine learning methods for providing analytics and visualizations that are used for discovering adverse drug effects and for evaluating the effectiveness and toxicity of COVID-19 treatments.
- Publications Domain. OpenAIRE [70] is a Research KG that aggregates a collection of metadata and links, which are offered within the OpenAIRE Open Science infrastructure, and provides several analytics and visualizations, such as for usage data (https://usagecounts.openaire.eu/analytics, accessed on 1 January 2023). Moreover, Open Research Knowledge Graph (ORKG) [8] exploit manual and automated techniques for creating and processing a scholarly KG. The mentioned KG can be used for further analysis through visualizations that are produced by the offered data science environments (e.g., see https://orkg.org/visualizations, accessed on 1 January 2023).
- Cultural Domain. FAST CAT [71] is a collaborative system for data entry and curation in Digital Humanities, and it can be exploited for performing historical analysis over aggregated data. Moreover, ref. [72] describes BiographySampo, an approach that provides analytics for biographical and prosopographical research, by first transforming textual resources (from the National Biography of Finland) to RDF data. Afterward, even users that are nonfamiliar with SPARQL, can perform custom-made complex data analysis through the offered tools.
4.5. C4. Publishing of Statistical Data in RDF
- Works with RDF data cube vocabulary. To foster the exchange and intelligibility of statistical results (expressed in csv and other formats), approaches such as [74,75], focus on publishing statistical data as linked data through RDF data cube vocabulary. Such statistical data can be visualized and analyzed through the framework Payola [51] (which has been described in category C2).
- Works with VoID vocabulary. VoID can be exploited for expressing metadata about one or more RDF datasets, i.e., for representing and publishing several simple statistics, such as the number of triples, properties or classes of each dataset and the number of links between different datasets. Several tools have been published for measuring such statistics for RDF datasets through VoID including Aether [76] for generating, browsing and visualizing statistics, by using SPARQL queries. Furthermore, ref. [77] describes the tool Loupe, which provides summaries and an analysis of vocabulary information about each RDF dataset, e.g., the classes and properties used in each dataset. There have been proposed extensions of VoID, such as [78], for publishing and analyzing connectivity analytics of semantic data warehouses. On the contrary, approaches such as SPORTAL [79] and SPLENDID [80] compute and publish such statistics, for aiding the process of source selection for federated queries. Finally, the application KartoGraphI [81] publishes statistical data through VoID (and extensions of VoID), for SPARQL endpoints and provides several types of visualizations for the results.

| Work/System | Analytical Queries for | Vocabulary | Publication Year |
|---|---|---|---|
| SPLENDID [80] | Statistics for SPARQL endpoints | VoID | 2011 |
| Salast et al. [74] | Publication of Statistical data | RDF data cube vocabulary | 2012 |
| Zancanaro et al. [75] | Publication of Statistical data | RDF data cube vocabulary | 2013 |
| Aether [76] | RDF Dataset Statistics | VoID | 2014 |
| VoIDWH [78] | Semantic Warehouse connectivity | VoID (+extensions) | 2014 |
| Loupe [77] | RDF Dataset Statistics | VoID | 2016 |
| SPORTAL [79] | Statistics for SPARQL endpoints | VoID | 2016 |
| KartoGraphI [81] | Statistics for SPARQL endpoints | VoID (+extensions) | 2022 |
4.6. C5. Quality Analytics over Multiple RDF Datasets
- Works that measure distributions (e.g., power-law). Ref. [82] measured and analyzed the graph features of Semantic Web (SW) schemas with focus on powerlaw degree distributions, and the main finding was that the majority of SW schemas (at that time 2008) with a significant number of properties (resp. classes) approximate a power-law for total-degree (resp. number of subsumed classes) distribution. Furthermore, LOD-a-LOT [85] is an approach where 28 billion RDF triples from thousands of RDF documents have been collected, for enabling the analysis and the querying of combined data from multiple data sources, e.g., for analyzing the distribution of URIs and triples. Moreover, ref. [86] presents algorithms for computing analytical queries over Linked Open Data, by aggregating the results of queries from running SPARQL endpoints, i.e., for producing analytics over multiple LOD datasets, e.g., they measure the property and class usage on the LOD cloud, and they estimate the number of the available triples in the LOD Cloud. Finally, ref. [87] presents an empirical analysis of linkage among all the datasets of the LOD cloud, by focusing on automated methods for analyzing different link types at scale. The objective was to analyze the availability and discoverability of LOD datasets, i.e., the most commonly used ontologies, namespaces and classes, and many others, e.g., for discovering power-law distributions, and to analyze the quality of URIs, e.g., broken links, deferenacable URIs, etc.
- Works for Dataset Discovery. LODVader [83] is a system that produces LOD analytics over 491 RDF datasets, for supporting dataset exploration, analysis and dataset discovery. Moreover, LODstats [84] is a service including some basic metadata and statistics for over 9000 RDF datasets, e.g., for measuring the number of datasets of specific property and class elements. Furthermore, LODsyndesis [16] is a suite of services that provides analytics for measuring the connectivity among hundreds of RDF datasets. The target is the produced connectivity analytics to be exploited for improving the discoverability and reusability of the underlying datasets, and for answering coverage queries. Finally, LODChain [88] is a research prototype the computes connectivity analytics for a new RDF dataset at real time to the rest of LOD Cloud through LODsyndesis, and produces several visualizations (including graph visualizations, bar and pie charts, etc.) and dataset discovery measurements. In particular, the target is the analytics to be used for enriching and verifying the content of the input dataset.
5. Efficiency and Visualization
5.1. Efficiency
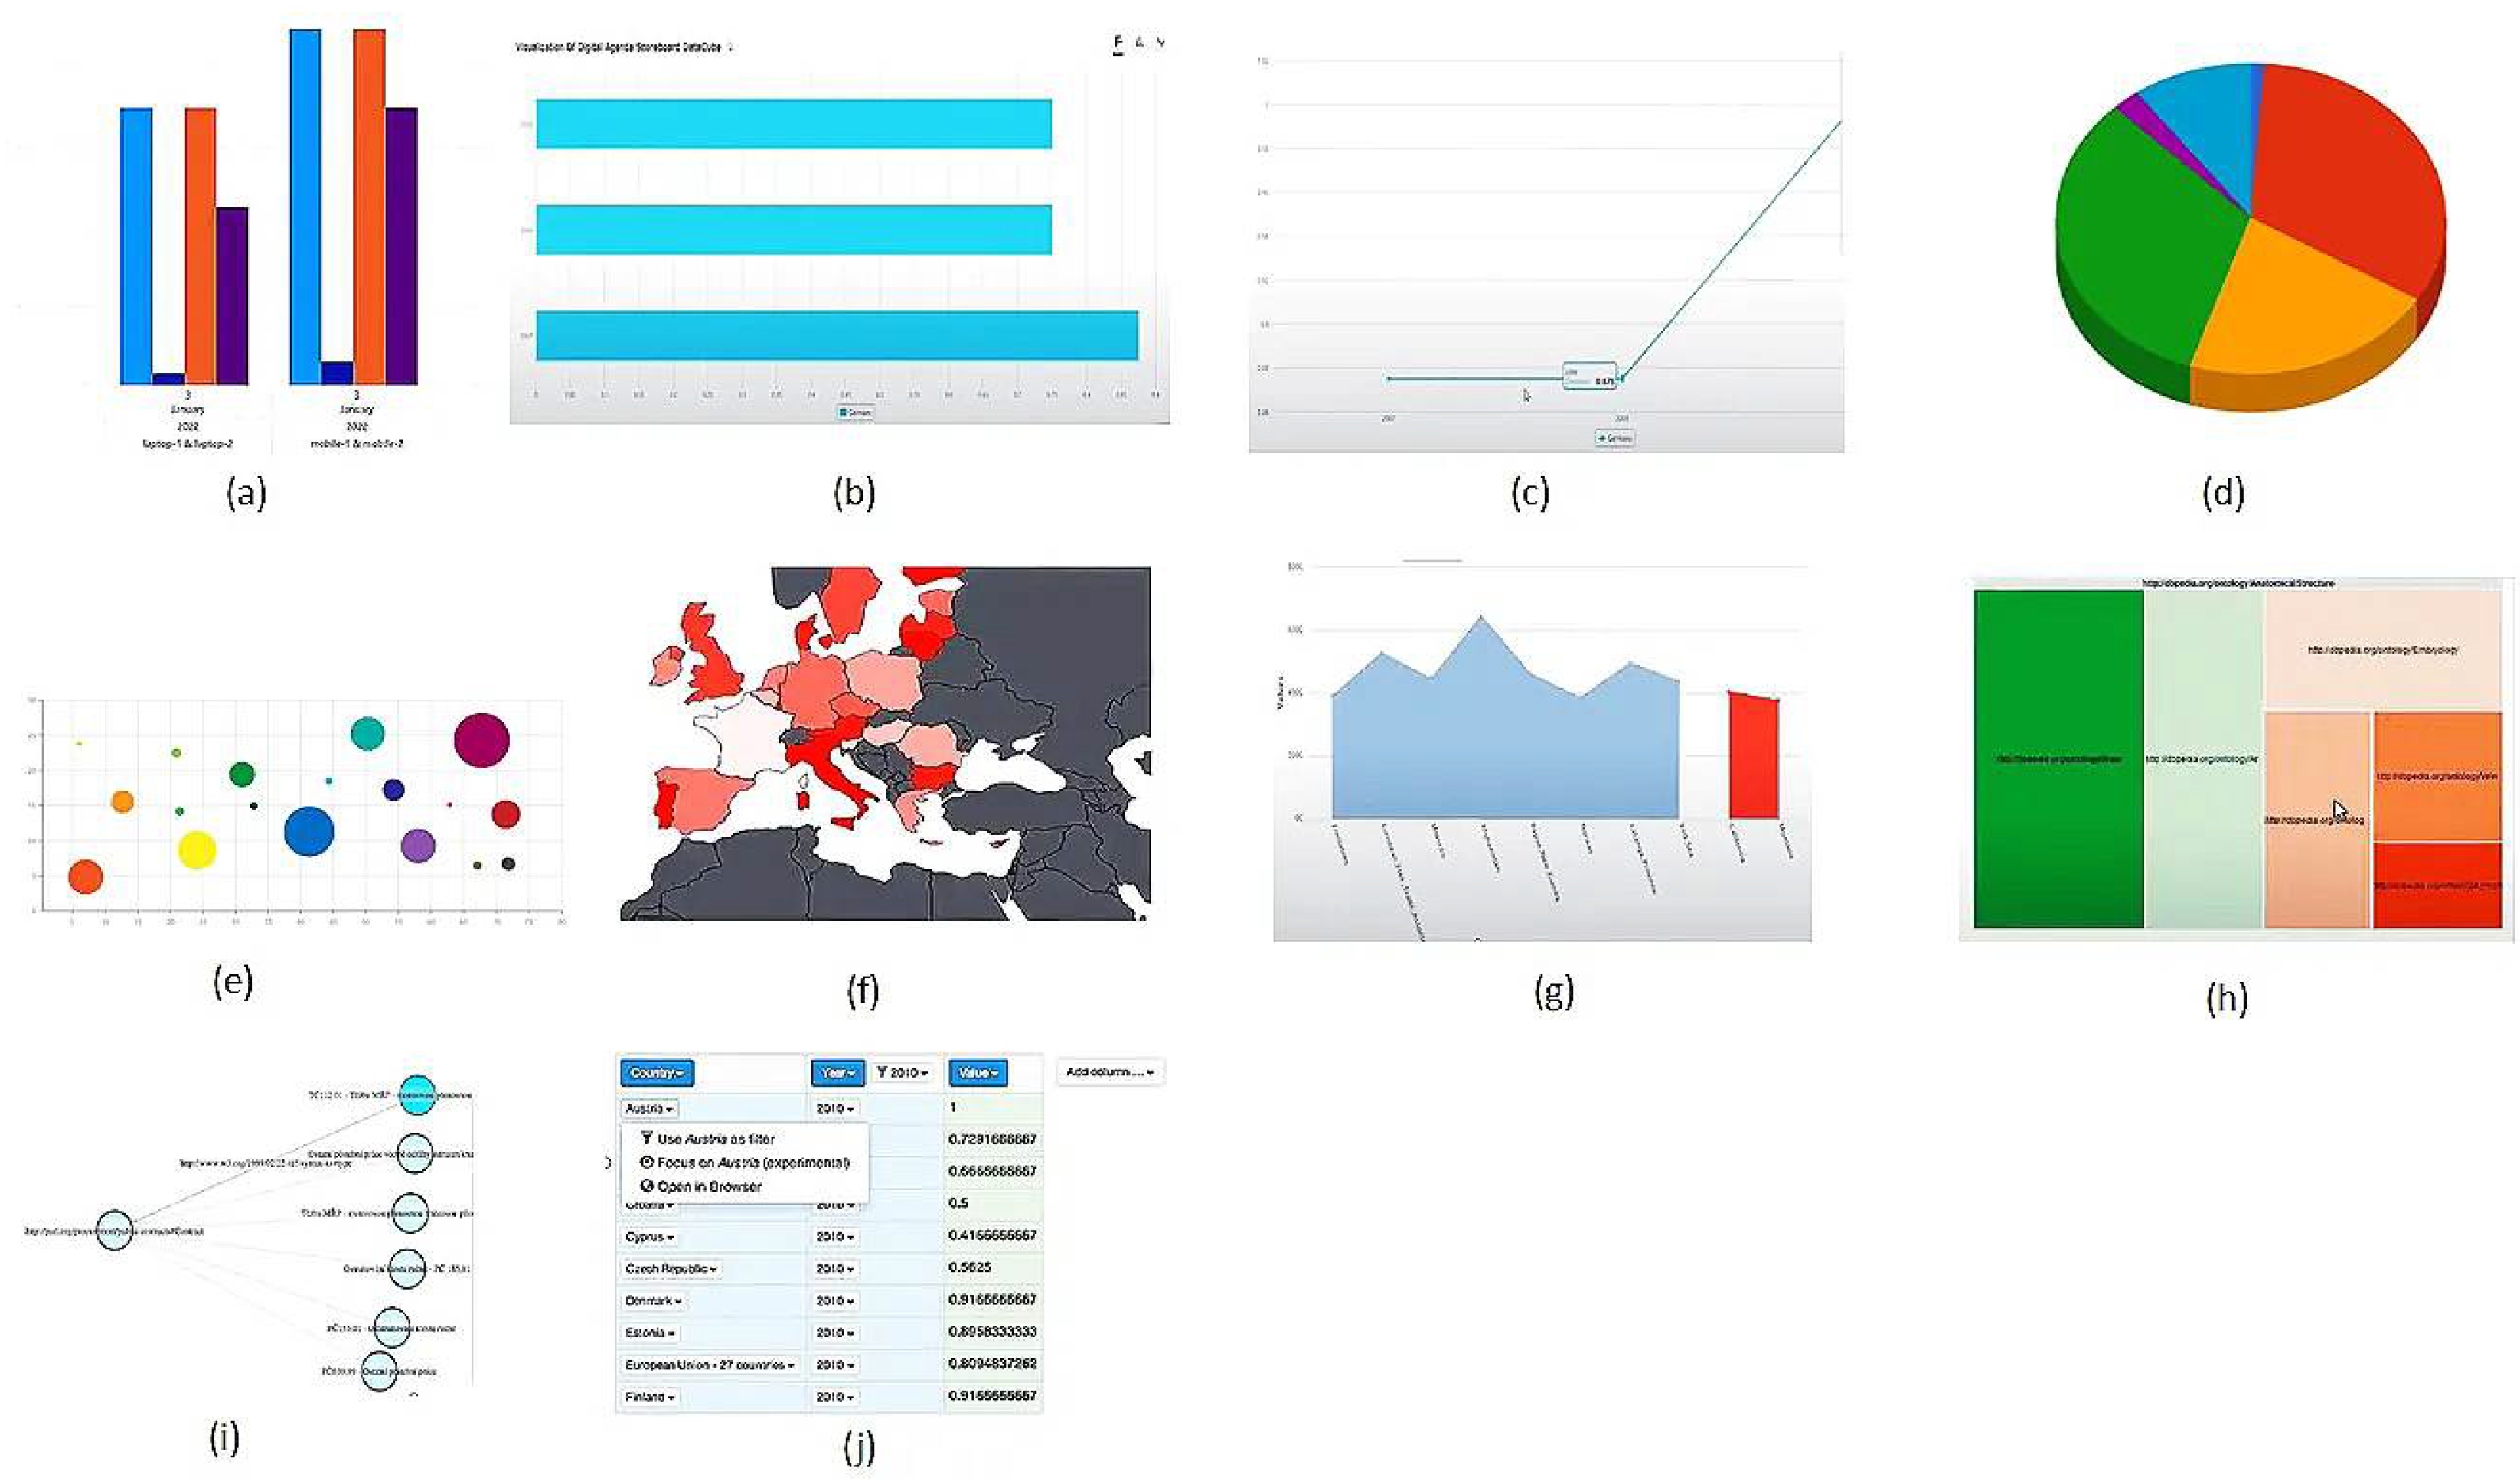
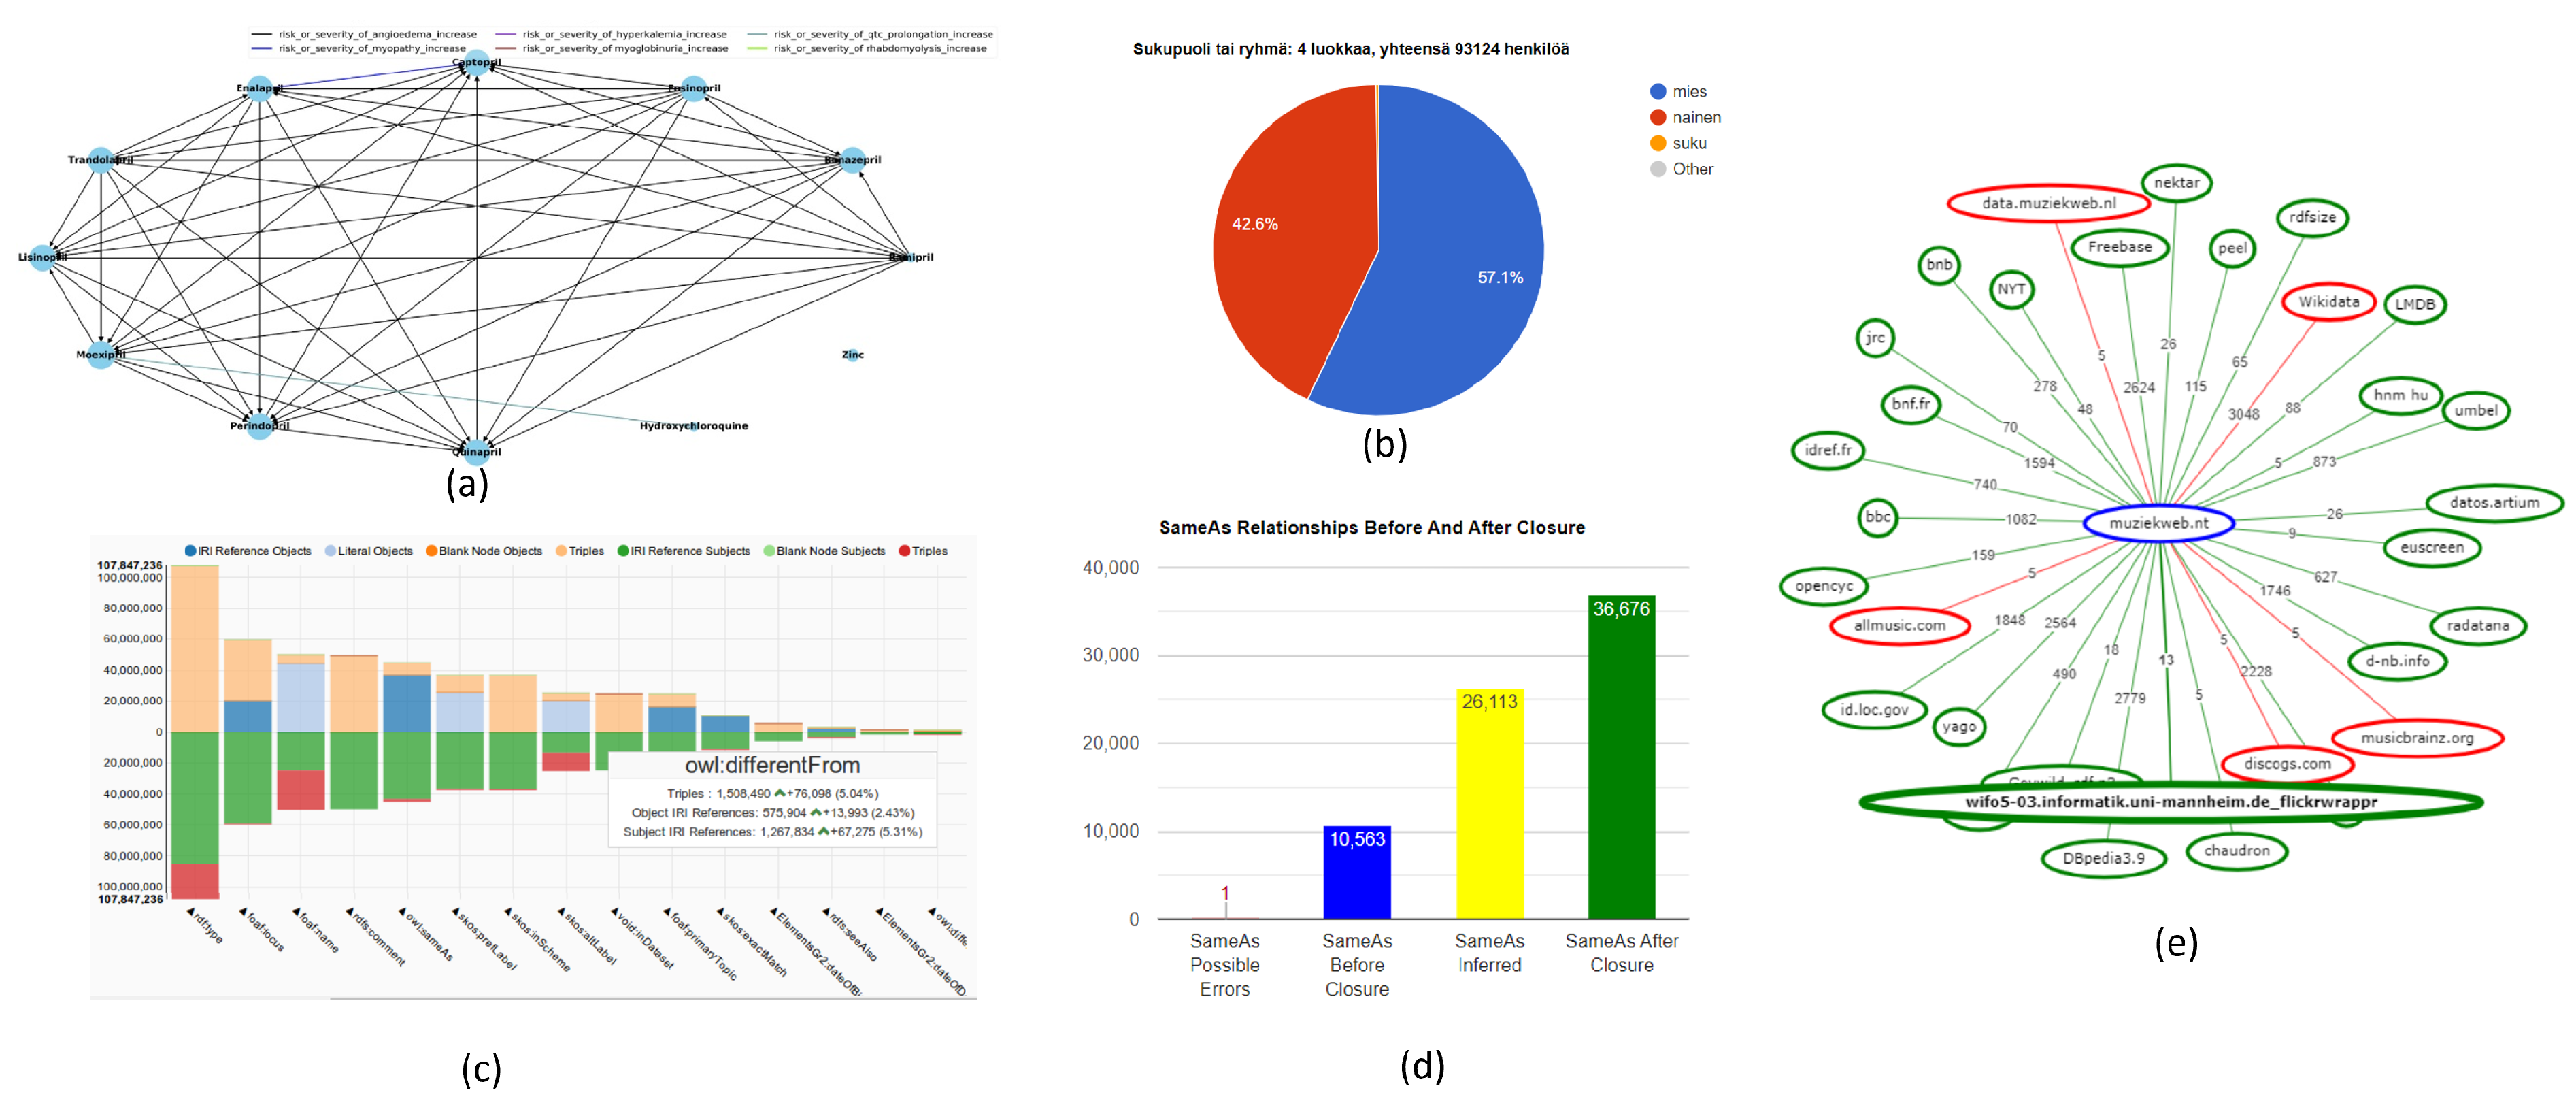
5.2. Visualization of Results
6. Concluding Remarks
Author Contributions
Funding
Institutional Review Board Statement
Informed Consent Statement
Data Availability Statement
Conflicts of Interest
References
- Hogan, A.; Blomqvist, E.; Cochez, M.; d’Amato, C.; Melo, G.d.; Gutierrez, C.; Kirrane, S.; Gayo, J.E.L.; Navigli, R.; Neumaier, S.; et al. Knowledge graphs. ACM Comput. Surv. (CSUR) 2021, 54, 1–37. [Google Scholar] [CrossRef]
- Bizer, C.; Lehmann, J.; Kobilarov, G.; Auer, S.; Becker, C.; Cyganiak, R.; Hellmann, S. DBpedia—A crystallization point for the Web of Data. J. Web Semant. 2009, 7, 154–165. [Google Scholar] [CrossRef]
- Vrandečić, D.; Krötzsch, M. Wikidata: A free collaborative knowledgebase. Commun. ACM 2014, 57, 78–85. [Google Scholar] [CrossRef] [Green Version]
- Abu-Salih, B. Domain-specific knowledge graphs: A survey. J. Netw. Comput. Appl. 2021, 185, 103076. [Google Scholar] [CrossRef]
- Isaac, A.; Haslhofer, B. Europeana linked open data–data.europeana.eu. Semant. Web 2013, 4, 291–297. [Google Scholar] [CrossRef]
- Wishart, D.S.; Feunang, Y.D.; Guo, A.C.; Lo, E.J.; Marcu, A.; Grant, J.R.; Sajed, T.; Johnson, D.; Li, C.; Sayeeda, Z.; et al. DrugBank 5.0: A major update to the DrugBank database for 2018. Nucleic Acids Res. 2018, 46, D1074–D1082. [Google Scholar] [CrossRef]
- Tzitzikas, Y.; Marketakis, Y.; Minadakis, N.; Mountantonakis, M.; Candela, L.; Mangiacrapa, F.; Pagano, P.; Perciante, C.; Castelli, D.; Taconet, M.; et al. Methods and Tools for Supporting the Integration of Stocks and Fisheries. In Proceedings of the Chapter in Information and Communication Technologies in Modern Agricultural Development, Chania, Greece, 21–24 September 2019. [Google Scholar]
- Auer, S.; Oelen, A.; Haris, M.; Stocker, M.; D’Souza, J.; Farfar, K.E.; Vogt, L.; Prinz, M.; Wiens, V.; Jaradeh, M.Y. Improving access to scientific literature with knowledge graphs. Bibl. Forsch. Und Prax. 2020, 44, 516–529. [Google Scholar] [CrossRef]
- Manghi, P.; Artini, M.; Atzori, C.; Baglioni, M.; Bardi, A.; La Bruzzo, S.; De Bonis, M.; Dimitropoulos, H.; Foufoulas, I.; Iatropoulou, K.; et al. OpenAIRE: Advancing open science. In Proceedings of the Nineteenth International Conference on Grey Literature, Rome, Itlay, 23–24 October 2017. [Google Scholar]
- Koho, M.; Ikkala, E.; Leskinen, P.; Tamper, M.; Tuominen, J.; Hyvönen, E. WarSampo Knowledge Graph: Finland in the Second World War as Linked Open Data. Semant. Web 2020, 12, 265–278. [Google Scholar] [CrossRef]
- Fafalios, P.; Samaritakis, G.; Petrakis, K.; Doerr, K.; Kritsotaki, A.; Axaridou, A.; Doerr, M. Building and Exploring a Semantic Network of Maritime History Data. In Mediterranean Seafarers in Transition; Brill: Leiden, The Netherlands, 2022; pp. 509–535. [Google Scholar]
- Dimitrov, D.; Baran, E.; Fafalios, P.; Yu, R.; Zhu, X.; Zloch, M.; Dietze, S. TweetsCOV19–A Knowledge Base of Semantically Annotated Tweets about the COVID-19 Pandemic. In Proceedings of the 29th ACM International Conference on Information and Knowledge Management (CIKM 2020), Virtual, 19–23 October 2020. [Google Scholar]
- Sequeda, J.; Lassila, O. Designing and building enterprise knowledge graphs. Synth. Lect. Data, Semant. Knowl. 2021, 11, 1–165. [Google Scholar]
- Weikum, G. Knowledge graphs 2021: A data odyssey. Proc. Vldb Endow. 2021, 14, 3233–3238. [Google Scholar] [CrossRef]
- Antoniou, G.; Van Harmelen, F. A Semantic Web Primer; MIT Press: Cambridge, MA, USA, 2004. [Google Scholar]
- Mountantonakis, M.; Tzitzikas, Y. LODsyndesis: Global Scale Knowledge Services. Heritage 2018, 1, 23. [Google Scholar] [CrossRef]
- Francis, N.; Green, A.; Guagliardo, P.; Libkin, L.; Lindaaker, T.; Marsault, V.; Plantikow, S.; Rydberg, M.; Selmer, P.; Taylor, A. Cypher: An evolving query language for property graphs. In Proceedings of the 2018 International Conference on Management of Data, Houston, TX, USA, 10–15 June 2018; pp. 1433–1445. [Google Scholar]
- Angles, R. The Property Graph Database Model. In Proceedings of the AMW, Cali, Colombia, 21–25 May 2018. [Google Scholar]
- van Rest, O.; Hong, S.; Kim, J.; Meng, X.; Chafi, H. PGQL: A property graph query language. In Proceedings of the Fourth International Workshop on Graph Data Management Experiences and Systems, Redwood Shores, CA, USA, 24 June 2016; pp. 1–6. [Google Scholar]
- Angles, R.; Arenas, M.; Barceló, P.; Boncz, P.; Fletcher, G.; Gutierrez, C.; Lindaaker, T.; Paradies, M.; Plantikow, S.; Sequeda, J.; et al. G-CORE: A core for future graph query languages. In Proceedings of the 2018 International Conference on Management of Data, Houston, TX, USA, 10–15 June 2018; pp. 1421–1432. [Google Scholar]
- Nikas, C.; Kadilierakis, G.; Fafalios, P.; Tzitzikas, Y. Keyword Search over RDF: Is a Single Perspective Enough? Big Data Cogn. Comput. 2020, 4, 22. [Google Scholar] [CrossRef]
- Chatzakis, M.; Mountantonakis, M.; Tzitzikas, Y. RDFsim: Similarity-Based Browsing over DBpedia Using Embeddings. Information 2021, 12, 440. [Google Scholar] [CrossRef]
- Tzitzikas, Y.; Manolis, N.; Papadakos, P. Faceted exploration of RDF/S datasets: A survey. J. Intell. Inf. Syst. 2017, 48, 329–364. [Google Scholar] [CrossRef]
- Kritsotakis, V.; Roussakis, Y.; Patkos, T.; Theodoridou, M. Assistive Query Building for Semantic Data. In Proceedings of the SEMANTICS Posters&Demos, Vienna, Austria, 10–13 September 2018. [Google Scholar]
- Dimitrakis, E.; Sgontzos, K.; Tzitzikas, Y. A survey on question answering systems over linked data and documents. J. Intell. Inf. Syst. 2020, 55, 233–259. [Google Scholar] [CrossRef]
- Abelló, A.; Romero, O.; Pedersen, T.B.; Berlanga, R.; Nebot, V.; Aramburu, M.J.; Simitsis, A. Using semantic web technologies for exploratory OLAP: A survey. IEEE Trans. Knowl. Data Eng. 2014, 27, 571–588. [Google Scholar] [CrossRef] [Green Version]
- Vassiliadis, P.; Sellis, T. A survey of logical models for OLAP databases. ACM Sigmod Rec. 1999, 28, 64–69. [Google Scholar] [CrossRef] [Green Version]
- Mountantonakis, M.; Tzitzikas, Y. Large-scale Semantic Integration of Linked Data: A Survey. ACM Comput. Surv. (CSUR) 2019, 52, 103. [Google Scholar] [CrossRef]
- Ben Ellefi, M.; Bellahsene, Z.; Breslin, J.G.; Demidova, E.; Dietze, S.; Szymański, J.; Todorov, K. RDF dataset profiling—A survey of features, methods, vocabularies and applications. Semant. Web 2018, 9, 677–705. [Google Scholar] [CrossRef] [Green Version]
- Ali, W.; Saleem, M.; Yao, B.; Hogan, A.; Ngomo, A.C.N. A survey of RDF stores & SPARQL engines for querying knowledge graphs. VLDB J. 2021, 31, 1–26. [Google Scholar]
- Van Assche, D.; Delva, T.; Haesendonck, G.; Heyvaert, P.; De Meester, B.; Dimou, A. Declarative RDF graph generation from heterogeneous (semi-) structured data: A systematic literature review. J. Web Semant. 2022, 100753. [Google Scholar] [CrossRef]
- Dadzie, A.S.; Rowe, M. Approaches to visualising linked data: A survey. Semant. Web 2011, 2, 89–124. [Google Scholar] [CrossRef]
- Antoniazzi, F.; Viola, F. RDF graph visualization tools: A survey. In Proceedings of the 2018 23rd Conference of Open Innovations Association (FRUCT), Bologna, Italy, 13–16 November 2018; pp. 25–36. [Google Scholar]
- Čebirić, Š.; Goasdoué, F.; Kondylakis, H.; Kotzinos, D.; Manolescu, I.; Troullinou, G.; Zneika, M. Summarizing semantic graphs: A survey. VLDB J. 2019, 28, 295–327. [Google Scholar] [CrossRef] [Green Version]
- Sridhar, R.; Ravindra, P.; Anyanwu, K. RAPID: Enabling scalable ad-hoc analytics on the semantic web. In Proceedings of the International Semantic Web Conference, Chantilly, VA, USA, 25–29 October 2009; pp. 715–730. [Google Scholar]
- Ravindra, P.; Deshpande, V.V.; Anyanwu, K. Towards scalable RDF graph analytics on MapReduce. In Proceedings of the 2010 Workshop on Massive Data Analytics on the Cloud, Raleigh, NC, USA, 26 April 2010; pp. 1–6. [Google Scholar]
- Bikakis, N.; Skourla, M.; Papastefanatos, G. rdf: SynopsViz—A framework for hierarchical linked data visual exploration and analysis. In Proceedings of the European Semantic Web Conference, Anissaras, Greece, 25–29 May 2014; pp. 292–297. [Google Scholar]
- Zou, L.; Özsu, M.T.; Chen, L.; Shen, X.; Huang, R.; Zhao, D. gStore: A graph-based SPARQL query engine. VLDB J. 2014, 23, 565–590. [Google Scholar] [CrossRef] [Green Version]
- Ibragimov, D.; Hose, K.; Pedersen, T.B.; Zimányi, E. Processing aggregate queries in a federation of SPARQL endpoints. In Proceedings of the European Semantic Web Conference, Bethlehem, PA, USA, 11–15 October 2015; pp. 269–285. [Google Scholar]
- Ibragimov, D.; Hose, K.; Pedersen, T.B.; Zimányi, E. Optimizing aggregate SPARQL queries using materialized RDF views. In Proceedings of the International Semantic Web Conference, Kobe, Japan, 17–21 October 2016; pp. 341–359. [Google Scholar]
- Sherkhonov, E.; Grau, B.C.; Kharlamov, E.; Kostylev, E.V. Semantic faceted search with aggregation and recursion. In Proceedings of the International Semantic Web Conference, Vienna, Austria, 21–25 October 2017; pp. 594–610. [Google Scholar]
- Abdelaziz, I.; Harbi, R.; Salihoglu, S.; Kalnis, P. Combining vertex-centric graph processing with SPARQL for large-scale RDF data analytics. IEEE Trans. Parallel Distrib. Syst. 2017, 28, 3374–3388. [Google Scholar] [CrossRef] [Green Version]
- Ge, N.; Peng, P.; Qin, Z.; Li, M. FedAggs: Optimizing Aggregate Queries Evaluation in Federated RDF Systems. In Proceedings of the International Conference on Web Information Systems Engineering, Melbourne, VIC, Australia, 26–29 October 2021; pp. 527–535. [Google Scholar]
- Ferré, S. Analytical Queries on Vanilla RDF Graphs with a Guided Query Builder Approach. In Proceedings of the International Conference on Flexible Query Answering Systems, Bratislava, Slovakia, 19–24 September 2021; pp. 41–53. [Google Scholar]
- Papadaki, M.E.; Spyratos, N.; Tzitzikas, Y. Towards interactive analytics over RDF graphs. Algorithms 2021, 14, 34. [Google Scholar] [CrossRef]
- Kharlamov, E.; Giacomelli, L.; Sherkhonov, E.; Grau, B.C.; Kostylev, E.V.; Horrocks, I. Semfacet: Making hard faceted search easier. In Proceedings of the 2017 ACM on Conference on Information and Knowledge Management, Singapore, 6–10 November 2017; pp. 2475–2478. [Google Scholar]
- Ferré, S. Sparklis: An expressive query builder for SPARQL endpoints with guidance in natural language. Semant. Web 2017, 8, 405–418. [Google Scholar] [CrossRef] [Green Version]
- Spyratos, N.; Sugibuchi, T. HIFUN-a high level functional query language for big data analytics. J. Intell. Inf. Syst. 2018, 51, 529–555. [Google Scholar] [CrossRef]
- Zhao, P.; Li, X.; Xin, D.; Han, J. Graph cube: On warehousing and OLAP multidimensional networks. In Proceedings of the 2011 ACM SIGMOD International Conference on Management of Data, Athens, Greece, 12–16 June 2011. [Google Scholar]
- Hoefler, P.; Granitzer, M.; Sabol, V.; Lindstaedt, S. Linked data query wizard: A tabular interface for the semantic web. In Proceedings of the Extended Semantic Web Conference, Sydney, NSW, Australia, 21–25 October 2013; pp. 173–177. [Google Scholar]
- Klímek, J.; Helmich, J.; Nečaskỳ, M. Payola: Collaborative linked data analysis and visualization framework. In Proceedings of the Extended Semantic Web Conference, Sydney, NSW, Australia, 21–25 October 2013; pp. 147–151. [Google Scholar]
- Tschinkel, G.; Veas, E.E.; Mutlu, B.; Sabol, V. Using Semantics for Interactive Visual Analysis of Linked Open Data. In Proceedings of the ISWC (Posters & Demos), Riva del Garda, Italy, 21 October 2014; pp. 133–136. [Google Scholar]
- Azirani, E.A.; Goasdoué, F.; Manolescu, I.; Roatiş, A. Efficient OLAP operations for RDF analytics. In Proceedings of the 2015 31st IEEE International Conference on Data Engineering Workshops, Bologna, Italy, 13–16 November 2015; pp. 71–76. [Google Scholar]
- Jakobsen, K.A.; Andersen, A.B.; Hose, K.; Pedersen, T.B. Optimizing RDF Data Cubes for Efficient Processing of Analytical Queries. In Proceedings of the COLD, Bethlehem, AR, USA, 12 October 2015. [Google Scholar]
- Martin, M.; Abicht, K.; Stadler, C.; Ngonga Ngomo, A.C.; Soru, T.; Auer, S. Cubeviz: Exploration and visualization of statistical linked data. In Proceedings of the 24th International Conference on World Wide Web, Florence, Italy, 18–22 May 2015; pp. 219–222. [Google Scholar]
- Beheshti, S.M.R.; Benatallah, B.; Motahari-Nezhad, H.R. Scalable graph-based OLAP analytics over process execution data. Distrib. Parallel Databases 2016, 34, 379–423. [Google Scholar] [CrossRef]
- Ferrari, A.; Russo, M. Introducing Microsoft Power BI; Microsoft Press: Redmond, WA, USA, 2016. [Google Scholar]
- Loth, A. Visual analytics with Tableau; John Wiley & Sons: New York, NY, USA, 2019. [Google Scholar]
- Bikakis, N.; Papastefanatos, G.; Skourla, M.; Sellis, T. A hierarchical framework for efficient multilevel visual exploration and analysis. CoRR 2015, abs/1511.04750. [Google Scholar] [CrossRef] [Green Version]
- Etcheverry, L.; Vaisman, A.A. QB4OLAP: A new vocabulary for OLAP cubes on the semantic web. In Proceedings of the Third International Conference on Consuming Linked Data, Boston, MA, USA, 12 November 2012; Volume 905, pp. 27–38. [Google Scholar]
- Abicht, K.; Alkhouri, G.; Arndt, N.; Meissner, R.; Martin, M. CubeViz. js: A lightweight Framework for Discovering and Visualizing RDF Data Cubes; Gesellschaft für Informatik: Bonn, Germany, 2017. [Google Scholar]
- Reddy, C.S.; Sangam, R.S.; Srinivasa Rao, B. A survey on business intelligence tools for marketing, financial, and transportation services. In Smart Intelligent Computing and Applications; Springer: Berlin, Germany, 2019; pp. 495–504. [Google Scholar]
- Town, P.; Thabtah, F. Data analytics tools: A user perspective. J. Inf. Knowl. Manag. 2019, 18, 1950002. [Google Scholar] [CrossRef]
- Rajeswari, C.; Basu, D.; Maurya, N. Comparative Study of Big data Analytics Tools: R and Tableau. In Proceedings of the IOP Conference Series: Materials Science and Engineering, Vellore, India, 2–3 May 2017; Volume 263, p. 042052. [Google Scholar]
- Nair, L.; Shetty, S.; Shetty, S. Interactive visual analytics on Big Data: Tableau vs D3. js. J. e-Learn. Knowl. Soc. 2016, 12. [Google Scholar] [CrossRef]
- Kamdar, M.R.; Musen, M.A. PhLeGrA: Graph analytics in pharmacology over the web of life sciences linked open data. In Proceedings of the 26th International Conference on World Wide Web, Perth, Australia, 3–7 April 2017; pp. 321–329. [Google Scholar]
- Hasan, S.S.; Rivera, D.; Wu, X.C.; Durbin, E.B.; Christian, J.B.; Tourassi, G. Knowledge graph-enabled cancer data analytics. IEEE J. Biomed. Health Inform. 2020, 24, 1952–1967. [Google Scholar] [CrossRef] [PubMed]
- Michel, F.; Gandon, F.; Ah-Kane, V.; Bobasheva, A.; Cabrio, E.; Corby, O.; Gazzotti, R.; Giboin, A.; Marro, S.; Mayer, T.; et al. Covid-on-the-Web: Knowledge graph and services to advance COVID-19 research. In Proceedings of the International Semantic Web Conference, Athens, Greece, 2–6 November 2020; pp. 294–310. [Google Scholar]
- Sakor, A.; Jozashoori, S.; Niazmand, E.; Rivas, A.; Bougiatiotis, K.; Aisopos, F.; Iglesias, E.; Rohde, P.D.; Padiya, T.; Krithara, A.; et al. Knowledge4COVID-19: A semantic-based approach for constructing a COVID-19 related knowledge graph from various sources and analysing treatments’ toxicities. J. Web Semant. 2022, 75, 100760. [Google Scholar] [CrossRef] [PubMed]
- Manghi, P.; Bardi, A.; Atzori, C.; Baglioni, M.; Manola, N.; Schirrwagen, J.; Principe, P.; Artini, M.; Becker, A.; De Bonis, M.; et al. The OpenAIRE research graph data model. Zenodo 2019. [Google Scholar]
- Fafalios, P.; Petrakis, K.; Samaritakis, G.; Doerr, K.; Kritsotaki, A.; Tzitzikas, Y.; Doerr, M. FAST CAT: Collaborative data entry and curation for semantic interoperability in digital humanities. J. Comput. Cult. Herit. (JOCCH) 2021, 14, 1–20. [Google Scholar] [CrossRef]
- Tamper, M.; Leskinen, P.; Hyvönen, E.; Valjus, R.; Keravuori, K. Analyzing Biography Collections Historiographically as Linked Data: Case National Biography of Finland. Semant. Web 2023, 14, 385–419. [Google Scholar] [CrossRef]
- Alexander, K.; Cyganiak, R.; Hausenblas, M.; Zhao, J. Describing linked datasets with the VoID vocabulary. In Proceedings of the WWW Workshop: Linked Data on the Web (LDOW2009), Madrid, Spain, 20–24 April 2009. [Google Scholar]
- Salast, P.E.R.; Martin, M.; Da Mota, F.M.; Auer, S.; Breitman, K.K.; Casanova, M.A. Olap2datacube: An ontowiki plug-in for statistical data publishing. In Proceedings of the 2012 Second International Workshop on Developing Tools as Plug-Ins (TOPI), Zurich, Switzerland, 3 June 2012; pp. 79–83. [Google Scholar]
- Zancanaro, A.; Pizzol, L.; Speroni, R.; Todesco, J.L.; Gauthier, F. Publishing multidimensional statistical linked data. In Proceedings of the Fifth International Conference on Information, Process, and Knowledge Management, Nice, France, 24 February–1 March 2013; pp. 290–304. [Google Scholar]
- Mäkelä, E. Aether–generating and viewing extended VoID statistical descriptions of RDF datasets. In Proceedings of the European Semantic Web Conference, Riva del Garda, Italy, 19–23 October 2014; pp. 429–433. [Google Scholar]
- Mihindukulasooriya, N.; Poveda-Villalón, M.; García-Castro, R.; Gómez-Pérez, A. Loupe-An Online Tool for Inspecting Datasets in the Linked Data Cloud. In Proceedings of the ISWC (Posters & Demos), Bethlehem, PA, USA, 11 October 2015. [Google Scholar]
- Mountantonakis, M.; Allocca, C.; Fafalios, P.; Minadakis, N.; Marketakis, Y.; Lantzaki, C.; Tzitzikas, Y. Extending VoID for Expressing Connectivity Metrics of a Semantic Warehouse. In Proceedings of the PROFILES@ ESWC, Anissaras, Greece, 26 May 2014. [Google Scholar]
- Hasnain, A.; Mehmood, Q.; e Zainab, S.S.; Hogan, A. Sportal: Profiling the content of public sparql endpoints. Int. J. Semant. Web Inf. Syst. (IJSWIS) 2016, 12, 134–163. [Google Scholar] [CrossRef] [Green Version]
- Görlitz, O.; Staab, S. SPLENDID: SPARQL endpoint federation exploiting VOID descriptions. In Proceedings of the Second International Conference on Consuming Linked Data, Bonn, Germany, 23 October 2011. [Google Scholar]
- Maillot, P.; Corby, O.; Faron, C.; Gandon, F.; Michel, F. KartoGraphI: Drawing a Map of Linked Data. In Proceedings of the ESWC 2022—19th European Semantic Web Conferences, Hersonissos, Greece, 29 May–2 June 2022. [Google Scholar]
- Theoharis, Y.; Tzitzikas, Y.; Kotzinos, D.; Christophides, V. On graph features of semantic web schemas. IEEE Trans. Knowl. Data Eng. 2008, 20, 692–702. [Google Scholar] [CrossRef]
- Baron Neto, C.; Müller, K.; Brümmer, M.; Kontokostas, D.; Hellmann, S. Lodvader: An interface to lod visualization, analyticsand discovery in real-time. In Proceedings of the 25th International Conference Companion on World Wide Web, Montréal, QC, Canada, 11–15 April 2016; pp. 163–166. [Google Scholar]
- Ermilov, I.; Lehmann, J.; Martin, M.; Auer, S. LODStats: The data web census dataset. In Proceedings of the International Semantic Web Conference, Kobe, Japan, 17–21 October 2016; pp. 38–46. [Google Scholar]
- Beek, W.; Fernández, J.D.; Verborgh, R. LOD-a-lot: A single-file enabler for data science. In Proceedings of the 13th International Conference on Semantic Systems, Amsterdam, The Netherlands, 11–14 September 2017; pp. 181–184. [Google Scholar]
- Soulet, A.; Suchanek, F.M. Anytime large-scale analytics of linked open data. In Proceedings of the International Semantic Web Conference, Auckland, New Zealand, 26–30 October 2019; pp. 576–592. [Google Scholar]
- Haller, A.; Fernández, J.D.; Kamdar, M.R.; Polleres, A. What are links in linked open data? A characterization and evaluation of links between knowledge graphs on the web. J. Data Inf. Qual. (JDIQ) 2020, 12, 1–34. [Google Scholar] [CrossRef]
- Mountantonakis, M.; Tzitzikas, Y. LODChain: Strengthen the connectivity of your RDF dataset to the rest LOD Cloud. In Proceedings of the International Semantic Web Conference, Virtual Event, 23–27 October 2022; pp. 537–555. [Google Scholar]
- Tiddi, I.; Schlobach, S. Knowledge graphs as tools for explainable machine learning: A survey. Artif. Intell. 2022, 302, 103627. [Google Scholar] [CrossRef]
- Tzitzikas, Y.; Kotzinos, D.; Theoharis, Y. On Ranking RDF Schema Elements (and its Application in Visualization). J. Univers. Comput. Sci. 2007, 13, 1854–1880. [Google Scholar]
- Zampetakis, S.; Tzitzikas, Y.; Leonidis, A.; Kotzinos, D. Star-like auto-configurable layouts of variable radius for visualizing and exploring RDF/S ontologies. J. Vis. Lang. Comput. 2012, 23, 137–153. [Google Scholar] [CrossRef]


| Work/System | Evaluation | Offers Visualization | Visualization Type | Year |
|---|---|---|---|---|
| Sridhar et al. [35] | ✔ | - | 2009 | |
| Ravindra et al. [36] | ✔ | - | 2010 | |
| Bikakis et al. [37] | ✔ | Treemap, bar chart | 2014 | |
| Zou et al. [38] | ✔ | - | 2014 | |
| Ibragimov et al. [39] | ✔ | - | 2015 | |
| Ibragimov et al. [40] | ✔ | - | 2016 | |
| Sherkhonov et al. [41] | - | 2017 | ||
| Abdelaziz et al. [42] | ✔ | - | 2017 | |
| Ge et al. [43] | ✔ | - | 2021 | |
| Ferré et al. [44] | ✔ | ✔ | Table, map | 2021 |
| Papadaki et al. [45] | - | 2021 |
| System/Work | Evaluation | Offers Visualization | Visualization Type | Year |
|---|---|---|---|---|
| Zhao et al. [49] | ✔ | - | 2011 | |
| Hoefler et al. [50] | ✔ | ✔ | Tabular | 2013 |
| Payola [51] | ✔ | ✔ | Various charts, i.e., line, bar, column, area, polar, pie, graph charts | 2013 |
| Vis-Wizard [52] | ✔ | ✔ | Various charts, e.g., bubble, pie, column, line, area, geo etc. | 2014 |
| Azirani et al. [53] | - | 2015 | ||
| Jakobsen et al. [54] | ✔ | - | 2015 | |
| CubeViz [55] | ✔ | Various charts, e.g., pie, bar, column, line | 2015 | |
| Benetallah et al. [56] | ✔ | - | 2016 | |
| Microsoft Power BI [57] | ✔ | Various charts e.g., bar, column, pie, area, treemap ect. | 2016 | |
| Tableau [58] | ✔ | Various charts, e.g., column, bar, pie, line, area, map etc. | 2019 |
| Work/System | Analytical Queries for | Based on | Number of Sources | Publication Year |
|---|---|---|---|---|
| Theoharis et al. [82] | Power-Law Distributions | Graph Metrics | 250 RDF schemas | 2008 |
| LODVader [83] | Exploration, Dataset Discovery | Indexes | 491 RDF datasets | 2016 |
| LODStats [84] | Coverage, Quality | Indexes | 9960 RDF datasets | 2016 |
| LOD-a-Lot [85] | Power-Law Distributions | Indexes | 650 K RDF documents | 2017 |
| LODsyndesis [16] | Connectivity, Dataset Discovery, Coverage | Indexes and Lattice-based measurements | 400 RDF datasets | 2018 |
| Soulet et al. [86] | Elements Distribution | SPARQL Queries | 114 RDF triplestores | 2019 |
| Haller et al. [87] | Elements Distribution, Quality of URIs | SPARQL queries | 430 RDF datasets | 2020 |
| LODChain [16] | Connectivity, Dataset Discovery | Real time lattice-based measurements | A single RDF dataset (connected at real time with 400 RDF datasets) | 2022 |
Disclaimer/Publisher’s Note: The statements, opinions and data contained in all publications are solely those of the individual author(s) and contributor(s) and not of MDPI and/or the editor(s). MDPI and/or the editor(s) disclaim responsibility for any injury to people or property resulting from any ideas, methods, instructions or products referred to in the content. |
© 2023 by the authors. Licensee MDPI, Basel, Switzerland. This article is an open access article distributed under the terms and conditions of the Creative Commons Attribution (CC BY) license (https://creativecommons.org/licenses/by/4.0/).
Share and Cite
Papadaki, M.-E.; Tzitzikas, Y.; Mountantonakis, M. A Brief Survey of Methods for Analytics over RDF Knowledge Graphs. Analytics 2023, 2, 55-74. https://doi.org/10.3390/analytics2010004
Papadaki M-E, Tzitzikas Y, Mountantonakis M. A Brief Survey of Methods for Analytics over RDF Knowledge Graphs. Analytics. 2023; 2(1):55-74. https://doi.org/10.3390/analytics2010004
Chicago/Turabian StylePapadaki, Maria-Evangelia, Yannis Tzitzikas, and Michalis Mountantonakis. 2023. "A Brief Survey of Methods for Analytics over RDF Knowledge Graphs" Analytics 2, no. 1: 55-74. https://doi.org/10.3390/analytics2010004