

Smart Multimedia Information Retrieval


1
Faculty of Mathematics and Computer Science, University of Hagen, Universitätsstrasse 1, D-58097 Hagen, Germany
2
Academy for International Science & Research (AISR), Derry BT48 7JL, Northern Ireland, UK
*
Author to whom correspondence should be addressed.
Analytics 2023, 2(1), 198-224; https://doi.org/10.3390/analytics2010011
Submission received: 11 October 2022
/
Revised: 30 January 2023
/
Accepted: 16 February 2023
/
Published: 20 February 2023
Abstract
:The area of multimedia information retrieval (MMIR) faces two major challenges: the enormously growing number of multimedia objects (i.e., images, videos, audio, and text files), and the fast increasing level of detail of these objects (e.g., the number of pixels in images). Both challenges lead to a high demand of scalability, semantic representations, and explainability of MMIR processes. Smart MMIR solves these challenges by employing graph codes as an indexing structure, attaching semantic annotations for explainability, and employing application profiling for scaling, which results in human-understandable, expressive, and interoperable MMIR. The mathematical foundation, the modeling, implementation detail, and experimental results are shown in this paper, which confirm that Smart MMIR improves MMIR in the area of efficiency, effectiveness, and human understandability.
Keywords:
indexing; retrieval; explainability; semantic; multimedia; feature graph; graph code; information retrieval1. Introduction and Motivation
Multimedia is everywhere. This describes the current state of the art of information and digital media representation in everyone’s daily life. All of us are living in a world where digital media (i.e., multimedia objects, such as images, video, text, audio) communicate and represent information of any kind, at any time, for any topic, and any target group. Remarkable statistics from social media [1] outline that every single minute, as of April 2022, 66,000 photos are shared on Instagram, 500 h of video are uploaded to YouTube, 2,430,000 snaps are shared on Snapchat, 1,700,000 elements of multimedia content are posted on Facebook, and 231,400,000 e-mails with media are sent. These large volumes are constantly increasing, which, of course, leads to challenges for the underlying infrastructure and information retrieval systems. In addition, all these digital media objects continue evolving and, for example, also constantly increase their level of detail (i.e., the amount of transported information), as well. Current smartphones, such as the Xiaomi 12T Pro, have camera sensors with 200 megapixel producing images with an enhanced level of detail. The greater the level of detail that a multimedia object has, the more information can be stored, which needs to be maintained, indexed, visualized, distributed, and also retrieved.
In this paper, we summarize previous work from an application perspective and provide solutions for the open challenges of each problem area. The resulting challenges for multimedia information retrieval (MMIR) can be summarized in three major problem areas: (1) interoperability and integration, (2) scalability, and (3) explainability and expressiveness:
- In the area of interoperability and integration, applications require flexible, configurable, and exchangeable processing flows which are also distributable through organizational units or computational instances. This means that the extraction of multimedia features and their integration can be different depending on an application’s focus. Furthermore, the increasing number of feature extractors requires a mechanism to integrate features from various extractors, detect inconsistencies, and calculate the relevance of each feature.
- In the area of scalability, the high volume of multimedia objects and their increasing level of detail needs to be reflected by application architectures for the distribution of MMIR processing steps. Scalability becomes more important for modern, cloud-based architectures.
- The increase in interoperability and integration, as well as the improved scalability, also need to be reflected in the area of explainability and expressiveness. Here, further user interface (UI) components explaining certain MMIR processing steps are required, as well as further techniques for content-based validation and optimization.
We use the term “Smart MMIR” to describe systems, algorithms, software, or user interfaces that provide solutions for these three problem areas. “Smart MMIR” thus describes expressive, scalable, interoperable, explainable and human understandable MMIR solutions. In previous work [2,3,4], we already introduced, defined, and evaluated the core components, which contribute to Smart MMIR. However, the interoperability of these components and a corresponding formal model is a foundation for further improvements in the problem areas, which were mentioned above. In this paper, we formally describe these improvements, align them with or base them on existing algorithms and methodologies, discuss implementation details, and give evaluation results, which finally leads to a platform and model for smart multimedia information retrieval applications.
The structure of this paper follows the problem-solving methodology of Nunamaker et al. [5] and describes the current state of the art in Section 2, the theory building, i.e., modeling and design of the proposed solution in Section 3, implementation examples in Section 4, and the results of the evaluation in Section 5. In each section, the problem areas mentioned above are addressed in corresponding subsections. Finally, Section 6 summarizes the results.
2. State of the Art and Related Work
In this section, the state of the art and related work for Smart MMIR is summarized. An overall framework and corresponding research is discussed in Section 2.1. The area of scalability and distributed MMIR processing is outlined in Section 2.2, and the introduction of human-understandable semantic annotations is given in Section 2.3.
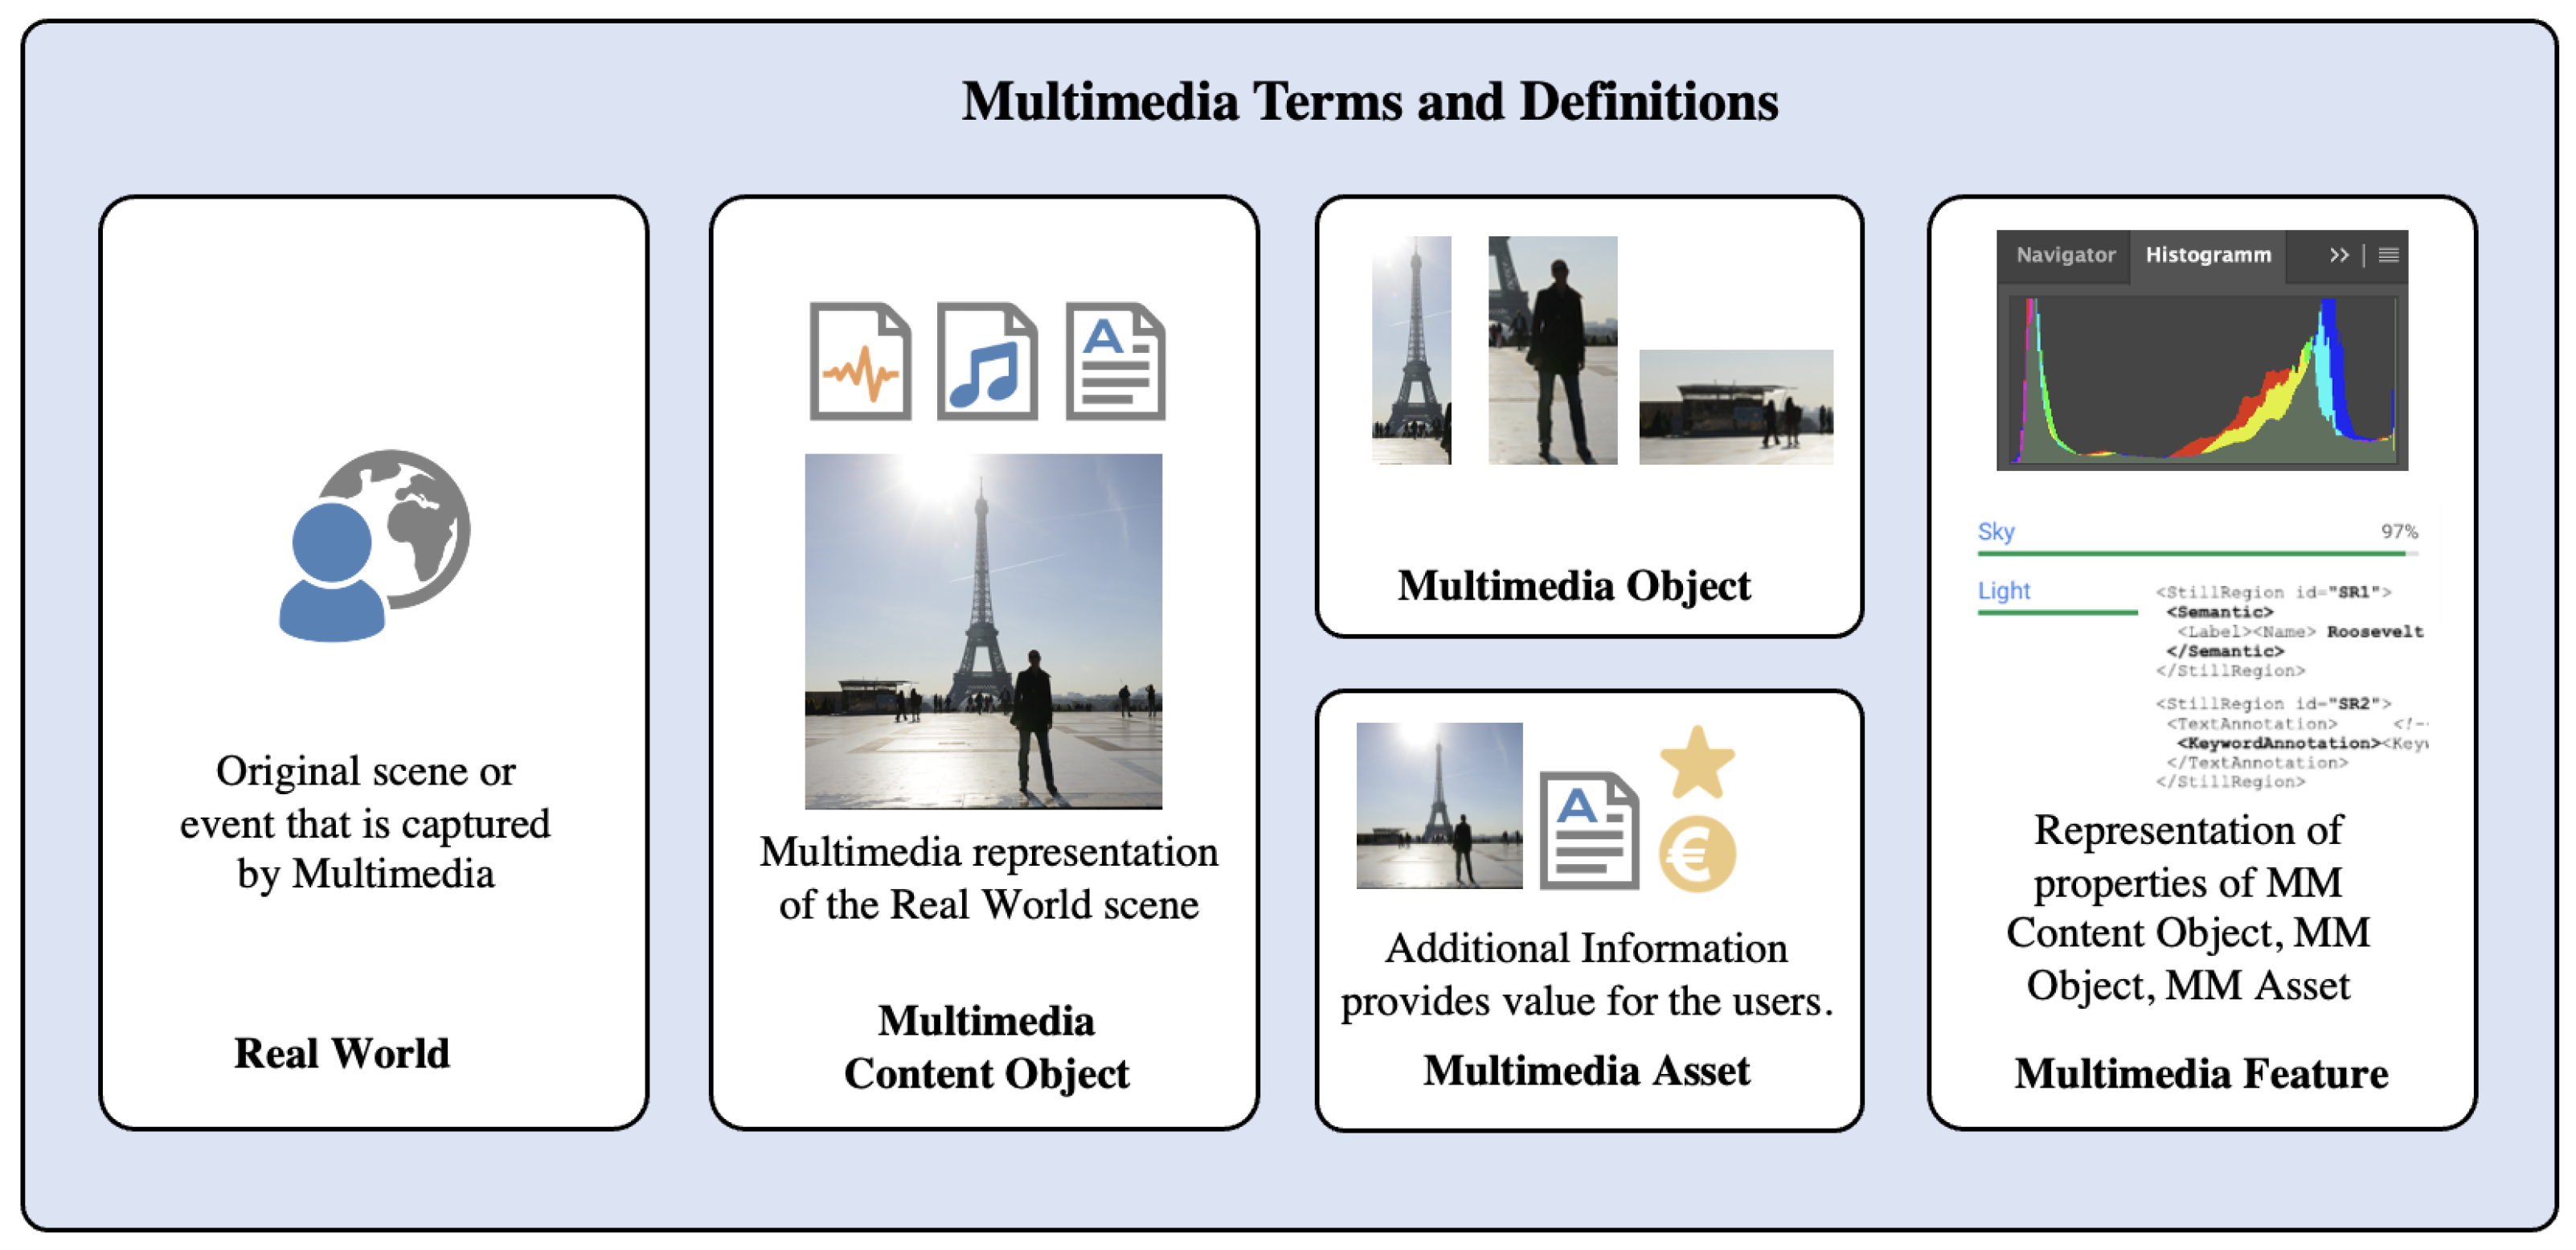
In the remainder of this paper, we use the following terms to describe various MM relationships and objects (see also Figure 1):
- Real-world object: the objects that are captured by some MM recording.
- MM content object: a MM representation, typically as a MM file of the real-world scene or event.
- MM object: an object within a MM content object, e.g., a detected person or an audio track within a video.
- MM asset: some MM objects might have a value for users or applications, e.g., when a license is attached or when users mark MM objects as “favorites”.
- MM feature: represents the features of MM objects, MM assets, or MM content objects.
Of course, for each MM content object, various digital formats exist. A comprehensive overview is given in [6] by the U.S. Library of Congress. For images, these are such formats as PNG, GIF, JPEG, TIFF, RAW, or BMP. For videos, such standards as MOV, MPG, MP4, or MXF, exist. Audio objects can be represented by digital formats, such as MP3, WAV, AIFF, or MIDI, and textual information can be stored in, for example, DOCX, TXT, RTF, XML, HTML, or JSON files. All these formats have different purposes, prerequisites, properties, and digital representations of MM features, and many of these formats can be combined to represent multi-media objects, literally. Working with and integrating all these different MM content objects is a challenge for MMIR applications.
2.1. Integration Area
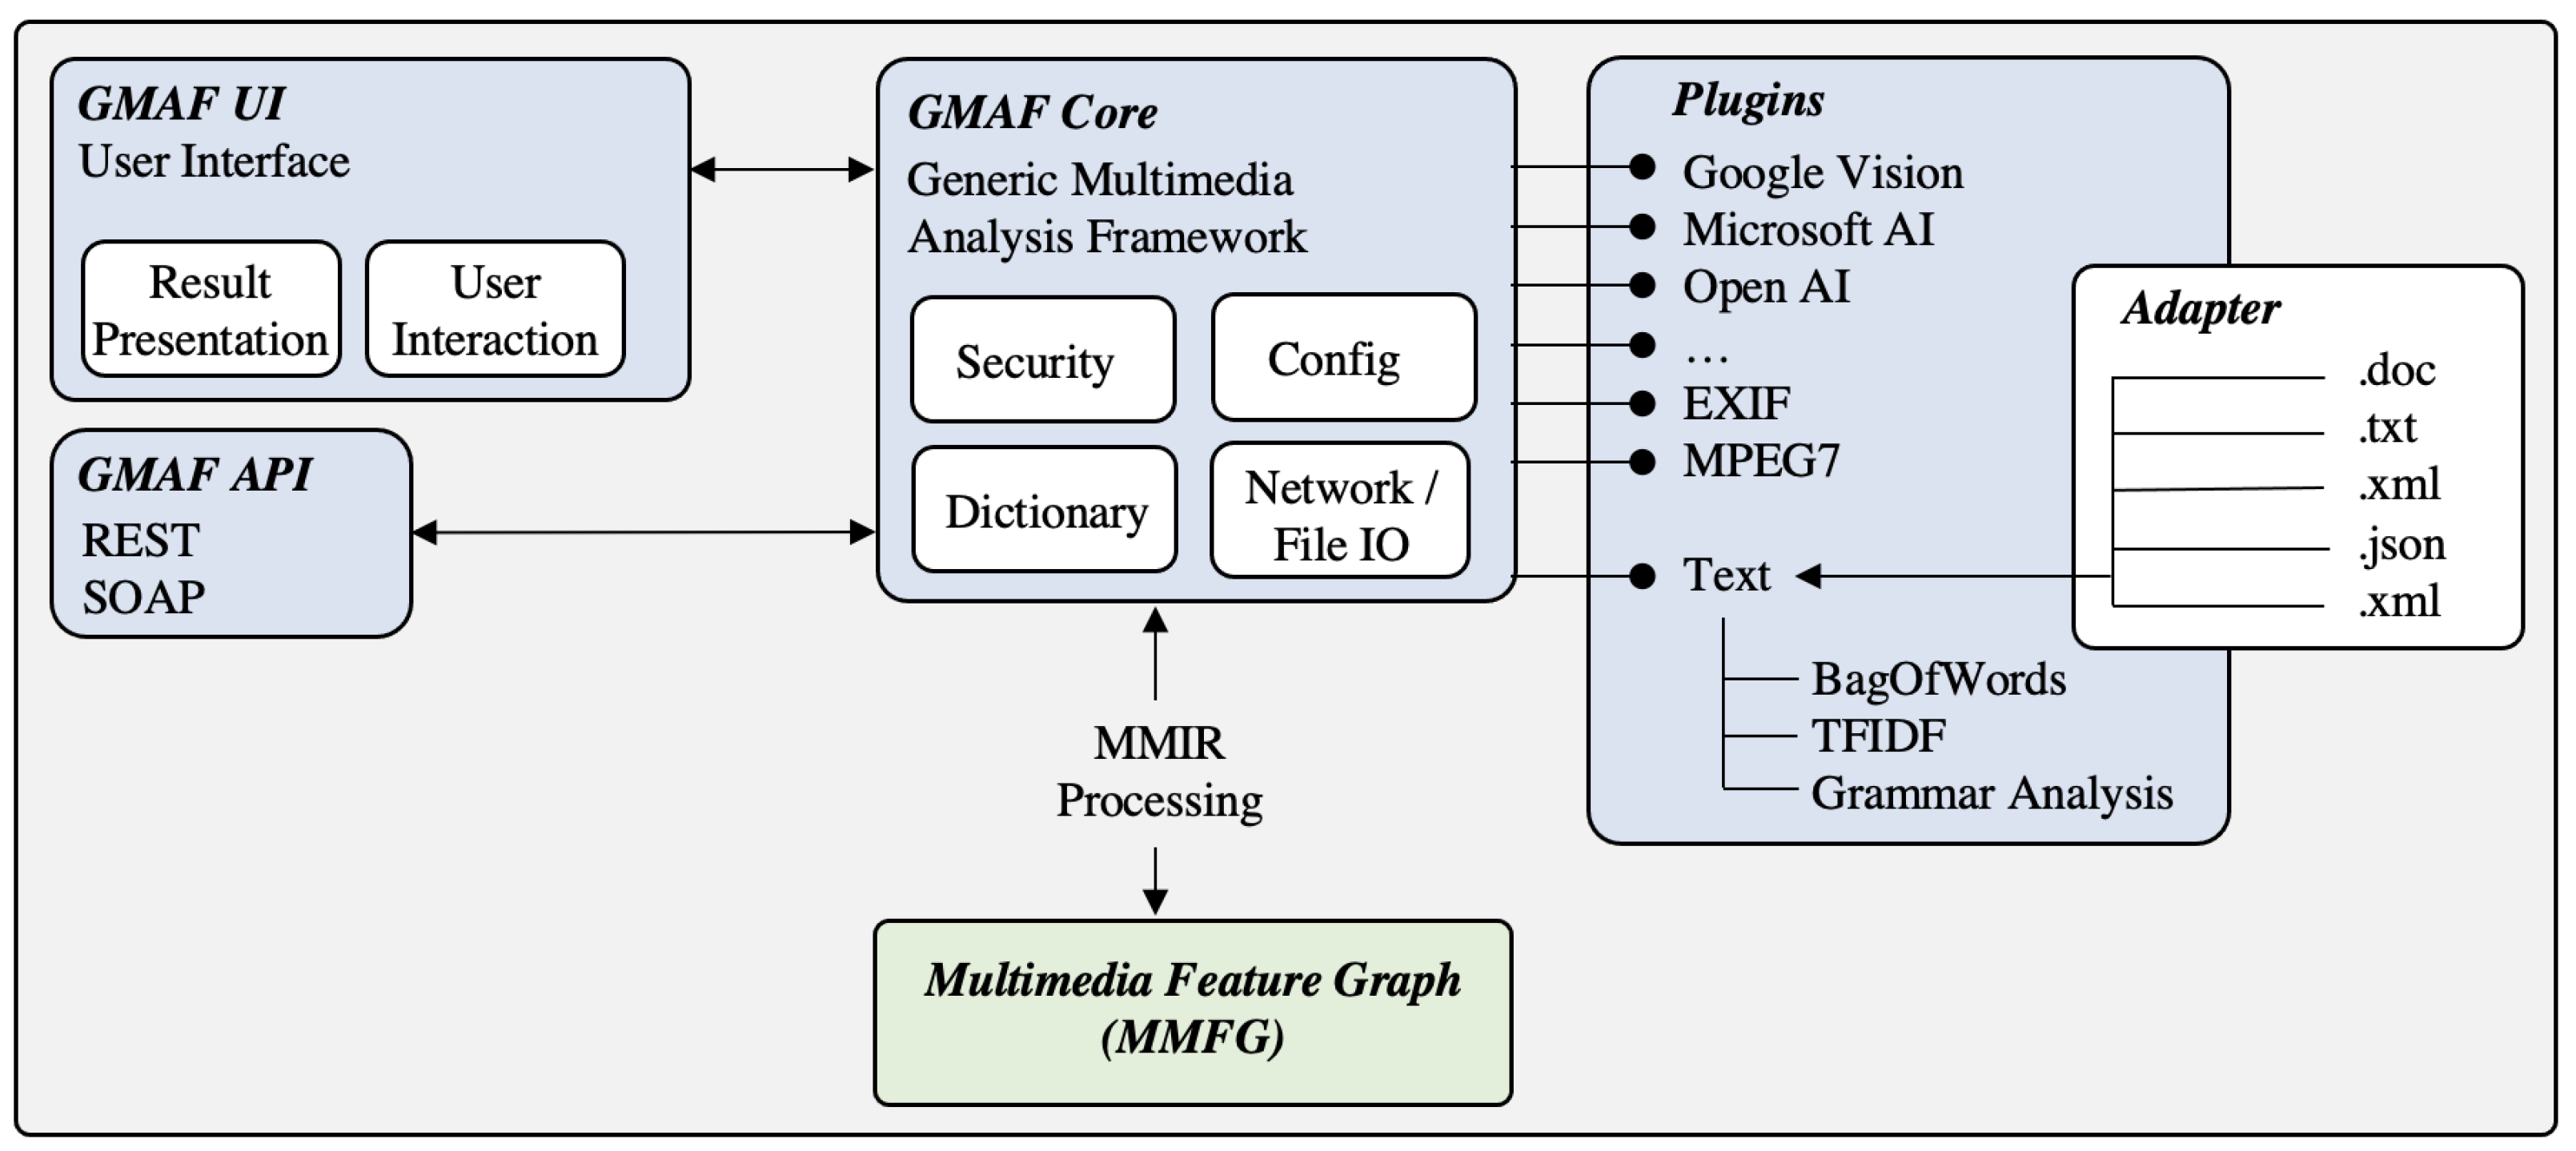
In our previous and related work [7], we introduced a generic multimedia analysis framework (GMAF), which provides a flexible plugin architecture for the integration of plugins for the extraction of MM features of different MM content objects (see Figure 2).
The GMAF provides a flexible, extendable API for the integration of plugins, which encapsulate the extraction of MM features of a certain MM content object type. All plugins contribute to the detected MM features to a generic data structure, the multimedia feature graph (MMFG) [2].
However, there are two remaining challenges: (1) Currently, many different plugins are available for the extraction of MM features. This can lead to contradictions, refinements, or confirmations of detection results. Hence, a mechanism is required for the integration or fusion of MM features detected by different GMAF plugins. (2) The GMAF is currently based on a static configuration. This means, that all MM content objects are processed in a similar way according their content type. However, many applications need a flexible definition of processing instructions. Therefore, a flexible and configurable structure is required to support application-based processing flows.
Another important related work is IVIS4BigData [8], where an architecture for the visualization of information is presented, which can also serve as an architectural model to process raw data into structured data, and apply analytic algorithms to it. The corresponding information model in the area of multimedia can be represented by the stratification model [9], which forms a (optionally time-based) set of different layers that segments the contextual data contained in, for example, a video, into multiple layers called strata. By employing this, feature information of various multimedia layers can also be identified for a certain point of time, e.g., within a video. Such a model can contribute to the modeling of processing flows, which is outlined in Section 3.
2.2. Scalability Area
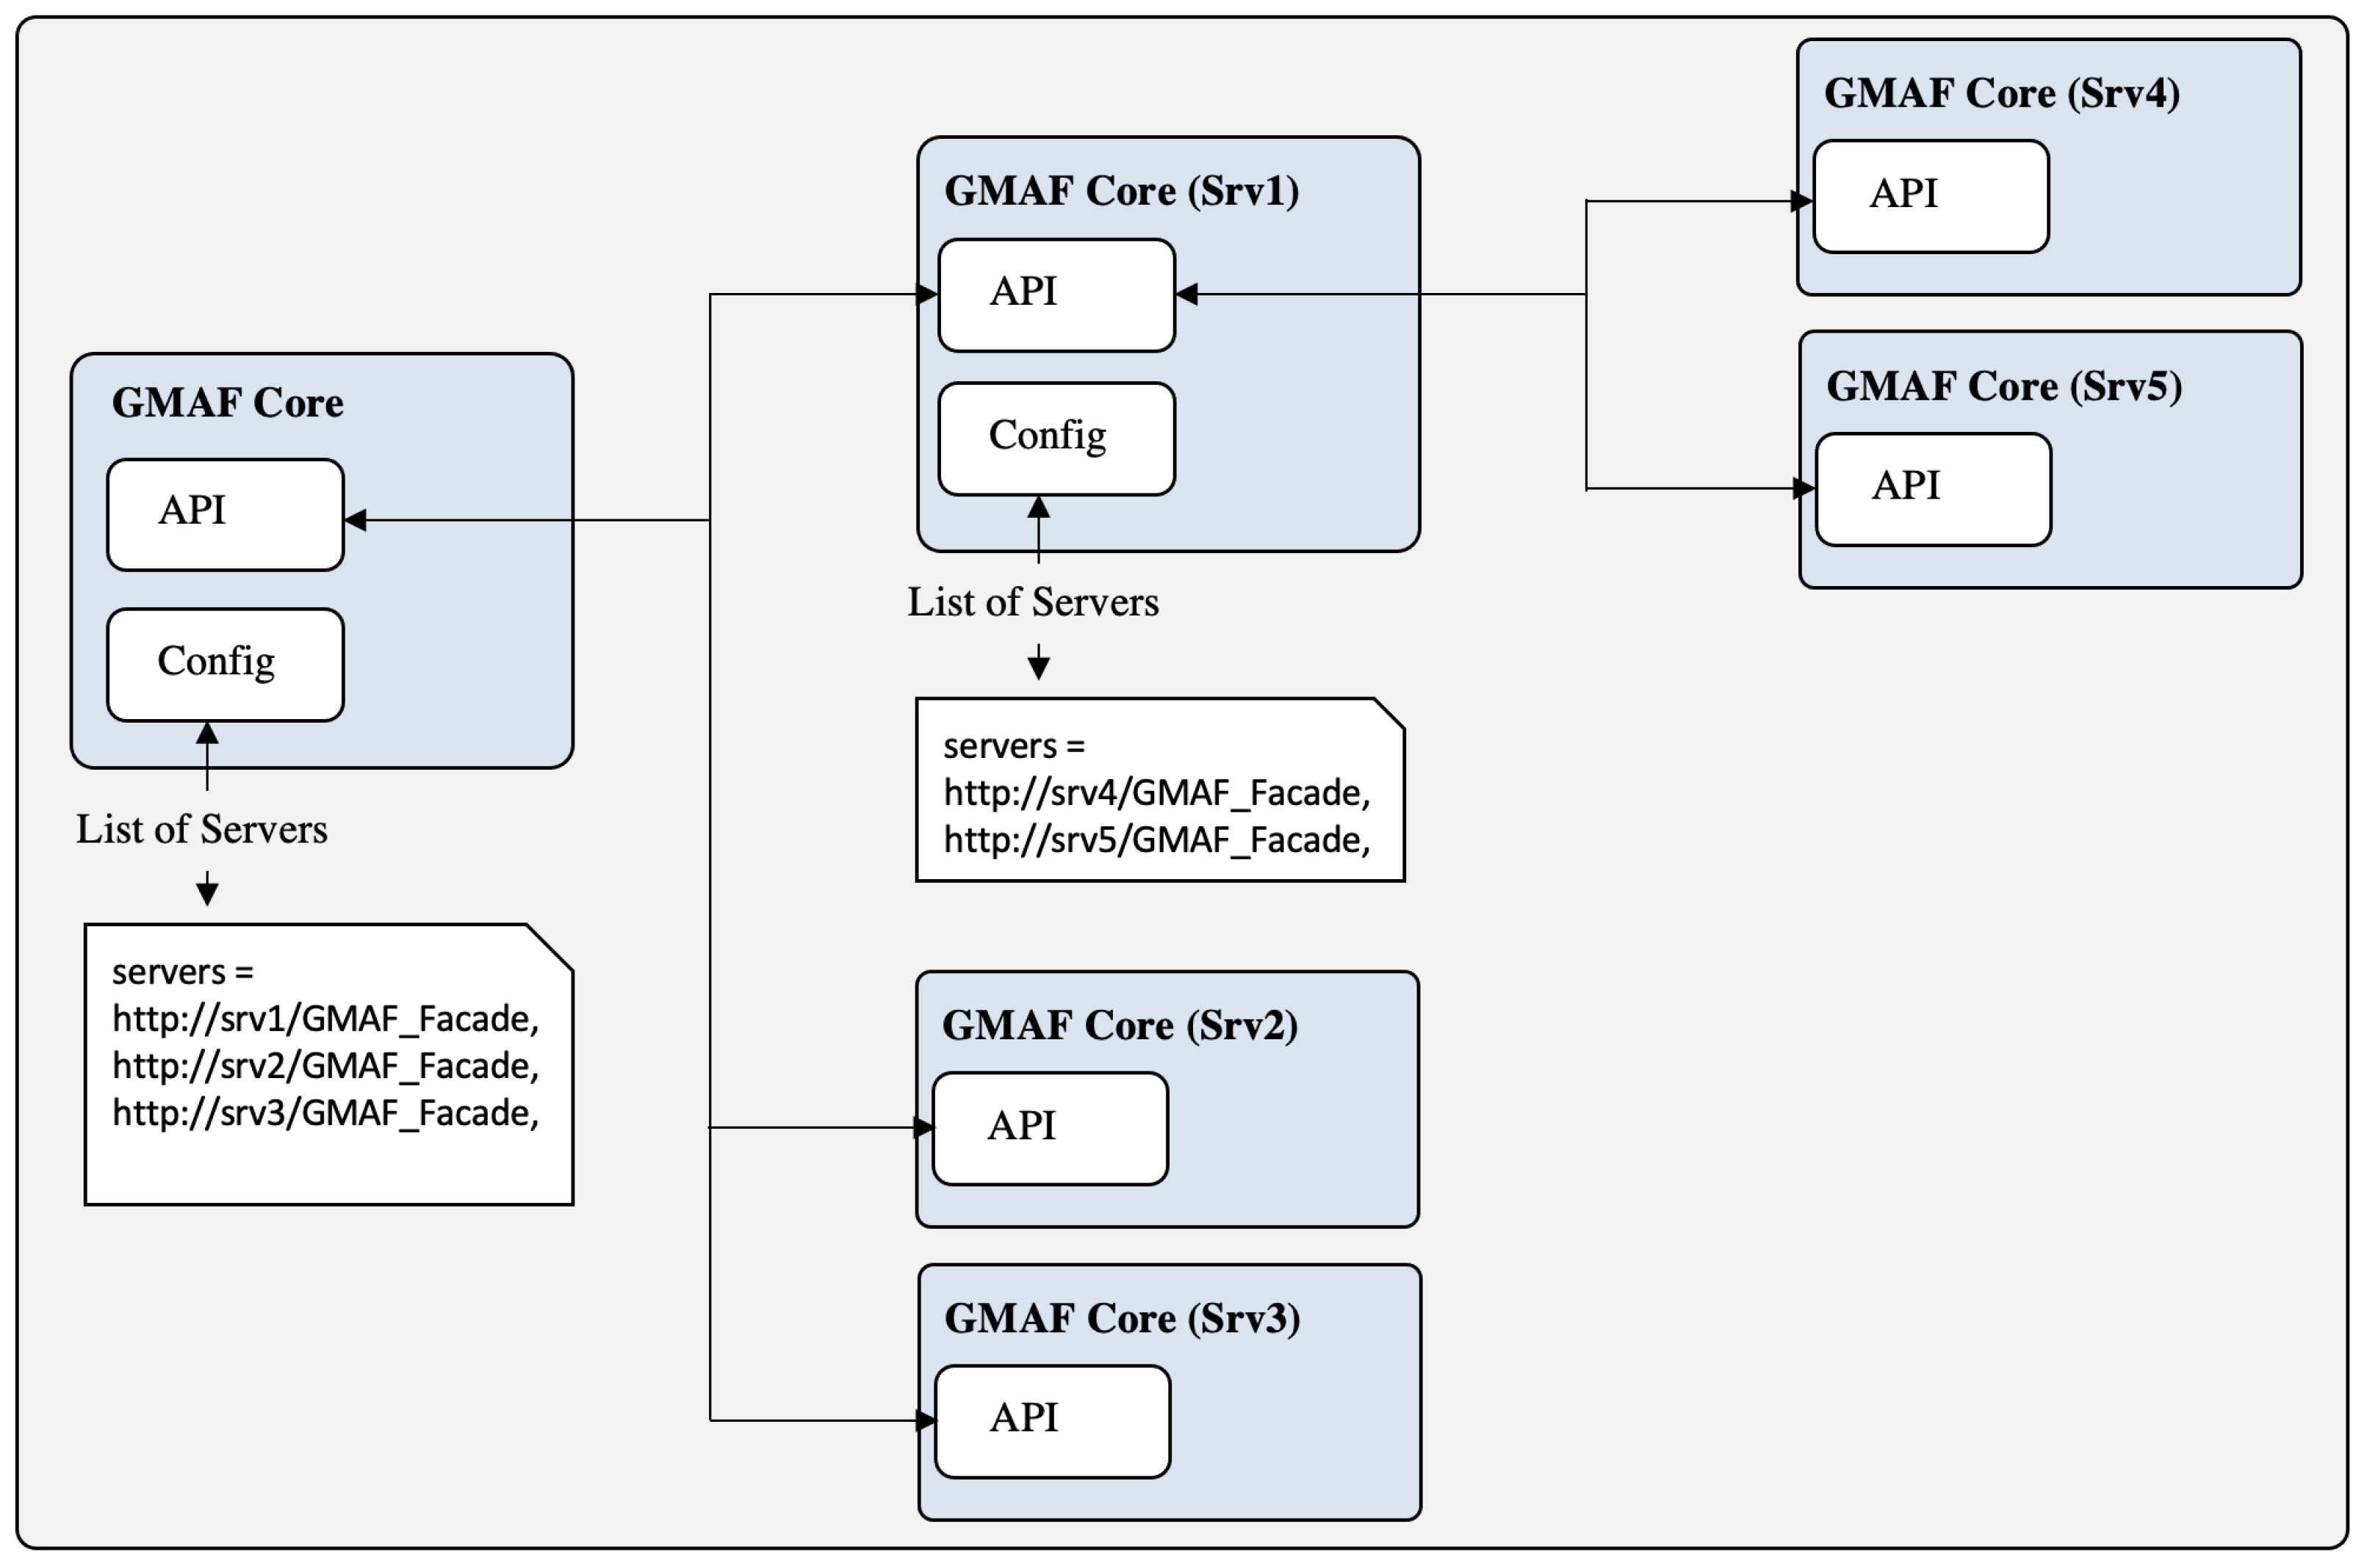
Due to the increasing level of detail of many MM content objects, the number of nodes and edges in the corresponding MMFGs increases rapidly. To mitigate this resource constraint, as a first step, the GMAF is designed to be horizontally scalable, i.e., multiple GMAF nodes can be arranged for distributed processing (see Figure 3). However, many graph-based operations have polynomial or even exponential time complexity [10]. As horizontal scaling does not reduce the complexity as such, further optimizations in terms of scalability must be made. Hence, in [7], we introduce the concept of graph codes.
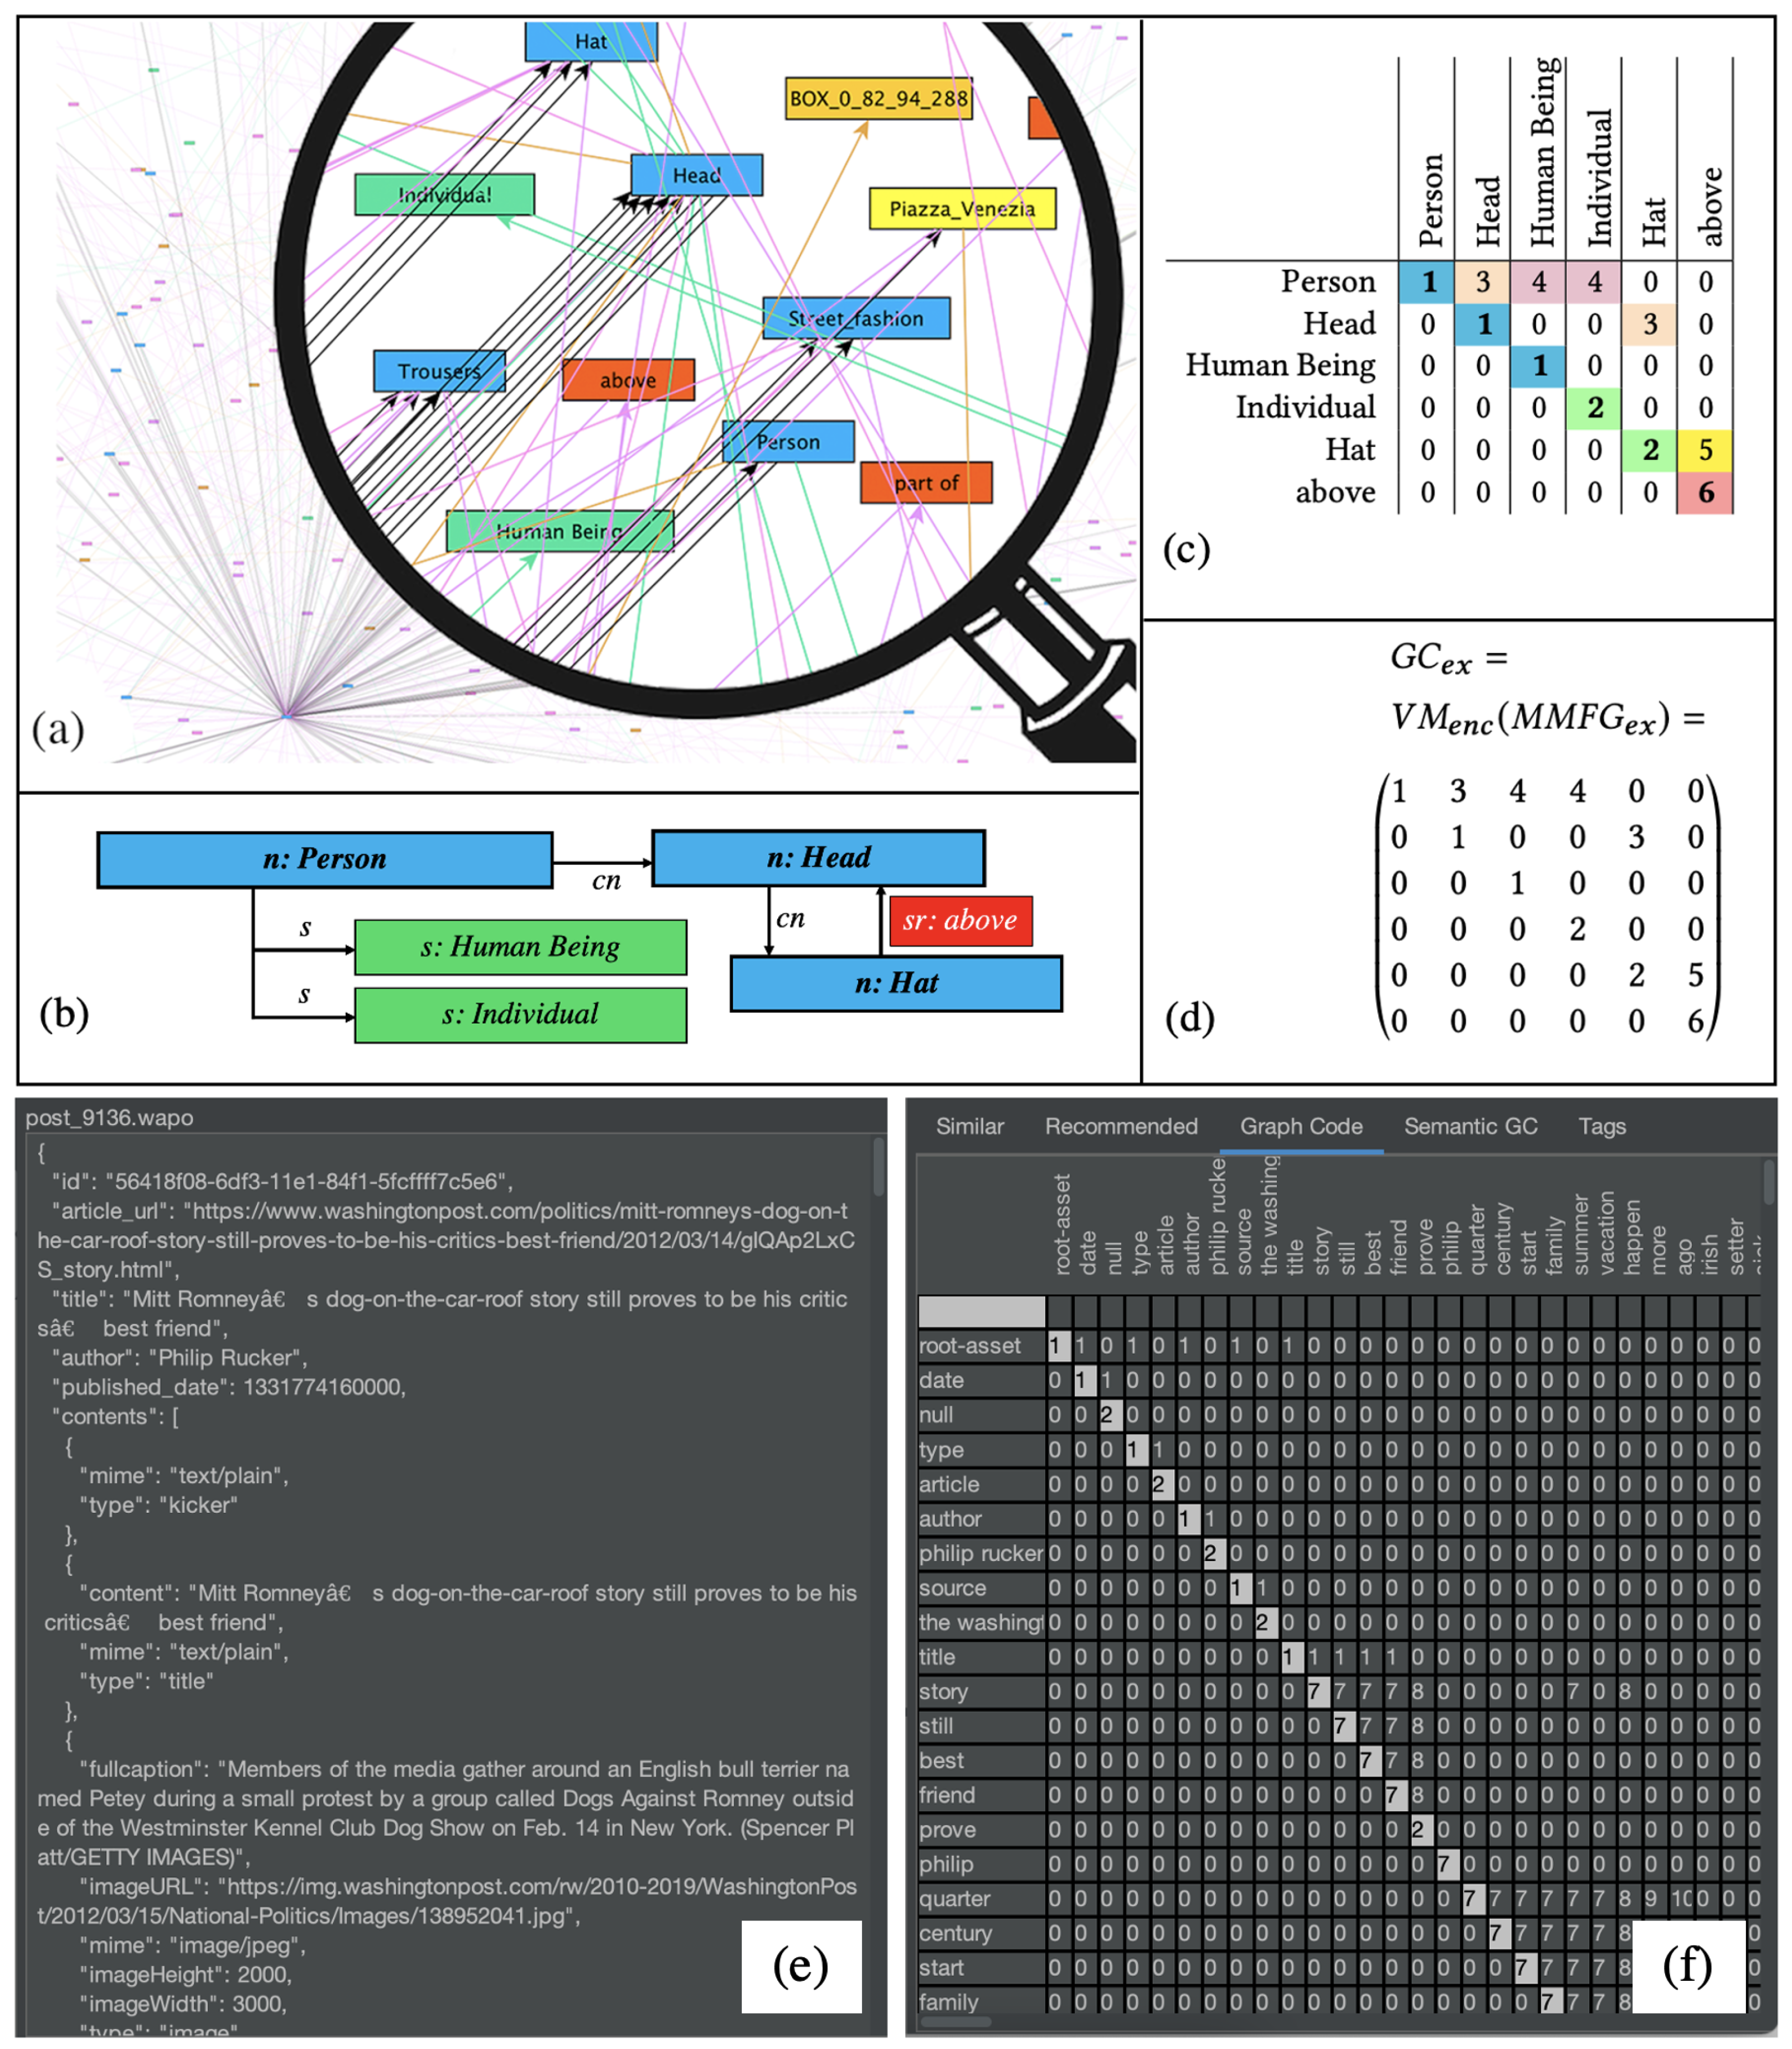
Graph codes [11] are a 2D projection of a multimedia feature graph on which a set of metrics can be applied. The mathematical background is outlined in [2] and it is shown that graph codes are very efficient for the calculation of similarity and other MMIR tasks. Figure 4 summarizes the most important concepts and shows a feature graph (Figure 4a,b), the corresponding adjacency matrix (Figure 4c) and the graph code (Figure 4d). Furthermore, a screenshot of the GMAF application showing a graph code is given in Figure 4e,f.
In the area of graph codes, several definitions have been made [2], which are relevant for the modeling presented here. Therefore, in the following section, a short summary is given, providing the formal background:
- Matrix fields of the Graph Codes are denoted by .
- The row and column descriptions are called feature vocabulary terms and represented by the set and also called the dictionary of a graph code.
- The metric is a metric triple representing the similarity of Graph Codes on various levels.
- is the feature-metric and is based on and defined as .
- is the feature-relationship-metric and represents all possible relationships. It is defined as , where is the adjacency matrix of the corresponding graph. represents the ratio between the number of non-zero edge-representing matrix fields and the overall number of equivalent and intersecting edge-representing matrix fields of, for example, two graph codes.
- is the relationship-type-metric calculating similar (and not just possible) relationships as
In [2], we outlined an algorithm based on these metrics for the parallel processing of graph code operations. This algorithm has been implemented in Java, Objective-C (for Apple devices), and CUDA (for NVIDIA devices) and proves that the parallelization of graph code operations scales linear instead of polynomial or exponential time for the corresponding graph-based operations on MMFGs. Experiments [2] show that the theoretical speedup of these operations only depends on the number of available parallel processing units and also prove linear time complexity. For the exemplary collections employed in [2], a speedup of factor 4.000 was measured. Combined with the already presented solution for horizontal scaling, this is an unseen opportunity for MMIR processing of high volume and high level-of-detail collections.
In [3], semantic graph codes (SGC) have been defined containing semantic annotations with systems such as RDF, RDFS, ontologies, or knowledge organization systems [12,13,14] and thus bridges the gap between the technical representation of MMIR features and its human understandable meaning.
The distributed processing of GMAF instances can be regarded as horizontal scaling, and the GPU-based optimizations in parallel graph code processing can be regarded as vertical scaling. However, the current architecture of the GMAF is based on a static configuration for either vertical or horizontal scaling. As shown in related work [15,16,17], various algorithms are in place to support automated and/or application-based scaling of processes or processing steps. However, to support the integration of both vertical and horizontal scaling, the corresponding configuration, and also the employment of autoscaling algorithms, several prerequisites must be met, which are currently not part of the GMAF. Hence, further modeling and extensions of the framework are required. This will also affect several graph code-based optimizations for further compression and relevance calculations.
2.3. Explainability Area
To explain representation or indexing structures in MMIR, extensions for both MMFGs and graph codes have been made [3], which employ a formal PS-Grammar [18], which takes annotations of the MMFG or graph code to create sentences in a human-understandable way. According to [19], a grammar for a language L is defined by the tuple of vocabulary terms V, the list of terminal symbols T, which terminate valid sentences of L, production rules P, which describe valid combinations of non-terminal symbols and a set of starting symbols S for sentences of L. In [18], PS-Grammars are employed as a specialized form to generate language terms by production rules, in which the left side of the rule is replaced by the right side. If, for example, is a production rule in P, and are literals in V, then is a direct replacement.
Particularly, when defining grammars, the set V will contain additional classes to structure the possible production rules (typically defined as Chomsky rules [19]), e.g., classes to describe nominal phrases (NP), verbal phrases (VP), prepositional phrases (PP), or other word types, such as adjectives (ADJ), and their location in validly produced sentences [18]. In many cases, grammars are designed such that . As an example, the sentence, “The hat is above the head”, can be represented by the context-free grammar for simple English sentences:
- represents the variables (or non-terminal symbols) of the grammar.
- is the set of terminal symbols.
- is the set of production rules for this grammar and can be defined as follows:
In [3], we further showed that not only feature graphs, but also the indexing structures, such as, for example, graph codes, can be automatically transformed into human-understandable texts. Based on this, further metrics for semantic graph codes were introduced [4] as follows:
- is the feature-discrimination-metric describing the discriminative power of a feature vocabulary term as
- The TFIDF measure [20] has been adapted, as well to statistically improve the relevance of MMIR features:
- can be defined as the feature-relevance-metric representing the difference of the TFIDF-measure of two feature vocabulary terms: .
- The introduction of collection wide stop words leads to further refinement of the feature vocabulary terms.
- Finally, and with high relevance for this paper, has been defined as the aboutness-metric for a collection as .
In [4], we demonstrated that based on these metrics, feature relevant graph codes (FRGC) can be calculated by measuring the distance of a SGC employing . This facilitates the calculation of explainable SGC for answering typical MMIR questions:
- “Why is this element in the result list?”: .
- “Why is element A before element B?”: .
- “What is element A?”: .
On this basis, already human-understandable explanations of MMIR processing steps can be calculated. However, the open challenges in the area of integration and scalability also affect the area of explainability and expressiveness. As solutions for these remaining challenges might involve additional MMIR processing facilities, the resulting MMIR process steps become more difficult. Hence, the explanation of such processing steps has also to be validated and/or enhanced.
2.4. Related Work
In the area of integration, fusion, or enrichment of MMIR features [21], several algorithms and techniques have been proposed. Related work also aims at solutions for individual multimedia object types. Exemplary here, an effective content-based image retrieval technique for image visuals representation based on the bag-of-visual-words model [22] will be outlined briefly. In their paper, the authors discuss image feature fusion based on two very common feature detection algorithms: the SURF (speeded-up robust feature) and the FREAK (fast retina keypoint) algorithms. They train a machine learning model for each algorithm and fuse the detected features according to the bag-of-visual-words model by applying both SURF and FREAK algorithms.
In learning specific and general realm feature representations for image fusion [23], another approach for the fusion of multimedia features is presented. Input images are represented in various transformed formats; each image is processed with specific feature detection algorithms, and finally the detected features are fused into a single model. The authors show that the fusion of images increases the MMIR results.
Instead of fusing features from representations of the same image, the fusion of features from images and texts has also been a focus of research. Particularly in the area of social media, this combination can lead to an increase in effectiveness in retrieval. In object-aware multimodal named entity recognition in social media posts with adversarial learning [24], the authors introduce an approach that feeds features from text-named entities [25] and detected image features into a machine learning network. This work provides strong evidence that the fusion of various MMIR features from different sources increases the overall effectiveness by 3–8% depending on the underlying problem domain.
As a last candidate, the paper Discovering Multirelational Structure in Social Media Streams [26] should be mentioned. The authors of this paper highlight that information relevant for topic clusters (e.g., social, travel, and project) is enriched during the time, and thus more and more refines the existing information (i.e., feature) basis. This clustering also increases the semantic information of detected features, as ambiguous content can be easier aligned with topic domains.
Further articles related to this work are learning rich semantics from news video archives by style analysis [27], where news videos in particular are semantically enriched according to production elements (e.g., weather icons and tickers), or Beyond search: Event-driven summarization for web videos [28], which illustrates an automated shot detection and overview for web videos, or semantics and feature discovery via confidence-based ensemble [29], where machine learning approaches are also employed for the detection of features with a focus on semantics. In temporal event clustering for digital photo collections [30], another approach similar to the timeline enrichment for images is presented, while content and concept indexing for high-dimensional multimedia data [31] introduces additional dimensions (e.g., time and topic) similar to [26]. All of this related work basically shows that the fusion of MMIR features provides a potentially significant benefit for retrieval. However, they provide no general or unifying solution or framework for the fusion of any multimedia object type in general, and they all utilize existing algorithms and hence are stuck with the existing level of detail.
2.5. Summary and Remaining Challenges
In this section, we outlined various components that already address general MMIR topics in the problem areas. In the integration area, the GMAF framework provides facilities and existing MM Feature extraction mechanisms to integrate MM content objects of different types and to store their MM features in a MMFG. In the area of scalability, graph codes as a 2D transformation of MMFGs show significant speedup due to parallelization and are employed to formally model a set of metrics, which can be also applied in the area of explainability to introduce semantics and human-understandable text generation to graph codes and MMFGs. However, to fulfill the definitions of “Smart MMIR”, some challenges remain open:
- In the integration area, the GMAF provides a good and flexible solution. However, this solution is currently quite static and the processing of each MM content object is done individually. Although collection-based metrics are available, there is no harmonizing or integrating mechanism between various MM feature-extracting plugins. A more intelligent and semantic approach is required.
- In the area of scalability, significant achievements have been made. However, for real-world applications, a flexible approach for the combination of both horizontal and vertical scaling is required to intelligently support different application types.
- The current human-understandable representation of MMFGs and graph codes in the area of explainability is text based. However, in multimedia applications, other visualization techniques must be employed, particularly as both MMFGs and graph codes can become extensive.
A solution for these open challenges is now given in the next section.
3. Modeling and Design
As outlined in Section 1, Smart MMIR is interoperable, scalable, expressive, human-understandable and explainable. In this section, we introduce two new concepts that contribute to Smart MMIR: the soundness, which is a discrete parameter describing the consistency of an information set, and processing flows, which are a means for scaling, distributing, and integrating Smart MMIR with other applications. This section contains five subsections and a summary. First, the soundness is introduced in Section 3.1, then the concept of processing flows is described in Section 3.2. The following three subsections are employed to model the effects of soundness and processing flows in the areas of integration (Section 3.2), scalability (Section 3.3), and explainability (Section 3.4).
The modeling here follows the user-centered system design approach by Norman and Draper [32], which places the user in the center of conceptual modeling. This further means that the presented solution directly generates a benefit for users of the application. In the context of this paper, this means that the starting point for the modeling is a use case and thus a typical scenario that users may be confronted with. The approach further implies that such a scenario can be selected as a test case within a cognitive walk-through experiment, where users work with the application and the results are measured. Finally, this approach guarantees that any modeling produces a benefit for the users of an application.
3.1. Soundness
In many MMIR applications, it is important to decide if the information extracted from a certain MMIR object is sound. This means it is consistent, fits together, robust, describes the MMIR object correctly, and thus also indicates the quality of information. Figure 5 shows two exemplary social media posts, where a description and an image are employed to provide some information to users. If the description fits to the image, such a post can be regarded as being sound. If not, the soundness indicates some mismatch or contradiction in the information. However, for users, it may be hard to distinguish between sound and not-sound MIR assets.
For such a scenario, we introduce the soundness as a discrete value that can be calculated based on and the graph code metrics and as the fraction of similar relationship types and possible relationship types between given feature vocabulary terms. For the calculation of , feature relevant semantic graph codes are employed, as they already represent standardized semantic identifiers and only contain the relevant features for an application. Furthermore, for the calculation of , only the intersecting parameters of MMIR assets are used. If no common elements are in two , a calculation of is not possible:
For the above example, this means that the images of FRSGC will contain the vocabulary term “flower”, while the textual description either contains this vocabulary term or does not. Therefore, would have the value 1 for one common relationship, while would have either value 1 or 0. Of course, real examples not only contain single values, and hence, in Section 5 (evaluation), further examples are given. It may be noted that a typical MMFG can contain tens of thousands of nodes and even more relationships. The calculation of compresses this information but still leaves an average of 500 vocabulary terms for a typical element of a MMIR collection. This means that the will provide a fine-grained classifier for a MMIR asset. It is important to highlight that are still explainable and that the grammar introduced in Section 2.3 is still applicable. However, due to the compression of , now shorter and much more precise information can be presented to the users.
The introduction of soundness is particularly relevant for MMIR assets that consist of multiple individual assets, such as documents with, for example, embedded pictures, social media posts with images, videos, texts, comments, likes, medical information with MRT images and doctor’s letters, or various connected information of the same multimedia scene on any other application area because in such a setup the individual elements that contribute to the information of the combined MMIR asset can contradict or confirm each other and thus produce a higher value for . However, also, when applications deal with individual MMIR assets, can be an important metric. In previous work, we already introduced the aboutness , which describes a common knowledge of a MMIR collection by calculating the most relevant feature vocabulary terms and the most common relations between them. If, for example, a medical application collects values for blood pressure, would represent the typical range of such values. If a new asset is added to the collection, can be calculated based on and, as such, indicate the deviation of a certain value from the current state of knowledge within the collection. This leads to numerous application scenarios. Finally, if the definition of truth within an application is given, e.g., because information about laws or scientifically approved texts is fed to an MMIR system, indicates whether an MMIR asset complies with this set of true information.
can be represented as a discrete value. This means that, based on this value, thresholds and pre-defined decisions can be introduced. For example, if of a social media post is lower than 0.5, the post can be regarded as fake news. Such decisions can lead to a more flexible way of processing MMIR information. However, to define such processing flows, some further extensions to existing MMIR solutions must be made. This is outlined in the next subsection based on the generic multimedia analysis framework (GMAF).
3.2. Processing Flows, Integration Area
As shown in Section 2.1, the GMAF already contains a structure to attach plugins for the extraction of MM features. It has also been shown that various plugins exist that can contribute features to the same MM content object type. For example, if an image is processed by different object detection algorithms, each of these algorithms might detect different or similar objects. However, if, for example, an algorithm is optimized for the detection of fruit, a tennis ball might be considered as being an orange. If an algorithm is trained for the detection of cars, the MM feature term “Jaguar” might have a different meaning than the “Jaguar” detected by an algorithm optimized for animals. Experiments in related work [7] show that, depending on the employed MM feature extraction algorithms, contradictions can exist.
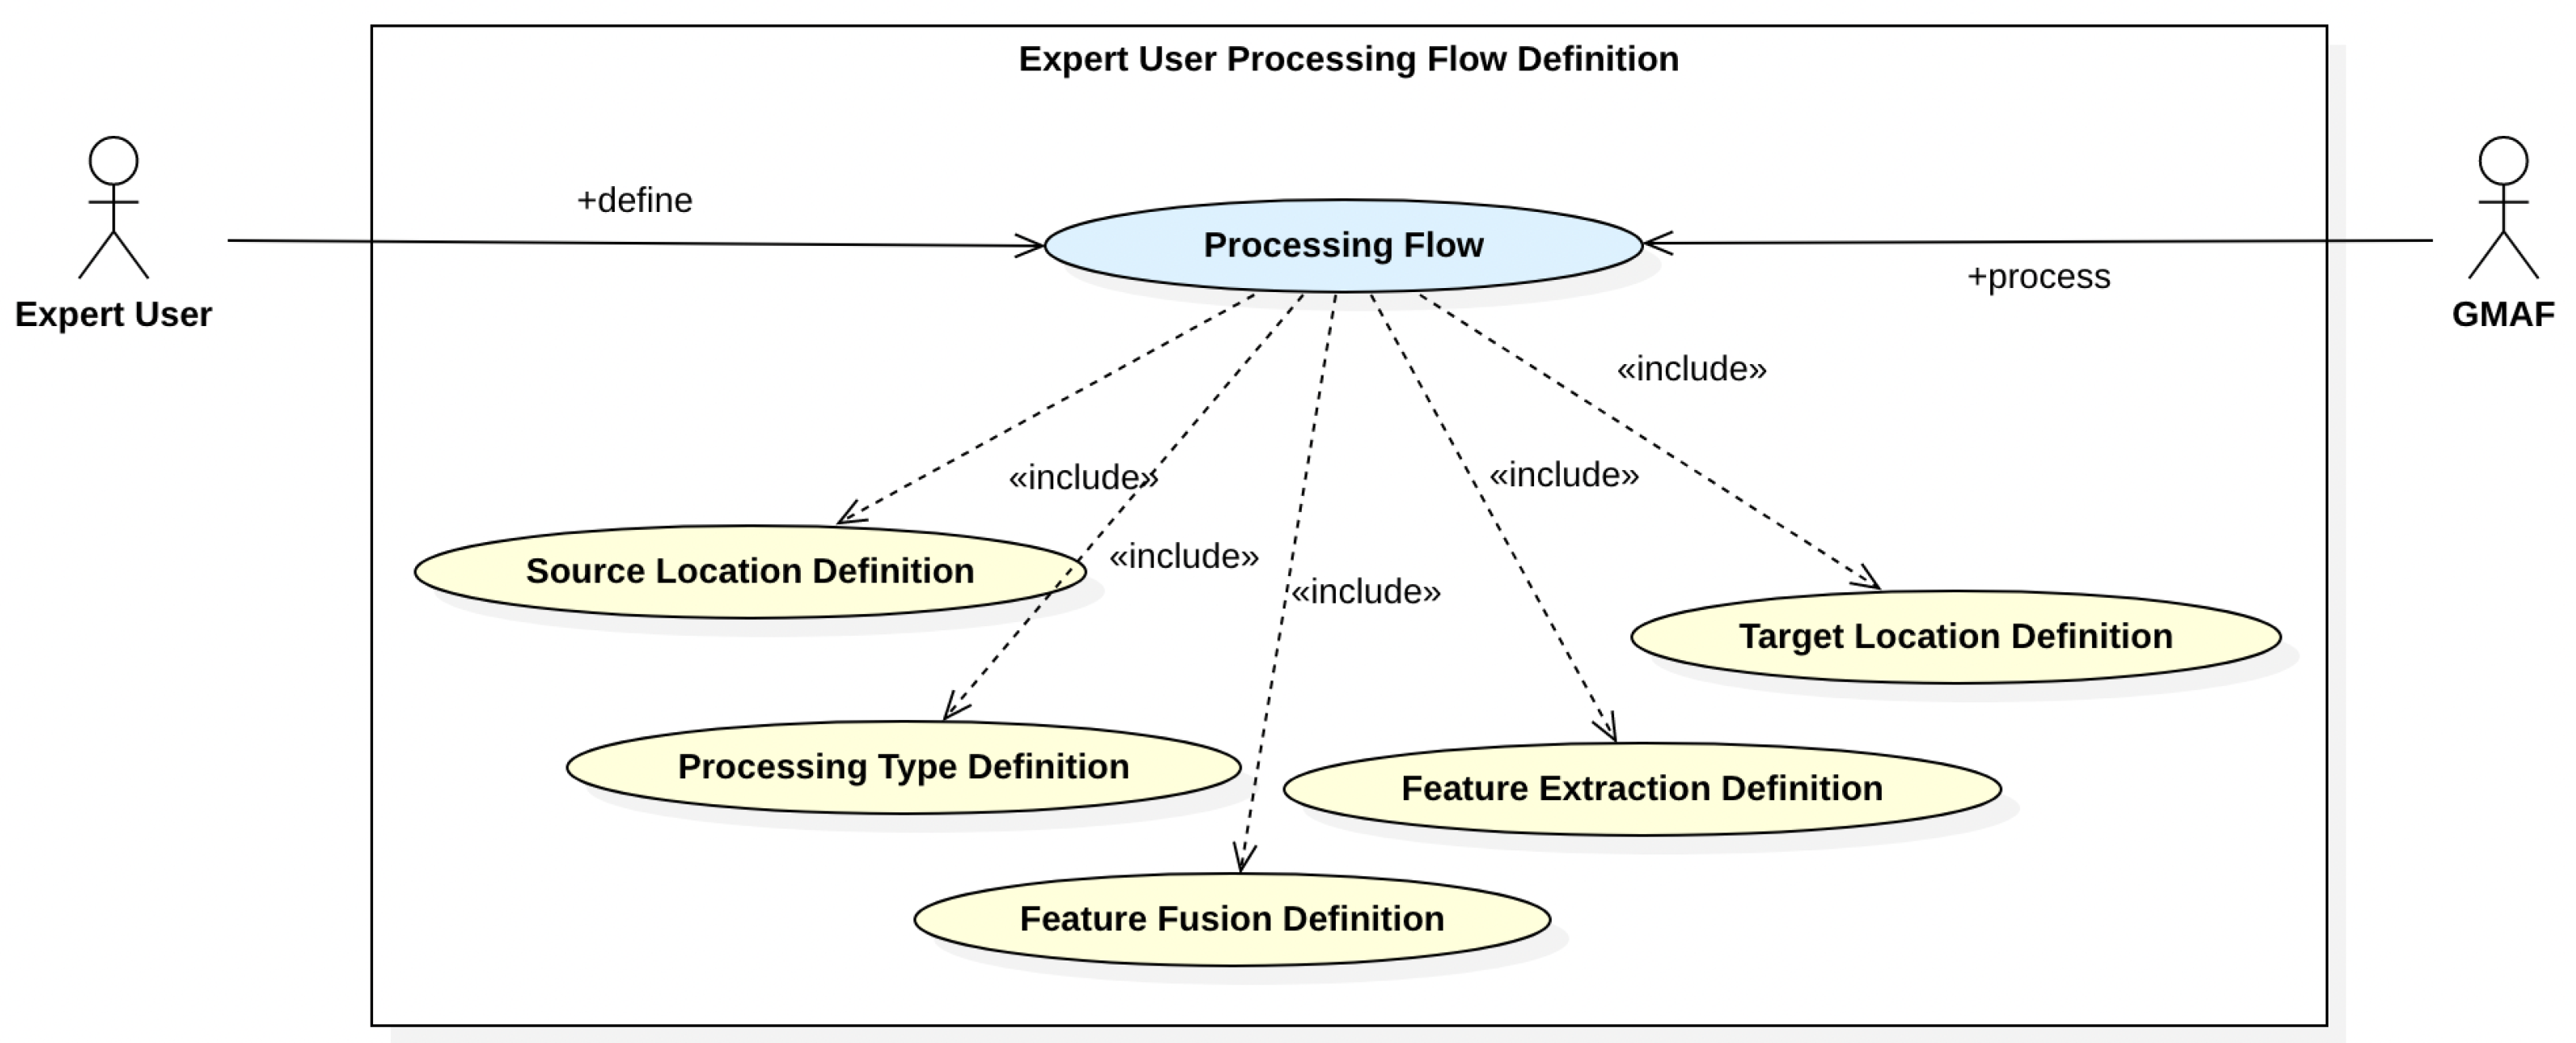
This kind of integration has to be defined by an additional user type, an expert user. Hence, following the user-centered system design approach, an additional use case is introduced (see Figure 6). This use case describes the expert tasks for the definition of processing flows. These tasks are typically performed in a preparatory step. It must be noted that also this preparatory step directly influences the MMIR processing steps and also has to remain explainable.
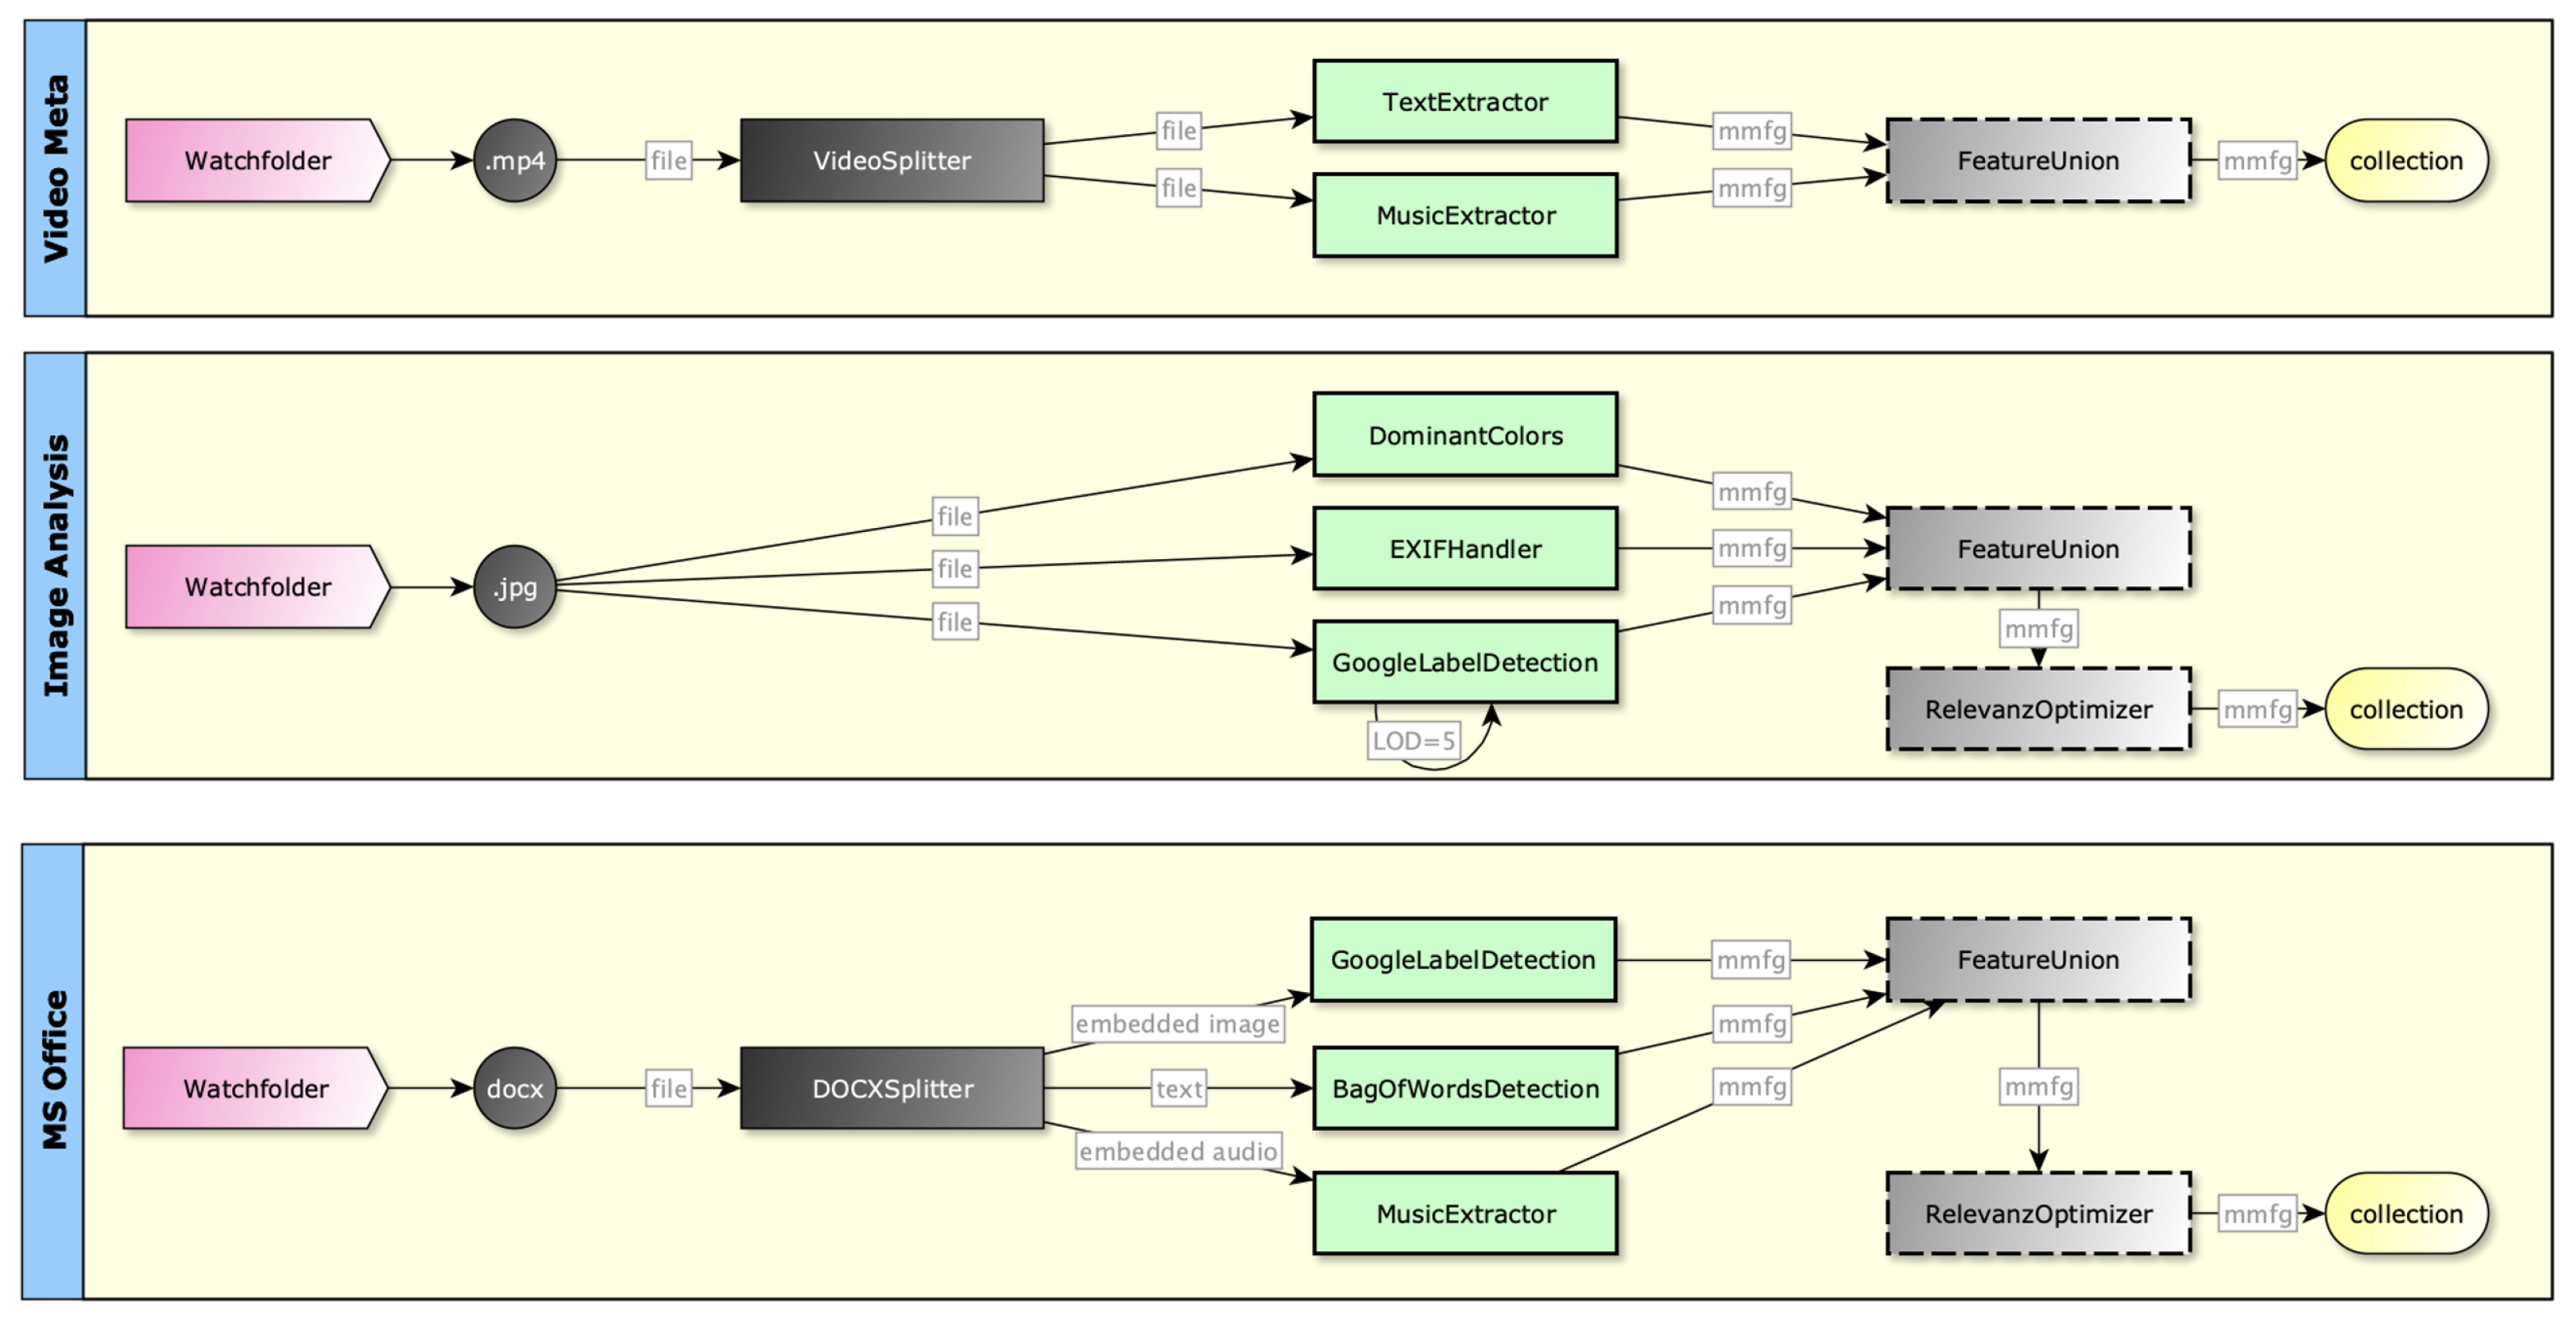
Contradictions, as well as confirmations, should not occur occasionally, but in a planned and user-definable way. Users typically want to construct processing flows and define how the results of various processing plugins should be combined (see examples in Figure 7).
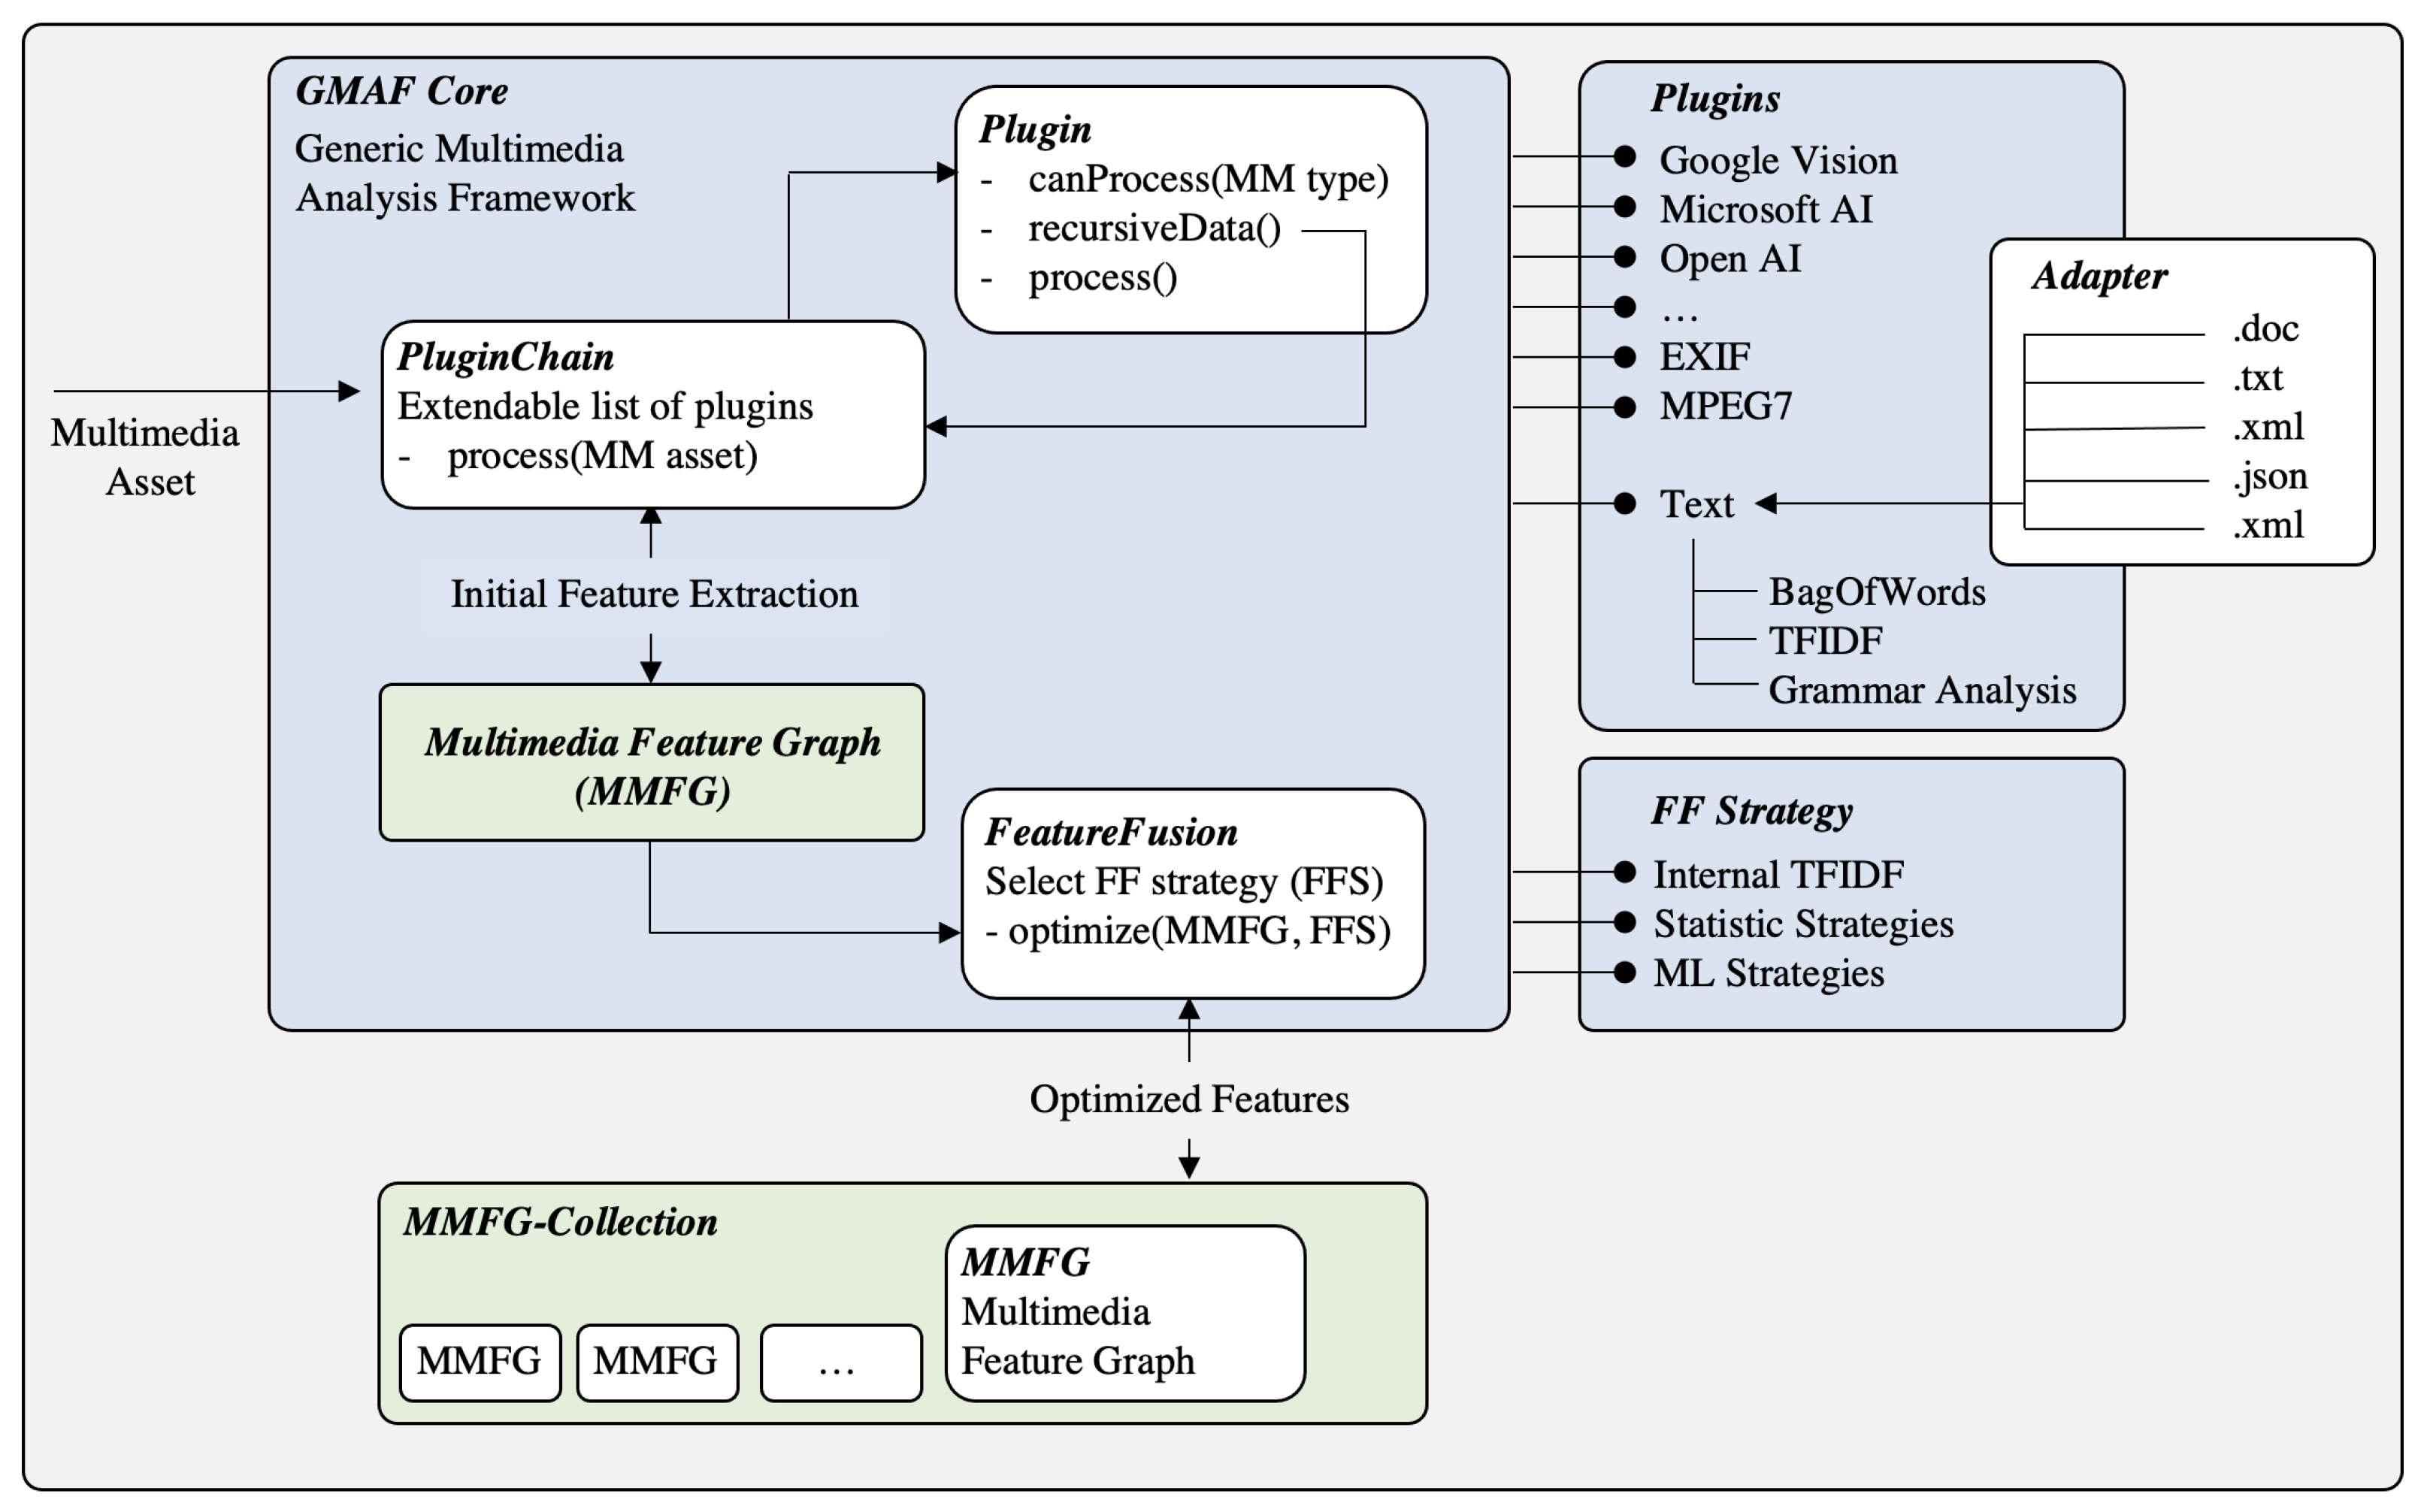
In addition to already existing plugins, two components are introduced: (1) a feature fusion facility and (2) the general concept of processing flows. Feature fusion is based on MMFGs and takes one or more MMFGs as an input. The result of such a feature fusion is a single MMFG, which contains combined or optimized elements. The decisions of which elements are moved from the source MMFGs to the resulting MMFG, which elements are deleted, re-weighted, renamed, or even added, are subject to a feature fusion strategy. According to the open design and architecture of the GMAF, these strategies should also be exchangeable and interoperable. Figure 8 shows these newly introduced building blocks in the GMAF architecture.
Formally speaking, a feature fusion can be denoted as a function
which activates a node-based function , based on the set of nodes of all MMFGs N in a collection with x elements to calculate the resulting (i.e., fused) set of MMFG nodes M based on its node’s properties:
This means that for all nodes of the input MMFGs, produces output nodes for the resulting MMFG. Of course, is the function, where algorithmic optimizations, such as reasoning, inferencing, fusion, unioning, and weighting, are represented.
Furthermore, a plugin chain element is introduced (see also Figure 8), which is able to construct a list of processing plugins, feature fusion elements, and any combination of these to support GMAF processing in terms of the above-mentioned processing flows.
From a design perspective, processing flows are an adaptation of the multimedia stratification model [9], as each processing flow can be regarded as a representation of a particular MM content type. Following this model, the layering of processing flows can be particularly relevant, when content is real “multi”-media, e.g., embedded audio, video, image objects in other multimedia objects. Formally, and according to Figure 6, such a processing flow can be constructed by a source location definition , a processing type definition , several feature extraction definitions , a number of feature fusion definitions , and a target location definition :
The introduced GMAF plugin chain element is designed to accept such processing flow definitions and thus provides further flexibility and interoperability, as well as smarter application profiling in the area of integration.
3.3. Scalability Area
As already shown in Section 2.2, feature relevant graph codes represent a compressed form of graph codes, based on their relevance within the overall collection. Compression is very important for graph code processing, as it leads to even better processing times due to fewer available vocabulary terms. Additionally, the above-introduced feature fusion strategies can lead to a compression of the underlying MMFG. However, there is one important difference: feature fusion determines what is “right”, while FRGC represents what is “relevant” based on the collection’s content. Both mechanisms require re-processing when new content is added to a collection. Unfortunately, such re-processing of a collection may be very expensive, as any existing MMFG and any already calculated and optimized FRGC may have to be re-calculated.
A simple example illustrates this: as shown in previous work [3], the GMAF is able to detect new MM features by comparing a new MM asset to similar assets with older timestamps. In medical applications, this can be employed to detect deviations, tumors, or general changes in a patient’s medical data. This can also be employed to detect the “new watch” a user is wearing in a photo that was added recently to the collection. If this is detected, the MM Feature “new watch” is added to the corresponding MMFG and graph code. However, at some point of time, this “new watch” might become an “old watch” and be replaced by another “new watch”. When this happens, the whole collection (or at least the part of the collection containing the “new watch” graph codes) needs to be re-processed.
The same applies to the general calculation of FRSGCs, as the underlying TFIDF algorithm employs thresholds to determine which features are relevant or irrelevant for a collection. If, for example, we have a collection of thousands of football pictures, a single picture with a tennis ball might be considered to be irrelevant within the collection. However, if users upload millions of tennis pictures, the relevance of the football ones might decrease, and the irrelevant first tennis ball might gain relevance instead. Additionally, here, re-processing is required.
Furthermore, it has to be considered that the GMAF processing is typically distributed both horizontally and vertically. Vertical distribution is responsible for parallelization employing GPU processing; horizontal distribution can be employed to distribute the collection based on MM content object type or processing facilities. For example, all videos could be stored at a GMAF node, where specialized video decoding hardware is located. However, in any case, such distributed collections and processing need to be reflected also in the feature relevance metric , as each individual node needs the information of the overall collection’s to calculate and thus, to process MMIR, including explainability.
Hence, in the following, the calculation of is modified. Assuming that the overall collection of semantic graph codes is distributed among n GMAF nodes, each of these nodes has its own individual subset of :
To indicate on which nodes re-processing is required, is calculated both on the feature vocabulary terms of and . This means that a node’s individual collection’s relevance is compared to the overall collection’s relevance. If MM assets are added to the collection that are similar to the existing ones, neither the individual nor the overall is going to change. If different MM assets are added to a distinct GMAF node, this might—of course—affect this single node but not automatically all other nodes of the collection. The reprocessing indicator for a particular GMAF node k can thus be defined as
If is greater than zero (or a certain threshold), the GMAF node k needs re-processing. Otherwise, its relevance values are still valid. A further result of these modification, re-processing will also affect , which is based on . This means that the topic area of a collection can automatically change from time to time. As explainable graph codes are based on FRGCs, the results of the calculation of human-understandable texts will also change, when , and change automatically.
Furthermore, it must be noted that on this basis, the calculation of can also be completed in an efficient manner, as all prerequisites for this calculation can be fulfilled in advance. Once, for example, is calculated for a collection, for each further element, can be calculated in a single step. Based on the introduced processing flow, also specialized hardware can be employed for the calculation of, for example, graph codes by parallel processing, and hence improve the overall application performance. Hence, this modification leads to smarter MMIR processing and scalability.
3.4. Explainability Area
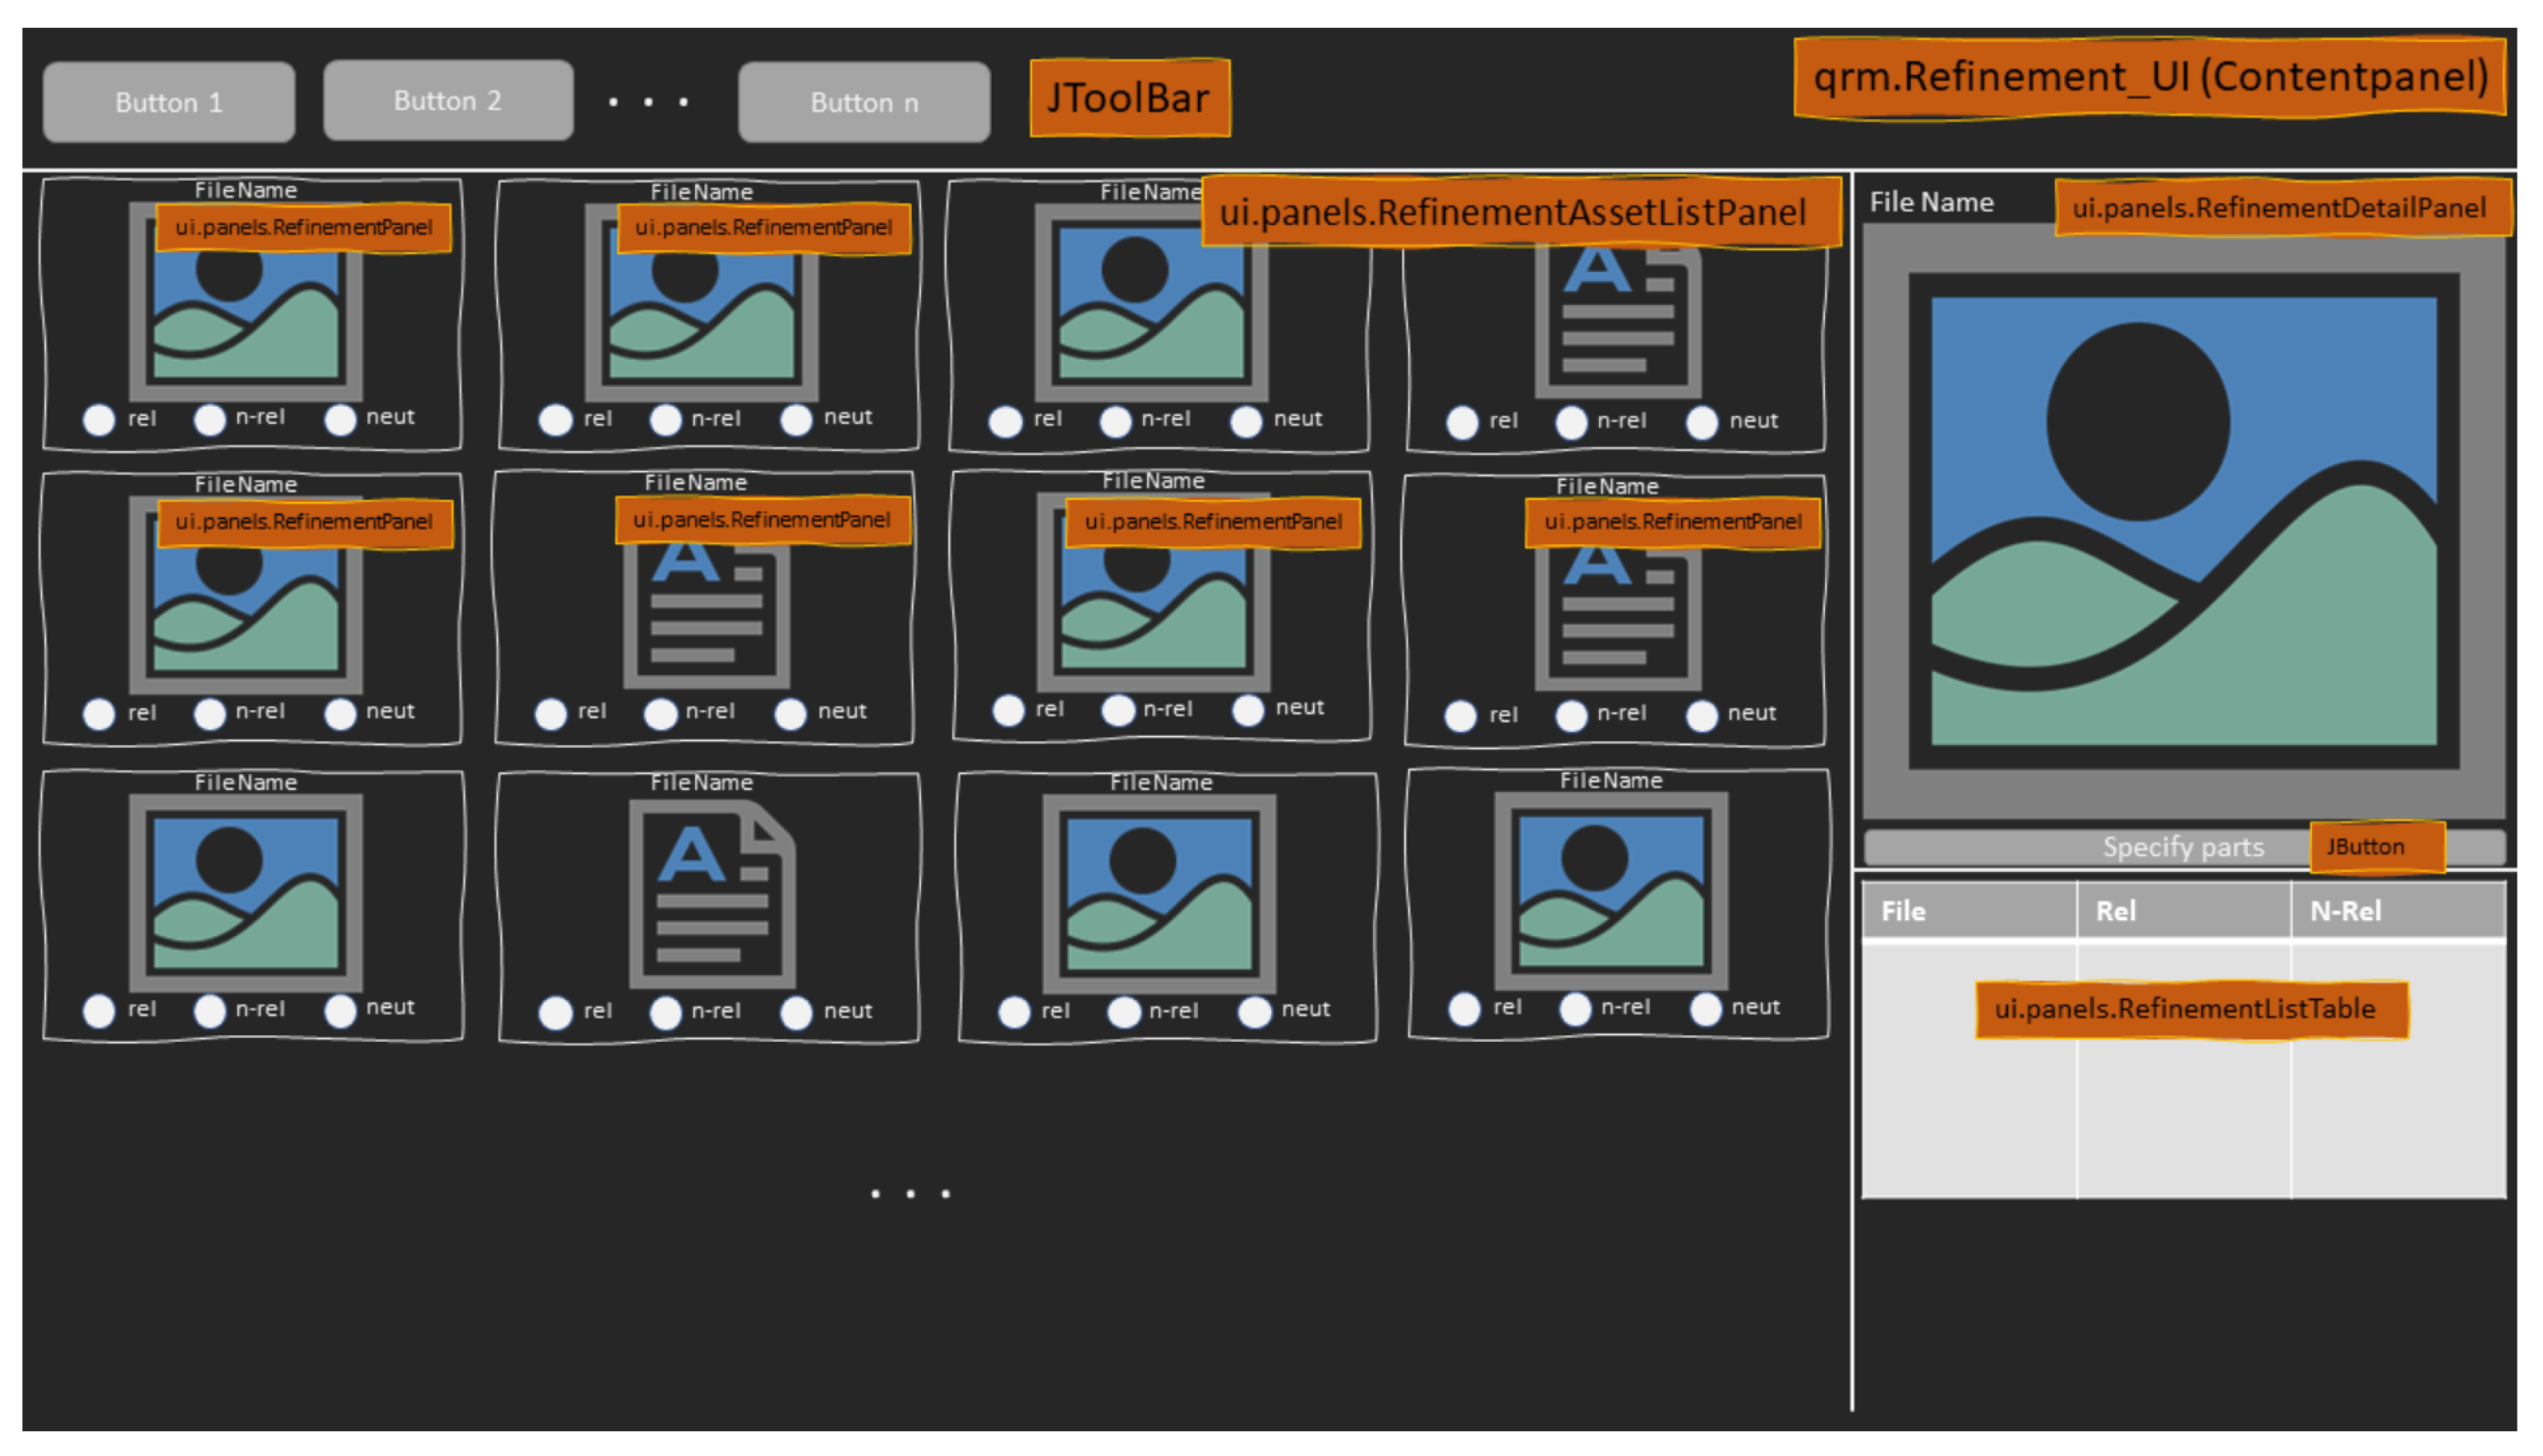
Until now, human-understandable texts have been calculated for the explanation of MMIR processing steps and results. However, written text in many cases lacks expressiveness. The adage “a picture is worth a thousand words” is a good example that visual expression is regarded as more appropriate in particular areas and, for sure, in the area of multimedia. Hence, further visualizations of ESGCs, ESMMFGs, and the corresponding calculations of typical MMIR questions (see Section 2.3) are required. As an example for such a visualization, a wireframe of a smart query refinement user interface is shown in Figure 9.
Furthermore, the just-introduced enhancements in the area of integration and scalability also affect explainability. For example, the definitions of soundness, processing flows and feature fusion produces important information that potentially need to be explained to users. soundness, for example, provides relevant information about the correctness or integrity of a certain MMIR asset. If users upload an additional element to their MMIR collection, deviations can be detected automatically, and a detailed explanation as to why this element deviates from another or from the rest of the collection can be presented to the users. Depending on the definition of processing flows, the MMIR results can be completely different through applications, which may lead to confusion when the same MMIR objects are viewed by users in different applications. Hence, these steps also have to be included in the expressiveness and explainability of Smart MMIR. However, this topic will remain the subject of future work, as in the context of this paper, the important foundation for this research is introduced in the other research areas.
Basically, the introduced concepts already provide a solid foundation for the modeling of further UI elements to visualize expressiveness. However, such a refinement and feedback function should be available for any MM content object type. This means that query refinement has to be available for image-based queries, text-based queries, audio-based queries, video-based queries, and mixed multimedia-based queries. Hence, in our modeling, we also employ a generic architecture here, which supports these use cases in a general way (see Section 4).
3.5. Summary
In this section, we introduce a number of extensions and refinements of the existing state of the art to make existing MMIR smarter. Particularly, in the area of integration, the definitions of soundness, feature fusion strategies and processing flows empower applications to utilize smarter workflows and a semantically correct calculation of MM features. The adaptation of the graph code metrics and for distributed and heterogeneous collections, including the calculation of a reprocessing indicator, supports highly efficient scaling of MMIR processing. Finally, we give an example of a more expressive visualization of MMIR processes in the area of explainability. All these points contribute to Smart MMIR.
To show and prove that the modeling here can be implemented, in the next section, a brief overview of our prototypical proof-of-concept (POC) implementation is given.
4. Implementation
In this section, a short overview of selected components of the POC implementation is presented. The full implementation of the GMAF and the corresponding concepts, including those presented in this paper, is available at GitHub [33]. In this section, for each problem area, one selected implementation example is given. Section 4.1 contains information about the integration area presenting a feature fusion plugin, Section 4.2 shows the distribution of collections in the area of scalability, and Section 4.3 demonstrates the implementation of visual query refinement and relevance feedback.
4.1. Integration Area
In the implementation area, we introduce a new structure in the GMAF, the feature fusion strategy. A corresponding Java interface is added to the framework as shown in Listing 1:
| Listing 1. The introduced interface for Feature Fusion Strategies. |
1 public interface FeatureFusionStrategy {
2       public void optimize(MMFG mmfg, Vector<MMFG> collection);
3 }
|
Based on this interface, various strategies were implemented. To outline the simplicity with which new strategies can be added to this structure, Listing 2 shows an example for a UnionFeatureFusion, which calculates the union of a given set of MMFGs according to the above-mentioned structure.
| Listing 2. The union feature fusion strategy. |
1 public class UnionFeatureFusion implements FeatureFusionStrategy {
2       public void optimize(MMFG mmfg, Vector<MMFG> collection) {
3             for (MMFG m : collection) {
4                 for (Node n : m.getNodes()) {
5                       if (mmfg.getNodesByTerm(n.getName()) != null) {
6                            mmfg.addNode(n);
7                       }
8                 }
9             }
10      }
11 }
|
Feature fusion is made a core component of the GMAF processing, which now also is extended to provide processing flows. These can be represented by an XML file, which is passed to the GMAF processing of a distinct MM content object. An exemplary description of such a processing flow in XML is shown in Listing 3.
| Listing 3. Definition of a processing flow. |
1 <process-flow name="ImageImport" extension="*.jpg" isGeneral="false"> 2 <plugin-definition name="plugin1" class="de.swa.img.google.GoogleVision"/> 3 <plugin-definition name="plugin2" class="de.swa.img.yolo.FruitDetector"/> 4 <plugin-definition name="plugin3" class="de.swa.img.amazon.FaceDetection"/> 5 6 <fusion-definition name="merge1" class="de.swa.feature.UnionFeatureFusion"/> 7 <fusion-definition name="merge2" class="de.swa.feature.RelevanceOptimizer"/> 8 9 <export-definition name="mpeg7" class="de.swa.exporter.Mpeg7Converter"/> 10 <export-definition name="xml" class="de.swa.exporter.XMLFlattener"/> 11 <export-definition name="graphml" class="de.swa.exporter.GraphMLFlattener"/> 12 13 <resource-definition name="upload-dir" type="folder" location="temp/upload"/> 14 <resource-definition name="target-dir" type="folder" location="temp/target"/> 15 <resource-definition name="export-dir" type="folder" location="temp/export"/> 16 <resource-definition name="facebook" type="url" location="http://www...."/> 17 18 <param name="plugin1.lod" value="2"/> 19 <param name="plugin2.output" value="temp"/> 20 21 <flow-source name="upload-dir"/> 22 <mmfg processor="plugin1, plugin2, plugin3"/> 23 <fusion processor="merge1"/> 24 25 <export target="export-dir" exporter="mpeg7"/> 26 <export target="collection"/> 27 </process-flow> |
In lines 2–11, the definition of the required resources for the described processing flow is given. For example, in line 2, a GoogleVision plugin is defined, which internally follows the GMAF plugin structure and is made accessible within the processing flow by the name plugin1. Resource definitions in lines 13–16 can be employed to describe infrastructure settings. Each of the processing components can receive additional parameters (see Lines 18 and 19), which are then passed via Java Reflection to the specified component. Finally, in Lines 21–26, the actual processing flow is defined by a sequential list of actions. In this case, the flow looks for new images in the upload-dir folder, processes these with plugin1, plugin2 and plugin3 and applies a feature fusion with merge1 before finally exporting the result in the mpeg7 format to the collection.
4.2. Scalability Area
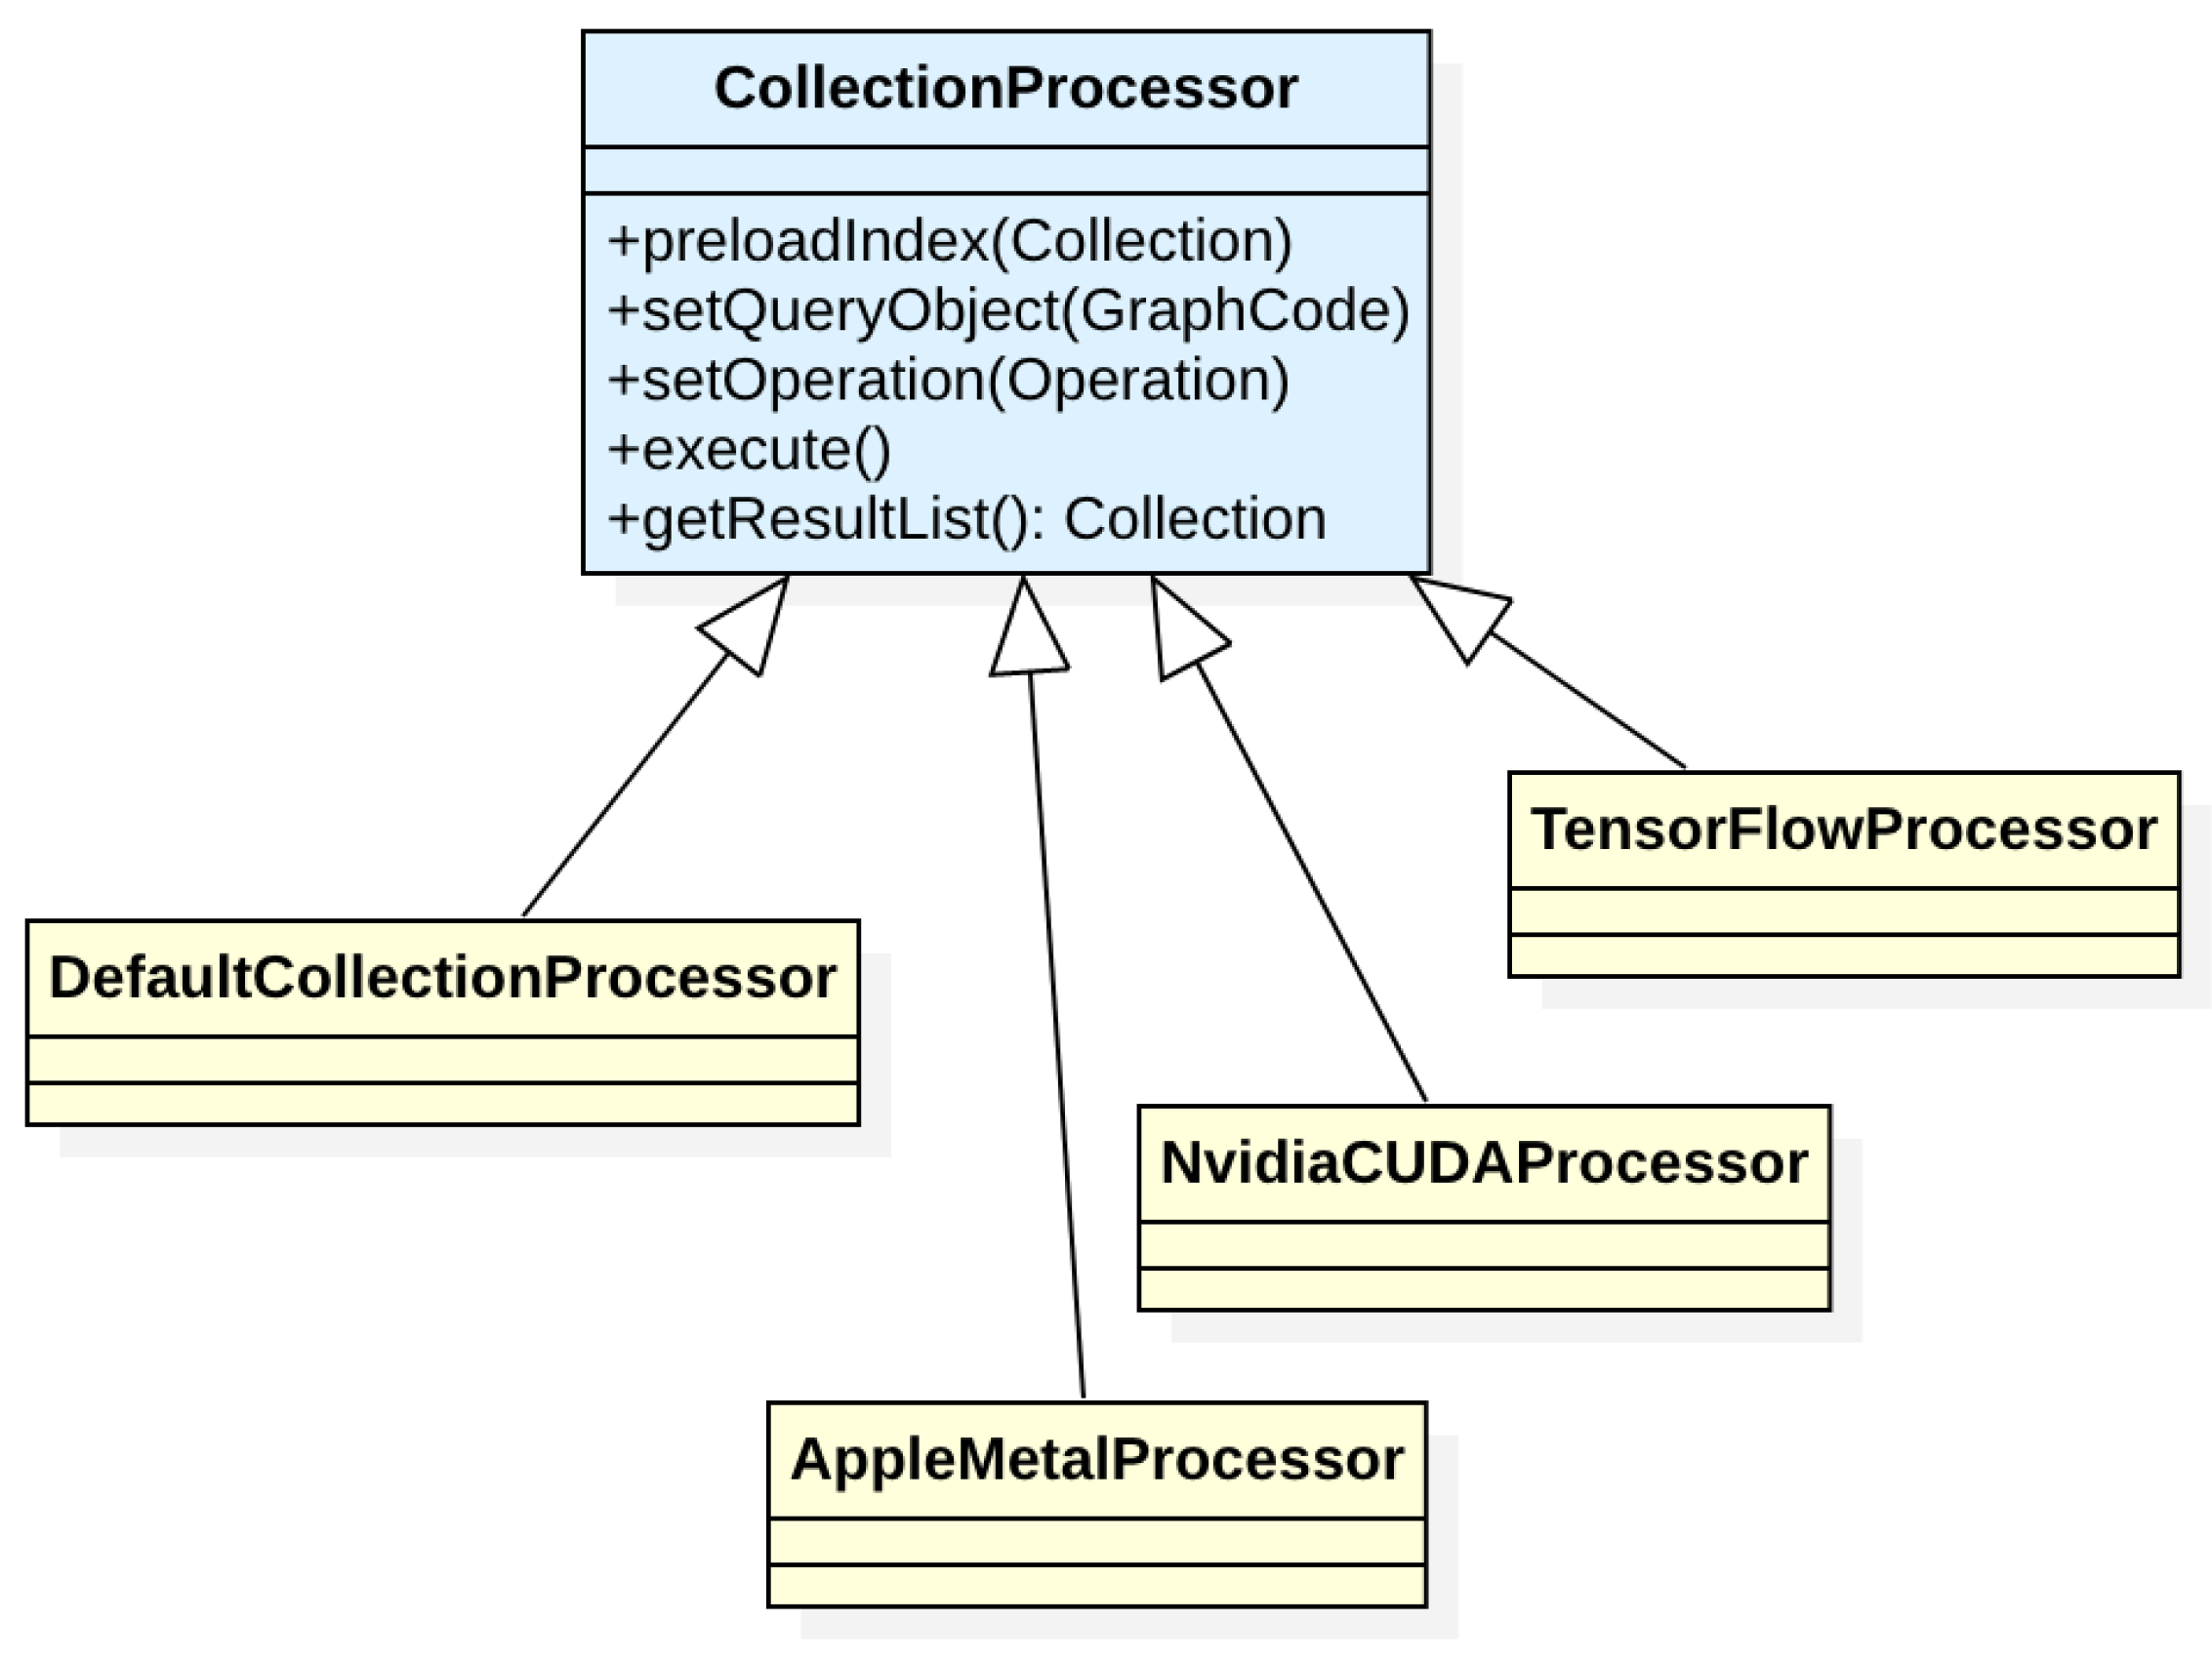
In the area of scalability, the structure of the GMAF is extended to fully support distributed processing. The component responsible for this is a CollectionProcessor, which represents both horizontal and vertical distribution (see Figure 10).
With these introduced structures, also the overall setup of GMAF installations has to be changed. As collections can now be distributed, each collection needs to have one (or more) master nodes, which represent the knowledge about the distributed components. Hence, when logging on to the GMAF, users must specify which master node they want to connect to.
4.3. Explainability Area
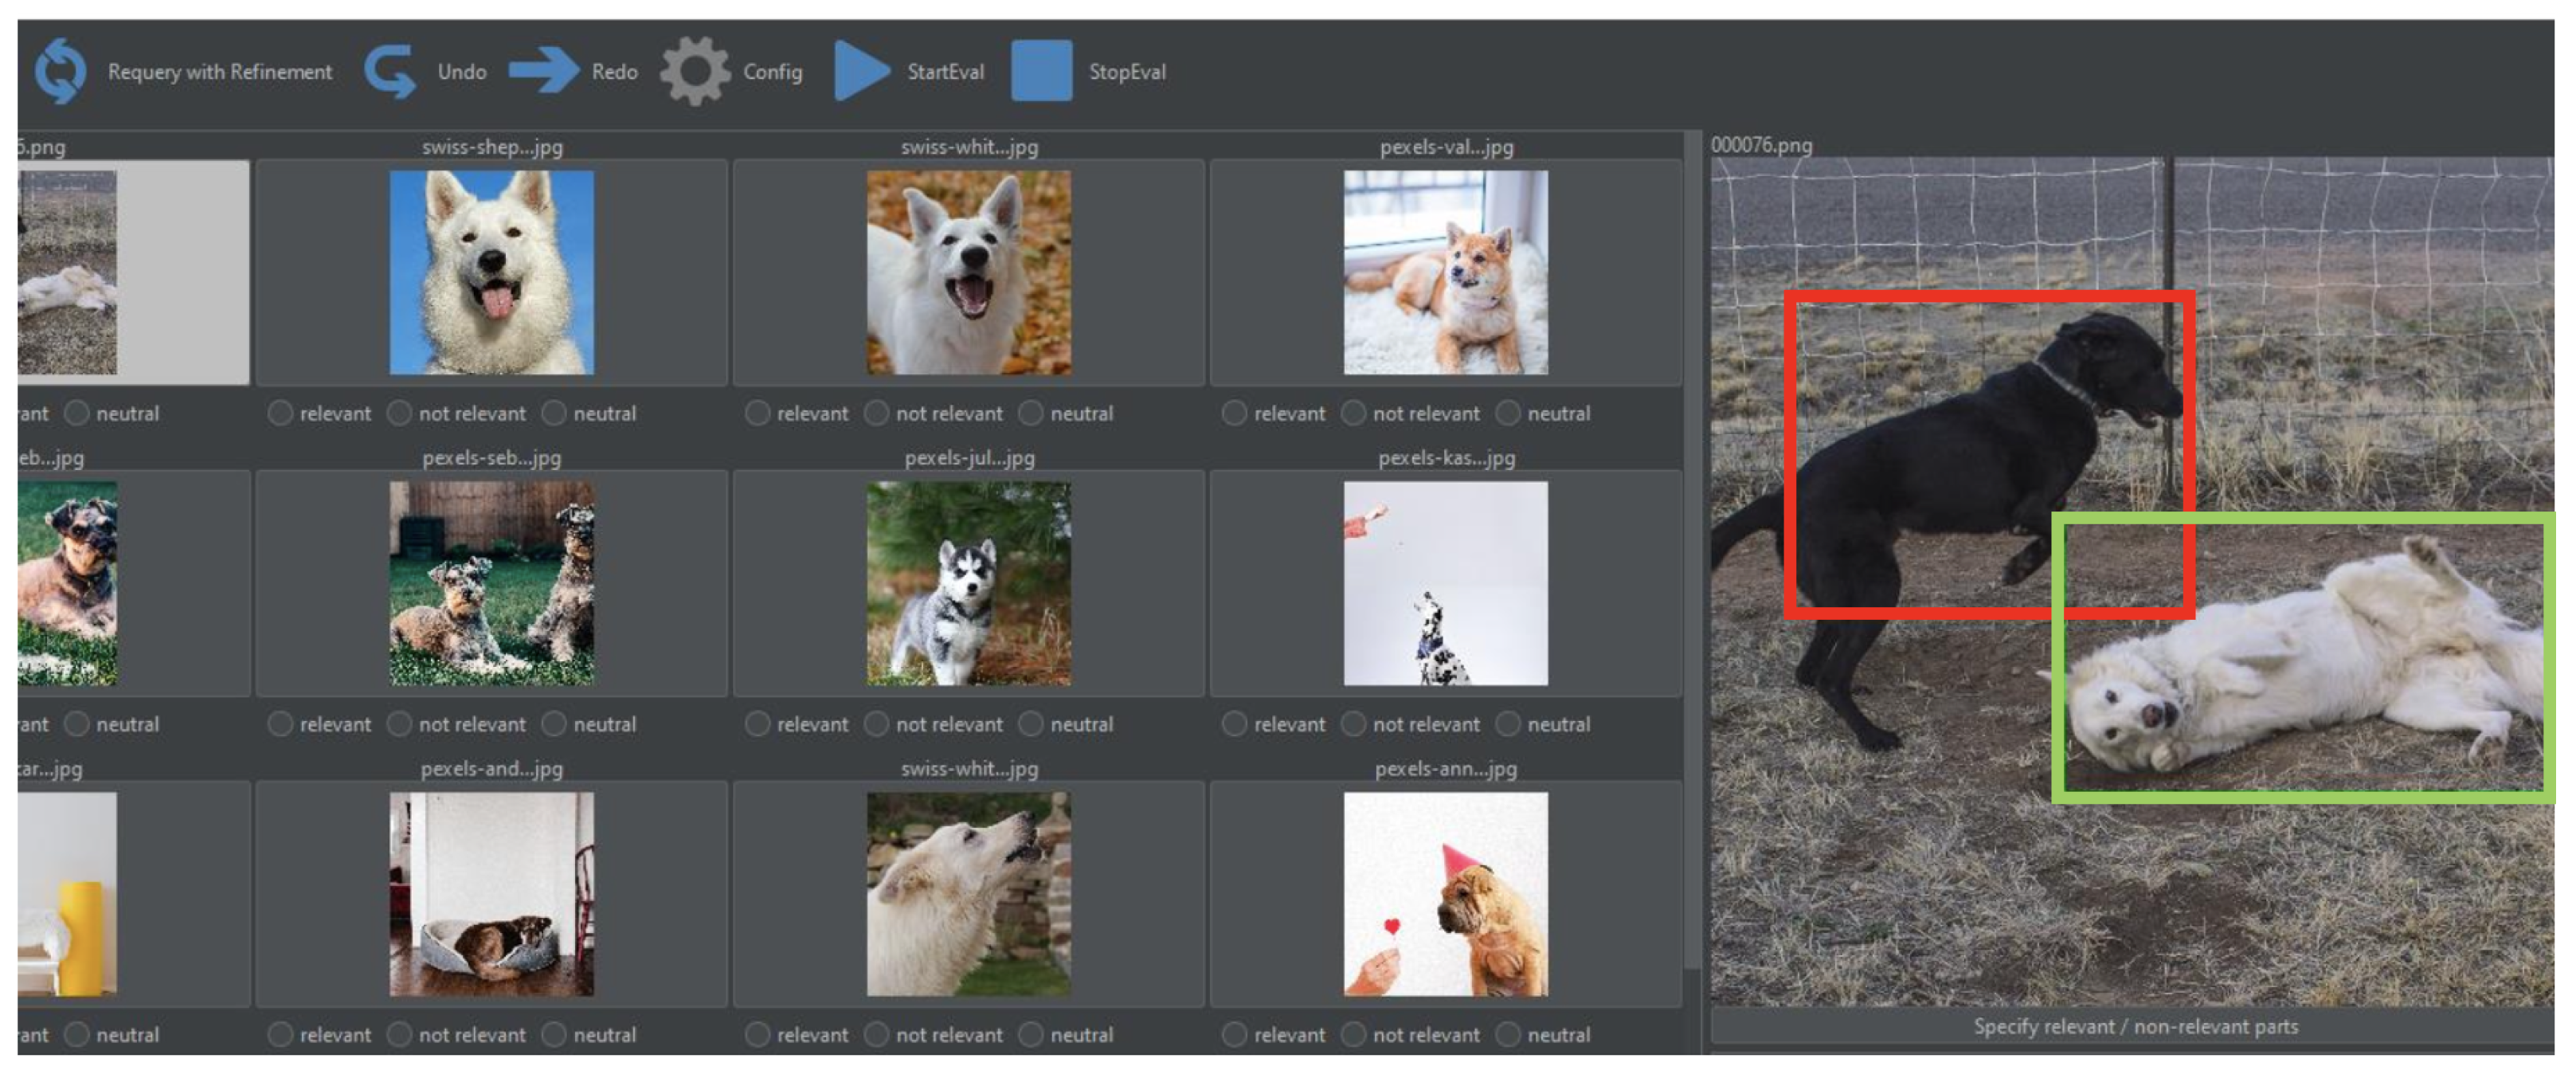
Finally, in the area of visualization and explainability, a prototypical implementation of relevance feedback and query refinement has been added to the framework, which allows users to mark sections of MM Objects as being generically relevant or irrelevant. Each such mark internally is processed as a separate graph code and correspondingly added or subtracted from the query. Figure 11 shows a screenshot of the implemented solution.
In Figure 11, for each result element, a set of check boxes is added, which give the users the opportunity to mark a complete asset as being “relevant”, “irrelevant” or “neutral” according to the current query. Furthermore, even the subsections of the content of a selected query can be marked by drawing bounding boxes (for images) or highlighting text with different colors to indicate which passages or sections are relevant or irrelevant. This highly improves the overall effectiveness of the MMIR process, as users are now able to interactively and visually refine their queries. Further details of this approach are given in Section 5.
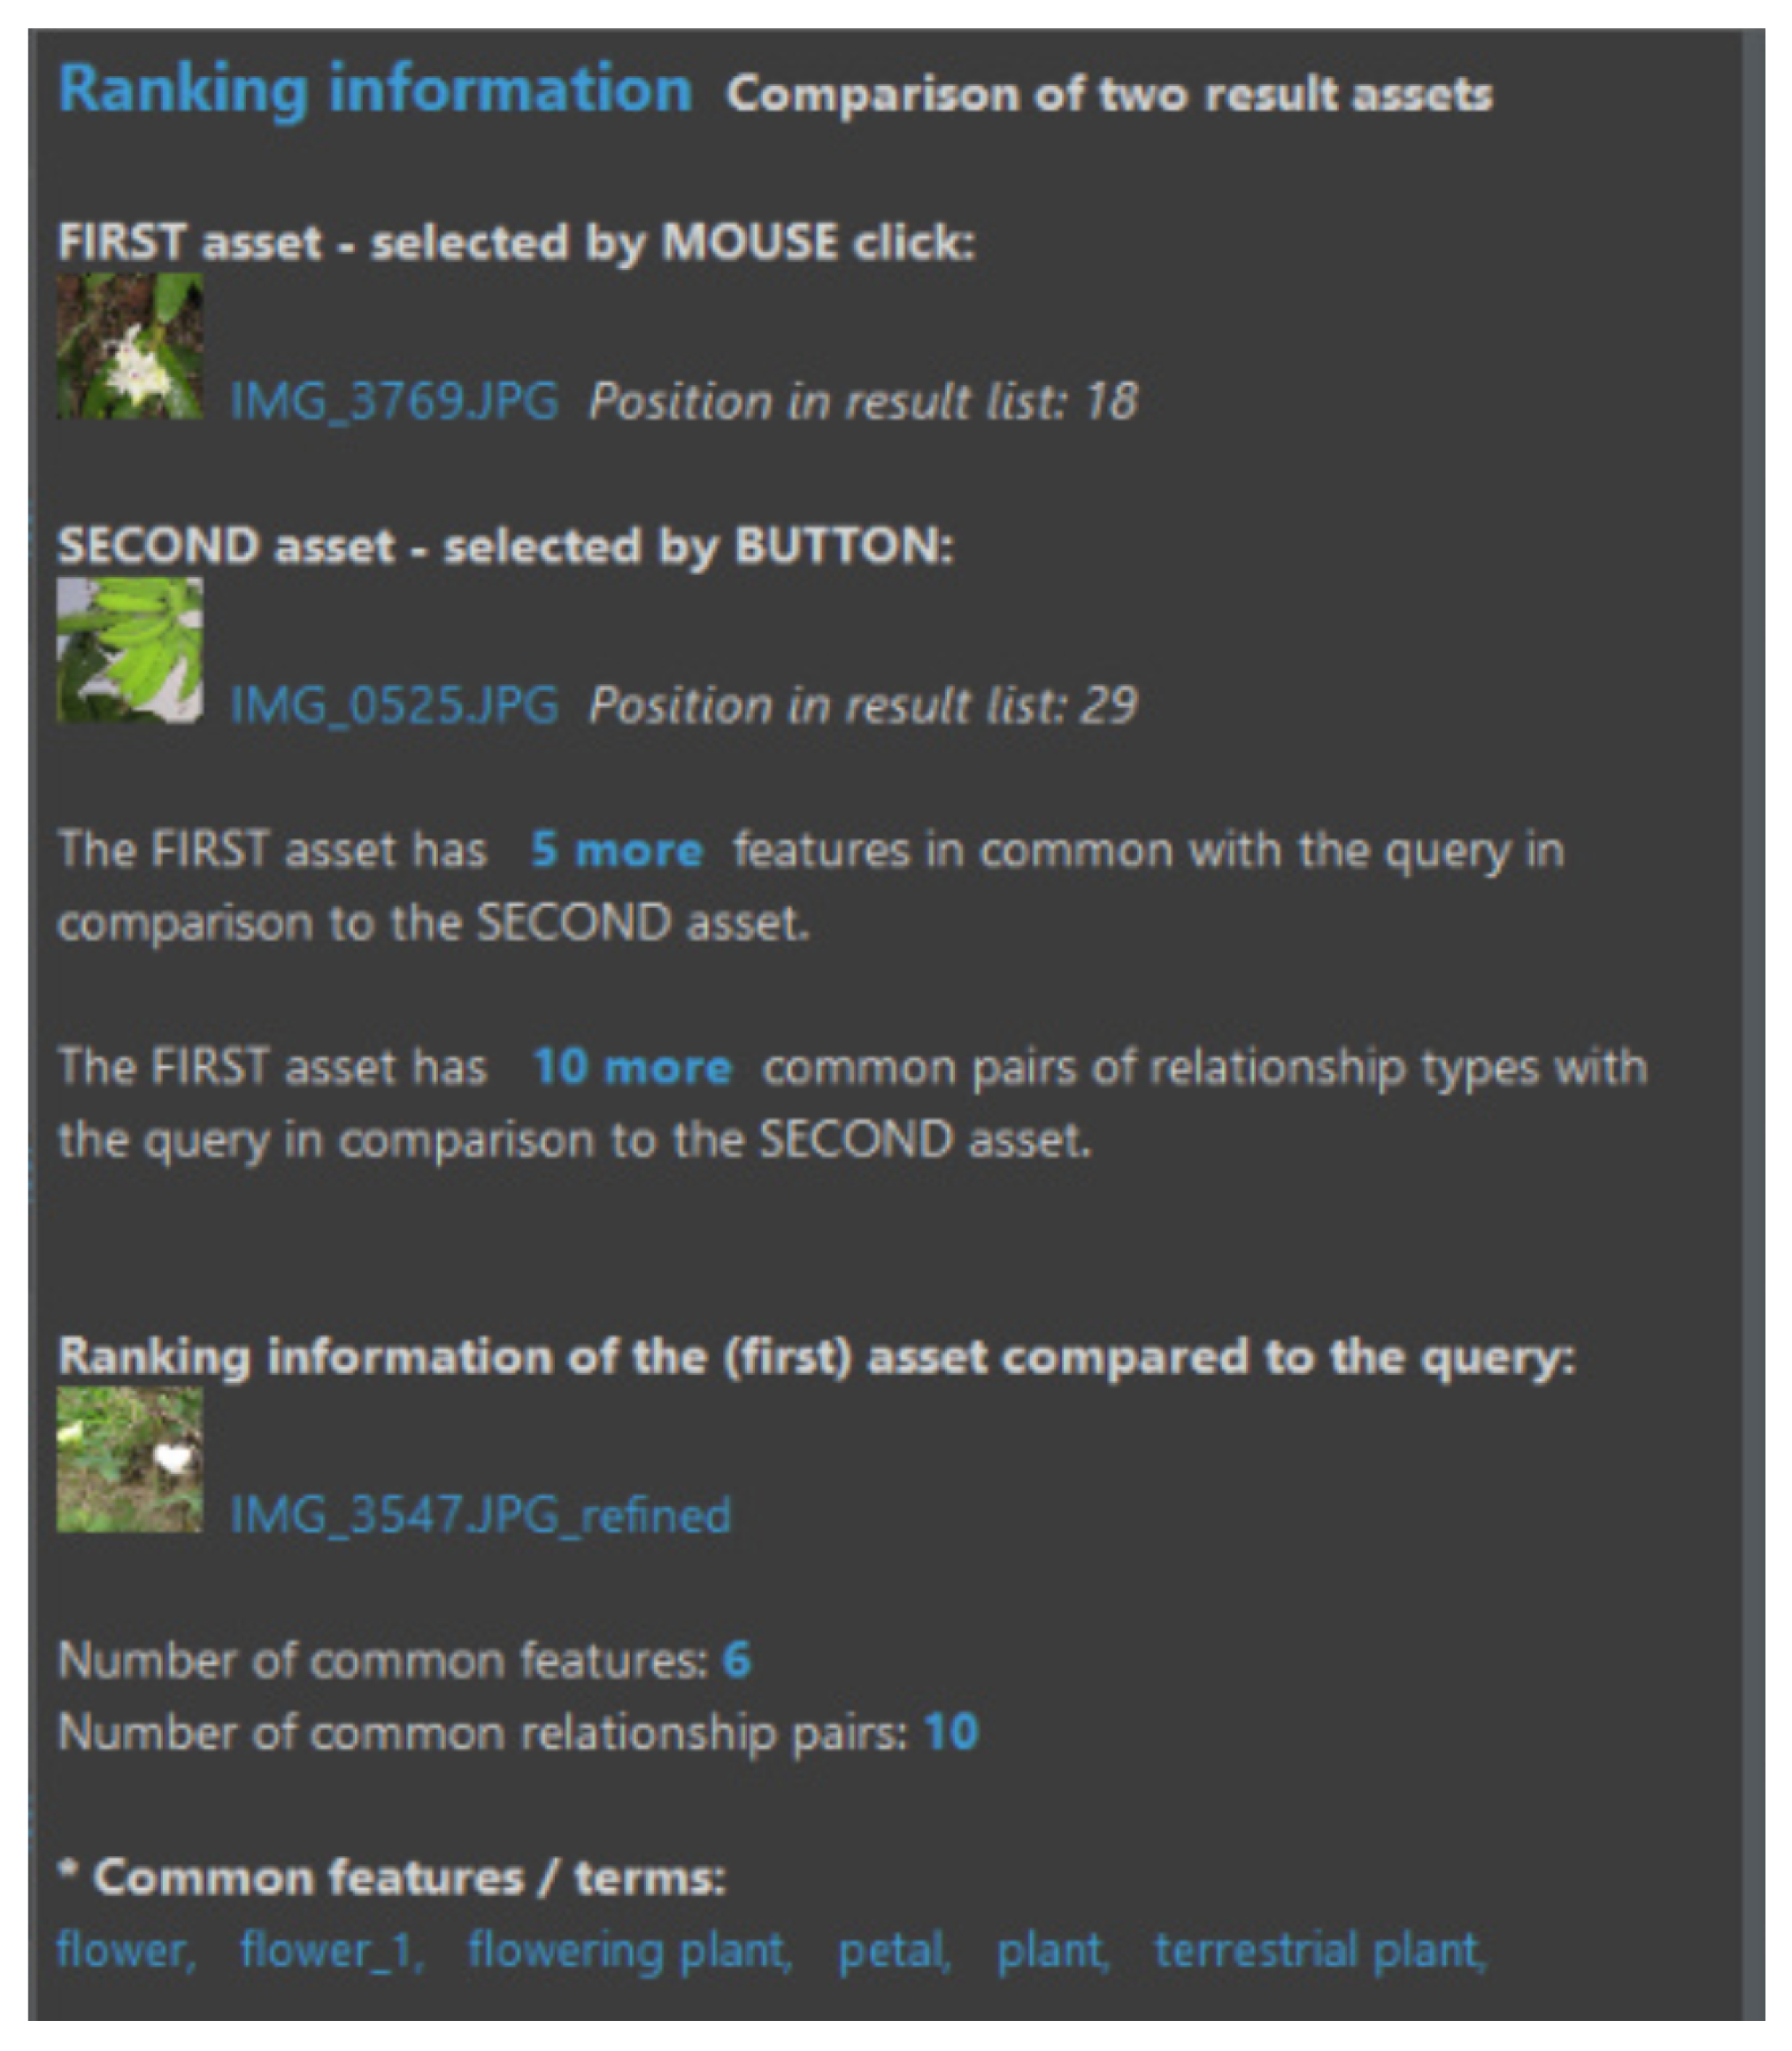
Furthermore, the expressiveness of the GMAF is improved by adding complex comparison functions, which explain why an MM asset is in a result list, what the difference is between two selected MM assets, and what MM features are contained in an MM object from an MMIR perspective. An example of this is shown in Section 5.
For the processing of reasoning and inferencing, the Apache Jena project [34] is integrated with the GMAF, which comes with various APIs to define rules and to calculate inferences. As the Jena project is able to import RDFS and RDF files, the integration of the MMFG-RDFS-datastructure is implemented employing the RDF and RDFS export formats of the GMAF. The result of this integration is that the GMAF framework can now calculate inferences and conflicts based on its own semantic model by passing RDF to Jena, letting Jena calculate the consistency and inferences of the model and thus define the default logics and the corresponding set of facts and hypotheses . The code snippet in Listing 4 shows the exemplary steps to validate a model and to show conflicts.
| Listing 4. Use of the explainability-feature of the GMAF. |
1 // Generate the relevant GraphCode 2 Vector<GraphCode> gcs = 3 MMFGCollection.getInstance().getAllGC(); 4 GraphCode relevantGC = TFIDF.calculateRelevantGC(gcs); 5 RDFExporter.export(relevantGC, "mmfgDataExport.rdf"); 6 7 // Initialize Apache Jena 8 Model schema = RDFDataMgr.loadModel("mmfgSchema.rdf"); 9 Model data = RDFDataMgr.loadModel("mmfgDataExport.rdf"); 10 InfModel infmodel = ModelFactory.createRDFSModel(schema, data); 11 12 // Validate Collection 13 ValidityReport validity = infmodel.validate(); 14 if (validity.isValid()) { 15 // everything fine 16 } 17 else { 18 // Conflicts 19 for (ValidityReport.Report r : validity.getReports()) { 20 System.out.println(r); 21 // process the conflict 22 } 23 } |
The example in Listing 4 shows that Jena is employed as a calculation engine for inferencing and reasoning based on the GMAF and MMFG representations (Lines 8–10). All relevant MMFG information is exported to a mmfgDataExport.rdf file in RDF format (Line 5), which is then loaded into Jena (Line 9). Then, the inferencing model can be calculated (Line 10) and a validity report can be generated (Lines 13–23).
4.4. Summary
The exemplary implementations of the POC presented in this section show that the proposed approach can actually be implemented and that both integration and scalability as well as explainability of the GMAF can be extended to become smarter. In the next section, an evaluation of this POC is presented.
5. Evaluation
In this section, details of the evaluation of the POC are discussed. Additionally, following the structure of the previous sections, for each of the problem areas, selected experiments are presented, which outline the overall improvement of MMIR by employing Smart MMIR approaches. First, an evaluation of the integrability of the Smart MMIR components is given in Section 5.2. Then, experiments in the area of scalability are presented in Section 5.3, and finally, in Section 5.4 results in the area of explainability are presented.
5.1. Soundness
The introduction of soundness provides additional insight and further expressiveness to users, which can be regarded as a major improvement of explainability in MMIR applications. Hence, in the following discussion, further experiments and the corresponding results are shown, which demonstrate the benefits of in various application areas.
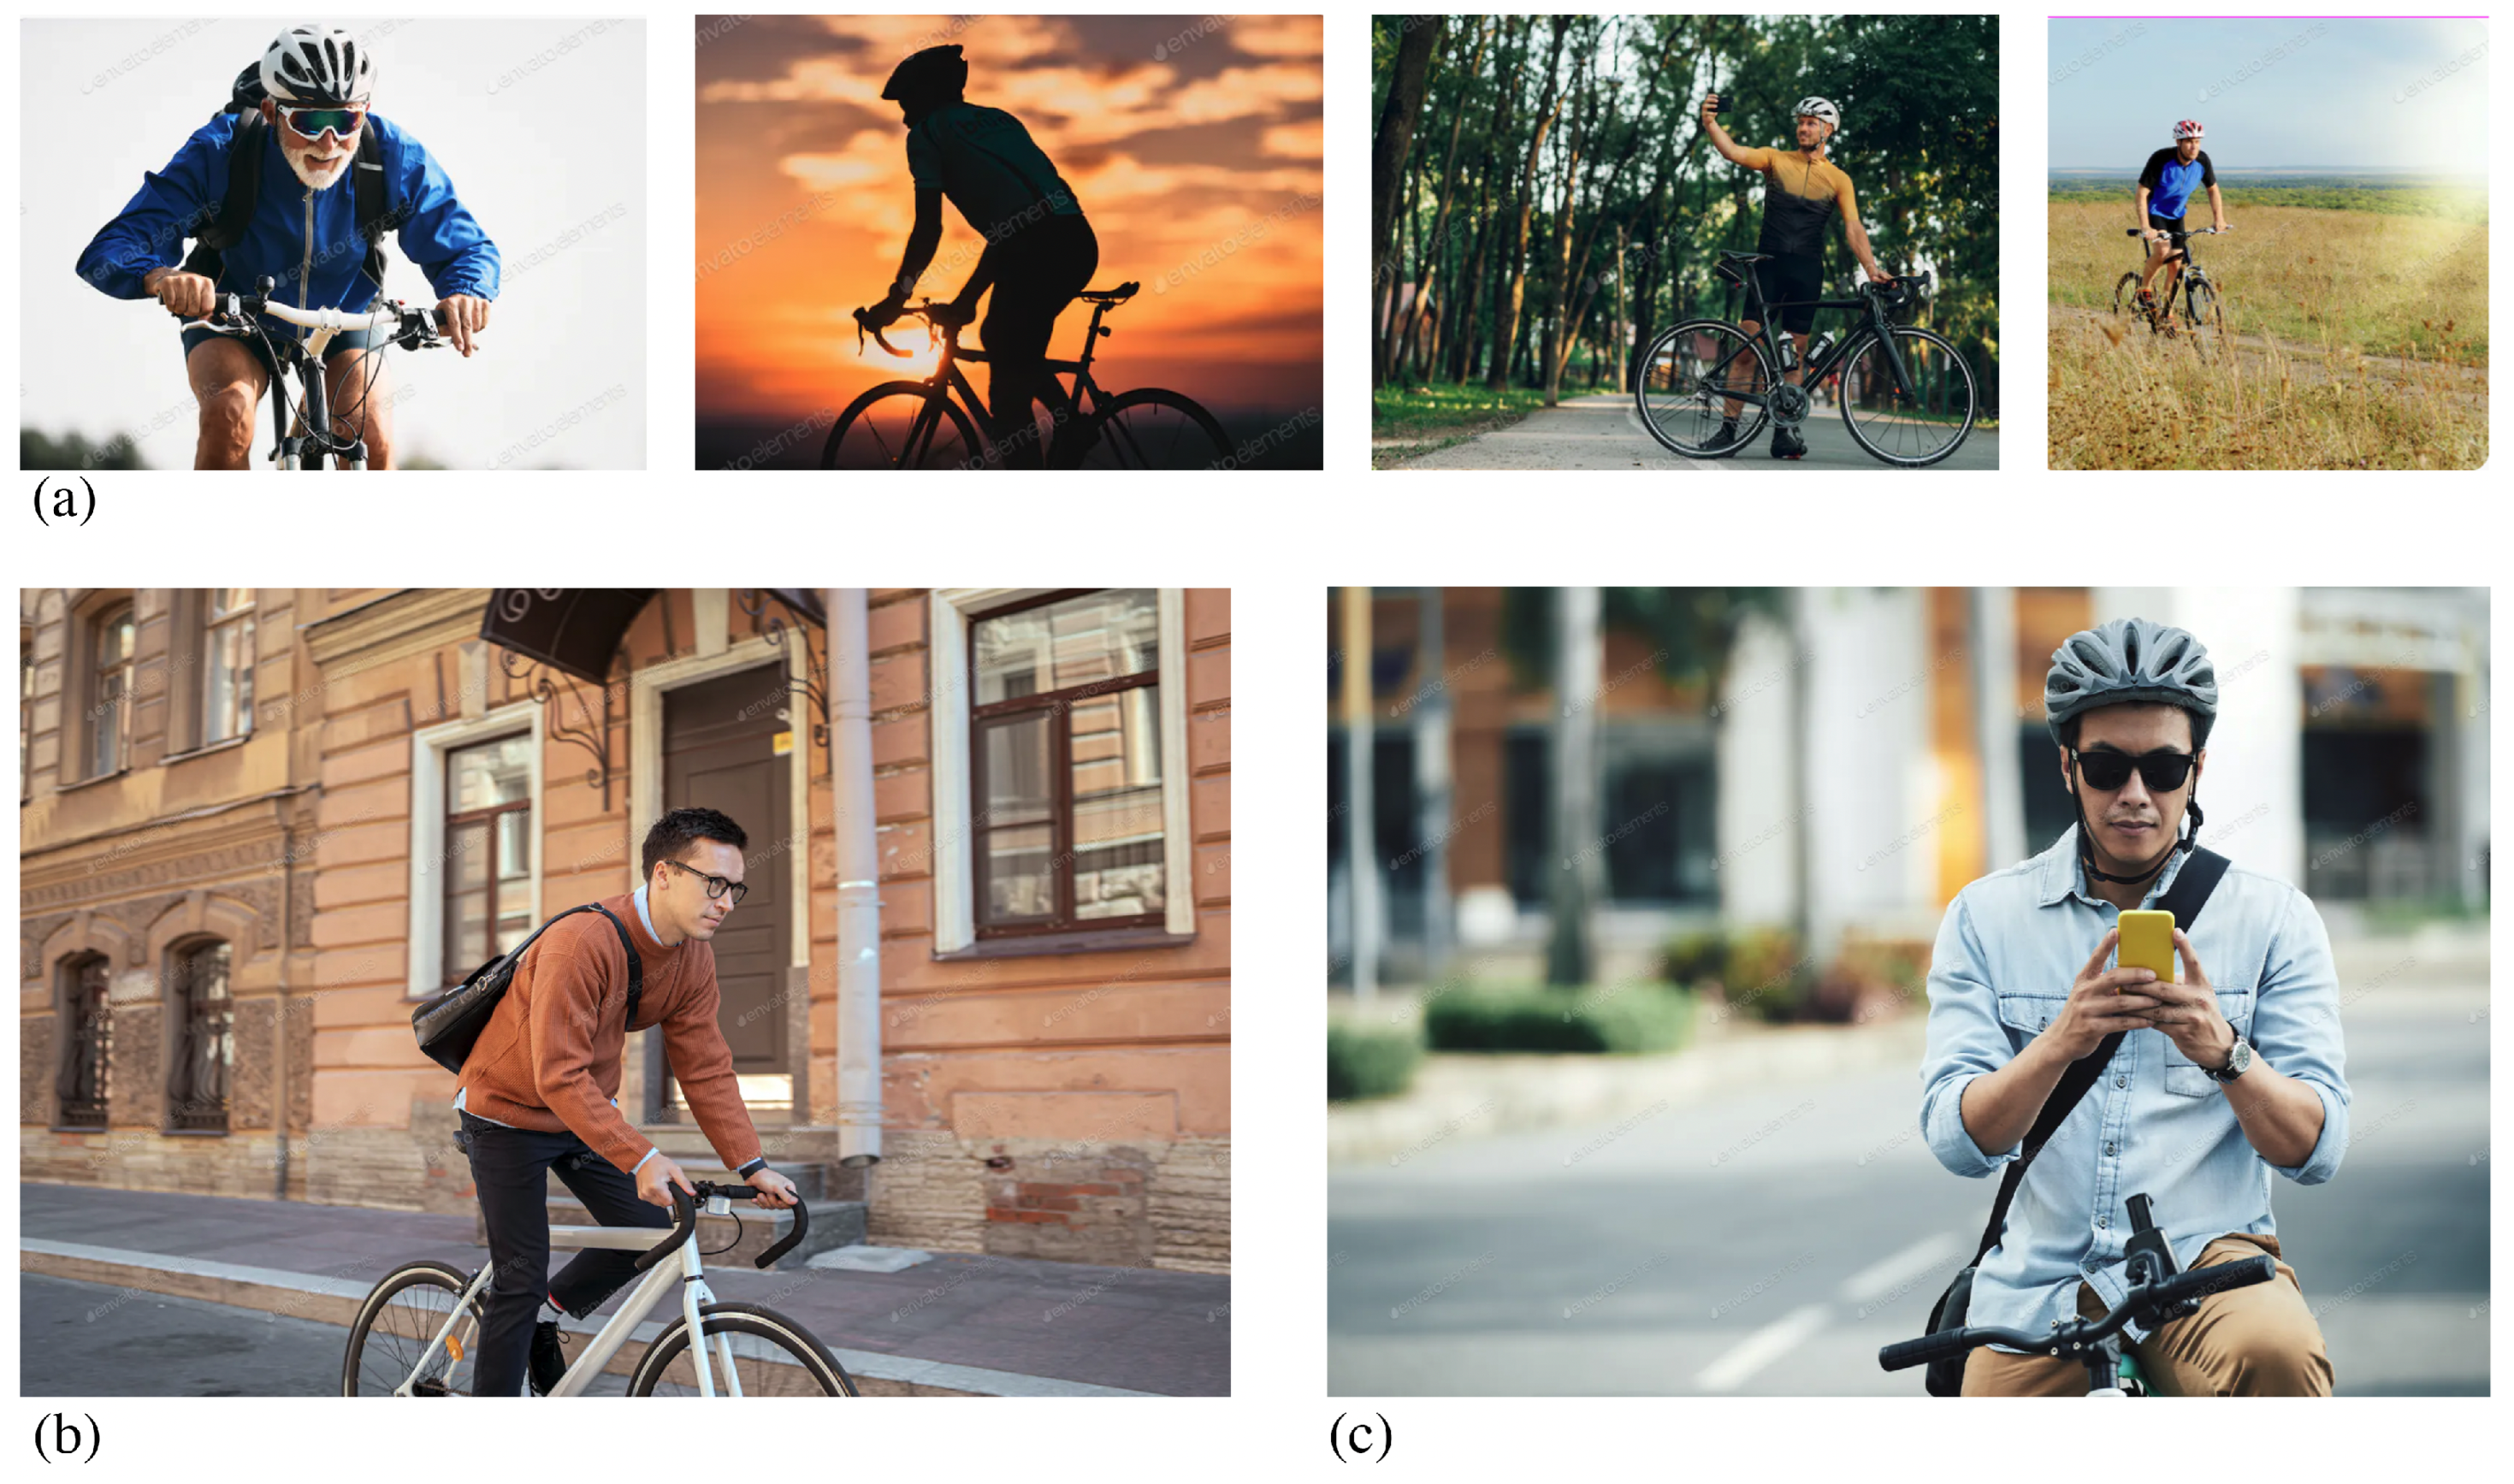
The detetection of security-relevant traffic scenes is one major task in the area of automotive and autonomous driving. The introduction of soundness can contribute to this task by comparing the actual traffic scene to expected or uncritical and secure traffic scenes. One major advantage of this is that the calculation of soundness falls down to simple matrix operations, which can be performed extremely fast, even in real time, which is highly important in the area of autonomous driving. In the following experiment, we investigated if and how soundness can be employed to approve, if the behavior of cyclists can be regarded as safe, or if a higher risk for injuries has to be expected in the case of an accident. Therefore, we took legal texts as sound input, which define the recommendations for safe cycling (such as wearing a helmet) and created a graph code of this text. Then, a set of images was processed with the GMAF to also calculate the corresponding graph codes . The images were taken from Adobe Stock [35] (see Figure 12).
contained vocabulary terms and relationships that, for example, described that wearing a helmet is safe, the handling of smartphones during driving is not safe, etc. In total, had 132 vocabulary terms and the corresponding relationships. For this experiment, we did not use the intersection of and , as this would lead to a loss of relevant safeness parameters. Instead, we decided to leave all 132 vocabulary terms and relationships as input for the calculation of soundness. In total, 250 images were processed in this way. The results show that no image fully complies to all vocabulary terms and relationships and thus provide a perfectly sound result. This was, of course, expected, as legal texts and the corresponding transformation into graph codes as well as the object detection algorithms employed within the GMAF produced slightly different levels of features. Even after a semantic analysis based on , there was no perfectly sound result. However, the experiment shows that most images of the chosen dataset produce a soundness of = 0.7–0.8 (see example images shown in Figure 12a). Some images show a significantly lower value as shown in Figure 12b with and Figure 12c with . A visual examination shows that images with lower values contain indicators for safety violations, such as not wearing a helmet or dealing with a smartphone during cycling.
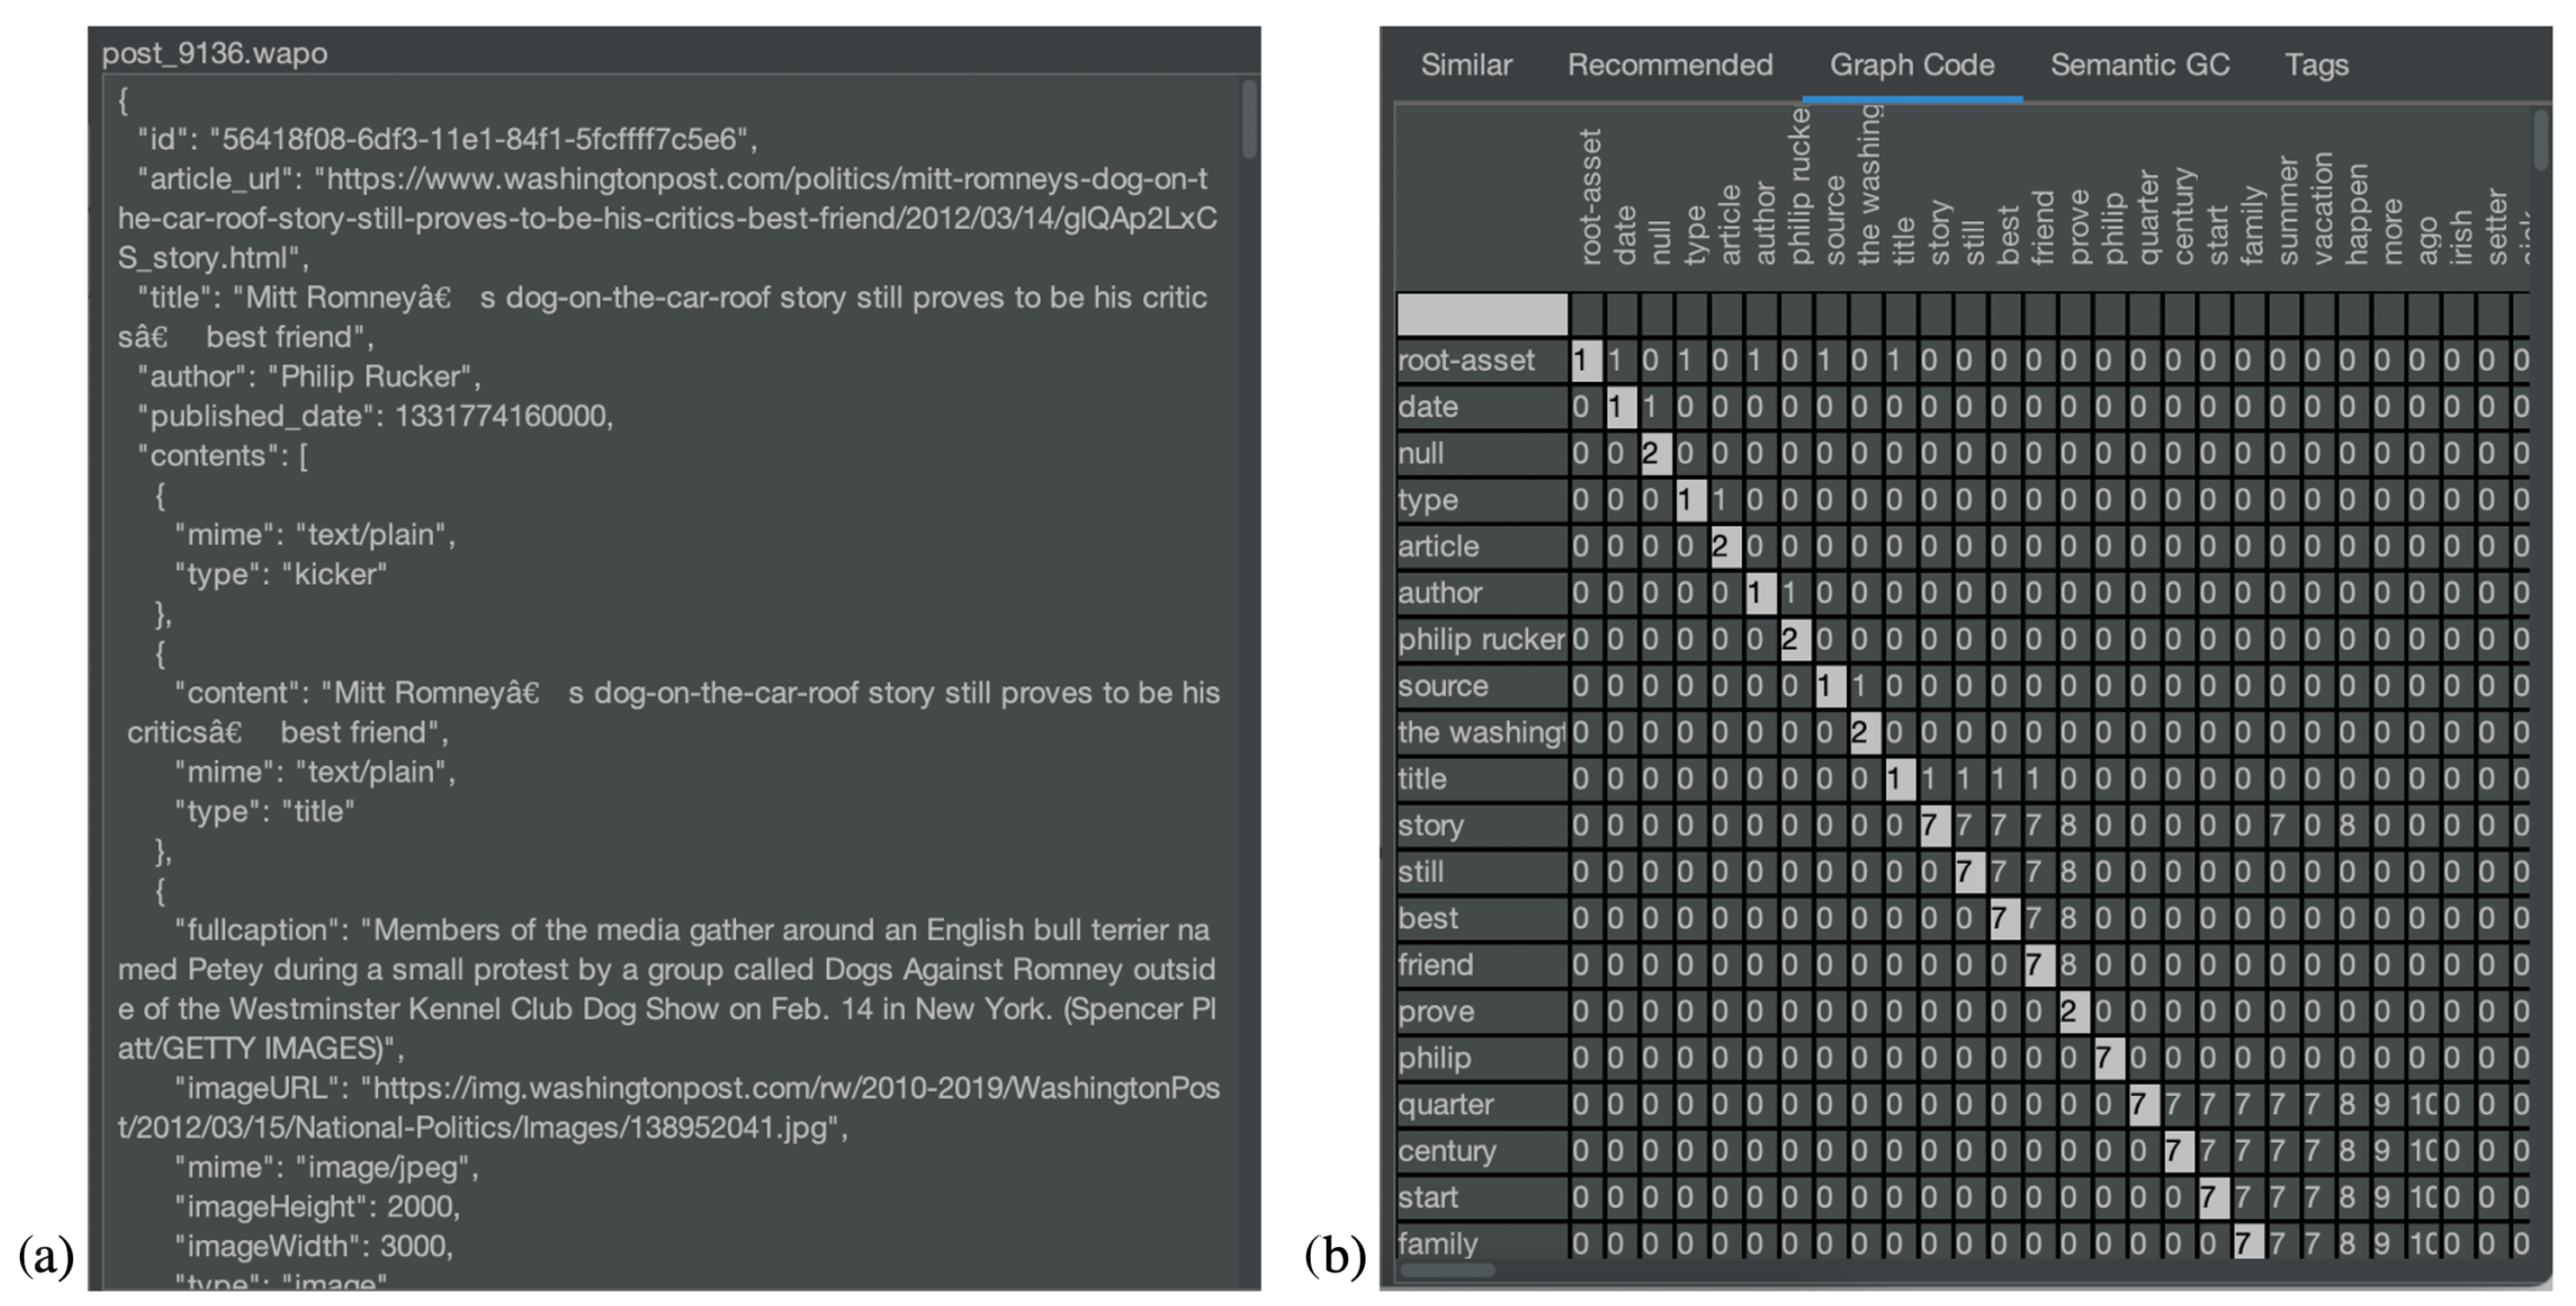
Another area where soundness can support MMIR processes is the area of news and fake news. As a underlying dataset, we selected the text archive of the Washington Post [36], which is also part of the reference datasets of the TREC conference [37] and contains about 750,000 articles in machine readable JSON-format (see Figure 13a). These articles were processed into graph codes (see Figure 13b).
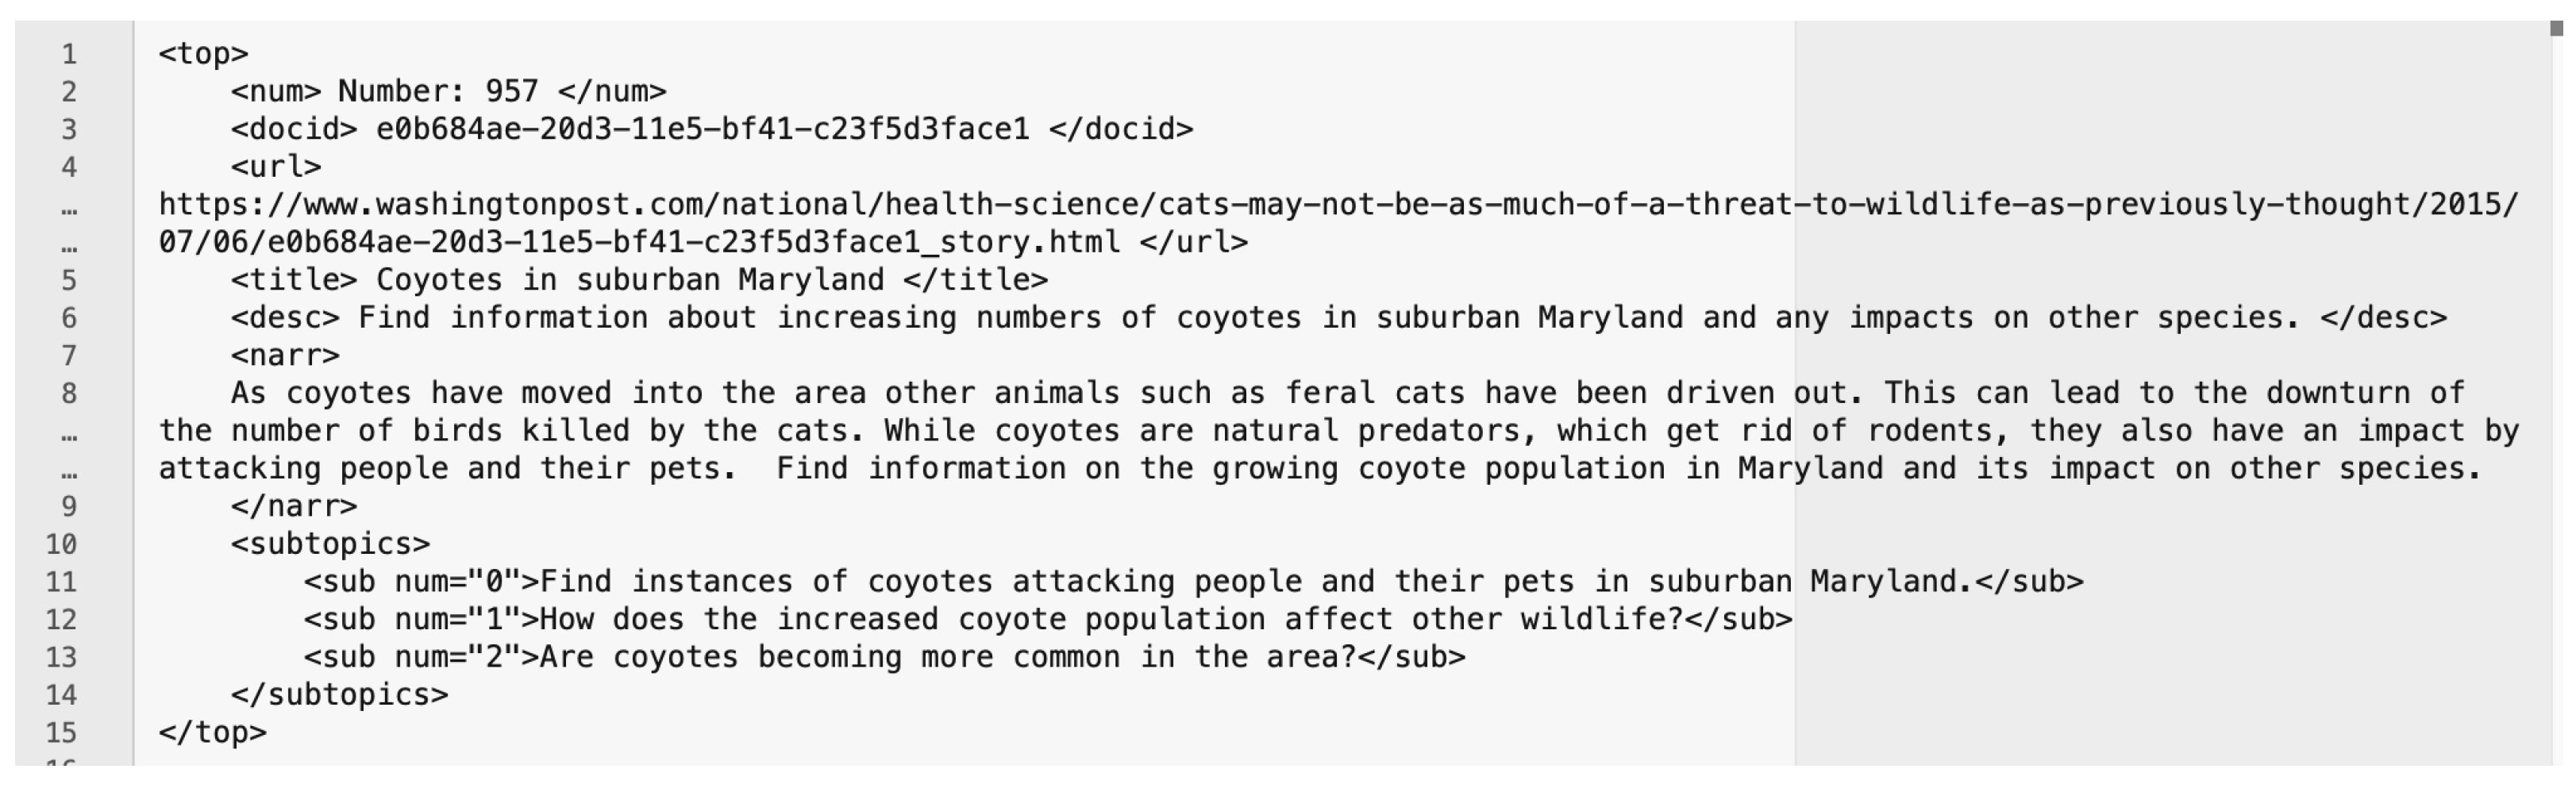
Based on these prerequisites, we conducted two experiments. First, the soundness between two articles in the same topic area is calculated. Second, the soundness parameter is employed to determine contradicting documents within the same topic area. In both cases, it is required to work on articles within a similar topic. It does not make sense to compare sports articles with international politics. As a starting point, we selected an article that has also been employed during the TREC 2021 conference about “Coyotes in Maryland” (see Figure 14).
Based on this starting point, different datasets were selected for both experiments, and was calculated for the base article and the elements in the datasets. For the first experiment, a similarity search (based on ) was performed to define the dataset. For the second experiment, a search for recommendations (i.e., somehow related articles) based on was performed to define the dataset. The expectation is that similar articles would mostly be sound, while in the recommendations, also contradicting elements can be found. In this manner, we selected 25 documents for each experiment, the results of which are shown in Table 1.
In the first row of Table 1, the input document (see Figure 14) with Doc-Id “c23f5d3face1” is processed and—of course—achieves the highest possible value for similarity, recommendation and soundness. In the remainder of Table 1, the other documents of the 25 selected items and the corresponding processing values are shown. The last row in the table with Doc-Id “fake news” contains an article that was re-written based on the original text (see Figure 14) with the narrative “As birds have moved into the area other animals such as coyotes have been driven out. This can lead to the downturn of the number of other animals killed by the birds. While birds are natural predators, which get rid of coyotes, they also have an impact by attacking people and their pets”. So basically, the terms “coyote, bird, other animals” were switched to produce a fake news article.
The results for soundness in this experiment show that soundness is independent from similarity or recommendations. Furthermore, it shows that it can be employed for fake news detection, as the value for manually produced fake articles is significantly lower than the values for the other articles. We assume that the combination of all Graph Code metrics and will deliver the best fake detection results. This will be further elaborated as part of future work. However, even this experiment shows that can provide a highly relevant measure. Furthermore, it is important to highlight that the calculation of falls down to simple matrix operations, which can be processed easily, efficiently, and even in parallel. This will be shown in the experiments in Section 5.3. Additionally, a further compression in terms of feature fusion can be an additional means to compress the graph codes for processing. This is now shown in the next section.
5.2. Integration Area
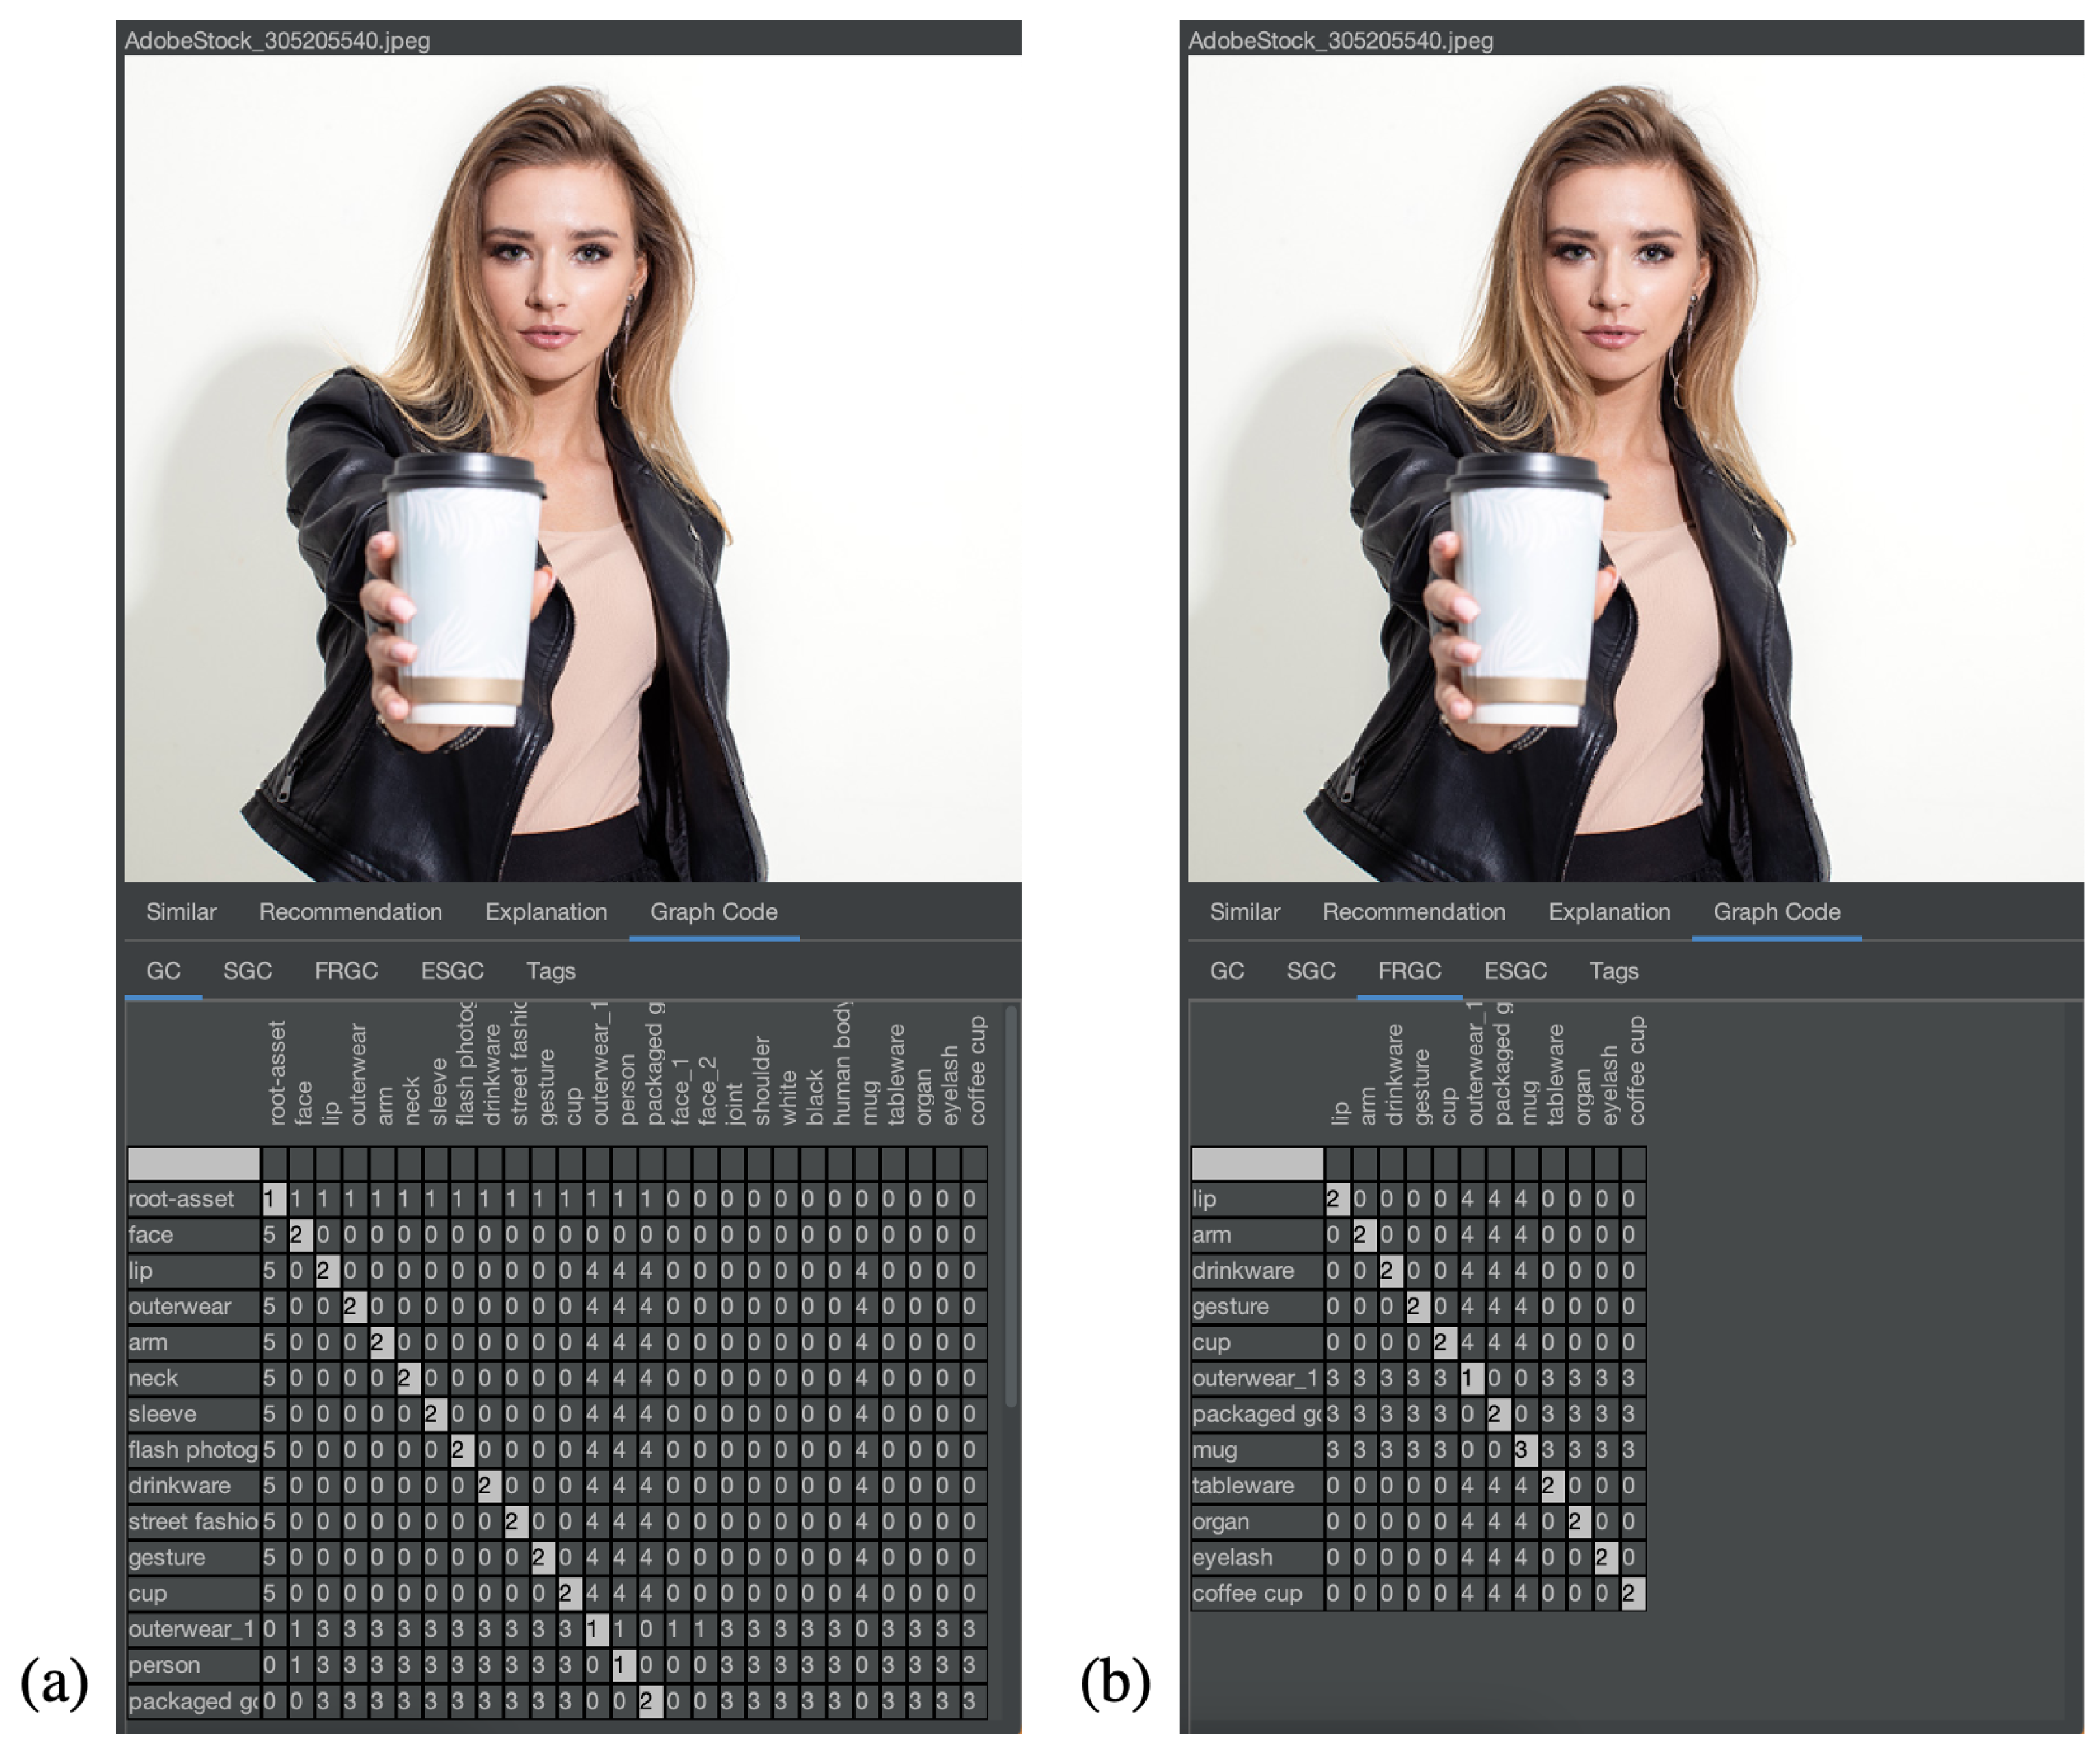
In the area of integration, relevance calculations can be performed by employing feature fusion strategies. To show the improvement of feature fusion, a qualitative experiment was conducted, where the resulting graph codes of images are compared. Figure 15 shows two graph code for the same image. In Figure 15a) the normal graph code is shown, while in Figure 15b), a feature fusion plugin is applied, which removes irrelevant features according to the collection’s content. In this experiment, the collection contains 200 photos of a photo shoot with the same person, same background, same clothing, etc. However only in few photos, the person in the picture presented a coffee cup.
This experiment clearly shows the improvement of feature fusion and relevance calculations. When considering that the graph code in Figure 15b) now contains exactly the subset of MM features, that is actually relevant for the collection, this becomes a very Smart MMIR solution. Of course, when looking for a “coffee cup”, the image would have been found also without Smart MMIR. However, when asking questions, such as “why is this image relevant?” or “what is the most important information on this image?”, Smart MMIR can produce answers immediately. This is also further evaluated in the area of scalability and presented in the next subsection.
5.3. Scalability Area
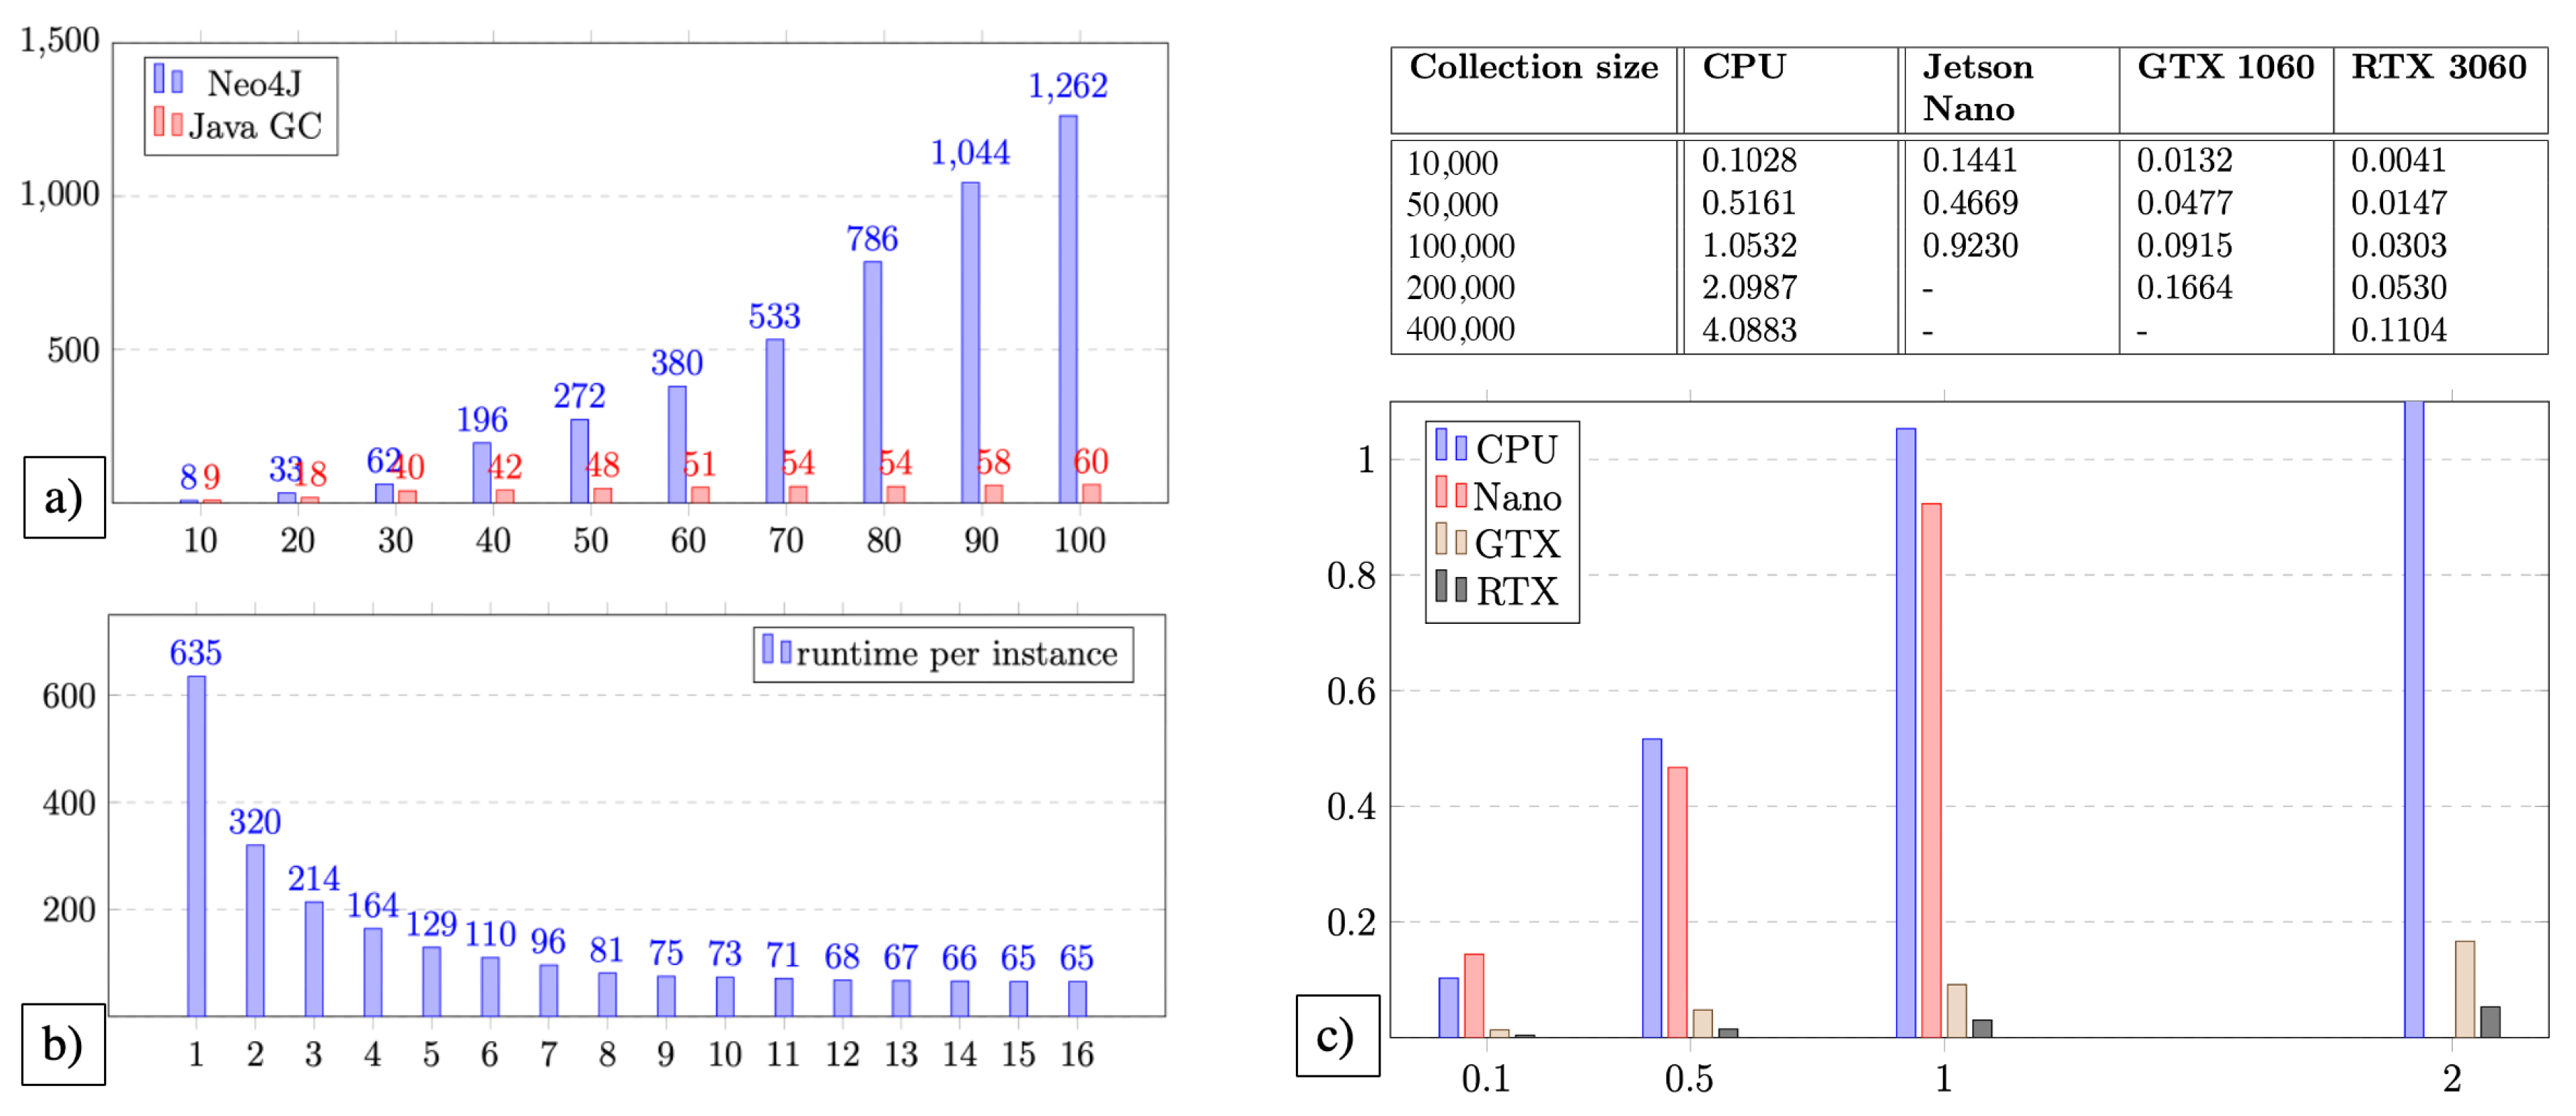
In the area of scalability, several quantitative experiments were conducted to further refine and detail the set of experiments already shown in [2]. Figure 16 shows the corresponding results. The details of this extended evaluation are given in Table 2 and Table 3 based on the number of input images c, the number of calculated MMFG nodes n, the corresponding edge number e, the Neo4J runtime with (i.e., that Neo4J compares up to three links between nodes for similarity). The and column shows the runtime of the corresponding GMAF implementation. The evaluation of scalability is shown in Table 4 based on n nodes, i GMAF instances, the number a of multimedia objects per instance, and the runtime t for the execution of the experiment. Furthermore, in Table 5, the overall runtime based on the number of physical servers for horizontal scaling and the number of instances per physical sever is evaluated. Finally, Table 6 shows the parallelization (i.e., vertical scaling) based on CPU and GPU implementations of the graph code algorithms.
In Figure 16a, a comparison of the runtime of a similarity search based on graphs (blue) and graph codes (red) is shown. For the graph calculations, a standard Neo4J database [38] was employed and the calculated MMFGs were inserted. On GMAF side, a standard Java implementation of the above-mentioned metrics was employed for this comparison. The experiment was executed on the same machine. The results of this experiment clearly prove that graph codes have a better scaling (linear vs. polynomic or exponential) than graph-based algorithms. In this experiment, a speedup of factor 20 was achieved; however, the switch to linear complexity is, of course, even more important than the numbers.
Figure 16b shows the results of a runtime measuring of a horizontal distribution of GMAF instances, which perform graph code based operations. This also shows that the overall runtime of a query processing can be reduced significantly by adding additional nodes to a GMAF setup. The optimal number of nodes for this particular experiment is between 8 and 10, and leads to an improvement of the overall processing time by a factor of 8.01 (8 nodes with processing time of 81 s vs. 1 node with processing time of 635 s). For this experiment, huge collections containing 750,000 elements were employed to obtain reliable results of the possible speedup.
Figure 16c shows both the result values and a diagram of an experiment for vertical scaling on different hardware. In particular, here, the CUDA implementation for NVIDIA GPUs was evaluated. This experiment showed that significant improvement can be achieved also within a single GMAF instance by enabling parallel processing. In this example, a speedup of factor 40 was measured, which is only limited by the number of parallel processing units on the GPU. If, theoretically, the whole collection fits into the GPU memory, any MMIR processing can be performed in a single step, producing results immediately.
Depending on the application, these three scaling methods can be flexibly combined and integrated with each other. If these experiments are combined, the overall processing time can be reduced by factor . This means that when the previous processing of a MMIR request takes, for example, 6.400 s (i.e., one hour and 45 min), the same request can be resolved with Smart MMIR in a single second.
5.4. Explainability Area
For the area of explainability, various cognitive-walkthrough-based experiments were conducted to evaluate how Smart MMIR can improve the overall MMIR experience for users. As stated in the modeling section, further research is planned in this area. Therefore, the following experiments are mostly designed to confirm that the changes in the areas of integration and scalability do not affect the existing solution. Therefore, in this subsection, two examples of these experiments are shown.
Figure 11 already showed the user interface for query refinement. On the right side, sections of a specific image were marked as “relevant” (green bounding box) and “irrelevant” (red bounding box). The results of this refined query are shown in the center of this screenshot and demonstrate that, due to this refinement, now only white (or at least white-ish) dogs remain in the result list, and black dogs were removed automatically. In a second experiment, the textual visualization of MMIR processing steps was evaluated. Figure 17 shows how the results of a GMAF search can now be explained automatically by comparing them to the query and applying the introduced metrics.
5.5. Summary
Summarizing this evaluation section, it can be stated that Smart MMIR improves existing MMIR solutions in all problem areas. The experiments show an increase in integrability, significant performance optimizations, and also UI components that provide more expressiveness and explainability for the users. Particularly, the introduction of soundness and the corresponding capabilities of SMART MMIR in various application areas, can improve existing solutions and applications. Therefore, the results of these experiments support the overall assumption that Smart MMIR can provide benefits in all areas of MMIR.
6. Summary and Conclusions
In this paper we introduced, defined, and evaluated our definition of the term “Smart MMIR” and showed how Smart MMIR differs from standard MMIR. Based on previous work, Smart MMIR can be achieved by adding further modeling, formal calculations, and functional extensions to standard MMIR processes, components and processing steps. Smart MMIR improves MMIR in the following areas:
- Interoperability and integration: the integration of processing flows and feature fusion provides significant benefit for the interoperability with other applications, the adaptation of solutions for distinct application areas, and the exchangeability of algorithms for further refinements of MMFGs and graph codes.
- Scalability: the improvements in the area of scalability are enormous. Both vertical and horizontal scaling provide a significant speedup of the overall processing time and their combination offers opportunities to increase the Smart MMIR experience for users.
- Explainability and expressiveness: in addition to the already existing generation of human understandable texts based on ESMMFG and ESGC, further MMIR expressiveness is introduced to provide and visualize insight into MMIR processing steps.
All these areas are important for any modern MMIR application, algorithm, component, user interface, or framework. The Smart MMIR improvements can either be adapted for other solutions or integrated via the GMAF API to enrich applications with Smart MMIR mechanisms and algorithms.
Furthermore, Smart MMIR offers great opportunities for further research in the areas of feature fusion, reasoning and inferencing, feature extraction, and feature detection. Therefore, Smart MMIR can be regarded as an important and relevant base technology in the area of multimedia information retrieval.
Author Contributions
Conceptualization and methodology: S.W. and M.H. Software, validation, formal analysis, investigation, resources, data curation, writing: S.W. Review, editing and supervision: P.M.K. and M.H. All authors have read and agreed to the published version of the manuscript.
Funding
This research received no external funding.
Institutional Review Board Statement
Not applicable.
Informed Consent Statement
Not applicable.
Data Availability Statement
The data presented in this study are openly available in [33].
Conflicts of Interest
The authors declare no conflict of interest.
References
- Statista Ltd. Social Media—Statistics and Facts. 2020. Available online: https://www.statista.com/topics/1164/social-networks/ (accessed on 10 November 2022).
- Wagenpfeil, S.; McKevitt, P.; Hemmje, M. Fast and Effective Retrieval for Large Multimedia Collections. Big Data Cogn. Comput. 2021, 5, 33. [Google Scholar] [CrossRef]
- Wagenpfeil, S.; McKevitt, P.; Hemmje, M. Towards Automated Semantic Explainability of Multimedia Feature Graphs. Information 2021, 12, 502. [Google Scholar] [CrossRef]
- Wagenpfeil, S.; McKevitt, P.; Cheddad, A.; Hemmje, M. Explainable Multimedia Feature Fusion for Medical Applications. J. Imaging 2022, 8, 104. [Google Scholar] [CrossRef] [PubMed]
- Nunamaker, J.; Chen, M.; Purdin, T.D.M. Systems Development in Information Systems Research. J. Manag. Inf. Syst. 1990, 7, 89106. [Google Scholar] [CrossRef]
- Library of Congress (U.S.) Text >> Quality and Functionality Factors. 2020. Available online: https://www.loc.gov/preservation/digital/formats/content/text_quality.shtml (accessed on 10 November 2022).
- Wagenpfeil, S.; Engel, F.; McKevitt, P.; Hemmje, M. AI-Based Semantic Multimedia Indexing and Retrieval for Social Media on Smartphones. Information 2021, 12, 43. [Google Scholar] [CrossRef]
- Bornschlegl, F.; Nawroth, C.; Hemmje, M. IVIS4BigData: A Reference Model for Advanced Visual Interfaces Supporting Big Data Analysis in Virtual Research Environments. In Advanced Visual Interfaces, Proceedings of the Supporting Big Data Applications: AVI 2016 Workshop, AVI-BDA 2016, Bari, Italy, 7–10 June 2016; Springer: Berlin/Heidelberg, Germany, 2016. [Google Scholar] [CrossRef]
- Kankanhalli, M.; Chua, T. Video modeling using strata-based annotation. IEEE Multimed. 2000, 7, 68–74. [Google Scholar] [CrossRef] [PubMed]
- Needham, M. Graph Algorithms; O’Reilly Media, Inc.: Sebastopol, CA, USA, 2019; ISBN 978-1-492-05781-9. [Google Scholar]
- Wagenpfeil, S.; Engel, F.; McKevitt, P.; Hemmje, M. Graph Codes-2D Projections of Multimedia Feature Graphs for Fast and Effective Retrieval. 2021. Available online: https://publications.waset.org/vol/180 (accessed on 10 November 2022).
- Asim, M.N.; Wasim, M.; Khan, M.U.G.; Mahmood, N.; Mahmood, W. The Use of Ontology in Retrieval: A Study on Textual, Multilingual, and Multimedia Retrieval. IEEE Access 2019, 7, 21662–21686. [Google Scholar] [CrossRef]
- Domingue, J.; Fensel, D.; Hendler, J. Introduction to the Semantic Web Technologies; Springer: Berlin/Heidelberg, Germany, 2011; ISBN 978-3-540-92913-0. [Google Scholar] [CrossRef]
- W3C.org. SKOS Simple Knowledge Organisation System. 2021. Available online: https://www.w3.org/2004/02/skos/ (accessed on 10 November 2022).
- Chunlin, L.; Jianhang, T.; Youlong, L. Elastic edge cloud resource management based on horizontal and vertical scaling. J. Supercomput. 2020, 76, 7707–7732. [Google Scholar] [CrossRef]
- Liu, C.Y.; Shie, M.R.; Lee, Y.F.; Lin, Y.C.; Lai, K.C. Vertical/Horizontal Resource Scaling Mechanism for Federated Clouds. In Proceedings of the ICISA 2014—2014 5th International Conference on Information Science and Applications, Seoul, Republic of Korea, 6–9 May 2014; pp. 1–4. [Google Scholar] [CrossRef]
- Shamsuddeen, R.; Chan, Y.; Sharifah, M. A Cloud-Based Container Microservices: A Review on Load-Balancing and Auto-Scaling Issues. Int. J. Data Sci. 2022, 3, 80–92. [Google Scholar] [CrossRef]
- Hausser, R. Principles of Computer Linguistics; Springer: Berlin/Heidelberg, Germany; New York, NY, USA; Barcelona, Spain; Hongkong, China; London, UK; Mailand, Italy; Paris, France; Singapore; Tokyo, Japan, 2000; ISBN 3-540-67187-0. [Google Scholar]
- Aho, A. Compilerbau; Oldenbourg Wissenschaftsverlag: München, Germany, 2020; ISBN 9783486252941. [Google Scholar]
- Silge, J.; Robinson, D. Text Mining with R—A Tidy Approach. 2022. Available online: https://www.tidytextmining.com/tfidf.html (accessed on 3 September 2020).
- Krig, S. Interest Point Detector and Feature Descriptor Survey; Springer: Berlin/Heidelberg, Germany, 2016; pp. 187–246. ISBN 978-3-319-33761-6. [Google Scholar]
- Jabeen, S.; Mehmood, Z.; Mahmood, T.; Saba, T.; Rehmann, A.; Mahmood, M. An effective content-based image retrieval technique for image visuals representation based on the bag-of-visual-words model. PLoS ONE 2018, 13, e0194526. [Google Scholar] [CrossRef] [PubMed] [Green Version]
- Zhao, W.; Zhao, F. Learning Specific and General Realm Feature Representations for Image Fusion. IEEE Trans. Multimed. 2020, 23, 2745–2756. [Google Scholar] [CrossRef]
- Zheng, C.; Wu, Z.; Wang, T.; Cai, Y.; Li, Q. Object-Aware Multimodal Named Entity Recognition in Social Media Posts With Adversarial Learning. IEEE Trans. Multimed. 2021, 23, 2520–2532. [Google Scholar] [CrossRef]
- Nawroth, C.; Engel, F.; Eljasik-Swoboda, T.; Hemmje, M. Towards Enabling Named Entity Recognition as a Clinical Information and Argumentation Support. In Proceedings of the 7th International Conference on Data Science, Technology and Applications, Porto, Portugal, 26–28 July 2018; pp. 47–55. [Google Scholar] [CrossRef]
- Lin, Y.; Sundaram, H.; De Choudhury, M.; Kelliher, A. Discovering Multirelational Structure in Social Media Streams. TOMCCAP 2012, 8, 4. [Google Scholar] [CrossRef] [Green Version]
- Snoek, M.; Worring, M.; Hauptmann, A. Learning rich semantics from news video archives by style analysis. ACM Trans. Multimed. Comput. 2006, 2, 91–108. [Google Scholar] [CrossRef]
- Hong, R.; Tang, J.; Tan, H.; Ngo, C.; Yan, S. Beyond Search: Event-Driven Summarization for Web Videos. ACM Trans. Multimed. Comput. Commun. Appl. 2011, 7, 1–18. [Google Scholar] [CrossRef]
- Goh, K.; Li, B.; Chang, E. Semantics and Feature Discovery via Confidence-Based Ensemble. ACM Trans. Multimed. Comput. Commun. Appl. 2005, 1, 168–189. [Google Scholar] [CrossRef]
- Cooper, M.; Foote, J.; Girgensohn, A.; Wilcox, L. Temporal Event Clustering for Digital Photo Collections. ACM Trans. Multimed. Comput. Commun. Appl. 2004, 1, 269–288. [Google Scholar] [CrossRef]
- Arslan, S.; Yazici, A. Content And Concept Indexing For High-Dimensional Multimedia Data. In Proceedings of the 2019 IEEE International Conference on Fuzzy Systems (FUZZ-IEEE), New Orleans, LA, USA, 23–26 June 2019; pp. 1–6. [Google Scholar] [CrossRef]
- Norman, D.; Draper, S. User Centered System Design—New Perspectives on Human-Computer Interaction; Taylor & Francis, Justus-Liebig-University: Gießen, Germany, 1986; ISBN 978-0-898-59872-8. [Google Scholar]
- Wagenpfeil, S. Github Repository of GMAF and MMFVG. 2021. Available online: https://github.com/stefanwagenpfeil/GMAF/ (accessed on 10 November 2022).
- Apache Software Foundation Reasoners and Rule Engines: Jena Inference Support. 2020. Available online: https://jena.apache.org/documentation/inference/ (accessed on 10 November 2022).
- Adobe Inc. Adobe Stock. 2020. Available online: https://stock.adobe.com (accessed on 10 November 2022).
- The Washington Post. Washington Post Archives. 2021. Available online: https://www. washingtonpost.com (accessed on 15 December 2021).
- The Text Retrieval Conference (TREC). TREC Datasets. 2021. Available online: https://trec. nist.gov/data.html (accessed on 15 December 2021).
- Neo4J Inc. Neo4J Graph Database. 2021. Available online: https://neo4j.com (accessed on 15 December 2021).
Figure 1.
Multimedia terms and definitions.

Figure 2.
Overview of the generic multimedia analysis framework (GMAF).

Figure 3.
Distributed processing in the GMAF.

Figure 4.
Mutimedia features represented as a graph code index (a–d), example of a graph code index and its matrix visualization for a text document (e,f).
Figure 4.
Mutimedia features represented as a graph code index (a–d), example of a graph code index and its matrix visualization for a text document (e,f).

Figure 5.
Exemplary social media post with information, that is not sound (a) and sound (b).

Figure 6.
Expert use case for feature fusion and processing flow configuration.

Figure 7.
User-definable processing flows.

Figure 8.
Feature fusion and plugin chain facilities in the GMAF.

Figure 9.
Visualization of query refinement based on relevance feedback.

Figure 10.
Collection processor structure for the distribution of collections and processing.

Figure 11.
Snippet of the UI for query refinement and relevance feedback.

Figure 12.
Calculation of soundness in the area of traffic security.

Figure 13.
Washington Post article (a) and the corresponding graph code (b).

Figure 14.
Sample article chosen as a topic for the calculation of soundness.

Figure 15.
Feature fusion for relevance calculation. (a) shows a regular Graph Code, (b) shows the calculated Feature Relevant Graph Code.
Figure 15.
Feature fusion for relevance calculation. (a) shows a regular Graph Code, (b) shows the calculated Feature Relevant Graph Code.

Figure 16.
Results in the area of scalability.

Figure 17.
Visualization of ranking and comparison information.


Table 1.
Soundness calculation based on the Washington Post dataset.
| Doc-Id | Doc-Id | ||||
|---|---|---|---|---|---|
| c23f5d3face1 | 1.0 | 1.0 | c23f5d3face1 | 1.0 | 1.0 |
| 9736d04fc8e4 | 0.9987393 | 0.93 | e7278db80d86 | 0.9987393 | 0.82 |
| a83e627dc120 | 0.99747854 | 0.88 | a83e627dc120 | 0.99747854 | 0.82 |
| 7f2f110c6265 | 0.99621785 | 0.91 | 7f2f110c6265 | 0.99621785 | 0.79 |
| e7eb4319b8bc | 0.99495715 | 0.89 | 7b9eba0f87d6 | 0.9924357 | 0.81 |
| 0034bb576eee | 0.9936964 | 0.85 | 14b64f3d453f | 0.991175 | 0.86 |
| ... | ... | ... | ... | ... | ... |
| 0047d15a24e0 | 0.96974283 | 0.94 | d43a3ca733b4 | 0.9621785 | 0.91 |
| a3ce76ec4751 | 0.9684821 | 0.88 | d068924b49 | 0.96091783 | 0.88 |
| fake news | 0.9623122 | 0.64 | fake news | 0.93221342 | 0.59 |
Table 2.
Scalability with the Flickr30K dataset.
| c | n | e | ||
|---|---|---|---|---|
| 10 | 326 | 1591 | 8 ms | 9 ms |
| 20 | 634 | 3218 | 33 ms | 18 ms |
| 30 | 885 | 4843 | 62 ms | 40 ms |
| 40 | 1100 | 5140 | 196 ms | 42 ms |
| 50 | 1384 | 7512 | 272 ms | 48 ms |
| 60 | 1521 | 9979 | 380 ms | 51 ms |
| 70 | 1792 | 1231 | 533 ms | 54 ms |
| 80 | 1986 | 1482 | 786 ms | 54 ms |
| 90 | 2208 | 1705 | 1044 ms | 58 ms |
| 100 | 2479 | 1823 | 1262 ms | 60 ms |
Table 3.
Scalability with the DIV2K dataset.
| c | n | e | ||||
|---|---|---|---|---|---|---|
| 10 | 558 | 3273 | 65 ms | 1027 ms | 10 ms | 10 ms |
| 20 | 870 | 5420 | 430 ms | 4688 ms | 18 ms | 12 ms |
| 30 | 1119 | 7799 | 1686 ms | 44,217 ms | 26 ms | 14 ms |
| 40 | 1415 | 10,501 | 3303 ms | 63,705 ms | 35 ms | 15 ms |
| 50 | 1692 | 12,994 | 3495 ms | 75,845 ms | 39 ms | 15 ms |
| 60 | 2023 | 16,078 | 4643 ms | - | 39 ms | 18 ms |
| 70 | 2427 | 19,776 | - | - | 39 ms | 17 ms |
Table 4.
Scalability, initial run on a single server with n GMAF instances.
| n | i | a | t |
|---|---|---|---|
| 1 | 1 | 720,000 | 635 |
| 1 | 2 | 360,000 | 320 |
| 1 | 3 | 240,000 | 214 |
| 1 | 4 | 180,000 | 164 |
| 1 | 5 | 144,000 | 129 |
| 1 | 6 | 120,000 | 110 |
| 1 | 7 | 102,000 | 96 |
| 1 | 8 | 90,000 | 81 |
| 1 | 9 | 80,000 | 75 |
| 1 | 10 | 72,000 | 73 |
| 1 | 11 | 65,000 | 71 |
| 1 | 12 | 60,000 | 68 |
| 1 | 13 | 55,000 | 67 |
| 1 | 14 | 51,000 | 66 |
| 1 | 15 | 48,000 | 65 |
| 1 | 16 | 45,000 | 65 |
Table 5.
Scalability of nodes with 8 GMAF instances each.
| a | t | ||
|---|---|---|---|
| 1 | 8 | 90,000 | 81 |
| 2 | 8 | 45,000 | 41 |
| 3 | 8 | 30,000 | 29 |
| 4 | 8 | 22,500 | 22 |
| 5 | 8 | 18,000 | 17 |
| 6 | 8 | 15,000 | 14 |
| 7 | 8 | 12,850 | 12 |
| 8 | 8 | 11,250 | 11 |
Table 6.
Scalability, runtime measures (milliseconds) of vertical scaling on GPUs including ramp-up and ramp-down phases.
Table 6.
Scalability, runtime measures (milliseconds) of vertical scaling on GPUs including ramp-up and ramp-down phases.
| Processing Step | CPU (Single Thread) | Apple Metal (M1) | Nvidia Cuda GTX | Nvidia Cuda 2x RTX |
|---|---|---|---|---|
| Ramp Up | 27 | 2.430 | 3.015 | 2.130 |
| Search 1 | 2.327 | 103 | 327 | 98 |
| Search 2 | 2.406 | 107 | 342 | 102 |
| Search 3 | 2.388 | 98 | 339 | 98 |
| Ramp Down | 625 | 792 | 1.210 | 723 |
| Total | 7.773 | 3.530 | 5.233 | 3.151 |
Disclaimer/Publisher’s Note: The statements, opinions and data contained in all publications are solely those of the individual author(s) and contributor(s) and not of MDPI and/or the editor(s). MDPI and/or the editor(s) disclaim responsibility for any injury to people or property resulting from any ideas, methods, instructions or products referred to in the content. |
© 2023 by the authors. Licensee MDPI, Basel, Switzerland. This article is an open access article distributed under the terms and conditions of the Creative Commons Attribution (CC BY) license (https://creativecommons.org/licenses/by/4.0/).
Share and Cite
MDPI and ACS Style
Wagenpfeil, S.; Kevitt, P.M.; Hemmje, M. Smart Multimedia Information Retrieval. Analytics 2023, 2, 198-224. https://doi.org/10.3390/analytics2010011
AMA Style
Wagenpfeil S, Kevitt PM, Hemmje M. Smart Multimedia Information Retrieval. Analytics. 2023; 2(1):198-224. https://doi.org/10.3390/analytics2010011
Chicago/Turabian StyleWagenpfeil, Stefan, Paul Mc Kevitt, and Matthias Hemmje. 2023. "Smart Multimedia Information Retrieval" Analytics 2, no. 1: 198-224. https://doi.org/10.3390/analytics2010011