
Static Terrestrial Laser Scanning (TLS) for Heritage Building Information Modeling (HBIM): A Systematic Review


1
McWhorter School of Building Science, Auburn University, Auburn, AL 36849, USA
2
School of Architecture, Georgia Institute of Technology, Atlanta, GA 30332, USA
*
Author to whom correspondence should be addressed.
Virtual Worlds 2023, 2(2), 90-114; https://doi.org/10.3390/virtualworlds2020006
Submission received: 29 January 2023
/
Revised: 21 March 2023
/
Accepted: 10 April 2023
/
Published: 14 April 2023
(This article belongs to the Special Issue Digital Twins in Cultural Heritage)
Abstract
:Heritage Building Information Modeling (HBIM) is an essential technology for heritage documentation, conservation, and management. It enables people to understand, archive, advertise, and virtually reconstruct their built heritage. Creating highly accurate HBIM models requires the use of several reality capture tools, such as terrestrial laser scanning (TLS), photogrammetry, unmanned aerial vehicles (UAV), etc. However, the existing literature did not explicitly review the applications and impacts of TLS in implementing HBIM. This paper uses the PRISMA protocol to present a systematic review of TLS utilization in capturing reality data in order to recognize the status of applications of TLS for HBIM and identify the knowledge gaps on the topic. A thorough examination of the 58 selected articles revealed the state-of-the-art practices when utilizing static TLS technology for surveying and processing captured TLS data for developing HBIM models. Moreover, the absence of guidelines for using static TLS surveys for HBIM data acquisition, the lack of robust automated frameworks for producing/transferring 3D geometries and their attributes from TLS data to BIM entities, and the under-utilized application of TLS for long-term monitoring and change detection were identified as gaps in knowledge. The findings of this research provide stakeholders with a good grasp of static TLS for HBIM and therefore lay the foundation for further research, strategies, and scientific solutions for improving the utilization of TLS when documenting heritage structures and developing HBIM.
1. Introduction
Heritage Building Information Modeling (HBIM or H-BIM), utilizing 3D modeling and information management, is a process that produces intelligent BIM models documenting, containing, managing, and interpreting information about built heritage. HBIM has become an essential technology for cultural heritage presentation and conservation [1,2,3,4,5,6].
A typical HBIM implementation workflow includes a preliminary phase to identify the purpose and determine the Level of Development (LOD), a data acquisition phase to capture spatial and semantic data, a data processing phase, and a model development phase. Figure 1 illustrates a detailed HBIM workflow as well as the hardware and software utilized in each phase. During data acquisition for HBIM, both historical and existing data about the heritage structure are collected. The historical data includes the original design and construction documents, historical records and photographs, maintenance and renovation reports, bibliographic references, information about critical historical events relevant to the structure, etc. [7]. The existing (as-built) condition data of the built heritage, including its geometrical information, structural details, materials, defects, and decay, is acquired through field surveys using Reality Capture (RC) techniques. Next, all captured geometric and descriptive data of the structure is processed and used to develop a highly detailed and accurate as-built 3D digital model [5,8,9,10]. Finally, data about the structure, such as historical photographs, historical reports, maintenance and renovation records, materials, and decay, are included as an add-on to the 3D model, making it an intelligent building information model [11].
The creation of HBIM models requires the acquisition of highly accurate RC data, which may be obtained with traditional analog tools (e.g., measuring tapes) and advanced instruments and techniques [9]. Each of the techniques and technologies has its own advantages and limitations in the aspects of accessibility, comprehensiveness, level of accuracy, and feasibility. Multiple innovative RC technologies have been embraced by researchers and practitioners to capture geospatial data about heritage structures. These techniques include Terrestrial Laser Scanning (TLS) [12,13,14,15], photogrammetry [8,16], UAVs [17,18,19,20], and 360-degree photography [21,22] among others. RC technologies accelerate data collection and reduce errors and deficiencies relative to the conventional method [23]. TLS is a ground-based LiDAR (light detection and ranging) technology [24] that uses remote sensing measuring devices (a laser sensor) to collect dense point clouds of objects [25]. TLS can be divided into two categories: static TLS and mobile laser scanning (MLS). Static TLS involves setting up a tripod-mounted laser scanner in a fixed location and scanning the surrounding environment from different positions to capture high-resolution data. Static TLS is commonly used in construction, architecture, and engineering for precise measurements of building and site conditions [26,27,28,29]. MLS, on the other hand, involves a laser scanner mounted on a mobile platform such as a vehicle, drone, backpack, or being held by hand (a hand-held scanner). The MLS scanner can capture 3D data of the environment as the platform moves through the area, allowing for quick and efficient data capture. MLS is commonly used in applications such as surveying, mapping, and infrastructure management [26,30,31].
Both static TLS and MLS have their advantages and limitations. Static TLS offers higher resolution and accuracy, making it well-suited for capturing detailed data of smaller areas. MLS, on the other hand, offers the ability to capture data over a larger area in a shorter amount of time, making it ideal for scanning larger sites or environments [26,27,28,29]. Additionally, MLS can capture data from areas that are difficult or dangerous to access, such as high ledges or steep slopes [32,33]. However, MLS technology also has its limitations when compared to static TLS. For example, MLS data may be less detailed than TLS data due to the speed of the scanning process [26], and the accuracy of MLS data can be affected by factors such as the speed and trajectory of the mobile platform [30,31].
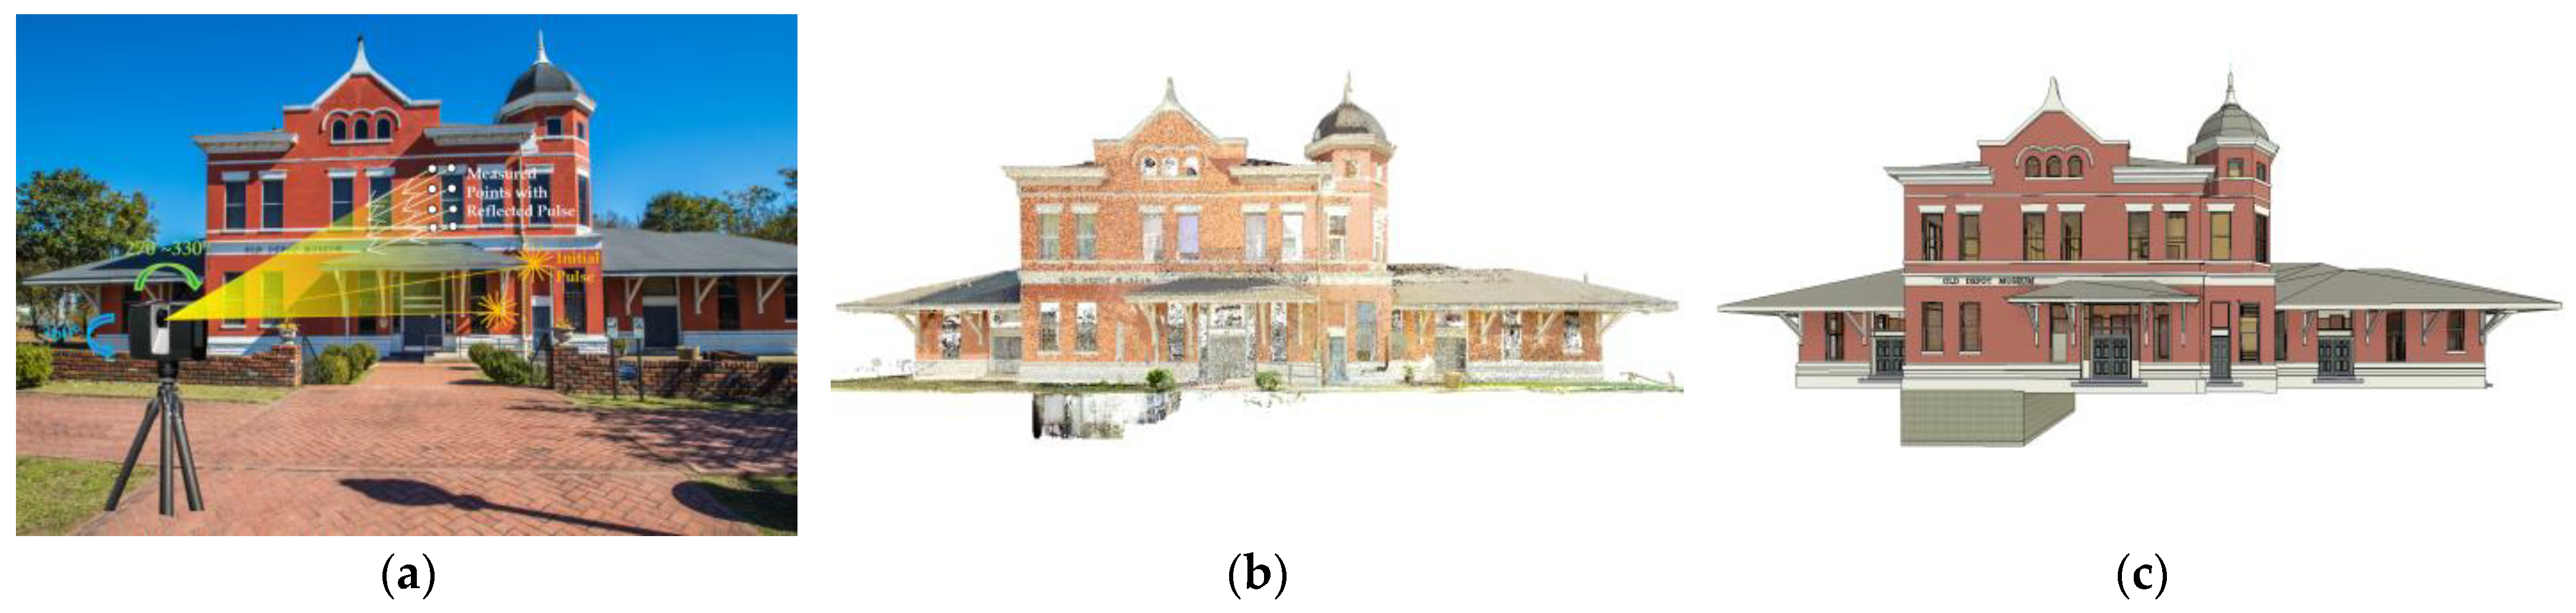
Figure 2 displays the principle of static TLS and its application in HBIM. Yang et al. [7] acknowledged in their review article that the utilization of static TLS to capture point clouds of heritage structures has become an important tool for HBIM researchers and practitioners. Although there are several publications that address the applications of MLS for HBIM development [34,35], the mass majority of the research that utilized TLS to capture data for HBIM chose static TLS. Therefore, this research study of TLS only focuses on the static type of the technology. The TLS mentioned in this article represents static TLS.
The existing literature in the main scientific databases did not explicitly review the applications and impacts of TLS in the implementation of HBIM. Two research questions are raised for this study: (1) what is the state-of-the-art TLS used for HBIM development? (2) what are the knowledge gaps in this subject matter? This research aims to provide a comprehensive overview of the studies carried out on the utilization of TLS for HBIM. It focuses on the most commonly used devices, software, processes, and methods for quality assessment and control of TLS for HBIM implementation. This research also presents the challenges of TLS for HBIM and proposes areas in which further studies are needed.
A systematic research review of this subject matter can provide researchers, practitioners, and other HBIM stakeholders with a good grasp of this topic and therefore lay the foundation for further research, strategies, and scientific solutions to improve the utilization of TLS for documenting heritage structures and developing HBIM. The findings of this research are also valuable for the development of as-built documentation and digital twins for new construction projects.
The structure of this article first includes the background of HBIM technology and introduction to RC. Next, it explains the research design and methodology, consisting of the selection of search databases and the deployment of the PRISMA approach for finding the relevant articles. Next, it shows the major metrics of the found articles, including (1) the chronological evolution of the papers’ publication; (2) geographic distribution and collaboration; (3) the most active authors; (4) the keywords collaboration network; and (5) publications by the type of study. The main findings of this study are then presented and discussed to address the status of TLS technology and the techniques used to acquire data for HBIM development. Finally, a conclusion will be drawn, along with a discussion of the knowledge gaps and recommended areas for further research.
In this paper, abbreviations were used to refer to various terms and concepts. To avoid confusion and ensure clarity, below is a list of these abbreviations and their corresponding meanings:
- BIM: Building Information Modeling;
- CP: Control Point;
- DSLR: Digital Single Lens Reflex;
- GCP: Ground Control Point;
- GPS: Global Positioning System;
- HBIM: Heritage Building Information Modeling;
- LiDAR: Light Detection and Ranging;
- LOD: Level of Development;
- MLS: Mobile Laser Scanning;
- MMS: Mobile Mapping System;
- PRISMA: Preferred Reporting Items for Systematic Review and Meta-Analysis;
- RC: Reality Capture;
- SfM: Structure from Motion;
- TLS: Terrestrial Laser Scanning;
- TS: Total Station;
- UAV: Unmanned Aerial Vehicle;
- VR: Virtual Reality;
- WOS: Web of Science.
2. Research Design and Methodology
To answer the two research questions of this study, the researcher set up a systematic literature review process (see Figure 3) and elected to use the Preferred Reporting Items for Systematic Review and Meta-Analysis (PRISMA) approach. The PRISMA approach was chosen over others because of its acceptance, comprehensiveness, and wide variety of applications in numerous academic disciplines [36].
2.1. Search Method and Information Sources
The study selection was searched within the significant domains of HBIM, architectural heritage, and reality capture (RC) technology. Two main citation databases were chosen as the primary sources to retrieve the relevant publications. They are Scopus and Web of Science (WOS). The generated keywords that were used for the search included terms that are closely associated with the primary domains of the study. Keywords that shared similar notions were grouped with “OR” to retrieve a broad view of articles and “AND” to include other concepts. Table 1 shows the keywords used in these two databases in their advanced or expert modes.
2.2. Search Process
The researcher adopted a three-stage methodological approach to conduct the study: planning, searching, and screening (the PRISMA approach), and reporting [9].
The research question, objectives, search databases, keywords, and a set of exclusion and inclusion criteria were included in Stage 1 (planning). The goal was to identify the status and applications of TLS for the development of HBIM for built heritage.
Stage 2 (searching and screening, the PRISMA approach) included a process for conducting the review. During this stage, relevant articles were searched for in October 2022. The use of TLS for HBIM has largely gained traction in the last decade. The initial search using the pre-identified keywords yielded 378 articles in total, including 213 from Scopus and 165 from WOS. To shortlist the articles for more accurate results, initial screening criteria were established: all English-only peer-reviewed journal articles in the subject areas of computer science, social sciences, engineering, and arts and humanities published between 2012 and 2022. See Table 2 for the screening criteria chosen for this research. After implementing the screening criteria, 130 articles were left for the next step of review. In this step, the titles of these 130 articles were manually scanned to identify duplicates from the two different databases, which resulted in the removal of 46 articles. Next, the researcher thoroughly studied the title and abstract of each remaining article with the intention to eliminate the irrelevant ones. Through this step, a total of 26 articles were removed from the result. After this step, the researcher was able to retrieve the full text of all the remaining 58 articles. Therefore, 58 articles were chosen for this systematic review. The workflow of the PRISMA approach is illustrated in Figure 4.
In Stage 3 (reporting), all 58 articles chosen in Stage 2 were thoroughly studied and analyzed using content analysis methods to synthesize the themes. Each of the articles was carefully read, and all relevant information needed to address the main objectives of this paper was documented.
2.3. Search Results
2.3.1. Evolution of Publications per Year
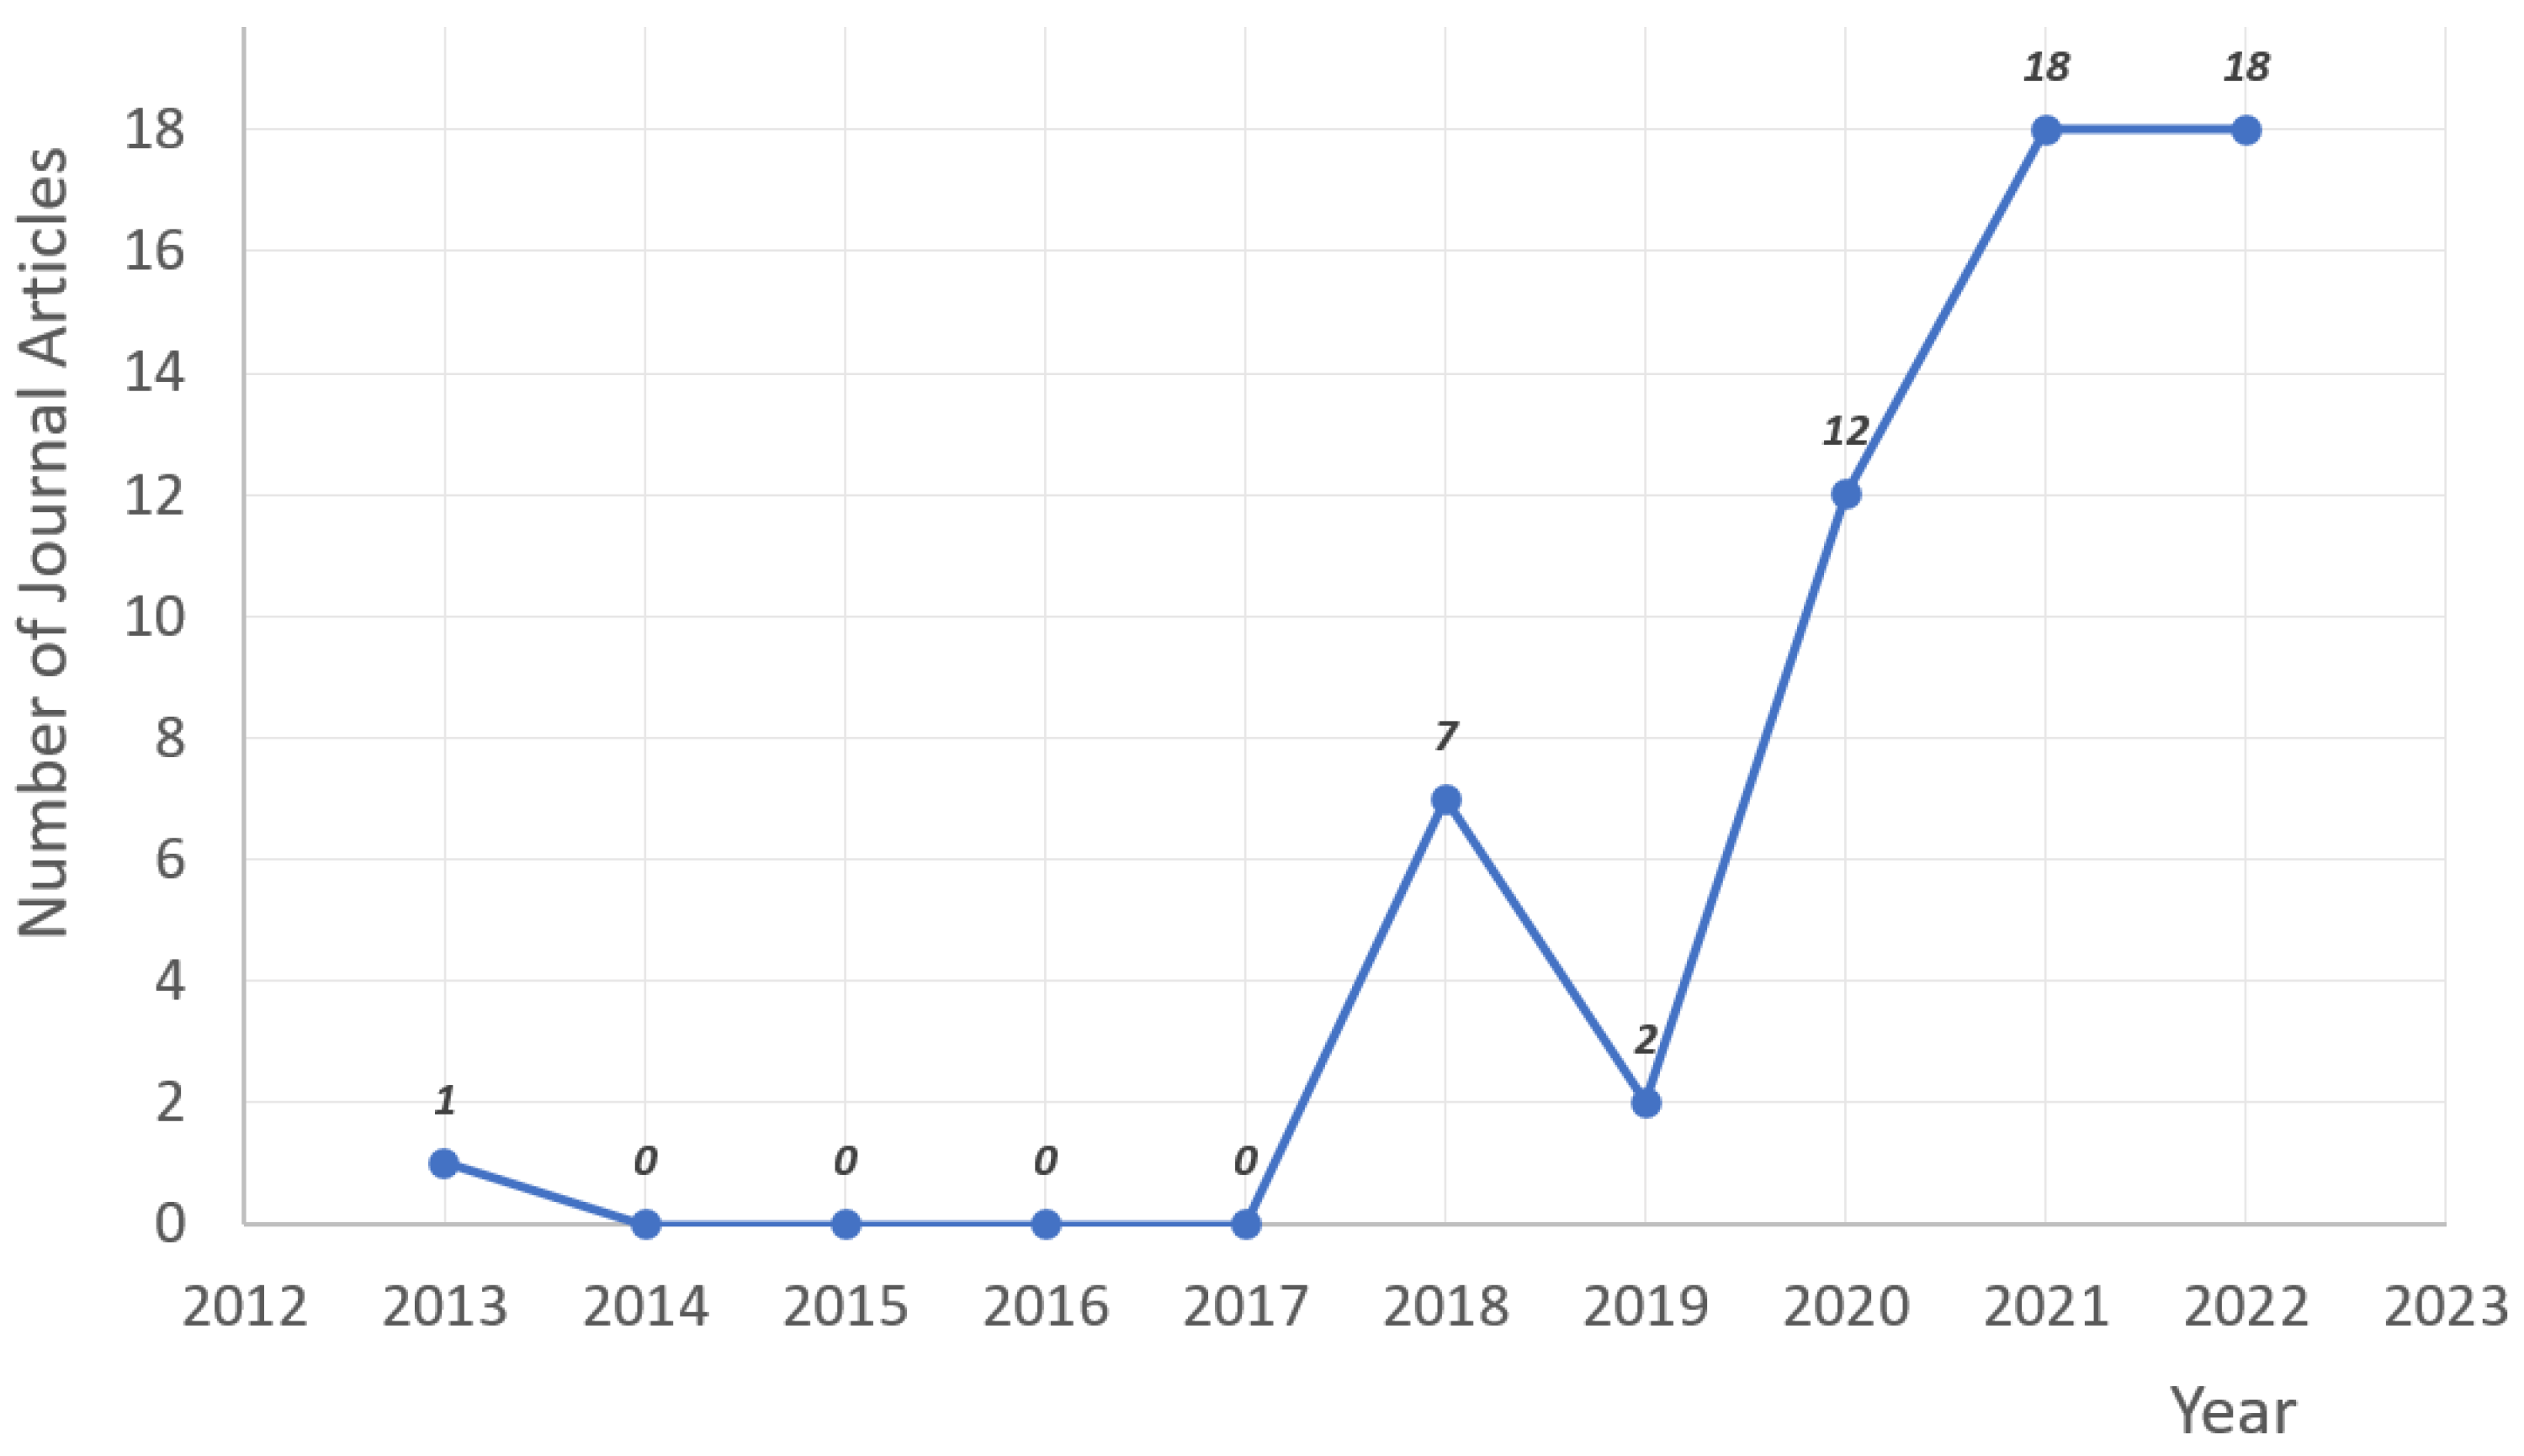
The first definition of HBIM appeared in 2009, by Murphy et al. [38]. The number of publications saw a dramatic upward trend since 2018 (Figure 5). There was only one article in a 5 year span from 2013 to 2017. In 2018 and 2019, there were seven and two publications, respectively. However, an average of 16 articles were released each year in the last three years.
2.3.2. Origin Countries of Authors
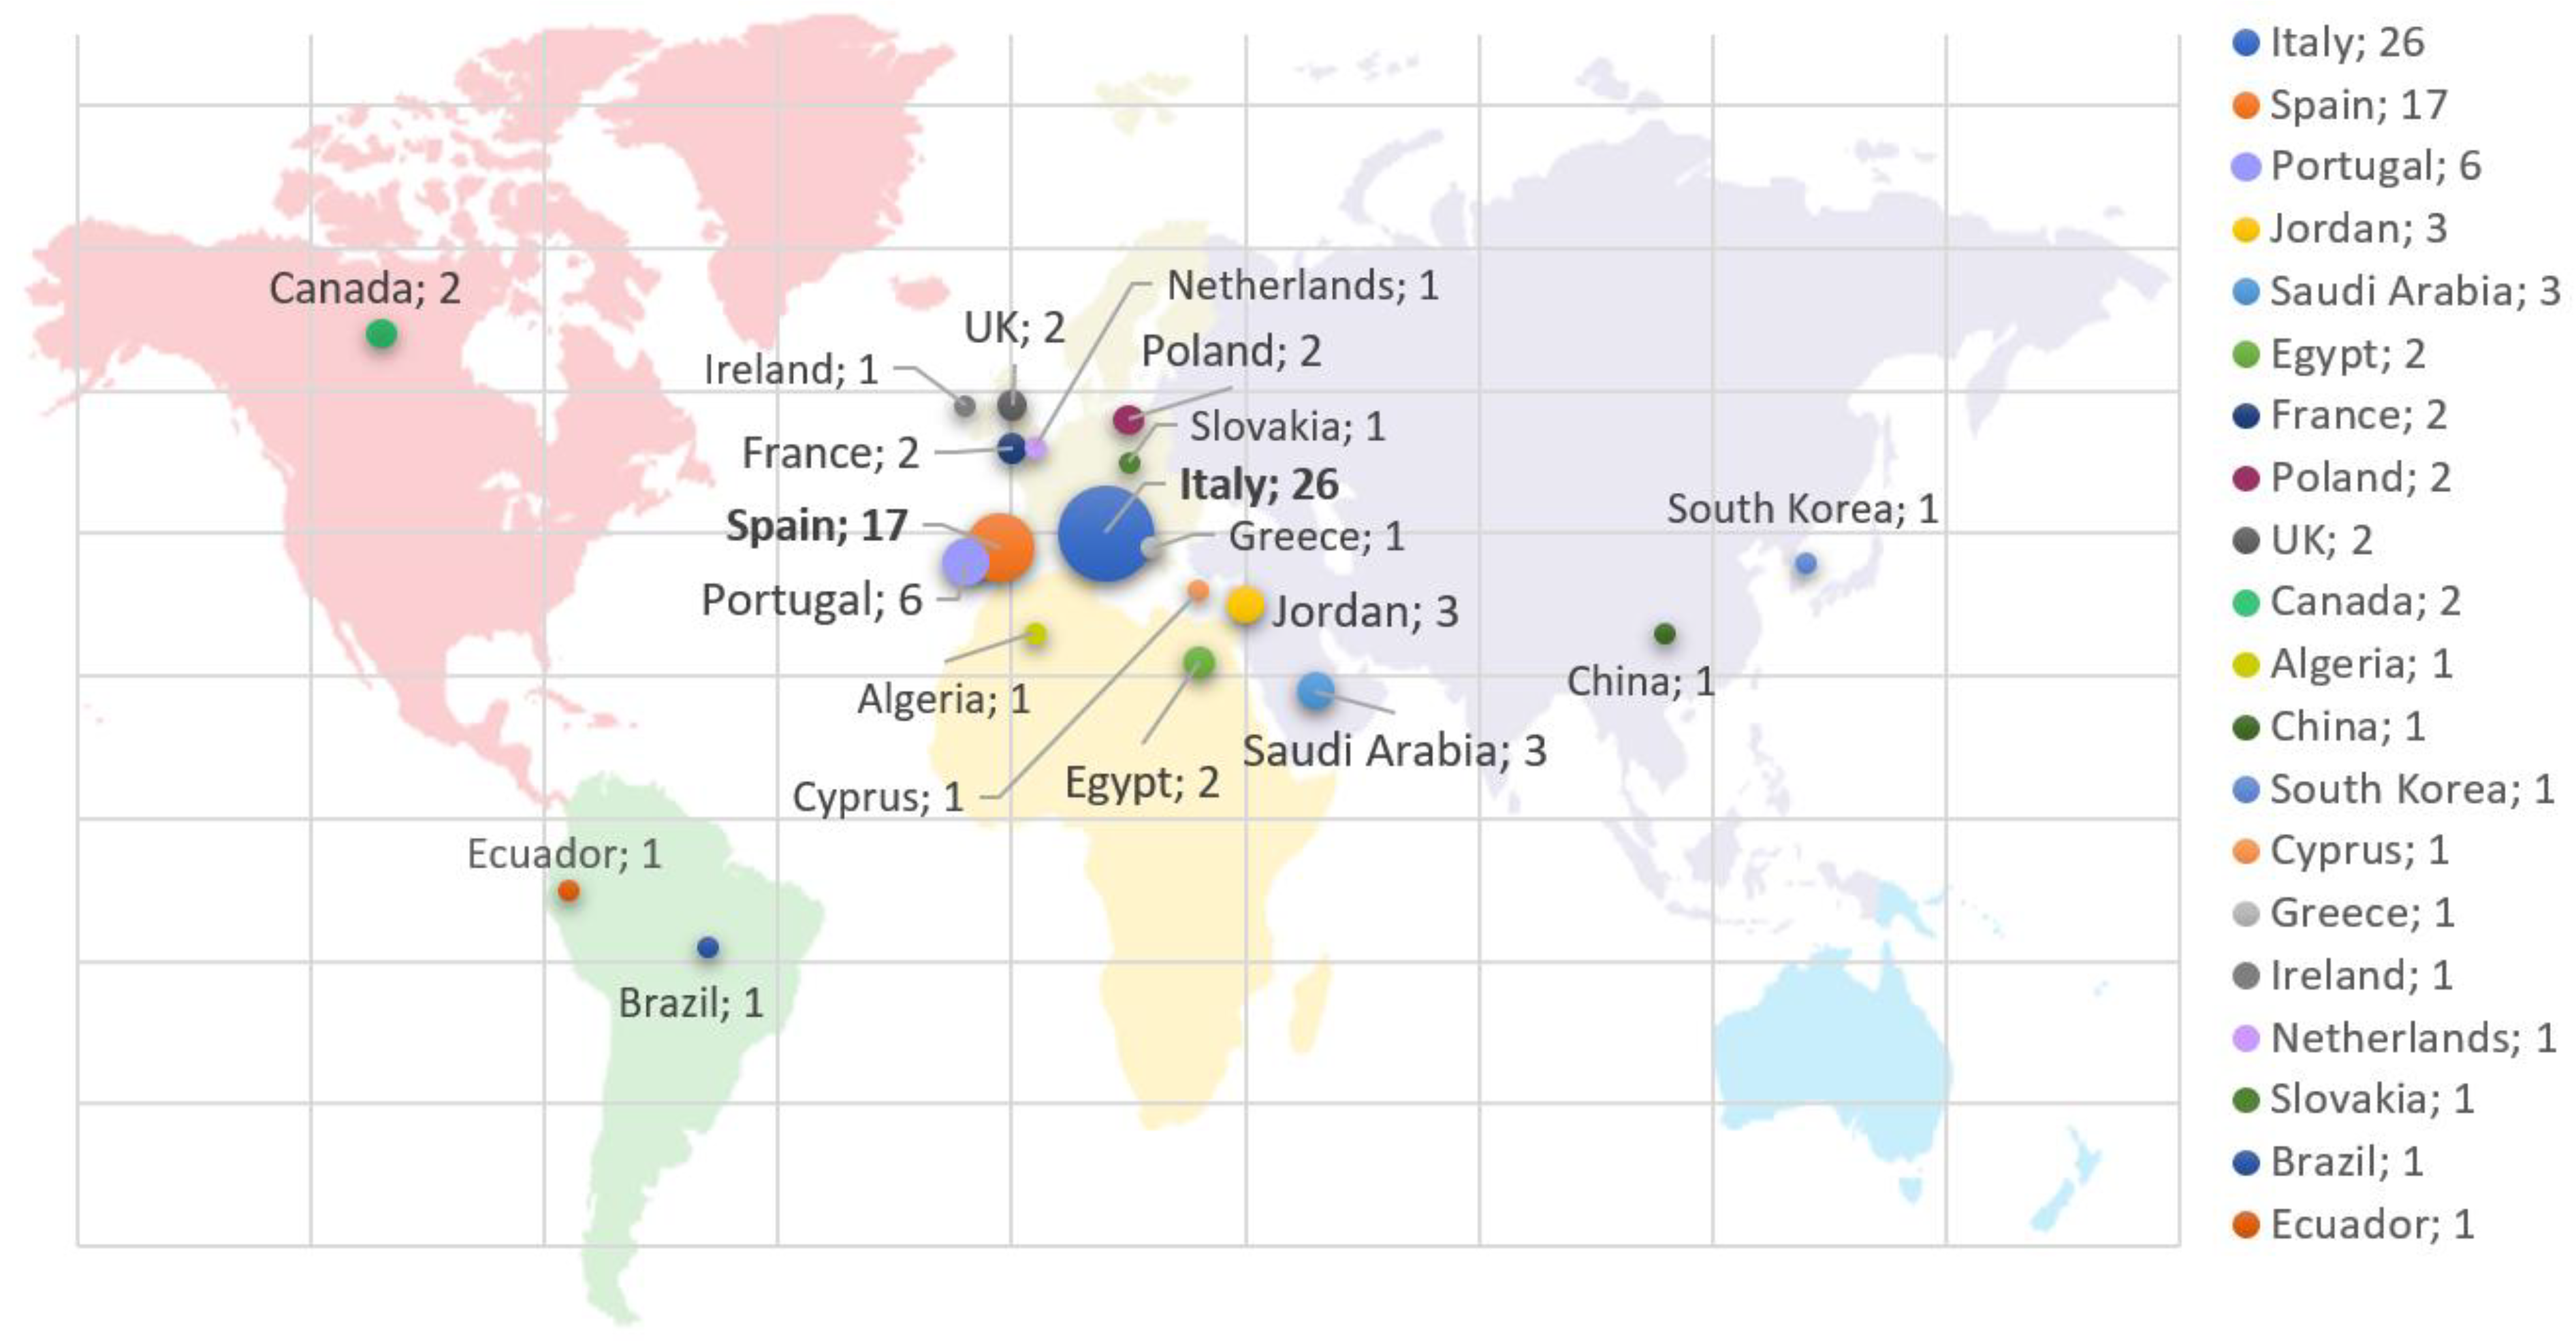
Figure 6 illustrates the countries of origin of the contributing authors of the selected publications. The three southern European countries, Italy (26, 35%), Spain (17, 23%), and Portugal (6, 8%) combined, are the homes of two thirds of the authors. Out of the seventy-five authors, sixty (80%) reside in Europe, eight (11% in Asia), four (6%) in the Americas, and the remaining three (4%) in Africa.
2.3.3. Most Active Authors
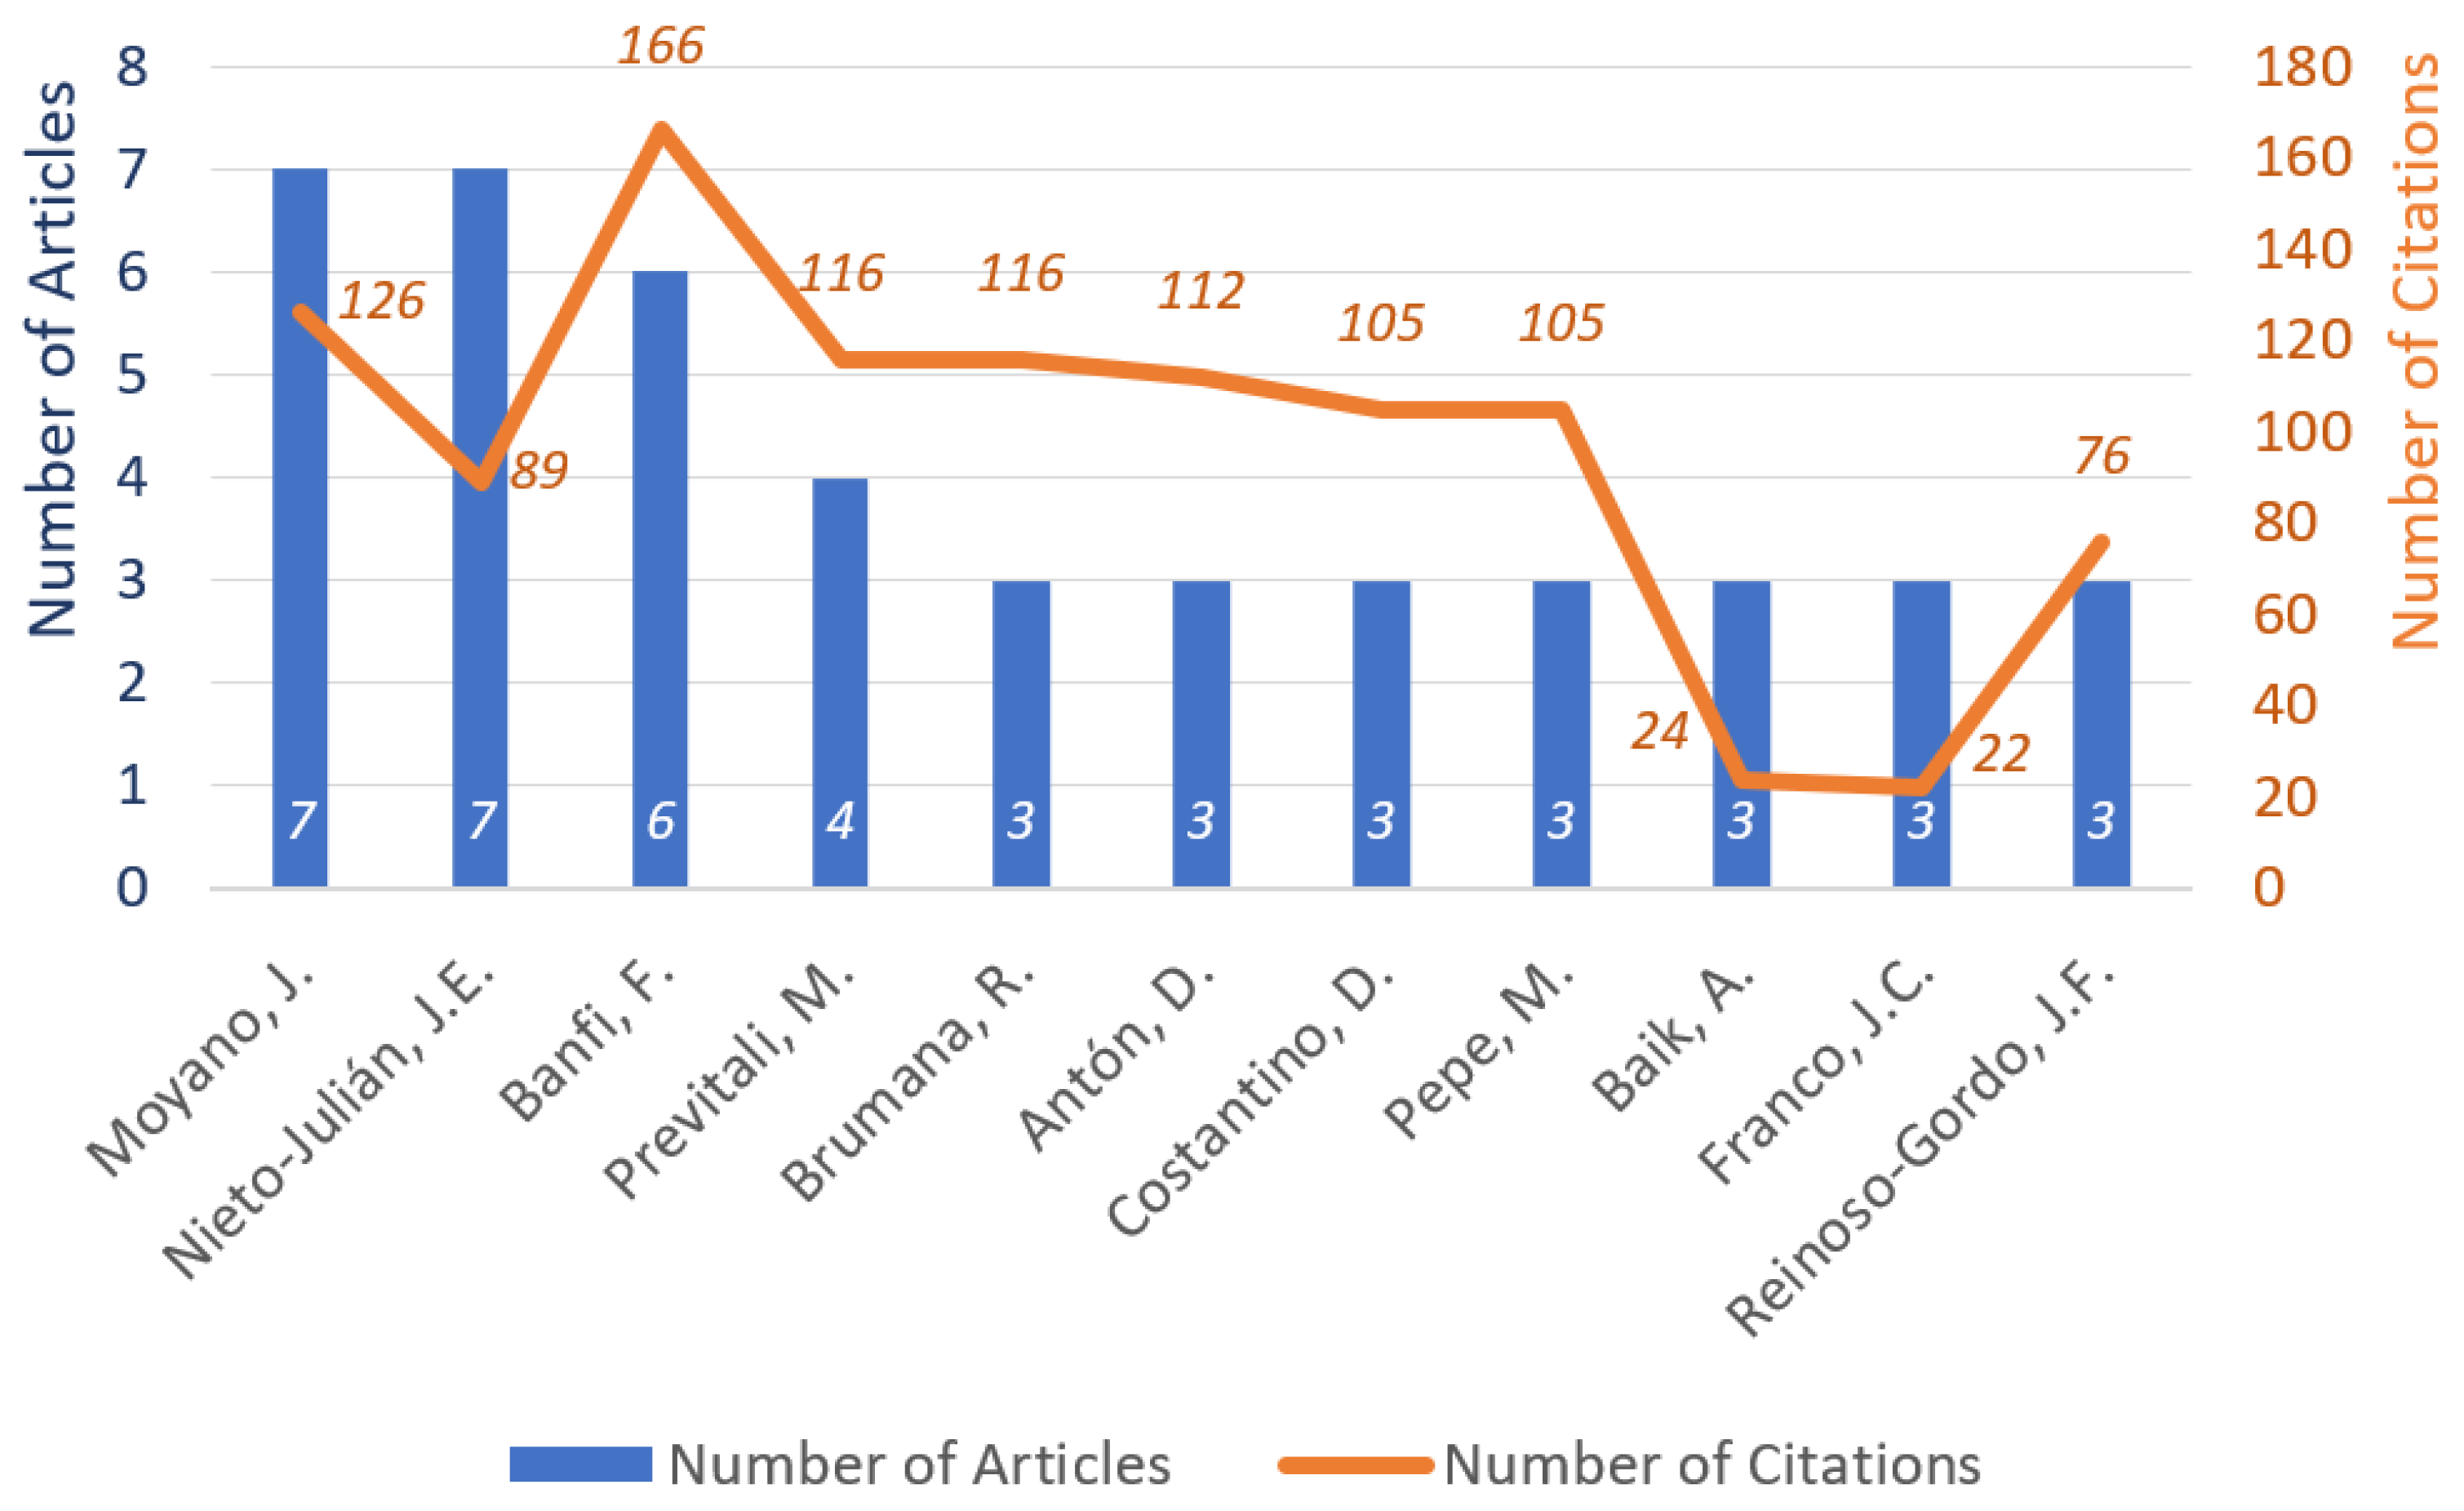
Among the authors who have contributed to the selected journal articles, eleven appear in three or more papers (Figure 7). The top three authors are Moyano, J.; Nieto-Julián, J.E.; and Banfi, F., who have authored or co-authored seven, seven, and six articles, respectively. Banfi’s articles have the most citations with a total of 166, followed by Mayona’s with 124.
2.3.4. Keywords Collaboration-Network
A total of 454 keywords were identified from the initial analysis. After further investigation, the author realized that some keywords share the same notions, e.g., ‘Heritage BIM’, ‘Historic BIM’, ‘Historical BIM’, ‘H-BIM’, etc., all of which can be interpreted as ‘HBIM’. Therefore, all 454 keywords were manually scanned, and the ones that had the same implications were replaced and consolidated with a more common term. Table 3 shows a list of these common keywords and the keywords that they replaced. After this step, a total of 420 keywords remained for further analysis.
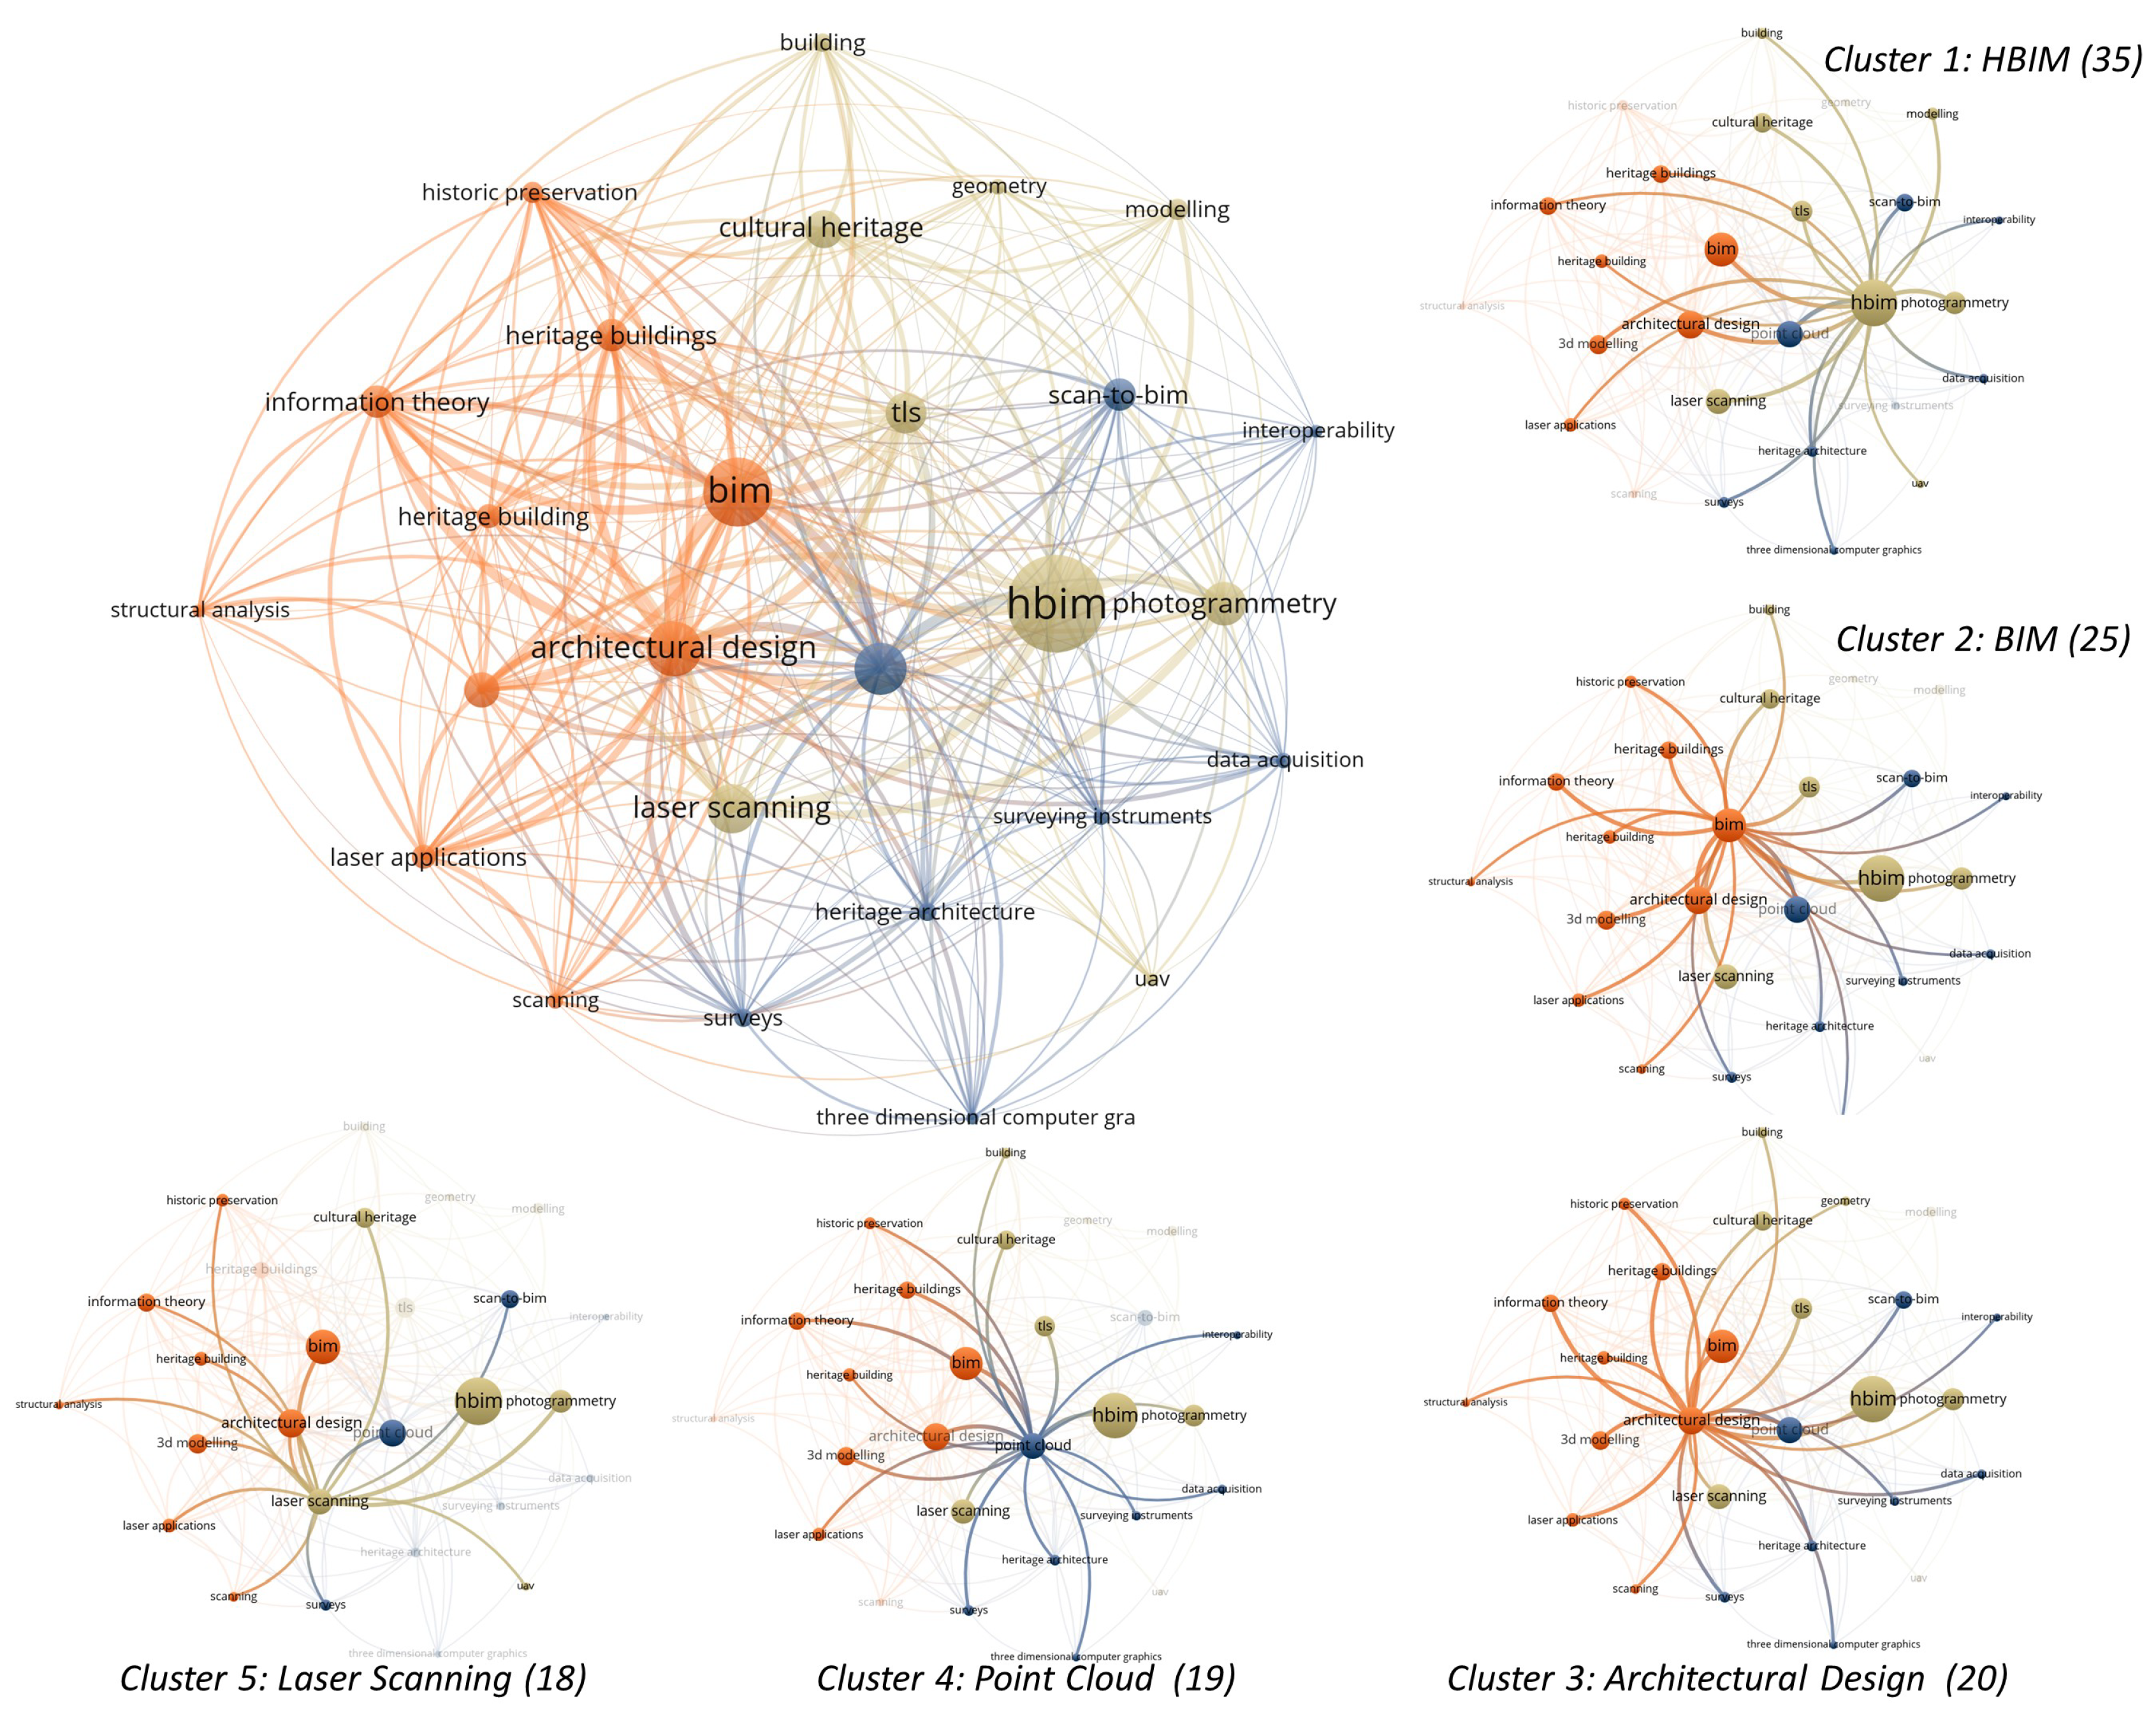
There are 27 keywords identified in this study that occurred in at least five articles. These 27 keywords have an average total link strength of 74.8, an average occurrence of 11.5, and a maximum occurrence of 35 (i.e., HBIM). Figure 8 shows the mapped network of these 27 keywords and clusters of the five most occurring ones (i.e., ‘HBIM’, ‘BIM’, ‘architectural design’, ‘point cloud’, and ‘laser scanning’) with their occurrences. The average link strength is a metric reflecting the links between the nodes in the network. In bibliometric networks, links are typically co-citation or co-occurrence relationships between publications, authors, or keywords. The link strength represents the strength of the relationship between two nodes. The average total link strength of 74.8 indicates that, on average, the strength of the links between the nodes in the network is relatively high. Average occurrence and maximum occurrence reflect the frequency with which a node occurs in the publications included in the network. The occurrence of a node represents the number of publications in which the node appears. The average occurrence of 11.5 indicates that, on average, the nodes in the network appear in around 11 publications. The maximum occurrence of 35 indicates that there is at least one node, in this case ‘HBIM’, in the network that appears in 35 publications, which is relatively high. Figure 9 demonstrates that the average year of publication of the most cited keywords was between late 2019 and early 2021, which is in line with the findings shown in Figure 5 for the year of publication of the selected articles. The colors in this figure refer to the year in which the cited keywords were used in publications. It appears that some keywords were used more frequently in 2019, such as ‘TLS’ and ‘Cultural Heritage’, while others were mentioned more often since 2021, such as ‘BIM’ and ‘HBIM’.
2.3.5. Publications by Study Type
The researcher also categorized the final selection of the 58 articles into four types of study: literature review, case study, design and development, and evaluation and assessment papers [39]. Most of the articles are case studies, with a total of 38 (66%); the second-largest category, design and development, has seventeen (29%); literature reviews and evaluation and assessment only have two (3%) and one (2%), respectively.
3. TLS Survey for HBIM
3.1. Terrestrial Laser Scanning (TLS) for Data Acquisition for HBIM
The literature points out that TLS is one of the most important techniques for the research of heritage assets and has become the mandatory technique for HBIM development [40]. The biggest advantages of TLS for HBIM over other techniques include its high accuracy [41,42], fast speed for the amount of data captured over the time spent [43], and thoroughness of non-invasive object capture [44,45] that does not require a returned field survey [46]. As mentioned in Al-Bayari and Shatnawi’s study [47], 25–30% of the time for field surveys could be reduced using TLS to capture and document heritage.
3.2. Challenges and Limitations of TLS for HBIM
On the other hand, TLS has several drawbacks when being used for data acquisition for HBIM. It is expensive. A new laser scanner can easily cost USD tens of thousands [46]. It requires specialty software, substantial hardware, and highly trained professionals to process and handle the scan data [41,48]. A TLS survey can also be time-consuming [49], especially when it is used to capture large and complex heritage sites and is sensitive to the environment such as lighting conditions, dust, fog, rain, etc. [46]. The time required for a TLS survey varies depending on the complexity of the area of interest, the accuracy required, and the processing software used. Factors such as data acquisition time, environmental conditions, and data processing time can all contribute to the overall time required for the survey:
- Data acquisition time: TLS involves capturing a large number of high-density point clouds from various viewpoints to cover the entire area of interest. This process can take a considerable amount of time, especially for large or complex areas where multiple scanning setups are needed;
- Environmental conditions: Environmental conditions can also impact the survey time. Factors such as weather conditions, sunlight, and shadowing can affect the quality of the data collected, which may require additional scanning time to compensate;
- Data processing time: Once the data is acquired, it needs to be processed to generate a usable point cloud. Large datasets with high point densities can take a long time to process, which can contribute to the overall time required for the survey.
Shiny/reflective, black, and transparent surfaces can also be troublesome. TLS is unable to capture objects that are hidden or not in line-of-sight [50]. Capturing accurate color is another challenge for the majority of the LiDAR scanners that are used for studying heritage [12].
Some of the articles selected for this study revealed specific limitations of using TLS for data acquisition and challenges of processing the TLS scan data for HBIM development, as shown in Table 4.
To overcome these limitations, HBIM practitioners usually utilize other RC techniques to supplement TLS and acquire data for HBIM development. These techniques include analog survey, manual measurement, mobile scanners, and Structure from Motion (SfM) or photogrammetry [12]. More details about combining multiple data acquisition techniques for HBIM are addressed in Section 3.6.
3.3. Planning for the TLS Survey
A successful TLS survey begins with a good plan to guarantee the maximum coverage of the relevant surfaces, reduce self-occlusions, and ensure a sufficient density of the point cloud with the least amount of scans [51]. The quality of the data obtained from laser scanning might be influenced by several different factors. including:
- The expectation of the data to be collected, e.g., accuracy and density of the point cloud, coverage of the structure [67];
- The characteristics of the heritage to be captured, e.g., location, size, accessibility, complexity, occlusions and inaccessible areas; and the time constraints of the survey [68];
- The atmosphere during the TLS survey, e.g., weather conditions such as humidity, temperature, and visibility [69];
- The specification and limitation of the TLS equipment, i.e., scanning range, speed, scan-station setting up requirements, and the requirements for scanning targets [51].
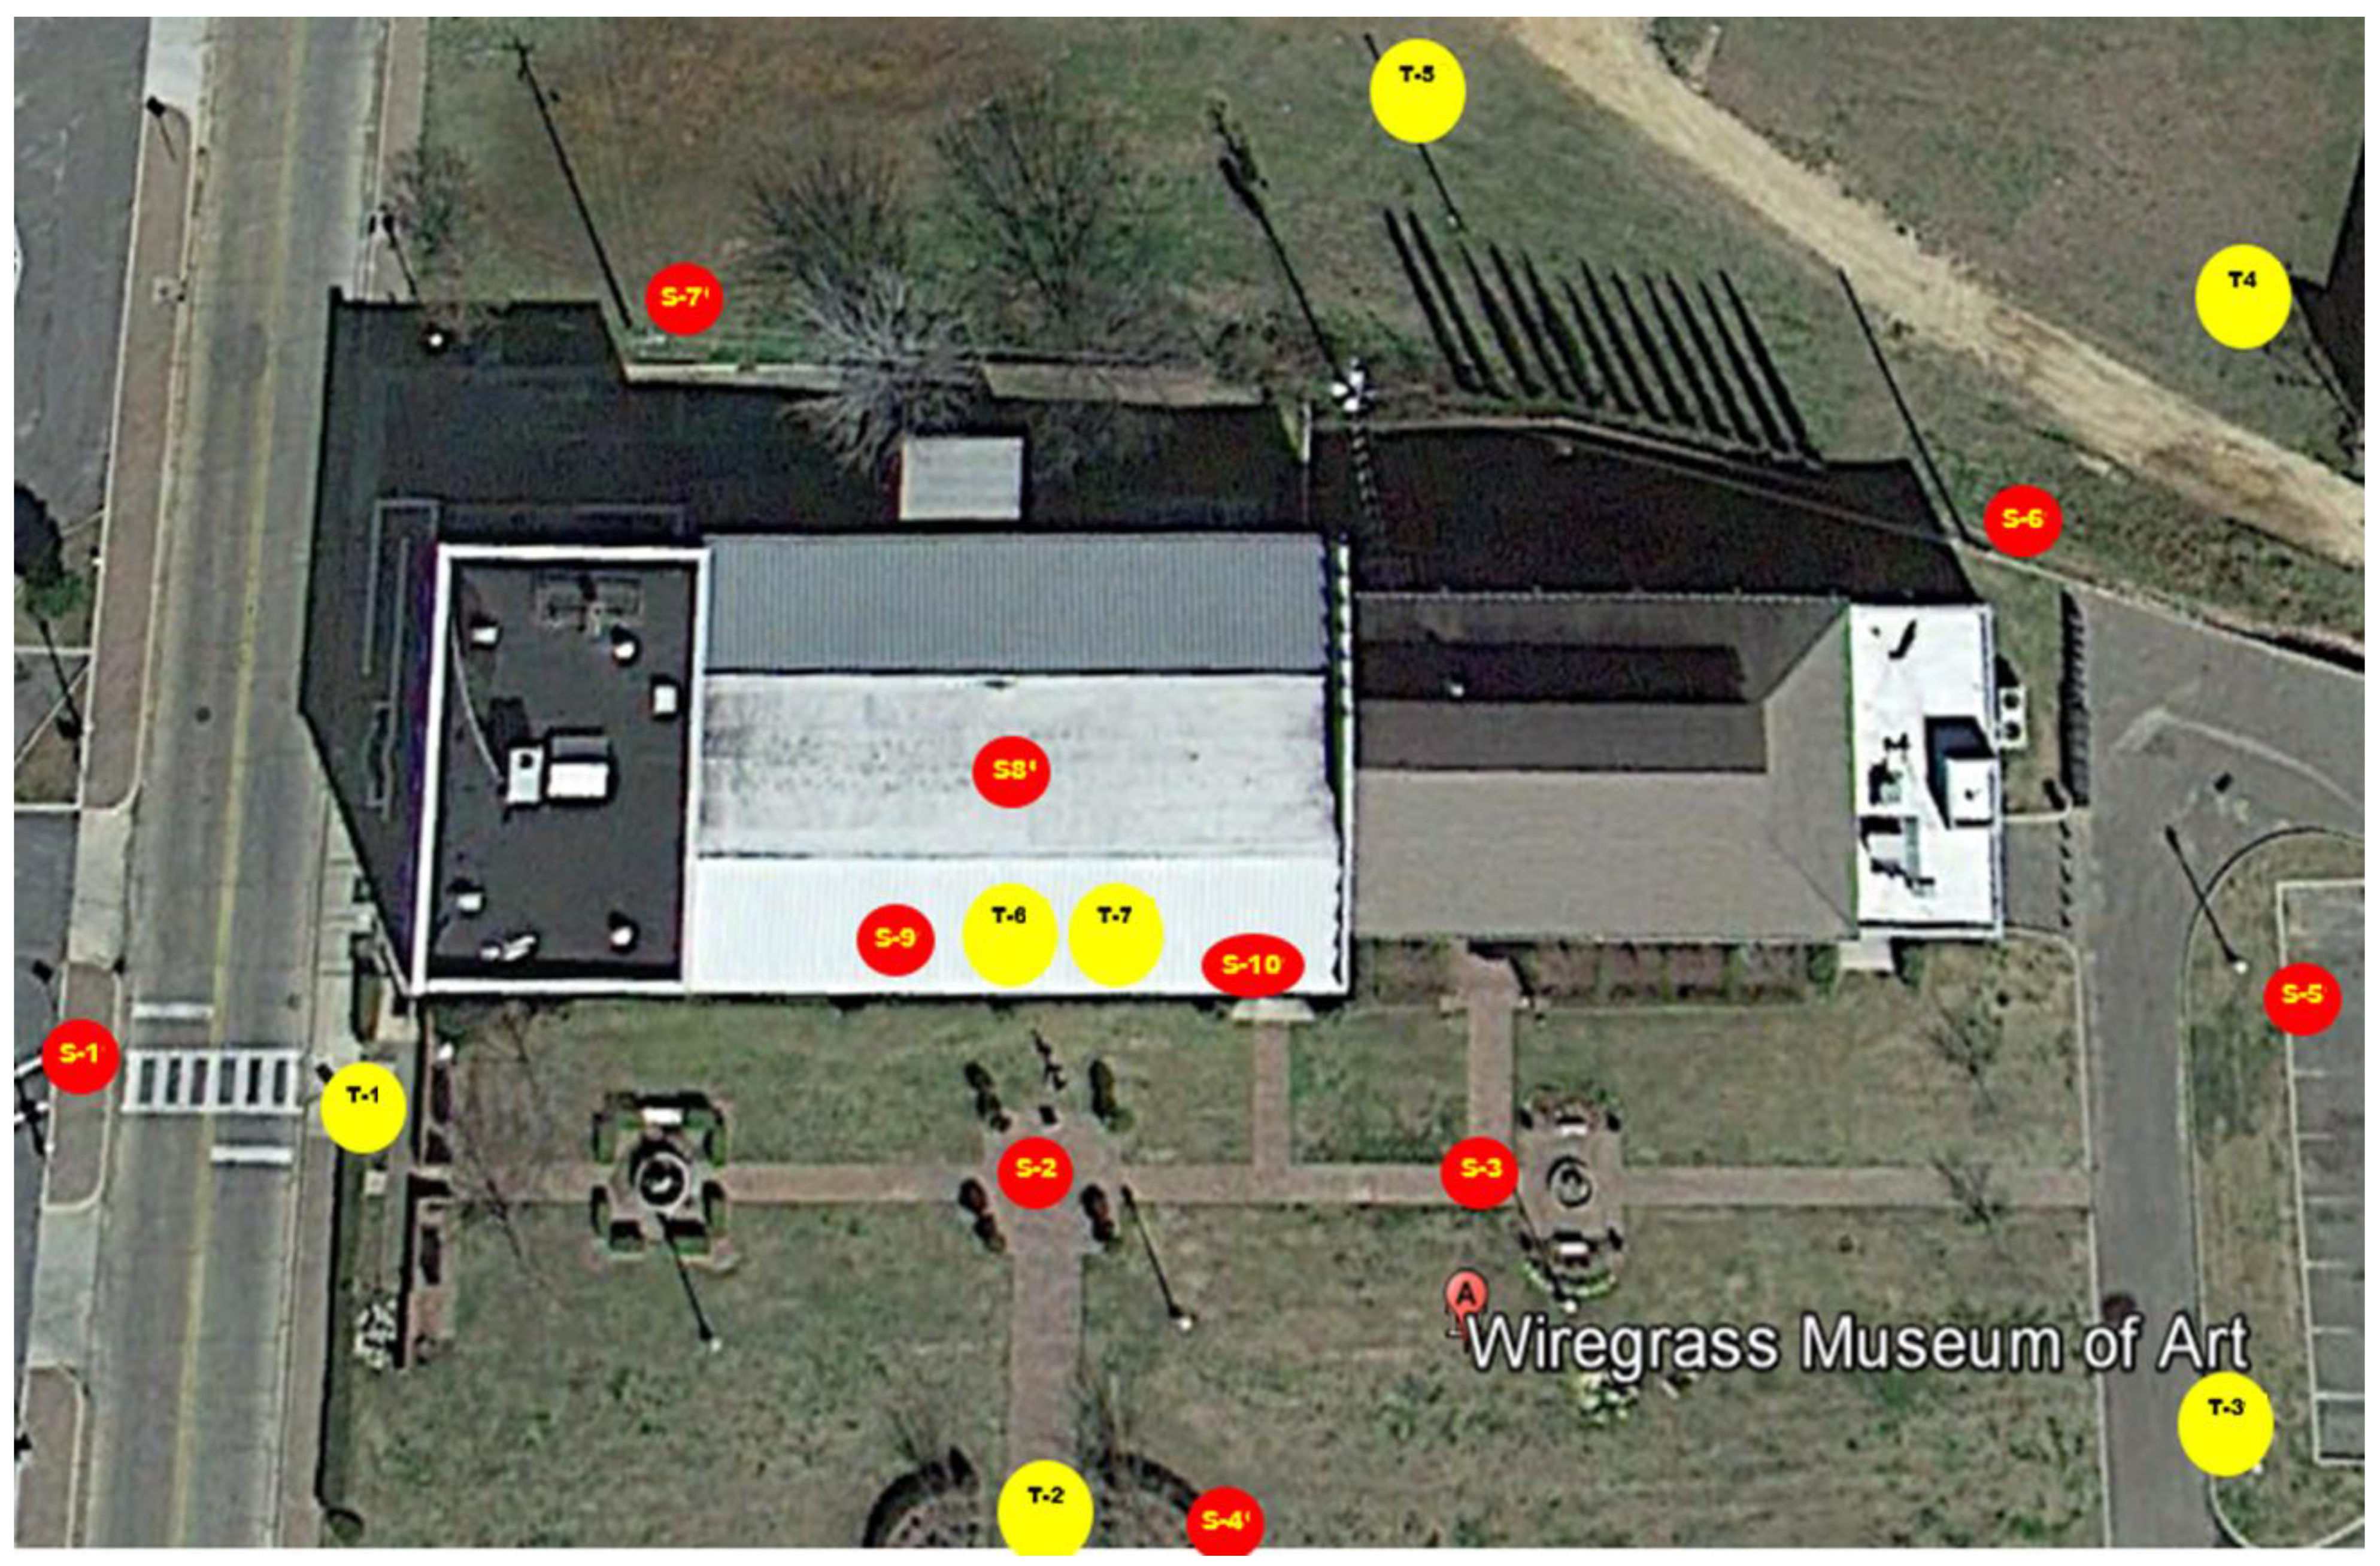
One of the common mistakes for TLS data acquisition is “over scanning”, which can lead to long hours in the field and unnecessary extension of the registration process of scans in the postprocessing phase [46]. A scan position layout plan developed during site visits prior to scanning is a very efficient way to optimize the number of scan positions for saving time and obtaining good coverage [47,63,70]. Another important factor for determining scan positions is to ensure proper connections between each of the rooms, spaces, floors, outdoor, and indoor environments. These precautions are vital to guarantee that when the raw scan files are processed, the scan processing software can recognize corresponding features as well as properly align and connect each of the scans [68]. Project documentation, such as a floor plan [46] or Google Maps [63], can be used to draw the scan layout plan. To obtain data with higher accuracy, ground control points (GCPs) or scan targets (e.g., spheres or checkboards) are often used for TLS surveys, so they need to be included in the scan plans as well [42,54,71]. Figure 10 shows a proposed scan position plan for a project to capture a historic museum in Alabama, USA, using a Leica ScanStation C10 scanner.
Other aspects to be considered during TLS survey planning include the expected coverage of the survey (i.e., interior, exterior, or both), other data acquisition technologies and techniques that may be involved [52,72], the capture of color [40], and safety [59]. Column (b) in Table 5 shows the coverage (e.g., exterior façade only, interior façade only, or both exterior and interior) of the TLS scans for the studies included in the 58 selected publications.
3.4. Static TLS Devices
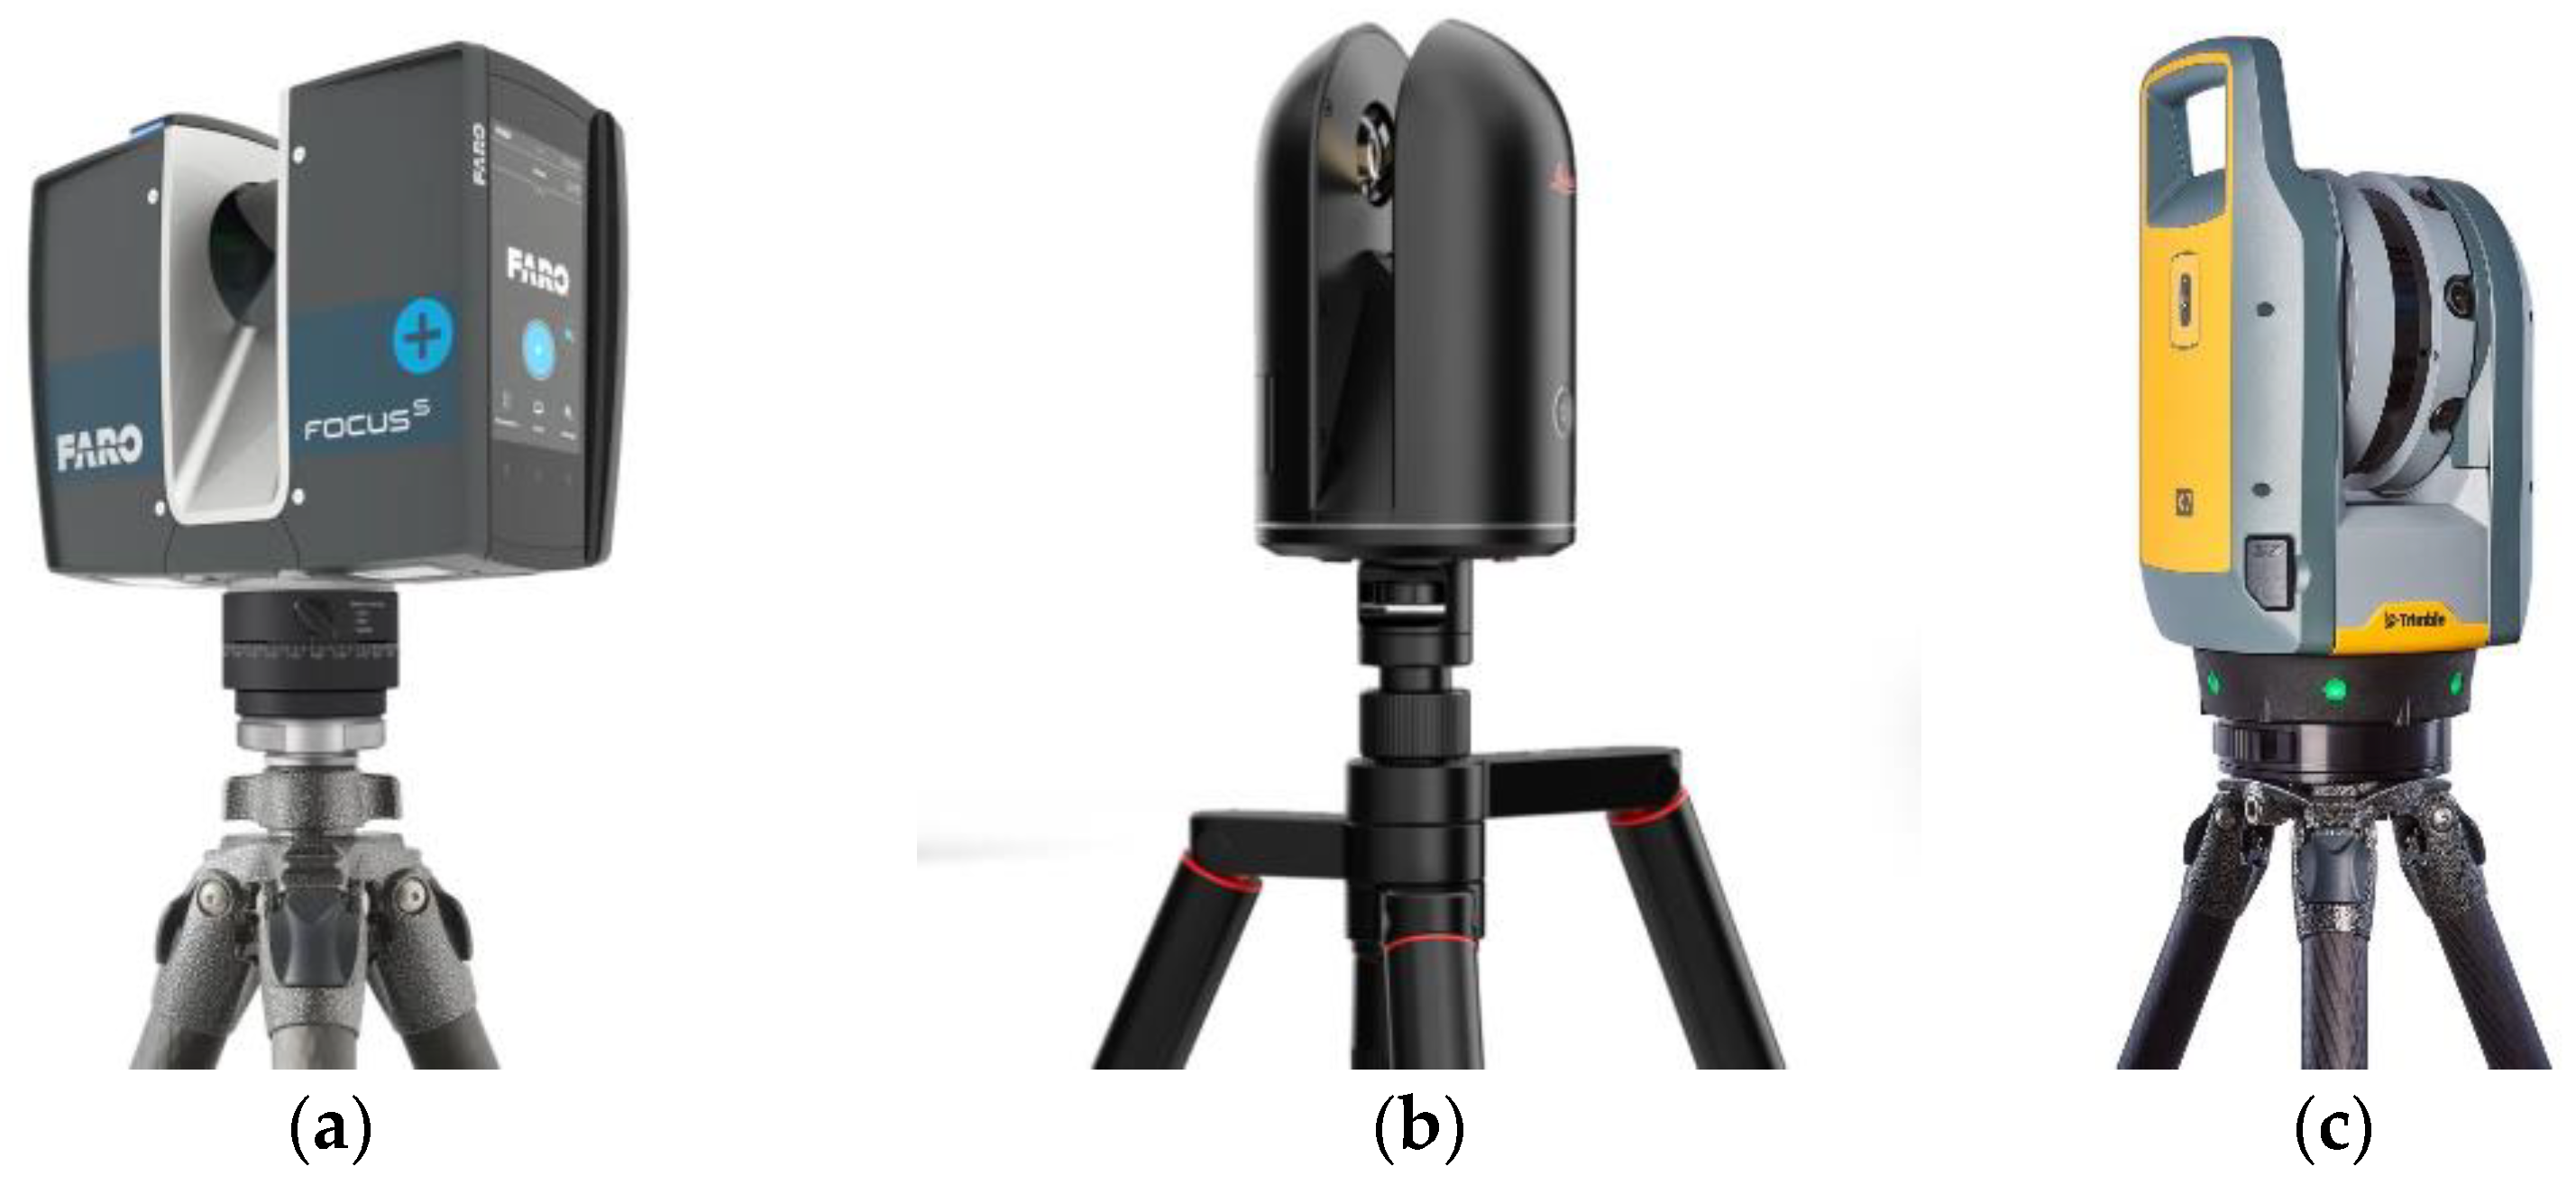
A total of 50 static TLS scanners from five different brands are explicitly mentioned in the selected publications, as shown in Figure 11. FARO® and Leica® dominate the list, supplying 24 and 20 of the scanners, respectively. Leica ScanStation C10 was one of the most widely adopted TLS scanners between 2015 and 2018 due to its high accuracy and long range. However, FARO Focus 3D series scanners started taking over in the late 2010s because of their high mobility and affordability. The FARO Focus Premium [93], Leica BLK360 [94], and Trimble X7 [95], as shown in Figure 12, are all considered to be the current state-of-the-art TLS scanners. All are lightweight, extremely fast, and have the capability of on-site registration. The brands of the TLS scanners used for HBIM projects in the included articles are shown in column (a) in Table 5.
3.5. TLS Survey
The scanners used for TLS surveys offer different options for scan resolution (Figure 13a). Scan resolution indicates the number of points captured per unit on a flat surface [58]. Scan resolution refers to the level of detail captured by the laser scanner during the scanning process and is an important consideration when selecting the appropriate settings for a particular scanning application. The scan resolution setting determines the density of points that the scanner will capture and create a point cloud from [69]. Several factors can impact the scan resolution, including the specification of the scanner, distance to the object, scan speed, reflectivity of the object, and environmental factors [69]. Choosing a scan resolution setting for TLS surveys depends on the specific application and the level of detail required. Depending on the site condition, the characteristics of the heritage, and time constraints, many HBIM practitioners choose to stay with the same scan resolution setting, normally an “intermedium level”, throughout the entire TLS survey for convenience and to save time. On the other hand, it is not unusual to use a combination of several resolution options to capture important facades at a high resolution and other areas at a medium or low resolution [6]. Maintaining field notes of the scan route to corroborate scan locations is essential for successful scan data postprocessing, as a project will rarely go as planned. Adjustments will be made, and more scans may be added to overcome occlusions or improve coverage and scan overlapping. All these changes to the original scan plan should be documented in the file notes. To improve the scan accuracy and help scan registration during postprocessing, reference points, such as GCPs or scan targets (e.g., spheres or checkboards) [46,52], are sometimes used, as shown in Table 5, Column (d). It is important to keep a record of the locations of these reference points in the field notes (Figure 13b).
3.6. Other RC Technologies Assisting TLS for Data Acquisition
Due to the complexity of the geometry of the built heritage and the limitations of the laser scanning technology, TLS is not a sufficient system for complete data acquisition. Therefore, it usually takes other technological tools and techniques to capture additional data about the heritage structure to supplement the TLS survey or to help improve the accuracy and coverage of the TLS survey [48,68,69]. These tools and techniques can be classified into the following groups:
See Column (e) in Table 5 for other RC technologies that were mentioned in the included publications.
3.6.1. SfM/Photogrammetry
TLS and photogrammetry can be integrated by exploiting the advantages of one over the other [64]. TLS is a more expensive technology in comparison with photogrammetric surveys, and higher knowledge is required to perform laser scans than to take photographs for 3D photoreconstructions [68]. On the other hand, photogrammetry is more cost-effective, more flexible, faster, and capable of collecting accurate and quality data for complex objects [48]. The benefit of integrating these two technologies is to take advantage of the TLS’s capability to acquire an accurate and dense point cloud and the flexibility of photogrammetry to operate even in exceptional conditions.
Combining TLS and photogrammetric techniques has proven to be the most effective way to record large and complex heritage sites in applications for documentation, structure assessment, texture mapping, feature extraction, etc. [12]. Twenty-three out of the fifty-eight articles included the capture of photogrammetric point clouds and combining them with TLS point clouds to fulfill the data acquisition task. In their research, de la Plata et al. [53] used a DSLR (digital single lens reflex) camera to generate high-density terrestrial photogrammetric point clouds of the interior surfaces of the buildings and TLS to capture exterior facades. Costantino, Pepe, and Restuccia [64] deployed a similar approach, using TLS to survey the external façade, a DLSR camera for inside, and a camera mounted on an unmanned aerial vehicle (UAV) for the upper part of the building. The integrated UAV with photogrammetric technology, as seen in Figure 14, offers practitioners the capacity to capture built heritage at higher elevations [96].
3.6.2. Mobile Handheld Scanners
Two reviewed articles indicated the utilization of hand-held MLS scanners to supplement static TLS surveys. A mobile handheld scanner supported by photogrammetry or LiDAR technology can be used to capture some hard-to-reach small spaces or to record fine details. To scan the unsafe areas that were inaccessible by using their tripod-based FARO Focus 3D scanner, Banfi et al. [59] used a handheld Mobile Mapping System (MMS), a GeoSLAM ZEB-HORIZON, to perform the work. Nieto-Julian et al. [84] used a Leica ScanStation C10 scanner to capture walls, columns, ceilings, beams, and roofs alongside a handheld Artec MHT 3D optical scanner (OS) to record the complex column capitals of a historic building.
3.6.3. TS and GPS
TS and GPS are used to establish control points (CPs). CPs can be used to integrate point clouds acquired through different technologies (e.g., TLS and photogrammetry) or to check the quality and accuracy of the TLS scan data. Banfi et al. [59] used a Leica TPS1200 total station to setup eight CPs (four inside and four outside), and then used them to successfully combine the two point clouds captured with a TLS scanner and a handheld scanner.
4. TLS Scan Data Processing
4.1. Scan Processing Software
Most TLS surveys capture multiple scans, as shown in Column (c) in Table 5. It is a common practice for HBIM practitioners to use the LiDAR scanner manufacturer’s own software to process the captured raw scan data, as shown in Column (f) in Table 5. For instance, FARO SCENE [97] is mentioned in 12 articles as the software chosen for processing, colorizing, registering, cleaning, and exporting the original scans captured by a FARO® Focus 3D scanner. Leica Cyclone [98] is also listed in 12 articles for handling scans taken by a Leica scanner. However, as a powerful third-party RC data processing and manipulation software, Autodesk ReCap Pro® [99] was used in 15 of the included articles. The other scan data software programs mentioned are 3D Zephyr® software (two articles), CloudCompare® (two articles), JRC Reconstructor® (one article), and Trimble Realwoks® (two articles). In each of the case studies examined in the selected publications, the researchers had to come up with their own choice of software programs for TLS data processing. This study has determined that the lack of a software suite that is compatible and capable of all the tasks required to process and manipulate TLS datasets for the development of HBIM is one of the main challenges for using TLS for HBIM [57].
4.2. TLS Scan Processing Workflow
Administering raw TLS survey scans for HBIM development includes three main steps: (1) scan registration, (2) point cloud data cleaning and optimization, and (3) point cloud dataset downsizing [69]. Scan data processing begins with scan registration. This step involves the alignment of scans into a single reference system to produce a unified point cloud of the entire heritage site. Scan registration is typically performed manually or automatically in pairs using pre-established targets (target-based registration) or homologous features (targetless registration).
After registration of the original scans, it is necessary to clean the point cloud to ensure that the resulting model is accurate and useful for further analysis and documentation. Point clouds are essentially a collection of data points in 3D space that represent the geometry of a scanned object or environment. However, these data points can be affected by a number of factors, such as sensor noise, reflective surfaces, and occlusions, resulting in inaccuracies and inconsistencies in the point cloud data. Cleaning the point cloud involves removing any noise or unwanted data points that may have been captured during the scanning process, as well as correcting any errors or inaccuracies that may have occurred. This process typically involves a combination of automated and manual techniques, such as filtering, segmentation, and classification, to identify and remove unwanted points [68].
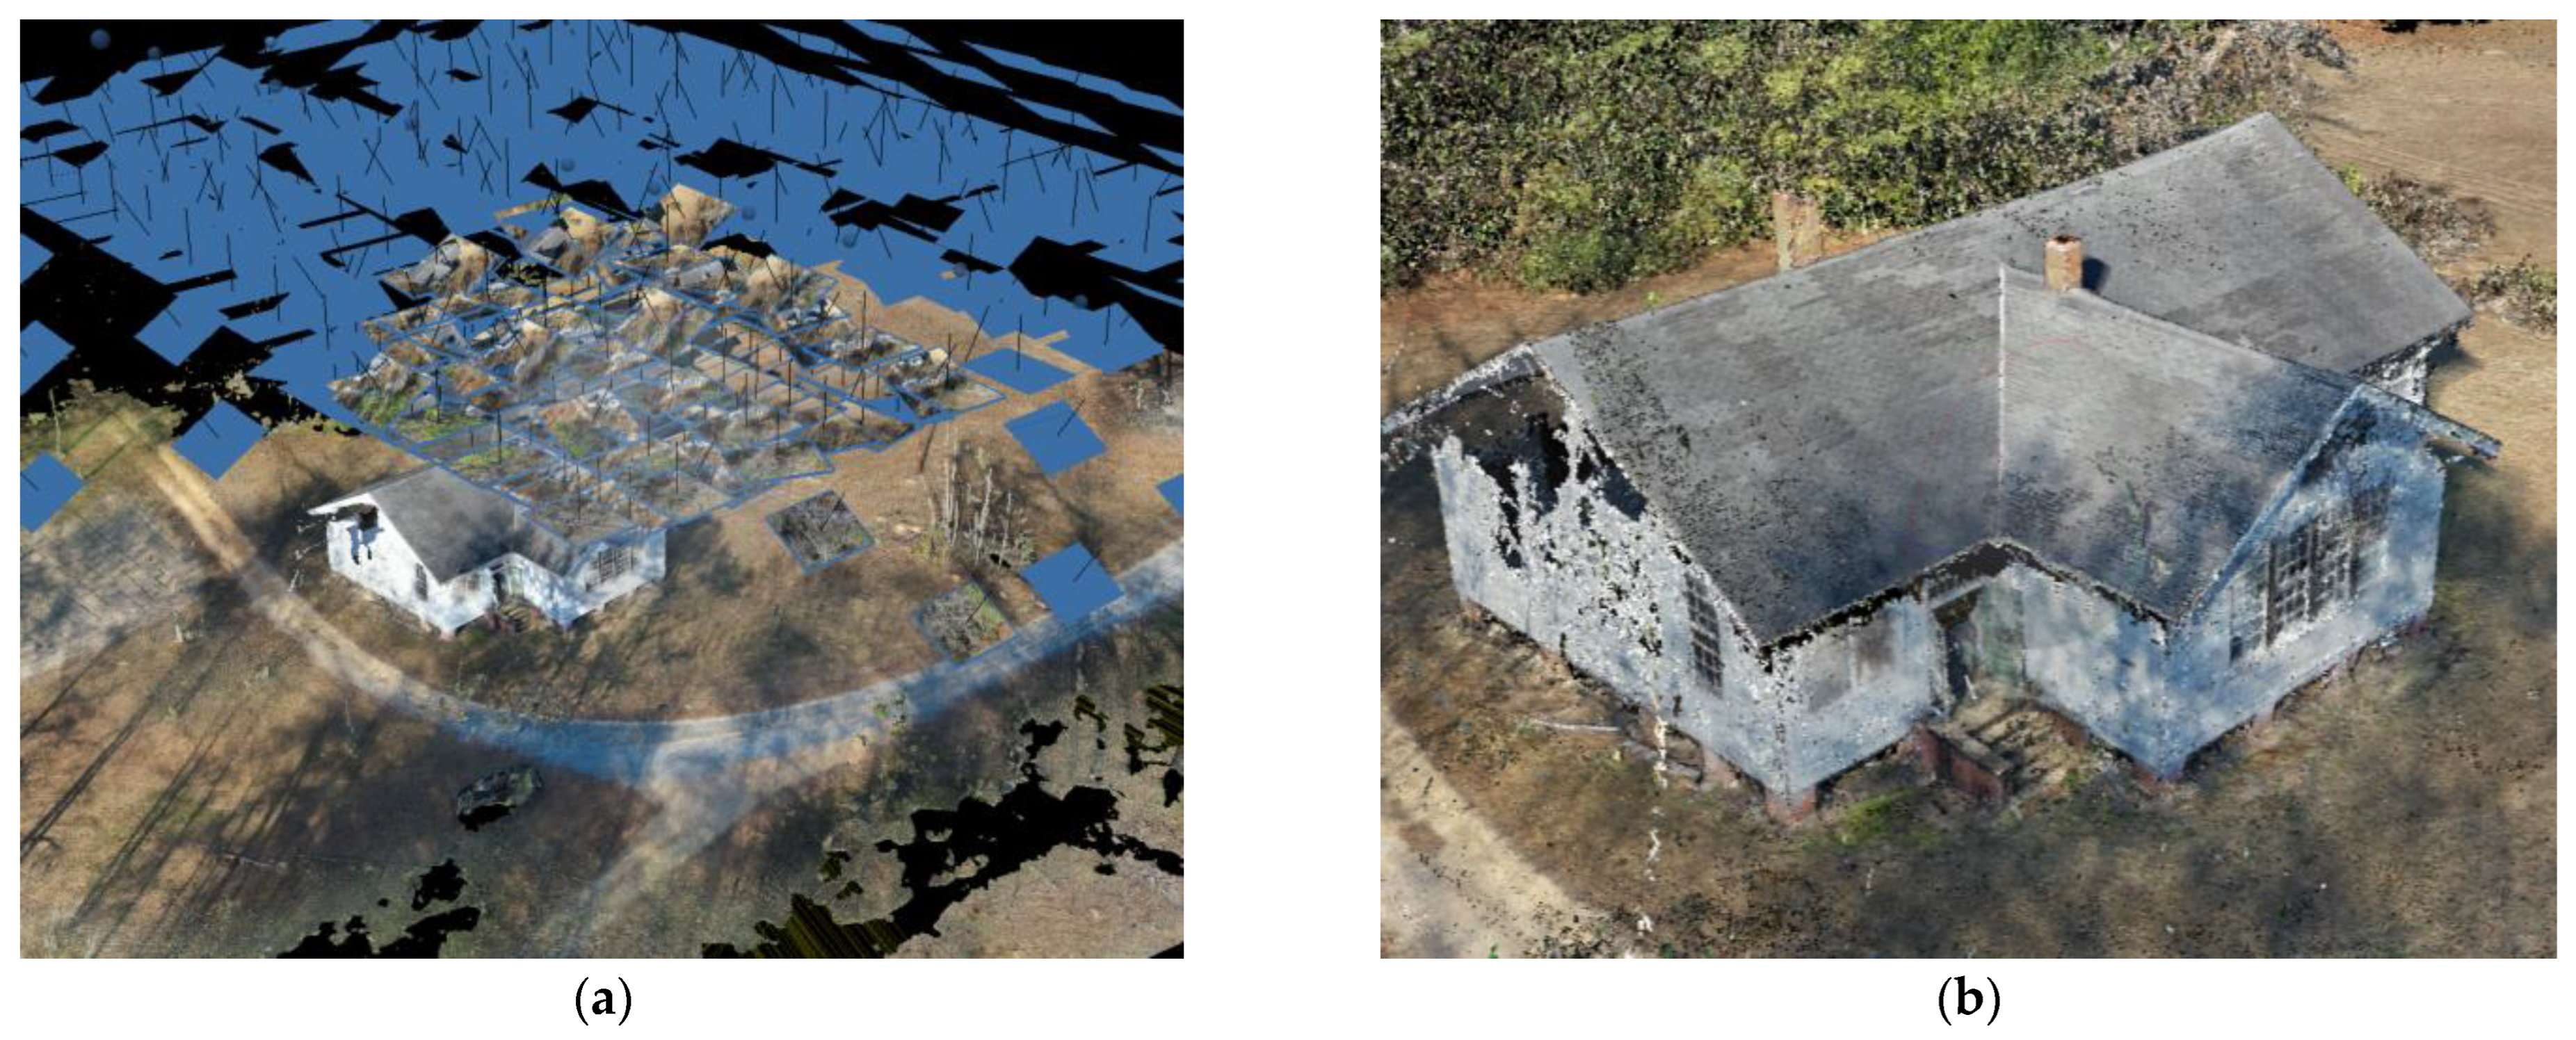
As shown in Column (g) in Table 5, TLS point clouds contain millions or sometimes billions of points and are massive in file size. However, more points would not always mean a better dataset for HBIM development. The number of points should be reduced, but only to the extent that no important information about geometry is lost. The ability to model building elements for HBIM with the use of a 3D point cloud depends on the cloud resolution, which is defined by the distance between the points or the density of points that the scanner will capture and create a point cloud from [69]. An approach deployed in the literature to reduce the number of points and subsequently decrease the scan data file size is subsampling [66]. This process can be done using software programs such as Autodesk ReCap Pro [74], CloudCompare [71], FARO SCENE [22], and Leica Cyclone [41], which allow the users to subsample a point cloud by increasing the distance between the points. This technique can dramatically reduce the point cloud file size and increase its manageability with computer systems for model development [74]. Figure 15 demonstrates the steps of processing TLS scans.
4.3. Integration of Multiple RC Point Clouds
As discussed in Section 3.6, the data acquisition of a heritage site for HBIM development often utilizes multiple technologies and techniques; therefore, the survey may end up with more than one-point clouds of the same structure. The studies in the 23 articles included in this research captured at least one TLS point cloud and one photogrammetric point cloud. It is necessary to integrate (or fuse) these separate point clouds into one that could provide the final conclusions and the overall vision for modeling [45]. The fusion of two individual point clouds can be conducted using Iterative Closest Point (ICP), an algorithm that minimizes the difference between two point clouds, transforms the source points, and reassociates them [81]. One of the most challenging aspects of point cloud integration is aligning all point clouds and converting them into the same coordinate system [48]. A common approach that was identified in the literature to overcome this hurdle was using the established GCPs as a shared reference in all point cloud data for alignment and scaling [22]. Several software platforms were used to perform point cloud fusion, including CloudCompare [46], Autodesk ReCap Pro [65], and Agisoft Metashape [60].
4.4. Evaluation of Point Cloud Data
Resolution (or accuracy) and quality are the two most important parameters for the 3D point cloud data [46], because they are decisive factors for the level of detail and accuracy of the HBIM models developed from them [5]. The assessment and verification of the point clouds are urgent tasks for many researchers. In a study conducted by Ariza-López et al. [58], a method was created and tested for using the ISO 19157 framework to establish quality specifications for a TLS point cloud that was captured for developing the HBIM of a historic bridge. In another article, Barrile and Fotia [65] presented a procedure that allowed them to verify the quality of the TLS surveys in order to achieve a better integration of different point clouds.
5. Discussion
Static Terrestrial Laser Scanning (TLS) has become a mandatory tool for data acquisition for HBIM development. The benefits of using TLS for HBIM include high accuracy and comprehensive coverage. However, there are also some drawbacks to using TLS, such as the substantial amount of initial investment required for equipment and software, the time-consuming process when capturing a large or complex project, and the sensitivity of TLS to the environment. To overcome these limitations, practitioners can implement a well-developed TLS survey plan and adopt other RC (Reality Capture) technologies to assist the data acquisition process.
A well-thought-out TLS survey plan can ensure maximum coverage of aqueduct surfaces with sufficient point density, reduce the occurrence of self-occlusions, and minimize the time spent on-site. TLS is normally used with other RC technologies, especially SfM (Structure-from-Motion) or photogrammetry. Integration of TLS and photogrammetry allows practitioners to take advantage of TLS’s high accuracy and photogrammetry’s flexibility. In terms of the choice of TLS scanners, FARO and Leica are the two dominant brands, with each holding almost half of the scanner market share.
A typical workflow to process the TLS scan data includes three steps: scan registration, point cloud data cleaning and optimization, and dataset downsizing. While reviewing the selected literature on TLS data processing and registration software, it was revealed that FARO SCENE and Leica Cyclone are among the most popular choices. Autodesk ReCap Pro is also a common choice, but it is mostly used for point cloud cleaning, filtering, and downsizing.
In order to ensure that the point cloud datasets can be effectively used for modeling in BIM platforms (such as Revit or ArchiCAD), the enormous point cloud files have to be downsized by reducing the point density and increasing the distance between the points while still maintaining the information and integrity of the important geometry in the point clouds. Most of the studied HBIM cases in the literature also used other RC technologies for data acquisition, especially photogrammetry; the data processing in these cases involved the fusion of multiple point clouds into one. To achieve this, the two separate point clouds are aligned and merged into the same coordinate system using the ICP (Iterative Closest Point) algorithm or with the assistance of pre-established reference points (i.e., GCPs). Autodesk ReCap Pro and an open-source software named CloudCompare are the leading software platforms for this task. The final step of TLS scan data processing is evaluating the accuracy and quality of the point cloud data.
6. Conclusions, Knowledge Gaps, and Research Limitations
Heritage Building Information Modeling (HBIM) plays a vital role in heritage documentation, conservation, and management, with Terrestrial Laser Scanning (TLS) emerging as an indispensable tool for data acquisition in this area. This research, based on a systematic review of 58 peer-reviewed journal articles published in English between 2012 and 2022, offers a comprehensive overview of the current state-of-the-art in the application of static TLS for HBIM development and has identified the existing knowledge gaps in this domain.
State-of-the-art static TLS is used for HBIM development. The review highlights that the integration of TLS into HBIM workflows significantly improves the accuracy, efficiency, and reliability of data collection and 3D modeling for cultural heritage sites [67,69]. The incorporation of high-resolution point cloud data derived from TLS has allowed researchers and practitioners to capture complex geometries and structural details, leading to more accurate and detailed HBIM models [57,63]. Furthermore, the combination of TLS with other technologies, such as photogrammetry, has resulted in more robust and comprehensive datasets for the development of HBIM models [56,78].
Knowledge gaps in the subject matter. Despite the advancements in TLS for HBIM development, several knowledge gaps have been identified in this study. These gaps offer opportunities for future research and innovation:
- The lack of guidelines for data acquisition for HBIM programs is a significant challenge that must be addressed. The lack of standardized methodologies and protocols for the integration of TLS data into HBIM models hinders the adoption and implementation of these technologies in the cultural heritage domain [86]. Practitioners often have to create their own methods to capture the existing condition of the built heritage based on the project’s characteristics, available resources, and their own experiences and knowledge. A clear guideline covering the planning, implementation, and data processing and transferring can help simplify the process and lower the cost, and it can also help practitioners establish their data acquisition methodology in line with the Level of Development (LOD) of the proposed HBIM model;
- The development of HBIM from TLS point cloud data mainly remains a manual process that requires significant effort. Efficient and accurate processing and integration of large and complex datasets derived from TLS and other sources remain a challenge [85]. Developing automated and semi-automated techniques for data processing, segmentation, and feature extraction can significantly reduce the time and resources required for capturing data on the existing condition of built heritage and creating the models, and contribute to streamlining the overall HBIM development process;
- The under-utilized capacity of TLS for long-term monitoring and change detection: While TLS has been widely used for the initial documentation and 3D modeling of heritage sites, its potential for long-term monitoring, change detection, and condition assessment remains underexplored [60,82]. Future research can focus on developing methodologies and tools for the systematic use of TLS data in monitoring and assessing the conservation status of heritage structures over time.
By addressing these knowledge gaps, future research can further improve the applicability of TLS in HBIM development, ultimately contributing to the preservation and management of our shared cultural heritage. In summary, this study not only provides a comprehensive overview of the state-of-the-art of TLS for HBIM development but also highlights the critical areas for future research and innovation in the field.
This research has some limitations. The included publications were extracted from two databases based on specific keywords and restricted to journal articles written in English, which does not cover all published data related to the discussed topic. It has been discovered by the author that the vast majority of these publications originate in Italy (twenty-nine), Spain (seventeen), or Portugal (six). Therefore, it is reasonable to assume that there are many studies related to the discussed topic published in those countries’ native languages that were excluded from this study.
Author Contributions
Conceptualization, J.L. and S.A.; methodology, J.L. and S.A.; validation, J.L.; formal analysis, J.L.; investigation, J.L.; data curation, J.L.; writing—original draft preparation, J.L.; writing—review and editing, S.A., D.W., and B.L.; visualization, J.L. and B.L. All authors have read and agreed to the published version of the manuscript.
Funding
This research received no external funding.
Institutional Review Board Statement
Not applicable.
Informed Consent Statement
Not applicable.
Data Availability Statement
The data that support the findings of this study are available upon request from the corresponding author. Due to the sensitive nature of the data and their file size, access to the data will be granted on a case-by-case basis and may require a data use agreement to be signed.
Conflicts of Interest
The authors declare no conflict of interest.
References
- Adami, A.; Bruno, N.; Rosignoli, O.; Scala, B. HBIM for Planned Conservation: A New Approach to Information Management. In Proceedings of the CHNT23, Vienna, Austria, 12–15 November 2018; p. 41. [Google Scholar]
- Angulo-Fornos, R.; Castellano-Román, M. HBIM as Support of Preventive Conservation Actions in Heritage Architecture. Experience of the Renaissance Quadrant Façade of the Cathedral of Seville. Appl. Sci. 2020, 10, 2428. [Google Scholar] [CrossRef] [Green Version]
- Jordan-Palomar, I.; Tzortzopoulos, P.; García-Valldecabres, J.; Pellicer, E. Protocol to Manage Heritage-Building Interventions Using Heritage Building Information Modelling (HBIM). Sustainability 2018, 10, 908. [Google Scholar] [CrossRef] [Green Version]
- Laefer, D.F.; Truong-Hong, L. Toward automatic generation of 3D steel structures for building information modelling. Autom. Constr. 2017, 74, 66–77. [Google Scholar] [CrossRef]
- Murphy, M.; McGovern, E.; Pavia, S. Historic Building Information Modelling–Adding intelligence to laser and image based surveys of European classical architecture. ISPRS J. Photogramm. Remote Sens. 2013, 76, 89–102. [Google Scholar] [CrossRef]
- Reinoso-Gordo, J.F.; Rodríguez-Moreno, C.; Gómez-Blanco, A.J.; León-Robles, C. Cultural Heritage Conservation and Sustainability Based on Surveying and Modeling: The Case of the 14th Century Building Corral del Carbón (Granada, Spain). Sustainability 2018, 10, 1370. [Google Scholar] [CrossRef] [Green Version]
- Yang, X.; Grussenmeyer, P.; Koehl, M.; Macher, H.; Murtiyoso, A.; Landes, T. Review of built heritage modelling: Integration of HBIM and other information techniques. J. Cult. Herit. 2020, 46, 350–360. [Google Scholar] [CrossRef]
- Bagnolo, V.; Argiolas, R.; Cuccu, A. HBIM for Archaeological Sites: From SfM Based Survey to Algorithmic Modeling. ISPRS-Int. Arch. Photogramm. Remote Sens. Spat. Inf. Sci. 2019, XLII-2/W9, 57–63. [Google Scholar] [CrossRef] [Green Version]
- Fobiri, G. A Scientometric Review of Reality Capture Applications in The Built Environment. In Proceedings of the 21st International Conference on Construction Application of Virtual Reality, Middlesbrough, UK, 12 December 2021. [Google Scholar]
- León-Robles, C.A.; Reinoso-Gordo, J.F.; González-Quiñones, J.J. Heritage Building Information Modeling (H-BIM) Applied to A Stone Bridge. ISPRS Int. J. Geo-Inf. 2019, 8, 121. [Google Scholar] [CrossRef] [Green Version]
- Logothetis, S.; Delinasiou, A.; Stylianidis, E. Building Information Modelling for Cultural Heritage: A Review. In Proceedings of the ISPRS Annals of the Photogrammetry, Remote Sensing and Spatial Information Sciences; Copernicus GmbH, Taipei, Taiwan, 11 August 2015; Volume II-5-W3, pp. 177–183. [Google Scholar]
- Alshawabkeh, Y.; Baik, A.; Miky, Y. Integration of Laser Scanner and Photogrammetry for Heritage BIM Enhancement. ISPRS Int. J. Geo-Inf. 2021, 10, 316. [Google Scholar] [CrossRef]
- Dore, C.; Murphy, M. Current State Of The Art Historic Building Information Modelling. ISPRS-Int. Arch. Photogramm. Remote Sens. Spat. Inf. Sci. 2017, XLII-2/W5, 185–192. [Google Scholar] [CrossRef] [Green Version]
- Marzouk, M. Using 3D Laser Scanning to Analyze Heritage Structures: The Case Study of Egyptian Palace. J. Civ. Eng. Manag. 2020, 26, 53–65. [Google Scholar] [CrossRef]
- Van Valkenburgh, P.; Cushman, K.C.; Castillo Butters, L.J.; Rojas Vega, C.; Roberts, C.B.; Kepler, C.; Kellner, J. Lasers without Lost Cities: Using Drone Lidar to Capture Architectural Complexity at Kuelap, Amazonas, Peru. J. Field Archaeol. 2020, 45, S75–S88. [Google Scholar] [CrossRef] [Green Version]
- Baik, A.; Alitany, A.; Boehm, J.; Robson, S. Jeddah Historical Building Information Modelling “JHBIM”–Object Library. Available online: http://dx.doi.org/10.5194/isprsannals-II-5-41-2014 (accessed on 11 December 2021).
- Berrett, B.E.; Vernon, C.A.; Beckstrand, H.; Pollei, M.; Markert, K.; Franke, K.W.; Hedengren, J.D. Large-Scale Reality Modeling of a University Campus Using Combined Uav and Terrestrial Photogrammetry for Historical Preservation and Practical Use. Drones 2021, 5, 136. [Google Scholar] [CrossRef]
- Carvajal-Ramirez, F.; Martinez-Carridondo, P.; Yero-Paneque, L.; Aguera-Vega, F. UAV Photogrammetry and HBIM for the Virtual Reconstruction of Heritage. In Proceedings of the 27th CIPA International Symposium-Documenting the Past for a Better Future, 1–5 September 2019; International Society for Photogrammetry and Remote Sensing: Avila, Spain, 2019; Volume 42, pp. 271–278. [Google Scholar]
- Ibrahim, A.; Golparvar-Fard, M.; El-Rayes, K. Multiobjective Optimization of Reality Capture Plans for Computer Vision–Driven Construction Monitoring with Camera-Equipped UAVs. J. Comput. Civ. Eng. 2022, 36, 04022018. [Google Scholar] [CrossRef]
- Martínez-Carricondo, P.; Carvajal-Ramírez, F.; Yero-Paneque, L.; Agüera-Vega, F. Combination of nadiral and oblique UAV photogrammetry and HBIM for the virtual reconstruction of cultural heritage. Case study of Cortijo del Fraile in Níjar, Almería (Spain). Build. Res. Inf. 2020, 48, 140–159. [Google Scholar] [CrossRef]
- Banfi, F.; Previtali, M.; Stanga, C.; Brumana, R. A Layered-Web Interface Based on HBIM and 360° Panoramas for Historical, Material and Geometric Analysis. ISPRS-Int. Arch. Photogramm. Remote Sens. Spat. Inf. Sci. 2019, XLII-2/W9, 73–80. [Google Scholar] [CrossRef] [Green Version]
- Barrile, V.; Bernardo, E.; Bilotta, G. An Experimental HBIM Processing: Innovative Tool for 3D Model Reconstruction of Morpho-Typological Phases for the Cultural Heritage. Remote Sens. 2022, 14, 1288. [Google Scholar] [CrossRef]
- Bastem, S.S.; Cekmis, A. Development of historic building information modelling: A systematic literature review. Build. Res. Inf. 2022, 50, 527–558. [Google Scholar] [CrossRef]
- UNAVCO. Available online: https://www.unavco.org/help/glossary/glossary.html#lidar (accessed on 7 January 2022).
- Colombo, L.; Marana, B. Terrestrial Laser Scanning. Available online: https://www.gim-international.com/content/article/terrestrial-laser-scanning-2 (accessed on 7 January 2022).
- Del Duca, G.; Machado, C. Assessing the Quality of the Leica BLK2GO Mobile Laser Scanner versus the Focus 3D S120 Static Terrestrial Laser Scanner for a Preliminary Study of Garden Digital Surveying. Heritage 2023, 6, 1007–1027. [Google Scholar] [CrossRef]
- Gollob, C.; Ritter, T.; Nothdurft, A. Comparison of 3D Point Clouds Obtained by Terrestrial Laser Scanning and Personal Laser Scanning on Forest Inventory Sample Plots. Data 2020, 5, 103. [Google Scholar] [CrossRef]
- Bauwens, S.; Bartholomeus, H.; Calders, K.; Lejeune, P. Forest Inventory with Terrestrial LiDAR: A Comparison of Static and Hand-Held Mobile Laser Scanning. Forests 2016, 7, 127. [Google Scholar] [CrossRef] [Green Version]
- Williams, R.D.; Lamy, M.; Maniatis, G.; Stott, E. Three-dimensional reconstruction of fluvial surface sedimentology and topography using personal mobile laser scanning. Earth Surf. Process. Landf. 2019, 45, 251–261. [Google Scholar] [CrossRef]
- Che, E.; Jung, J.; Olsen, M.J. Object Recognition, Segmentation, and Classification of Mobile Laser Scanning Point Clouds: A State of the Art Review. Sensors 2019, 19, 810. [Google Scholar] [CrossRef] [PubMed] [Green Version]
- Kukko, A.; Kaartinen, H.; Hyyppä, J.; Chen, Y. Multiplatform Mobile Laser Scanning: Usability and Performance. Sensors 2012, 12, 11712–11733. [Google Scholar] [CrossRef] [Green Version]
- Barnhart, T.B.; Crosby, B.T. Comparing Two Methods of Surface Change Detection on an Evolving Thermokarst Using High-Temporal-Frequency Terrestrial Laser Scanning, Selawik River, Alaska. Remote Sens. 2013, 5, 2813–2837. [Google Scholar] [CrossRef] [Green Version]
- Hohenthal, J.; Alho, P.; Hyyppä, J.; Hyyppä, H. Laser scanning applications in fluvial studies. Prog. Phys. Geogr. Earth Environ. 2011, 35, 782–809. [Google Scholar] [CrossRef]
- Di Stefano, F.; Chiappini, S.; Gorreja, A.; Balestra, M.; Pierdicca, R. Mobile 3D scan LiDAR: A literature review. Geomat. Nat. Hazards Risk 2021, 12, 2387–2429. [Google Scholar] [CrossRef]
- Moyano, J.; Justo-Estebaranz, A.; Nieto-Julián, J.E.; Barrera, A.O.; Fernández-Alconchel, M. Evaluation of Records Using Terrestrial Laser Scanner in Architectural Heritage for Information Modeling in HBIM Construction: The Case Study of the La Anunciaci Acute Accent on Church (Seville). J. Build. Eng. 2022, 62, 105190. [Google Scholar] [CrossRef]
- Fobiri, G.; Musonda, I.; Muleya, F. Reality Capture in Construction Project Management: A Review of Opportunities and Challenges. Buildings 2022, 12, 1381. [Google Scholar] [CrossRef]
- Kitchenham, B.; Charters, S. Guidelines for Performing Systematic Literature Reviews in Software Engineering. Technical Report EBSE 2007-001, Keele University and Durham University Joint Report. 2007, 2. Available online: https://www.elsevier.com/__data/promis_misc/525444systematicreviewsguide.pdf (accessed on 1 April 2023).
- Murphy, M.; McGovern, E.; Pavia, S. Historic building information modelling (HBIM). Struct. Surv. 2009, 27, 311–327. [Google Scholar] [CrossRef] [Green Version]
- Chong, H.T.; Lim, C.K.; Rafi, A.; Tan, K.L.; Mokhtar, M. Comprehensive systematic review on virtual reality for cultural heritage practices: Coherent taxonomy and motivations. Multimed. Syst. 2022, 28, 711–726. [Google Scholar] [CrossRef]
- Moyano, J.; Nieto-Julián, J.E.; Lenin, L.M.; Bruno, S. Operability of Point Cloud Data in an Architectural Heritage Information Model. Int. J. Arch. Herit. 2021, 16, 1588–1607. [Google Scholar] [CrossRef]
- Martín-Lerones, P.; Olmedo, D.; López-Vidal, A.; Gómez-García-Bermejo, J.; Zalama, E. BIM Supported Surveying and Imaging Combination for Heritage Conservation. Remote Sens. 2021, 13, 1584. [Google Scholar] [CrossRef]
- Moyano, J.; Gil-Arizón, I.; Nieto-Julián, J.E.; Marín-García, D. Analysis and management of structural deformations through parametric models and HBIM workflow in architectural heritage. J. Build. Eng. 2022, 45, 103274. [Google Scholar] [CrossRef]
- Rocha, G.; Mateus, L. A Survey of Scan-to-BIM Practices in the AEC Industry—A Quantitative Analysis. ISPRS Int. J. Geo-Inf. 2021, 10, 564. [Google Scholar] [CrossRef]
- Abbate, E.; Invernizzi, S.; Spanò, A. HBIM parametric modelling from clouds to perform structural analyses based on finite elements: A case study on a parabolic concrete vault. Appl. Geomat. 2022, 14, 79–96. [Google Scholar] [CrossRef]
- Franco, P.A.C.; De La Plata, A.R.M.; Franco, J.C. From the Point Cloud to BIM Methodology for the Ideal Reconstruction of a Lost Bastion of the Cáceres Wall. Appl. Sci. 2020, 10, 6609. [Google Scholar] [CrossRef]
- Palčák, M.; Kudela, P.; Fandáková, M.; Kordek, J. Utilization of 3D Digital Technologies in the Documentation of Cultural Heritage: A Case Study of the Kunerad Mansion (Slovakia). Appl. Sci. 2022, 12, 4376. [Google Scholar] [CrossRef]
- Al-Bayari, O.; Shatnawi, N. Geomatics techniques and building information model for historical buildings conservation and restoration. Egypt. J. Remote Sens. Space Sci. 2022, 25, 563–568. [Google Scholar] [CrossRef]
- Alshawabkeh, Y.; Baik, A.; Fallatah, A. As-Textured As-Built BIM Using Sensor Fusion, Zee Ain Historical Village as a Case Study. Remote Sens. 2021, 13, 5135. [Google Scholar] [CrossRef]
- Mammoli, R.; Mariotti, C.; Quattrini, R. Modeling the Fourth Dimension of Architectural Heritage: Enabling Processes for a Sustainable Conservation. Sustainability 2021, 13, 5173. [Google Scholar] [CrossRef]
- Massafra, A.; Prati, D.; Predari, G.; Gulli, R. Wooden Truss Analysis, Preservation Strategies, and Digital Documentation through Parametric 3D Modeling and HBIM Workflow. Sustainability 2020, 12, 4975. [Google Scholar] [CrossRef]
- Banfi, F.; Roascio, S.; Paolillo, F.R.; Previtali, M.; Roncoroni, F.; Stanga, C. Diachronic and Synchronic Analysis for Knowledge Creation: Architectural Representation Geared to XR Building Archaeology (Claudius-Anio Novus Aqueduct in Tor Fiscale, the Appia Antica Archaeological Park). Energies 2022, 15, 4598. [Google Scholar] [CrossRef]
- Conti, A.; Fiorini, L.; Massaro, R.; Santoni, C.; Tucci, G. HBIM for the preservation of a historic infrastructure: The Carlo III bridge of the Carolino Aqueduct. Appl. Geomat. 2022, 14, 41–51. [Google Scholar] [CrossRef]
- Plata, A.; Franco, P.; Franco, J.; Bravo, V.G. Protocol Development for Point Clouds, Triangulated Meshes and Parametric Model Acquisition and Integration in an HBIM Workflow for Change Control and Management in a UNESCO’s World Heritage Site. Sensors 2021, 21, 1083. [Google Scholar] [CrossRef]
- Machete, R.; Silva, J.R.; Bento, R.; Falcão, A.P.; Gonçalves, A.B.; de Carvalho, J.M.L.; Silva, D.V. Information transfer between two heritage BIMs for reconstruction support and facility management: The case study of the Chalet of the Countess of Edla, Sintra, Portugal. J. Cult. Herit. 2021, 49, 94–105. [Google Scholar] [CrossRef]
- Rolin, R.; Antaluca, E.; Batoz, J.-L.; Lamarque, F.; Lejeune, M. From Point Cloud Data to Structural Analysis Through a Geometrical hBIM-Oriented Model. J. Comput. Cult. Herit. 2019, 12, 1–26. [Google Scholar] [CrossRef] [Green Version]
- Banfi, F. The Evolution of Interactivity, Immersion and Interoperability in HBIM: Digital Model Uses, VR and AR for Built Cultural Heritage. ISPRS Int. J. Geo-Inf. 2021, 10, 685. [Google Scholar] [CrossRef]
- Pepe, M.; Costantino, D.; Garofalo, A.R. An efficient pipeline to obtain 3D model for HBIM and structural analysis purposes from 3D point clouds. Appl. Sci. 2020, 10, 1235. [Google Scholar] [CrossRef] [Green Version]
- Ariza-López, F.J.; Reinoso-Gordo, J.F.; García-Balboa, J.L.; Ariza-López, I. Quality specification and control of a point cloud from a TLS survey using ISO 19157 standard. Autom. Constr. 2022, 140, 104353. [Google Scholar] [CrossRef]
- Banfi, F.; Brumana, R.; Landi, A.G.; Previtali, M.; Roncoroni, F.; Stanga, C. Building archaeology informative modelling turned into 3D volume stratigraphy and extended reality time-lapse communication. Virtual Archaeol. Rev. 2022, 13, 1–21. [Google Scholar] [CrossRef]
- Santagati, C.; Papacharalambous, D.; Sanfilippo, G.; Bakirtzis, N.; Laurini, C.; Hermon, S. HBIM approach for the knowledge and documentation of the St. John the Theologian cathedral in Nicosia (Cyprus). J. Archaeol. Sci. Rep. 2021, 36, 102804. [Google Scholar] [CrossRef]
- Youn, H.-C.; Yoon, J.-S.; Ryoo, S.-L. HBIM for the Characteristics of Korean Traditional Wooden Architecture: Bracket Set Modelling Based on 3D Scanning. Buildings 2021, 11, 506. [Google Scholar] [CrossRef]
- Banfi, F. HBIM, 3D drawing and virtual reality for archaeological sites and ancient ruins. Virtual Archaeol. Rev. 2020, 11, 16–33. [Google Scholar] [CrossRef]
- Nguyen, T.A.; Do, S.T.; Le-Hoai, L.; Nguyen, V.T.; Pham, T.-A. Practical workflow for cultural heritage digitalization and management: A case study in Vietnam. Int. J. Constr. Manag. 2022, 1–15. [Google Scholar] [CrossRef]
- Costantino, D.; Pepe, M.; Restuccia, A. Scan-to-HBIM for conservation and preservation of Cultural Heritage building: The case study of San Nicola in Montedoro church (Italy). Appl. Geomat. 2021, 1–15. [Google Scholar] [CrossRef]
- Barrile, V.; Fotia, A. A proposal of a 3D segmentation tool for HBIM management. Appl. Geomat. 2021, 14, 197–209. [Google Scholar] [CrossRef]
- Garcia-Gago, J.; Sánchez-Aparicio, L.J.; Soilán, M.; González-Aguilera, D. HBIM for supporting the diagnosis of historical buildings: Case study of the Master Gate of San Francisco in Portugal. Autom. Constr. 2022, 141, 104453. [Google Scholar] [CrossRef]
- Aryan, A.; Bosché, F.; Tang, P. Planning for terrestrial laser scanning in construction: A review. Autom. Constr. 2021, 125, 103551. [Google Scholar] [CrossRef]
- Rocha, G.; Mateus, L.; Fernández, J.; Ferreira, V. A Scan-to-BIM Methodology Applied to Heritage Buildings. Heritage 2020, 3, 47–65. [Google Scholar] [CrossRef] [Green Version]
- Fryskowska, A.; Stachelek, J. A no-reference method of geometric content quality analysis of 3D models generated from laser scanning point clouds for hBIM. J. Cult. Herit. 2018, 34, 95–108. [Google Scholar] [CrossRef]
- Pepe, M.; Costantino, D.; Alfio, V.S.; Restuccia, A.G.; Papalino, N.M. Scan to BIM for the digital management and representation in 3D GIS environment of cultural heritage site. J. Cult. Herit. 2021, 50, 115–125. [Google Scholar] [CrossRef]
- Mol, A.; Cabaleiro, M.; Sousa, H.S.; Branco, J.M. HBIM for storing life-cycle data regarding decay and damage in existing timber structures. Autom. Constr. 2020, 117, 103262. [Google Scholar] [CrossRef]
- Cuperschmid, A.R.M.; Fabricio, M.M.; Franco, J.J.C. HBIM Development of A Brazilian Modern Architecture Icon: Glass House by Lina Bo Bardi. Heritage 2019, 2, 1927–1940. [Google Scholar] [CrossRef] [Green Version]
- Andriasyan, M.; Moyano, J.; Nieto-Julián, J.E.; Antón, D. From Point Cloud Data to Building Information Modelling: An Automatic Parametric Workflow for Heritage. Remote Sens. 2020, 12, 1094. [Google Scholar] [CrossRef] [Green Version]
- Antón, D.; Medjdoub, B.; Shrahily, R.; Moyano, J. Accuracy evaluation of the semi-automatic 3D modeling for historical building information models. Int. J. Arch. Herit. 2018, 12, 790–805. [Google Scholar] [CrossRef] [Green Version]
- Baik, A. The Use of Interactive Virtual BIM to Boost Virtual Tourism in Heritage Sites, Historic Jeddah. ISPRS Int. J. Geo-Inf. 2021, 10, 577. [Google Scholar] [CrossRef]
- Brumana, R.; Condoleo, P.; Grimoldi, A.; Banfi, F.; Landi, A.G.; Previtali, M. HR LOD based HBIM to detect influences on geometry and shape by stereotomic construction techniques of brick vaults. Appl. Geomat. 2018, 10, 529–543. [Google Scholar] [CrossRef]
- Brumana, R.; Della Torre, S.; Previtali, M.; Barazzetti, L.; Cantini, L.; Oreni, D.; Banfi, F. Generative HBIM modelling to embody complexity (LOD, LOG, LOA, LOI): Surveying, preservation, site intervention—The Basilica di Collemaggio (L’Aquila). Appl. Geomat. 2018, 10, 545–567. [Google Scholar] [CrossRef]
- Colucci, E.; Xing, X.; Kokla, M.; Mostafavi, M.; Noardo, F.; Spanò, A. Ontology-Based Semantic Conceptualisation of Historical Built Heritage to Generate Parametric Structured Models from Point Clouds. Appl. Sci. 2021, 11, 2813. [Google Scholar] [CrossRef]
- Croce, V.; Caroti, G.; De Luca, L.; Jacquot, K.; Piemonte, A.; Véron, P. From the Semantic Point Cloud to Heritage-Building Information Modeling: A Semiautomatic Approach Exploiting Machine Learning. Remote Sens. 2021, 13, 461. [Google Scholar] [CrossRef]
- Grillanda, N.; Cantini, L.; Barazzetti, L.; Milani, G.; Della Torre, S. Advanced Modeling of a Historical Masonry Umbrella Vault: Settlement Analysis and Crack Tracking via Adaptive NURBS Kinematic Analysis. J. Eng. Mech. 2021, 147, 04021095. [Google Scholar] [CrossRef]
- Lin, G.; Giordano, A.; Sang, K. From Site Survey to HBIM Model for the Documentation of Historic Buildings: The Case Study of Hexinwu Village in China. Conserv. Sci. Cult. Herit. 2020, 20, 111–123. [Google Scholar] [CrossRef]
- Moyano, J.; Odriozola, C.P.; Nieto-Julián, J.E.; Vargas, J.M.; Barrera, J.A.; León, J. Bringing BIM to archaeological heritage: Interdisciplinary method/strategy and accuracy applied to a megalithic monument of the Copper Age. J. Cult. Herit. 2020, 45, 303–314. [Google Scholar] [CrossRef]
- Nespeca, R. Towards a 3D digital model for management and fruition of Ducal Palace at Urbino. An integrated survey with mobile mapping. SCIRES-IT-SCIentific RESearch Inf. Technol. 2018, 8, 1–14. [Google Scholar] [CrossRef]
- Nieto-Julián, J.E.; Antón, D.; Moyano, J.J. Implementation and Management of Structural Deformations into Historic Building Information Models. Int. J. Arch. Herit. 2020, 14, 1384–1397. [Google Scholar] [CrossRef]
- Nieto-Julián, J.E.; Farratell, J.; Cavada, M.B.; Moyano, J. Collaborative Workflow in an HBIM Project for the Restoration and Conservation of Cultural Heritage. Int. J. Arch. Herit. 2022, 1–20. [Google Scholar] [CrossRef]
- Rodríguez-Moreno, C.; Reinoso-Gordo, J.F.; Rivas-López, E.; Gómez-Blanco, A.; Ariza-López, F.J.; Ariza-López, I. From point cloud to BIM: An integrated workflow for documentation, research and modelling of architectural heritage. Surv. Rev. 2018, 50, 212–231. [Google Scholar] [CrossRef]
- Rossi, A.; Palmieri, U. Experimentation of an Information Model. Vitruvio 2020, 5, 37–46. [Google Scholar] [CrossRef]
- Santos, D.; Cabaleiro, M.; Sousa, H.S.; Branco, J.M. Apparent and resistant section parametric modelling of timber structures in HBIM. J. Build. Eng. 2022, 49, 103990. [Google Scholar] [CrossRef]
- Sztwiertnia, D.; Ochałek, A.; Tama, A.; Lewińska, P. HBIM (heritage Building Information Modell) of the Wang Stave Church in Karpacz–Case Study. Int. J. Arch. Herit. 2021, 15, 713–727. [Google Scholar] [CrossRef]
- Tan, J.; Leng, J.; Zeng, X.; Feng, D.; Yu, P. Digital Twin for Xiegong’s Architectural Archaeological Research: A Case Study of Xuanluo Hall, Sichuan, China. Buildings 2022, 12, 1053. [Google Scholar] [CrossRef]
- Ursini, A.; Grazzini, A.; Matrone, F.; Zerbinatti, M. From scan-to-BIM to a structural finite elements model of built heritage for dynamic simulation. Autom. Constr. 2022, 142, 104518. [Google Scholar] [CrossRef]
- Zouaoui, M.A.; Djebri, B.; Capsoni, A. From Point Cloud to HBIM to FEA, the Case of a Vernacular Architecture: Aggregate of the Kasbah of Algiers. J. Comput. Cult. Herit. 2021, 14, 1–21. [Google Scholar] [CrossRef]
- FARO Focus Premium. Available online: https://www.faro.com/en/Resource-Library/Brochure/FARO-Focus-Premium (accessed on 26 November 2022).
- BLK360|Leica Geosystems. Available online: https://shop.leica-geosystems.com/leica-blk/blk360?c1=GAW_SE_NW&source=USA_RC_BRND&kw=blk360&utm_source=GAW_SE_NWUSA_RC_BRND&utm_medium=cpc&utm_term=blk360&cr5=621284425896&cr7=c&gclid=Cj0KCQiAj4ecBhD3ARIsAM4Q_jGHP5ricF1l0OngsXYrkxeryfior4_I09A2sCpcSF1eZfDIc5SkwPoaAj4REALw_wcB (accessed on 26 November 2022).
- Trimble X7|3D Laser Scanning|Trimble Geospatial. Available online: https://geospatial.trimble.com/products-and-solutions/trimble-x7 (accessed on 26 November 2022).
- Martínez-Carricondo, P.; Carvajal-Ramírez, F.; Yero-Paneque, L.; Agüera-Vega, F. Combination of HBIM and UAV photogrammetry for modelling and documentation of forgotten heritage. Case study: Isabel II dam in Níjar (Almería, Spain). Herit. Sci. 2021, 9, 1–15. [Google Scholar] [CrossRef]
- FARO® SCENE 3D Point Cloud Software|FARO. Available online: https://www.faro.com/en/Products/Software/SCENE-Software (accessed on 26 November 2022).
- Leica Cyclone 3D Point Cloud Processing Software. Available online: https://leica-geosystems.com/en-US/products/laser-scanners/software/leica-cyclone (accessed on 26 November 2022).
- ReCap Software|Get Prices et Buy ReCap Pro 2022|Autodesk. Available online: https://www.autodesk.com/products/recap/overview (accessed on 27 April 2021).
Figure 1.
A representative diagram of the HBIM workflow and related software used in different stages.
Figure 1.
A representative diagram of the HBIM workflow and related software used in different stages.

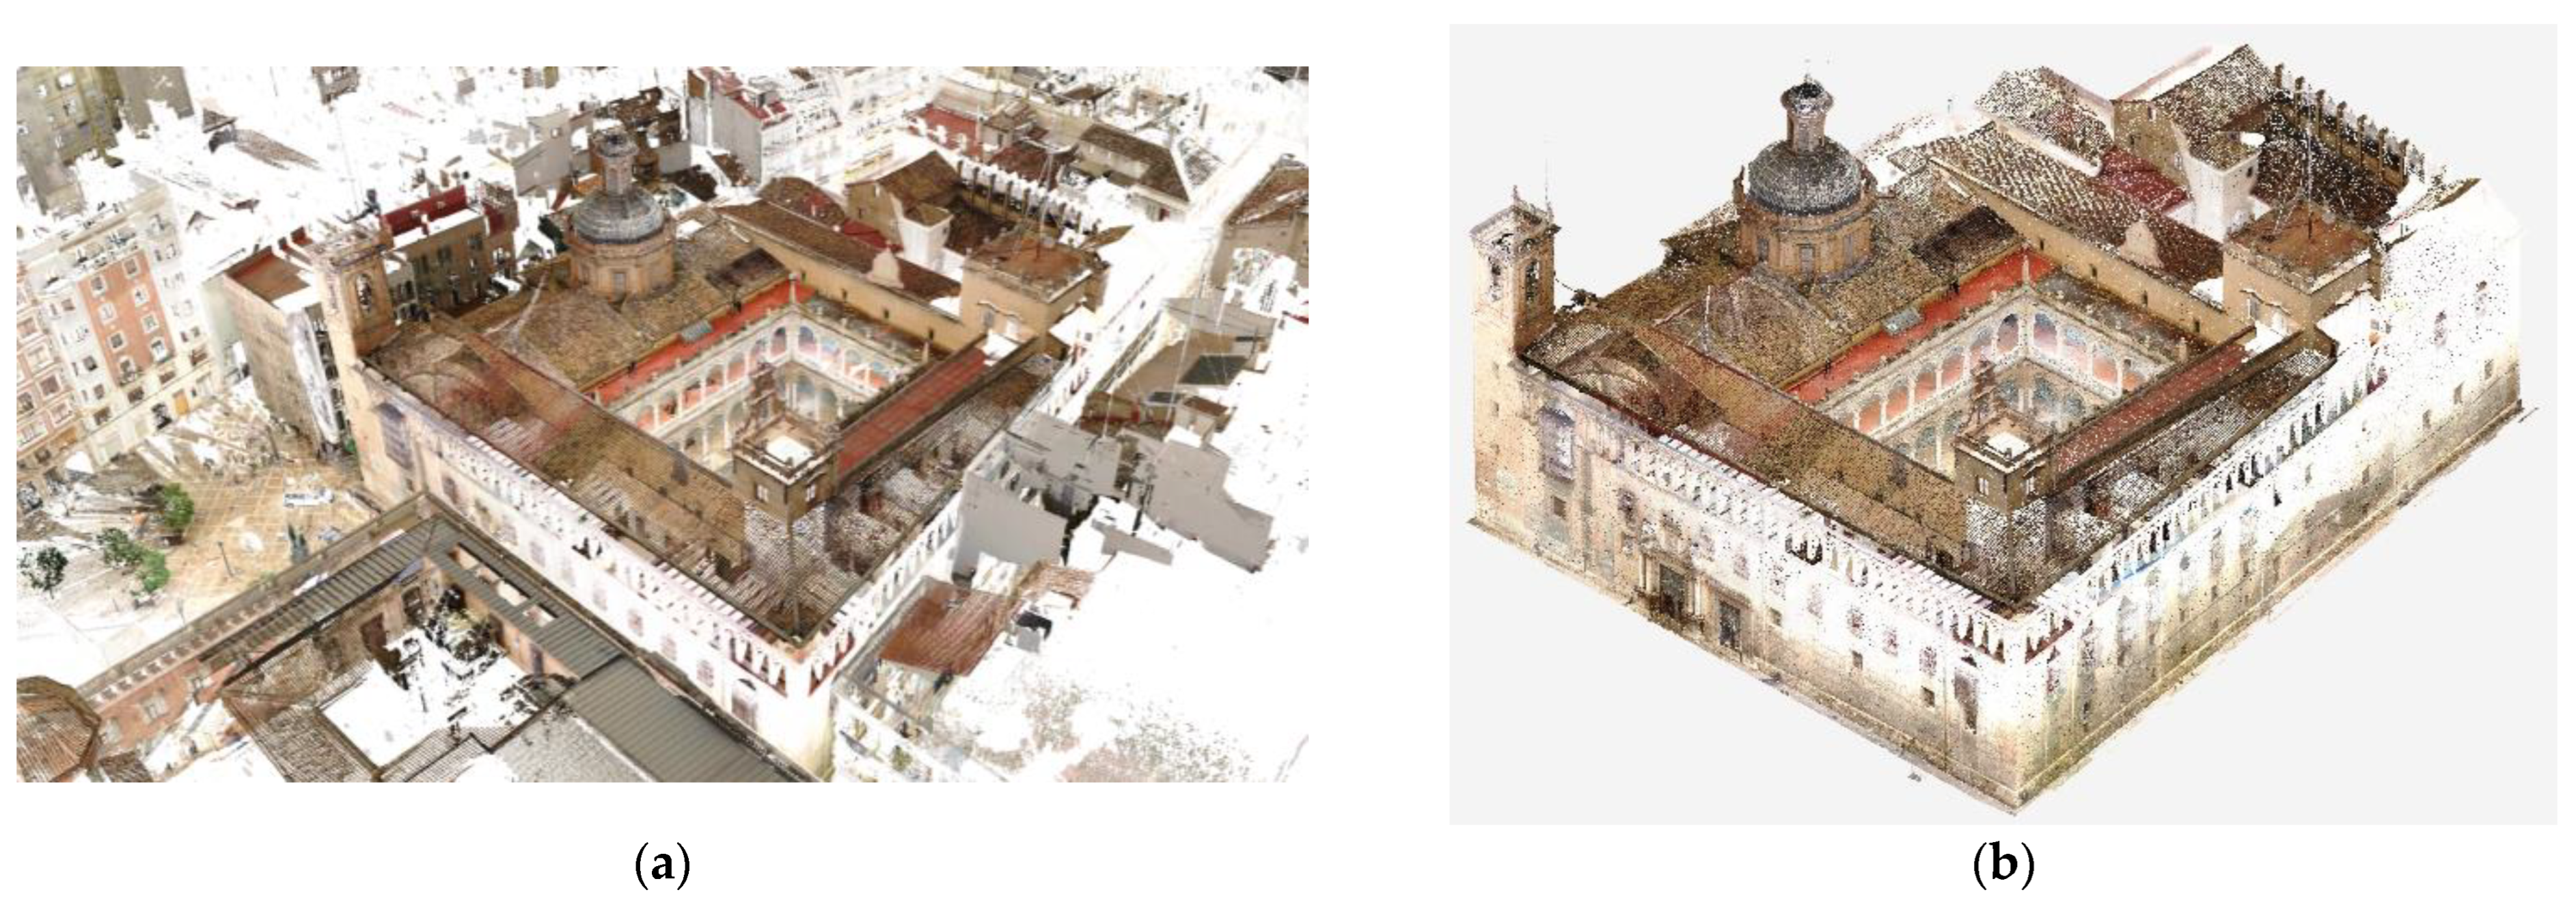
Figure 2.
TLS technology and its application in HBIM: (a) the principle of TLS; (b) a resultant point cloud of the TLS survey; and (c) an HBIM model developed from the TLS point cloud.
Figure 2.
TLS technology and its application in HBIM: (a) the principle of TLS; (b) a resultant point cloud of the TLS survey; and (c) an HBIM model developed from the TLS point cloud.

Figure 3.
Systematic literature review process. Inspired by [37].
Figure 3.
Systematic literature review process. Inspired by [37].

Figure 4.
The PRISMA workflow to select the 58 articles for this research study.

Figure 5.
Year of publication of included articles.

Figure 6.
Origin of contributing authors.

Figure 7.
Most active authors.

Figure 8.
Network visualization of the most common keywords (five occurrences or more) and clusters of the five most cited keywords.
Figure 8.
Network visualization of the most common keywords (five occurrences or more) and clusters of the five most cited keywords.

Figure 9.
Distribution of the most frequently occurring keywords (five occurrences or more) over time.
Figure 9.
Distribution of the most frequently occurring keywords (five occurrences or more) over time.

Figure 10.
A sample “Scan Position Layout Plan”. Red circles represent proposed scan locations, and yellow circles represent scan target locations.
Figure 10.
A sample “Scan Position Layout Plan”. Red circles represent proposed scan locations, and yellow circles represent scan target locations.

Figure 11.
Occurrences of TLS scanner brand names listed in the included publications.

Figure 12.
Three of the latest state-of-the-art TLS scanners: (a) FARO Focus Premium [93]; (b) Leica BLK360 [94]; and (c) Trimble X7 [95].

Figure 13.
(a) Choosing scan resolution on a FARO Focus 3D S-350 scanner and (b) scanning field notes taken using a floor plan to track the locations of the scans.
Figure 13.
(a) Choosing scan resolution on a FARO Focus 3D S-350 scanner and (b) scanning field notes taken using a floor plan to track the locations of the scans.

Figure 14.
UAV photogrammetry: (a) UAV photogrammetry schematic and (b) UAV photogrammetric point cloud.
Figure 14.
UAV photogrammetry: (a) UAV photogrammetry schematic and (b) UAV photogrammetric point cloud.

Figure 15.
TLS scan processing: (a) the “raw” TLS point cloud captured with 341 scans shown in Autodesk ReCap Pro before cleaning (5600 million points; an 80 GB.rcp file in size) and (b) the cleaned, subsampled at 10 mm point distance, and unified point cloud (104 million points; a 2.2 GB.rcp file in size).


Table 1.
Databases and keywords used for the search.
| Database | Keywords (Code) |
|---|---|
| Scopus | (TITLE-ABS-KEY (“HBIM” OR “Historic*BIM” OR “Heritage*BIM” OR “Historical*BIM” OR “Historic*Building Information Model* OR “Heritage*Building Information Model*” OR “Historical*Building Information Model*”) AND TITLE-ABS-KEY(“LiDAR” OR “laser” OR “TLS” OR “scan”)) |
| Web of Science (WOS) | ALL = (“HBIM” OR “Historic*BIM” OR “Heritage*BIM” OR “Historical*BIM” OR “Historic*Building Information Model*” OR “Heritage*Building Information Model*” OR “Historical*Building Information Model*”)) AND ALL = ((“HBIM” OR “Historic*BIM” OR “Heritage*BIM” OR “Historical*BIM” OR “Historic*Building Information Model*” OR “Heritage*Building Information Model*” OR “Historical*Building Information Model*”)) AND ALL = ((“LiDAR” OR “laser” OR “TLS” OR “scan”)) |
* This symbol, or asterisk, is used as a wildcard in the search databases to represent any number of characters in a search term, allowing results containing various word forms or spellings with a single query.
Table 2.
Criteria applied for shortlisting articles.
| Criteria | Details |
|---|---|
| Year of publication | From 2012 to 2022 |
| Language | English |
| Subject areas | Computer science, social sciences, engineering, arts, and humanities |
| Source types | Only peer-reviewed journal papers |
Table 3.
A list of 12 “merged” keywords that share the same meaning.
| Common Keyword | Alternatives |
|---|---|
| 3D Modelling | 3D Modeling; 3 Dimensional Modelling, 3 Dimensional Modeling; 3-Dimensional Modelling, 3-Dimensional Modeling |
| Architectural Heritage | Built Heritage |
| BIM | Building Information Modeling, Building Information Modelling, Building Information Model, HBIM (Historical Building Modelling), BIMs |
| HBIM | Heritage BIM, Historic BIM, Historical BIM, H-BIM, Heritage-BIM, hBIM |
| Heritage Building | Heritage Building, Heritage Buildings, Historic Building, Historical Building |
| Laser Scanning | Laser Scan, Laser Scanners, Laser Scanner, 3D Laser Scanning, LiDAR Scanning, Laser Scans |
| Modelling | Modeling |
| Point Cloud | Point Clouds, Point-Clouds, LiDAR Clouds, LiDAR Cloud, Cloud Point, Point Cloud Data |
| Scan-to-BIM | Scan-to-BIM, scan to BIM, Point Cloud-to-BIM |
| TLS | Terrestrial Laser Scanner, Terrestrial Laser Scanning, Terrestrial Laser Scanners |
| UAV | UAV, UAV (UAV), Drones, Drone, Unmanned Aerial Vehicles, Unmanned Aerial Vehicle |
| VR | Virtual Reality |
Table 4.
Limitations and challenges of TLS mentioned in the selected articles for this study.
| Category | Limitations or Challenges of TLS | Articles |
|---|---|---|
| Data Acqusition | Limited range of TLS: most roofs and upper building facades were out of range of TLS. Other RC technologies, such as UAVs, had to be used to compensate. | [12,44,51,52,53,54,55,56,57] |
| Poor results of capturing colors with the camera mounted on the scanner in varying lighting conditions are due to time gaps between the successive scans. | [12,58] | |
| The distance from the scanner to the scanned object greatly influences the quality of the captured point cloud. | [58] | |
| Scanners were used in dangerous areas. | [59] | |
| Maintain the stability of the scaffolding that was set up for scanning. | [59] | |
| It is impossible to perform a static laser scanning acquisition in some areas due to safety issues. Therefore, a handheld Mobile Mapping System (MMS) was used to capture those areas. | [59] | |
| Lack of capability to capture images using the scanner. | [60] | |
| Had to dismantle the building to scan the bracket set with hidden geometry. | [61] | |
| Data Processing | Combine multiple point cloud datasets created from different approaches (e.g., TLS and aerial photogrammetry) into one single point cloud. | [12,44,46,48,52,53,54,57] |
| Number of software applications required to process the scan data | [22,50,57,62,63,64] | |
| Processing TLS scans is time-consuming. | [22,65] | |
| Incorporation of TLS scans from two separate campaigns that were 10 years apart. | [66] |
Table 5.
Information on data acquisition techniques and scan data processing of the HBIM projects in the included publications.
Table 5.
Information on data acquisition techniques and scan data processing of the HBIM projects in the included publications.
| (a) TLS Scanner Brands | (d) Control Reference | (e) Other RC Technologies Used for Data Acquisition | (f) Scan Processing Software | (g) # of Points Captured (million) | ||||||||||||||||
|---|---|---|---|---|---|---|---|---|---|---|---|---|---|---|---|---|---|---|---|---|
| Article | Country of Heritage Site | Year of Survey | FARO | Leica | Trimble | Other | (b) TLS Coverage | (c) # of Scans | GCP | Target | SfM | UAV | T.S. | GPS | Other | FARO SCENE | Leica Cyclone | Autodesk ReCap | Other | |
| [44] | Italy | 2012 and 2017 | ✓ | Ext. and Int. | 58 | ✓ | ✓ | ✓ | 3DReshaper | |||||||||||
| [47] | Jordan | ✓ | 11 | ✓ | ✓ | ✓ | ||||||||||||||
| [48] a | Saudi Arabia | ✓ | 123 | ✓ | ✓ | ✓ | ✓ | ✓ | 10,600 | |||||||||||
| [12] b | Saudi Arabia | ✓ | ✓ | ✓ | ✓ | ✓ | ✓ | ✓ | ||||||||||||
| [73] | Spain | 2019 | ✓ | Ext. and Int. | 7 | ✓ | ||||||||||||||
| [74] | Spain | 2016 | ✓ | ✓ | ||||||||||||||||
| [58] | Spain | 2021 | ✓ | ✓ | ✓ | |||||||||||||||
| [75] | Saudi Arabia | ✓ | Ext. and Int. | 100+ | ✓ | ✓ | ✓ | ✓ | ||||||||||||
| [56] | Italy | ✓ | ✓ | |||||||||||||||||
| [62] | Italy | ✓ | ✓ | ✓ | ||||||||||||||||
| [59] | Italy | 2020 | ✓ | Ext. and Int. | 65 | ✓ | ✓ | Handheld scanner | ||||||||||||
| [51] | Italy | ✓ | 213 | ✓ | ✓ | ✓ | ✓ | |||||||||||||
| [22] | Italy | 2021 | ✓ | Ext. and Int. | ✓ | ✓ | ✓ | ✓ | ✓ | ✓ | ||||||||||
| [65] | Italy | 2019 | ✓ | ✓ | ||||||||||||||||
| [76] a | Italy | ✓ | ||||||||||||||||||
| [77] b | Italy | ✓ | 182 | ✓ | ✓ | |||||||||||||||
| [78] | ||||||||||||||||||||
| [52] | Italy | 2021 | Ext. and Int. | 47 | ✓ | ✓ | ✓ | ✓ | ✓ | |||||||||||
| [64] | Italy | 2018 | ✓ | Ext. | 3 | ✓ | ✓ | 3D Zephyr | ||||||||||||
| [79] | Italy | 2020 | ✓ | ✓ | ✓ | ✓ | ||||||||||||||
| [72] | Brazil | 2016 | ✓ | ✓ | ✓ | |||||||||||||||
| [53] | Spain | 2019 | ✓ | Ext | 107 | ✓ | ✓ | ✓ | ✓ | ✓ | ✓ | ✓ | 182 | |||||||
| [45] | Spain | 2019 | ✓ | Ext. and Int. | 108 | ✓ | ✓ | ✓ | ✓ | ✓ | 214 | |||||||||
| [69] | Poland | 2017 | ✓ | Ext. and Int. | 7 | ✓ | ||||||||||||||
| [66] | Portugal | 2021 | ✓ | 3 | ✓ | Three-dimensional photo, Ground Penerating Radar (GPR); X-ray and SEM + EDX tests | 1345 | |||||||||||||
| [80] | Italy | 2018 | ✓ | Ext. | ✓ | ✓ | ✓ | |||||||||||||
| [81] | China | 2019 | ✓ | Ext. | 35 | ✓ | ✓ | ✓ | ✓ | Trimble Realwoks | ||||||||||
| [41] | Spain | 2020 | ✓ | Ext. | ✓ | ✓ | Thermal images | ✓ | PolyWorks | |||||||||||
| [14] | Egypt | 2019 | Z + F IMAGER | 160 | ✓ | ✓ | ||||||||||||||
| [54] | Portugal | 2019 | ✓ | Ext. and Int. | 95 | ✓ | ✓ | ✓ | ✓ | |||||||||||
| [49] | Italy | 2019 | ✓ | Ext. and Int. | 69 | ✓ | ✓ | ✓ | 1200 | |||||||||||
| [50] | Italy | 2019 | ✓ | Ext. and Int. | 64 | ✓ | 1014 | |||||||||||||
| [71] | Portugal | 2019 | ✓ | Ext. and Int. | 8 | ✓ | CloudCompare | |||||||||||||
| [42] a | Spain | |||||||||||||||||||
| [35] b | Spain | ✓ | Ext. and Int. | 15 | ✓ | ✓ | ✓ | ✓ | 103 | |||||||||||
| [82] | Spain | 2018 | ✓ | ✓ | ||||||||||||||||
| [40] c | ||||||||||||||||||||
| [5] | ||||||||||||||||||||
| [83] | Italy | 2018 | ✓ | Ext. and Int. | 256 | ✓ | 3D photo, wearable laser scanner | |||||||||||||
| [63] | Vietnam | 2021 | ✓ | Ext. and Int. | 162 | ✓ | Trimble Realwoks | |||||||||||||
| [84] | Spain | 2018 | ✓ | Ext. and Int. | ||||||||||||||||
| [85] | Spain | ✓ | ||||||||||||||||||
| [46] | Slovakia | ✓ | Ext. and Int. | 141 | ✓ | ✓ | ✓ | ✓ | ||||||||||||
| [57] | Italy | ✓ | Ext. | 3 | ✓ | 3DF Zephyr | ||||||||||||||
| [70] | Italy | 2020 | ✓ | 3 | ✓ | ✓ | ||||||||||||||
| [6] | Spain | 2018 | ✓ | Ext. and Int. | 99 | ✓ | ✓ | ✓ | ||||||||||||
| [43] | ||||||||||||||||||||
| [68] | Portugal | 2019 | ✓ | Ext. and Int. | 144 | ✓ | ✓ | ✓ | ✓ | GPS | ✓ | ✓ | ||||||||
| [86] | Spain | 2016 | ✓ | Ext. and Int. | 27 | ✓ | ✓ | ✓ | GPS | ✓ | 3DReshaper | |||||||||
| [55] | France | 2015 | ✓ | Ext. and Int. | 40 | ✓ | ✓ | 3DReshaper | 839 | |||||||||||
| [87] | Italy | 2017 | ✓ | Ext. and Int. | 14 | |||||||||||||||
| [60] | Cyprus | Surphased | Ext. and Int. | 73 | ✓ | ✓ | JRC Reconstructor | 2080 | ||||||||||||
| [88] | Portugal | 10 | CloudCompare | |||||||||||||||||
| [89] | Poland | 2016 | Z + F IMAGER | Ext. and Int. | 36 | ✓ | ✓ | |||||||||||||
| [90] | China | 2021 | ✓ | Ext. and Int. | 25 | ✓ | ✓ | ✓ | ✓ | |||||||||||
| [91] | Italy | 2020 | Ext and Int | 24 | ✓ | ✓ | ✓ | |||||||||||||
| [61] | S. Korea | Handheld scanner | ✓ | |||||||||||||||||
| [92] | Algeria | 2020 | ✓ | Ext. and Int. | 188 | ✓ | ✓ | ✓ | ||||||||||||
Disclaimer/Publisher’s Note: The statements, opinions and data contained in all publications are solely those of the individual author(s) and contributor(s) and not of MDPI and/or the editor(s). MDPI and/or the editor(s) disclaim responsibility for any injury to people or property resulting from any ideas, methods, instructions or products referred to in the content. |
© 2023 by the authors. Licensee MDPI, Basel, Switzerland. This article is an open access article distributed under the terms and conditions of the Creative Commons Attribution (CC BY) license (https://creativecommons.org/licenses/by/4.0/).
Share and Cite
MDPI and ACS Style
Liu, J.; Azhar, S.; Willkens, D.; Li, B. Static Terrestrial Laser Scanning (TLS) for Heritage Building Information Modeling (HBIM): A Systematic Review. Virtual Worlds 2023, 2, 90-114. https://doi.org/10.3390/virtualworlds2020006
AMA Style
Liu J, Azhar S, Willkens D, Li B. Static Terrestrial Laser Scanning (TLS) for Heritage Building Information Modeling (HBIM): A Systematic Review. Virtual Worlds. 2023; 2(2):90-114. https://doi.org/10.3390/virtualworlds2020006
Chicago/Turabian StyleLiu, Junshan, Salman Azhar, Danielle Willkens, and Botao Li. 2023. "Static Terrestrial Laser Scanning (TLS) for Heritage Building Information Modeling (HBIM): A Systematic Review" Virtual Worlds 2, no. 2: 90-114. https://doi.org/10.3390/virtualworlds2020006