
Tissue Microarray Lipidomic Imaging Mass Spectrometry Method: Application to the Study of Alcohol-Related White Matter Neurodegeneration
Abstract
:1. Introduction
1.1. White Matter Pathology in Neurodegeneration
1.2. Alterations in Myelin Lipid Composition with Disease
1.3. Strategy for Increasing Knowledge of Disease-Specific WM Pathology
1.4. Benefits of Tissue Microarrays in Research
2. Materials and Methods
2.1. Overview
2.2. Experimental Model
2.3. TMA Generation
2.3.1. Overview
2.3.2. Selection of the Embedding Compound
- Tissue-Plus Optimal Cutting Temperature embedding compound (Tissue-Tek O.C.T.) from Sakura Finetek USA Inc., Torrance, CA, USA, was purchased and used according to the manufacturer’s instructions.
- Two percent carboxymethylcellulose (CMC) gel was prepared by dissolving high-viscosity carboxymethlycellulose sodium salt (Sigma-Aldrich, St. Louis, MO, USA) in sterile, deionized water and storing the product at 4 °C for up to 2 weeks.
- Modified O.C.T. (mOCT) was prepared as described [45]. In brief, polyvinyl alcohol (PVA) 6–98 (10 g) was heat-solubilized in Hank’s Balanced Salt Solution (HBSS; 100 mL), and after cooling to room temperature, polypropylene glycol (PPG) 2000 (8 mL) and sodium azide (100 mg) were added and vortex-mixed to form a thin milky white gel. The mOCT was stored at room temperature for up to 3 months and vortex mixed just prior to each use.
- Gelatin (10–15%) is the fourth potential embedding compound that ultimately was not tested for this study [46,47,48] due to very low signals obtained with WM tissue, as previously reported [46]. Unfortunately, the gelatin problem could not be resolved because it would have been impracticable to precisely peel the embedding compound away from the TMA cores.
2.3.3. Tissue Sample Preparation for MALDI-IMS Lipidomic Studies
- Only fresh-frozen or formalin-fixed tissues are suitable.
- Paraffin-embedded samples are unsuitable because alcohol-containing solvents used for tissue processing destroy and solubilize lipids.
- For sample testing, 3 mm-diameter fresh-frozen or formalin-fixed frontal lobe WM tissue cores from adult Long Evans rats (2 control and 2 alcohol-fed) were embedded in O.C.T., CMC, or mOCT.
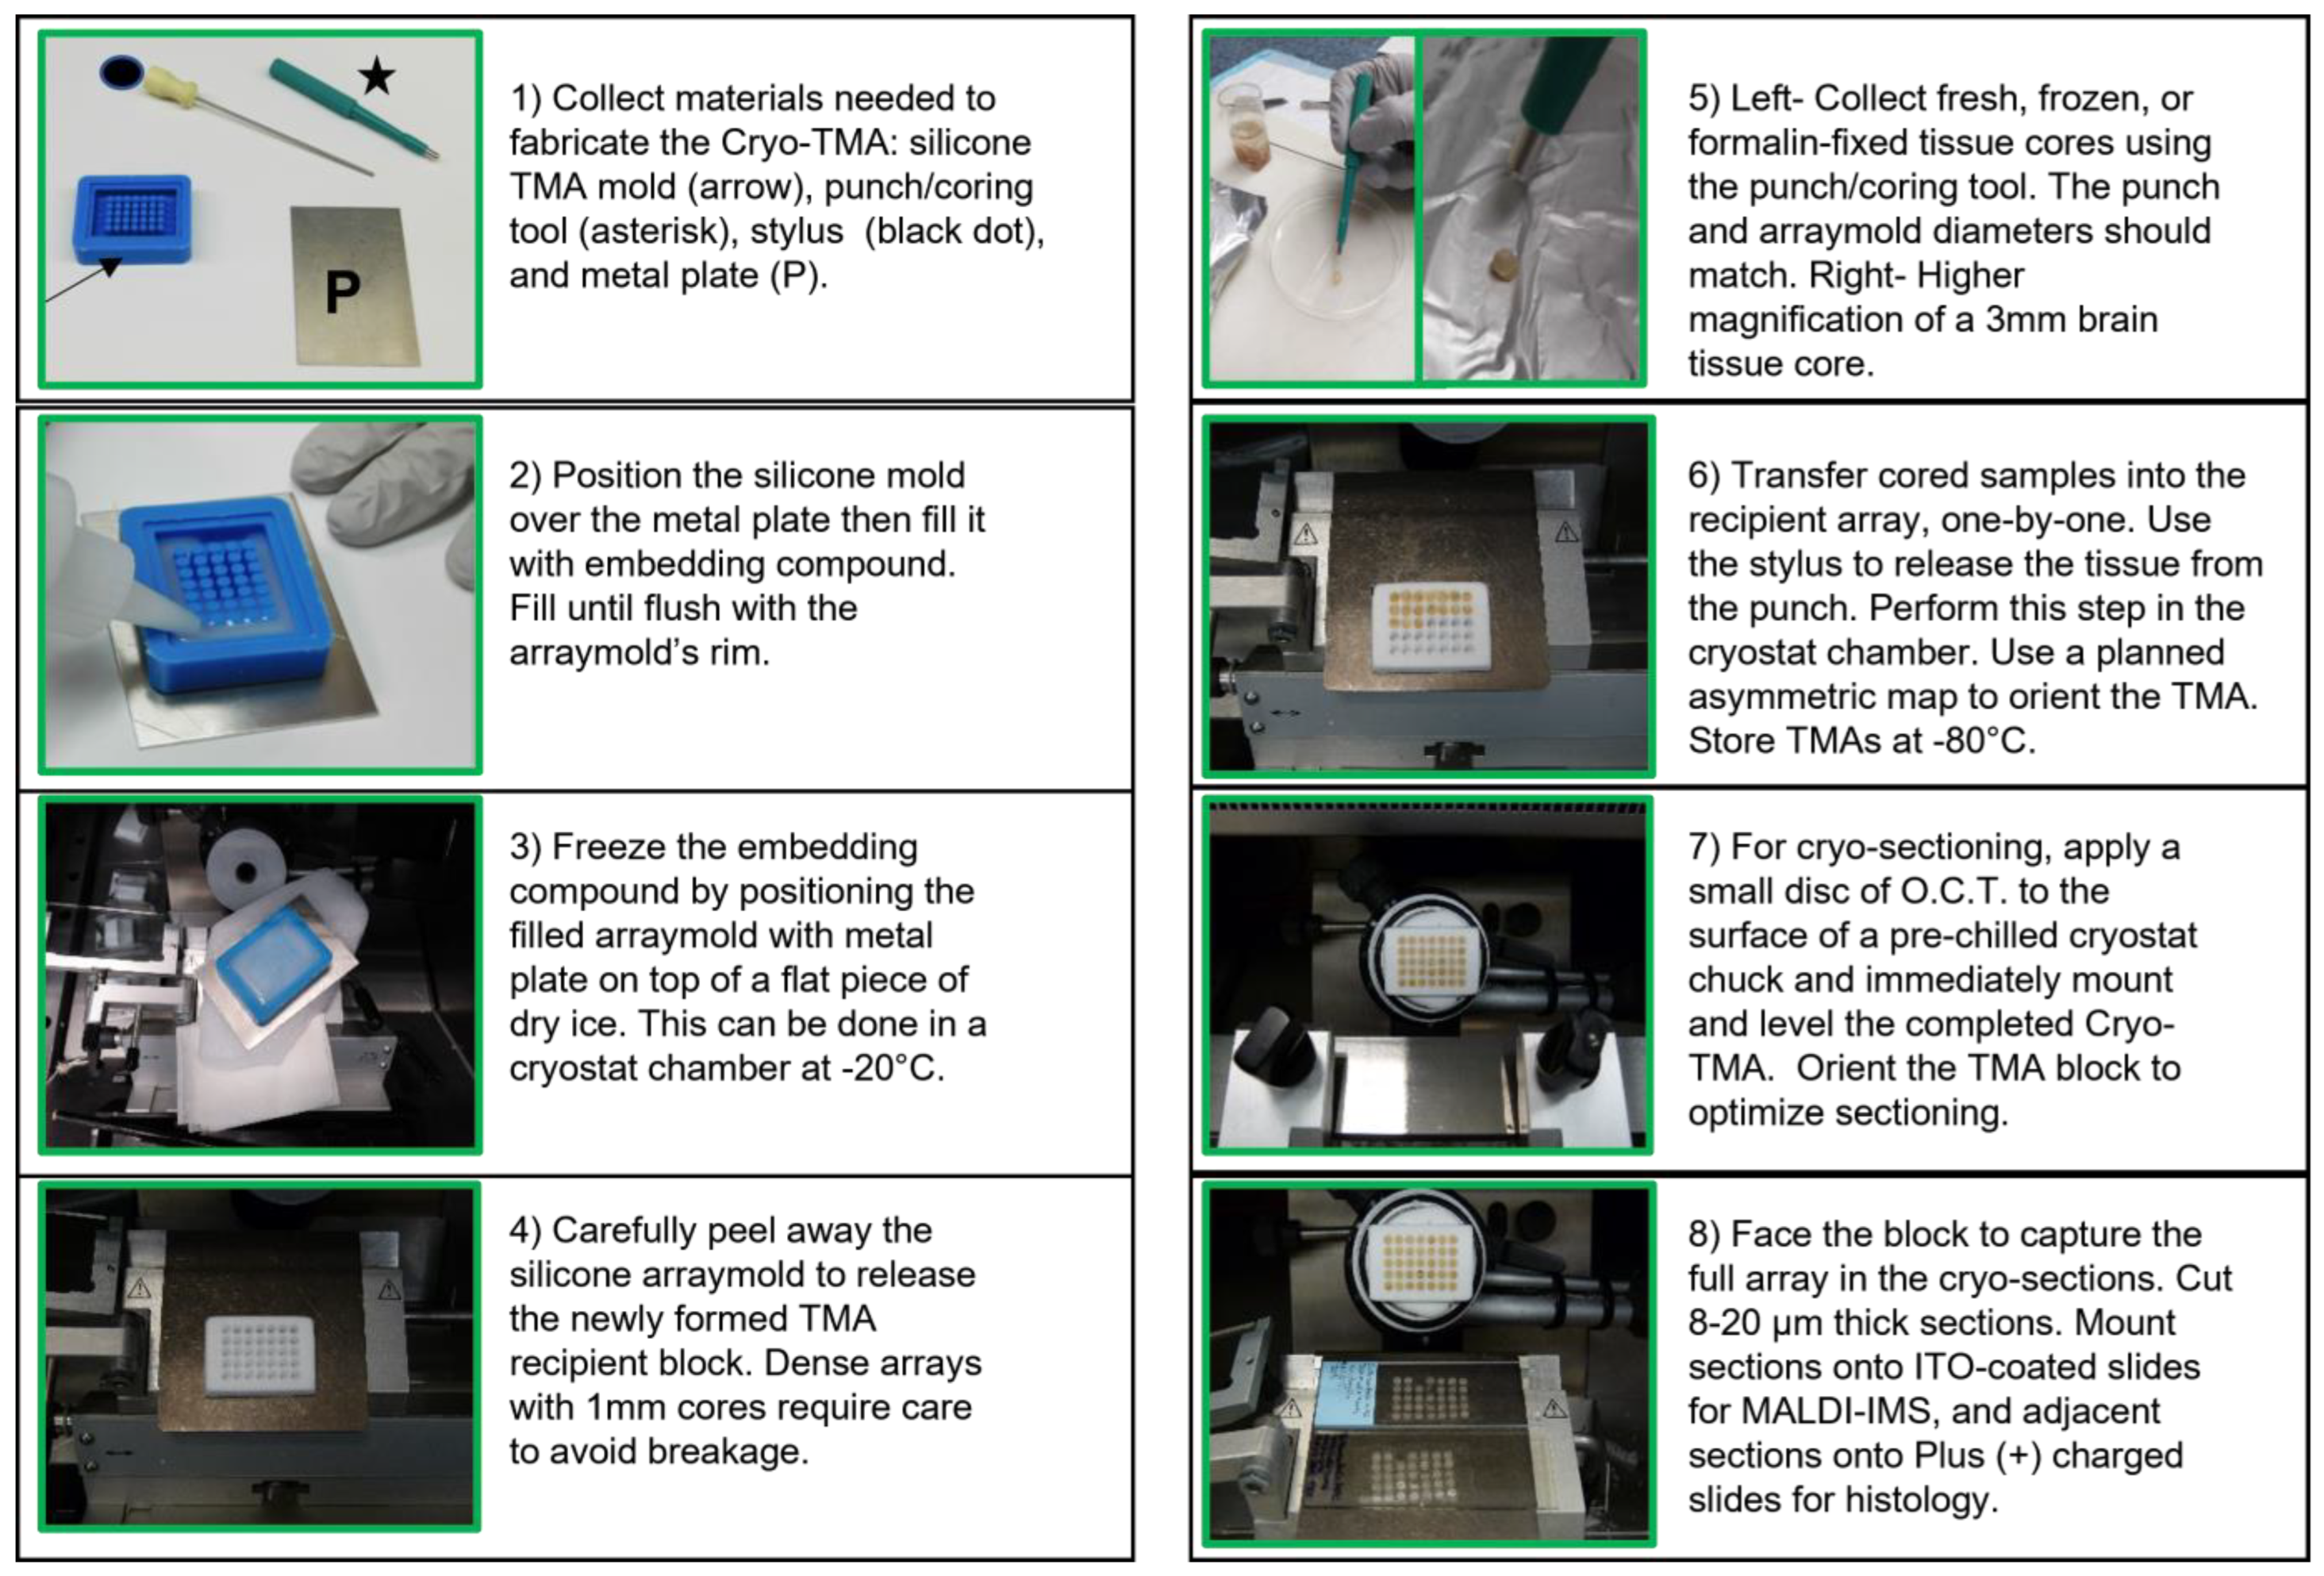
2.3.4. TMA Construction
- (1)
- Generating TMA recipient blocks:
- (a)
- Plan the array.
- Select a validated and reproducible system for making TMA recipient blocks.
- We used reusable silicone molds from Arraymold (Salt Lake City, UT, USA).
- Decide on the number of samples to be included and core diameter requirements for the TMA.
- Arraymold recipient block template configurations: 1 mm cores = 170 samples; 1.5 mm cores = 150 samples; 2 mm cores = 70 samples; 3 mm cores = 40 samples; 4 mm cores = 15 samples; 5 mm cores = 15 samples.
- Plan to include either fresh-frozen or formalin-fixed tissue in a single TMA.
- Different tissue preparations can impact MALDI-IMS signal intensities.
- Large differences in MALDI-IMS signal intensities significantly distort results.
- Construct an asymmetric grid map to designate sample core insertion sites. Asymmetric mapping:
- Establishes orientation of the TMAs.
- Designates sample addresses to prevent misidentification at later analytical stages.
- (b)
- Evenly distribute the embedding compound across the mold, then allow the compound to solidify in a cryostat chamber set to −20 °C.
- For this protocol, we used a Leica CM 3050 cryostat microtome (Leica Biosystems, Wetzlar, Germany).
- (c)
- Carefully release the frozen recipient block by peeling off the silicone mold.
- (d)
- Store the recipient block at −80 °C in an air-tight container for up to 3 months. Commercial air-tight laboratory plastic containers were used to store TMA slides organized and held in molded plastic cork-lined slide storage boxes that were further sealed in plastic bags.
- (2)
- Sample preparation and coring:
- (a)
- Keep samples in their original cassettes at least until the tissue cores have been harvested and transferred to the recipient block.
- (b)
- Select a 1 mm to 5 mm diameter re-usable Arraymold coring tool or a disposable surgical biopsy punch that corresponds to the recipient block.
- Match the Arraymold coring tool size to the commercial Arraymold to enable snug fitting of the specimens and minimize gaps.
- (c)
- For fresh-frozen tissue, retrieve samples from the −80 °C freezer and equilibrate for 15–30 min in a −20 °C cryostat chamber.
- (d)
- For formalin-fixed tissue, prepare samples 2 or 3 days in advance by thoroughly rinsing them (in their original cassettes) in phosphate buffered saline (PBS) at 4 °C for 48 h with gentle platform agitation.
- (3)
- Assembling the TMA:
- (a)
- Transfer the recipient block from the −80 °C freezer to the cryostat chamber (−20 °C) and equilibrate for 15–30 min before use.
- Keep the recipient block in the cryostat chamber until all cored samples have been transferred.
- (b)
- According to the grid map, fill designated blank wells with embedding compound only.
- (c)
- For fresh-frozen samples, just prior to generating the cores, semi-thaw the tissue slices, on a bed of wet ice, one by one. Use aluminum foil to separate tissue from wet ice.
- Obtain the core (gentle pressure may be required) and immediately transfer it to the recipient block taking care to avoid thawing.
- Use a cryostat-chilled metal spatula to tap the core flush with the recipient block’s surface.
- (d)
- For formalin-fixed samples, blot the tissue dry with lint-free laboratory grade paper wipes.
- Obtain the core and immediately transfer it to the recipient block.
- Alternatively, core the tissue and momentarily leave it in place but slightly elevated above the surrounding tissue to apply a unique Microdot (1 µL) orientation pattern to the sample edges using surgical biopsy ink (MarginMarker; Vector Surgical, Waukesha, WI, USA) [33], and then transfer it to the recipient block.
- Use gentle tapping with a pre-chilled metal spatula to fully insert the core.
- (e)
- To control for reproducibility of the results, include duplicate or triplicate samples spatially dispersed across the TMA.
- (f)
- Carefully fill gaps between tissue cores and well walls with supplemental embedding compound, particularly if the frozen cores fragment.
- (g)
- Apply a smooth flat skim coat of embedding compound across the entire surface of the TMA.
- (h)
- Place the completed TMA in a labeled Tissue-Tek cassette and store in an air-tight container at −80 °C for up to 3 months.
2.4. TMA Sectioning and Slide Preparation for MALDI-IMS
- Equilibrate the frozen TMA (stored at −80 °C) to −18 °C in a cryostat microtome chamber for 20–30 min prior to sectioning.
- Mount the block onto a cryostat chuck to optimize sectioning of the full TMA, including all tissue cores.
- Section the TMA at a thickness between 8 µm and 20 µm using a clean, fresh disposable blade for each TMA.
- Generate two to four sets of 4 TMA sections.
- Use the first 3 adjacent sections/set for MALDI-IMS and the fourth for histologic staining.
- Label and number each slide in the order of sectioning. Label with a pencil or permanent marking pen.
- For MALDI-IMS, thaw-mount the cryosections onto indium tin oxide (ITO)-coated slides (Delta Technologies, Loveland, CO, USA).
- Desiccate the slides designated for MALDI-IMS at room temperature in a sealed chamber, and then, either store them in an air-tight container at −80 °C for up to 3 months or immediately proceed with sample sublimation.
- For histology co-registration with images acquired through MALDI-IMS, thaw-mount cryosections onto Plus-charged glass slides (Thermo Fisher Scientific, Plainville, MA, USA) and air-dry. Either store in an air-tight container (up to 3 months) or immediately proceed with staining protocol below.
- Fix tissue sections in 10% neutral buffered formalin.
- Rinse several times (10–15 dips) in distilled water.
- Stain with Gil’s Hematoxylin (Thermo Fisher Scientific, Plainville, MA, USA) according to the manufacturer’s instructions.
- Dehydrate tissue sections in graded ethanol solutions (50%, 70%, 95%, 95%, 100%, 100%) for 30 s each, clear in two changes of xylenes (30 s each), and then, preserve under coverglass with Per Mount mounting medium (MilliporeSigma, Burlington, MA, USA) or a comparable product. Store the stained slides at room temperature in a dust-free slide box/holder.
- Scan the slides to generate 3600 DPI resolution images (Epson’s Perfection V850 Scanner, Los Alamitos CA, USA) just prior to MALDI-IMS data acquisition.
2.5. Matrix Application
- Equilibrate stored frozen TMA slides to room temperature.
- Rinse in aqueous buffer, such as 50 mM ammonium formate (pH 6.4), to increase lipid ion signal intensities [49].
- Vacuum-dry slides for 30 min to promote tissue adhesion to slides.
- Sublime the slides with a suitable matrix using a commercial apparatus, such as that from Chemglass Life Sciences (Vineland, NJ, USA).
- Choose a matrix appropriate for negative (NIM) and/or positive ion mode (PIM) imaging.
- NIM imaging is optimum for detecting most phospholipids and sulfatides.
- PIM imaging is most suited for detecting ceramides, sphingomyelin, phosphatidylcholine, and cholesterol.
- After sublimation, add external mass-calibration standards (Peptide Calibration Standard II, Bruker Daltonics, Bremen, Germany) by depositing 1 μL of a standard peptide mixture with 15 mg/mL α-cyano-4-hydroxycinnamic acid (HCCA) as a matrix, as recommended by the manufacturer.
- The mass range is from 377 Da to 2463 Da.
- Enables mass accuracy determinations for phospholipids and sphingolipids.
2.6. MALDI-IMS
- TMA slides sublimed with DHB as the matrix were imaged in the negative and positive ion modes using a reflectron geometry MALDI-time-of-flight (TOF)/TOF mass spectrometer (Ultraflextreme, Bruker Daltonics, Bremen, Germany).
- Regions of interest were selected based on co-registration with adjacent hematoxylin-stained slides.
- Data sequence preparation, normalization to total ion counts, and visualization were carried out using FlexImaging software (v 4.0, Bruker Daltonics, Bremen, Germany).
- Data processing, which included normalization, baseline correction, peak defining, and recalibration, was performed with ClinProTools v3.0 (Bruker Daltonics, Bremen, Germany).
- Signals corresponding to specific m/z values were visualized using pseudo-colored intensities.
- Statistical analysis, including Principal Component Analysis (PCA), was carried out using ClinProTools v3.0 (Bruker Daltonics, Bremen, Germany).
- NIM lipid identification was accomplished through a comparison of precursor and product ion m/z values with corresponding data in the LIPID MAPS prediction tools database (https://www.lipidmaps.org/tools/structuredrawing/GP_p_form.php, accessed on 8 December 2022).
- Using tandem mass spectrometry (MS/MS), analytes were fragmented, and their product ions were collected in the MS/MS spectra.
- The parent ion and all fragments were used to search the LIPID MAPS database and assign structure/identity.
- PIM lipid identification was more challenging due to the presence of multiple adducts (H+, Na+, K+, etc.), resulting in complex spectra. Structural identification was often difficult with TOF since the same ion could appear as multiple adducts. For these studies, we did not perform MS/MS to definitively identify ambiguous lipids detected in the PIM. Instead, tentative assignments were made using the literature where the same m/z was detected under similar conditions [52,53,54,55,59,60,61,62,63].
- The Rapid Peak Alignment Method (RPAM) [64] was used to simultaneously process the MALDI data across the TMA.
- In brief, RPAM replaces manual peak alignments and reduces the data processing time for 24 samples from 10 or more hours to approximately 90 min [64].
- RPAM data can be transferred to statistical packages for analysis.
- The RPAM algorithm greatly facilitates intra- and inter-group comparisons of lipid ion expression and abundance [64].
2.7. Statistical Analyses and Graphics
- Data were exported to Excel for re-organization.
- Excel was used to generate data bar plots for illustrating inter-group percentage differences in lipid expression.
- Graphpad Prism 9 (San Diego, CA, USA) and Number Cruncher Statistical Systems (NCSS) (Kaysville, UT, USA) software were used to generate graphs and analyze data with Student T and Wilcoxon Signed Rank tests. Results were corrected for a 5% false discovery rate (FDR).
3. Results
3.1. Embedding Compound Qualitative Differences
- mOCT produced very low background signals and exhibited ample firmness for reproducible cryostat sectioning.
- The commercial OCT embedding compound was unsuitable for MALDI-IMS lipidomics due to high background signals. Although this limitation was known [46], commercial OCT was tested to provide evidence of its unsuitability for lipidomics and definitively discourage its use despite ready availability.
- Two percent CMC produced very low background noise but proved too soft to generate consistent replicate and flat cryo-sections of brain TMAs.
- We also tested 4% CMC, which produced very low background signals but was unsuitable for TMAs due to extreme brittleness, particularly for brain tissue sectioning.
Conclusions
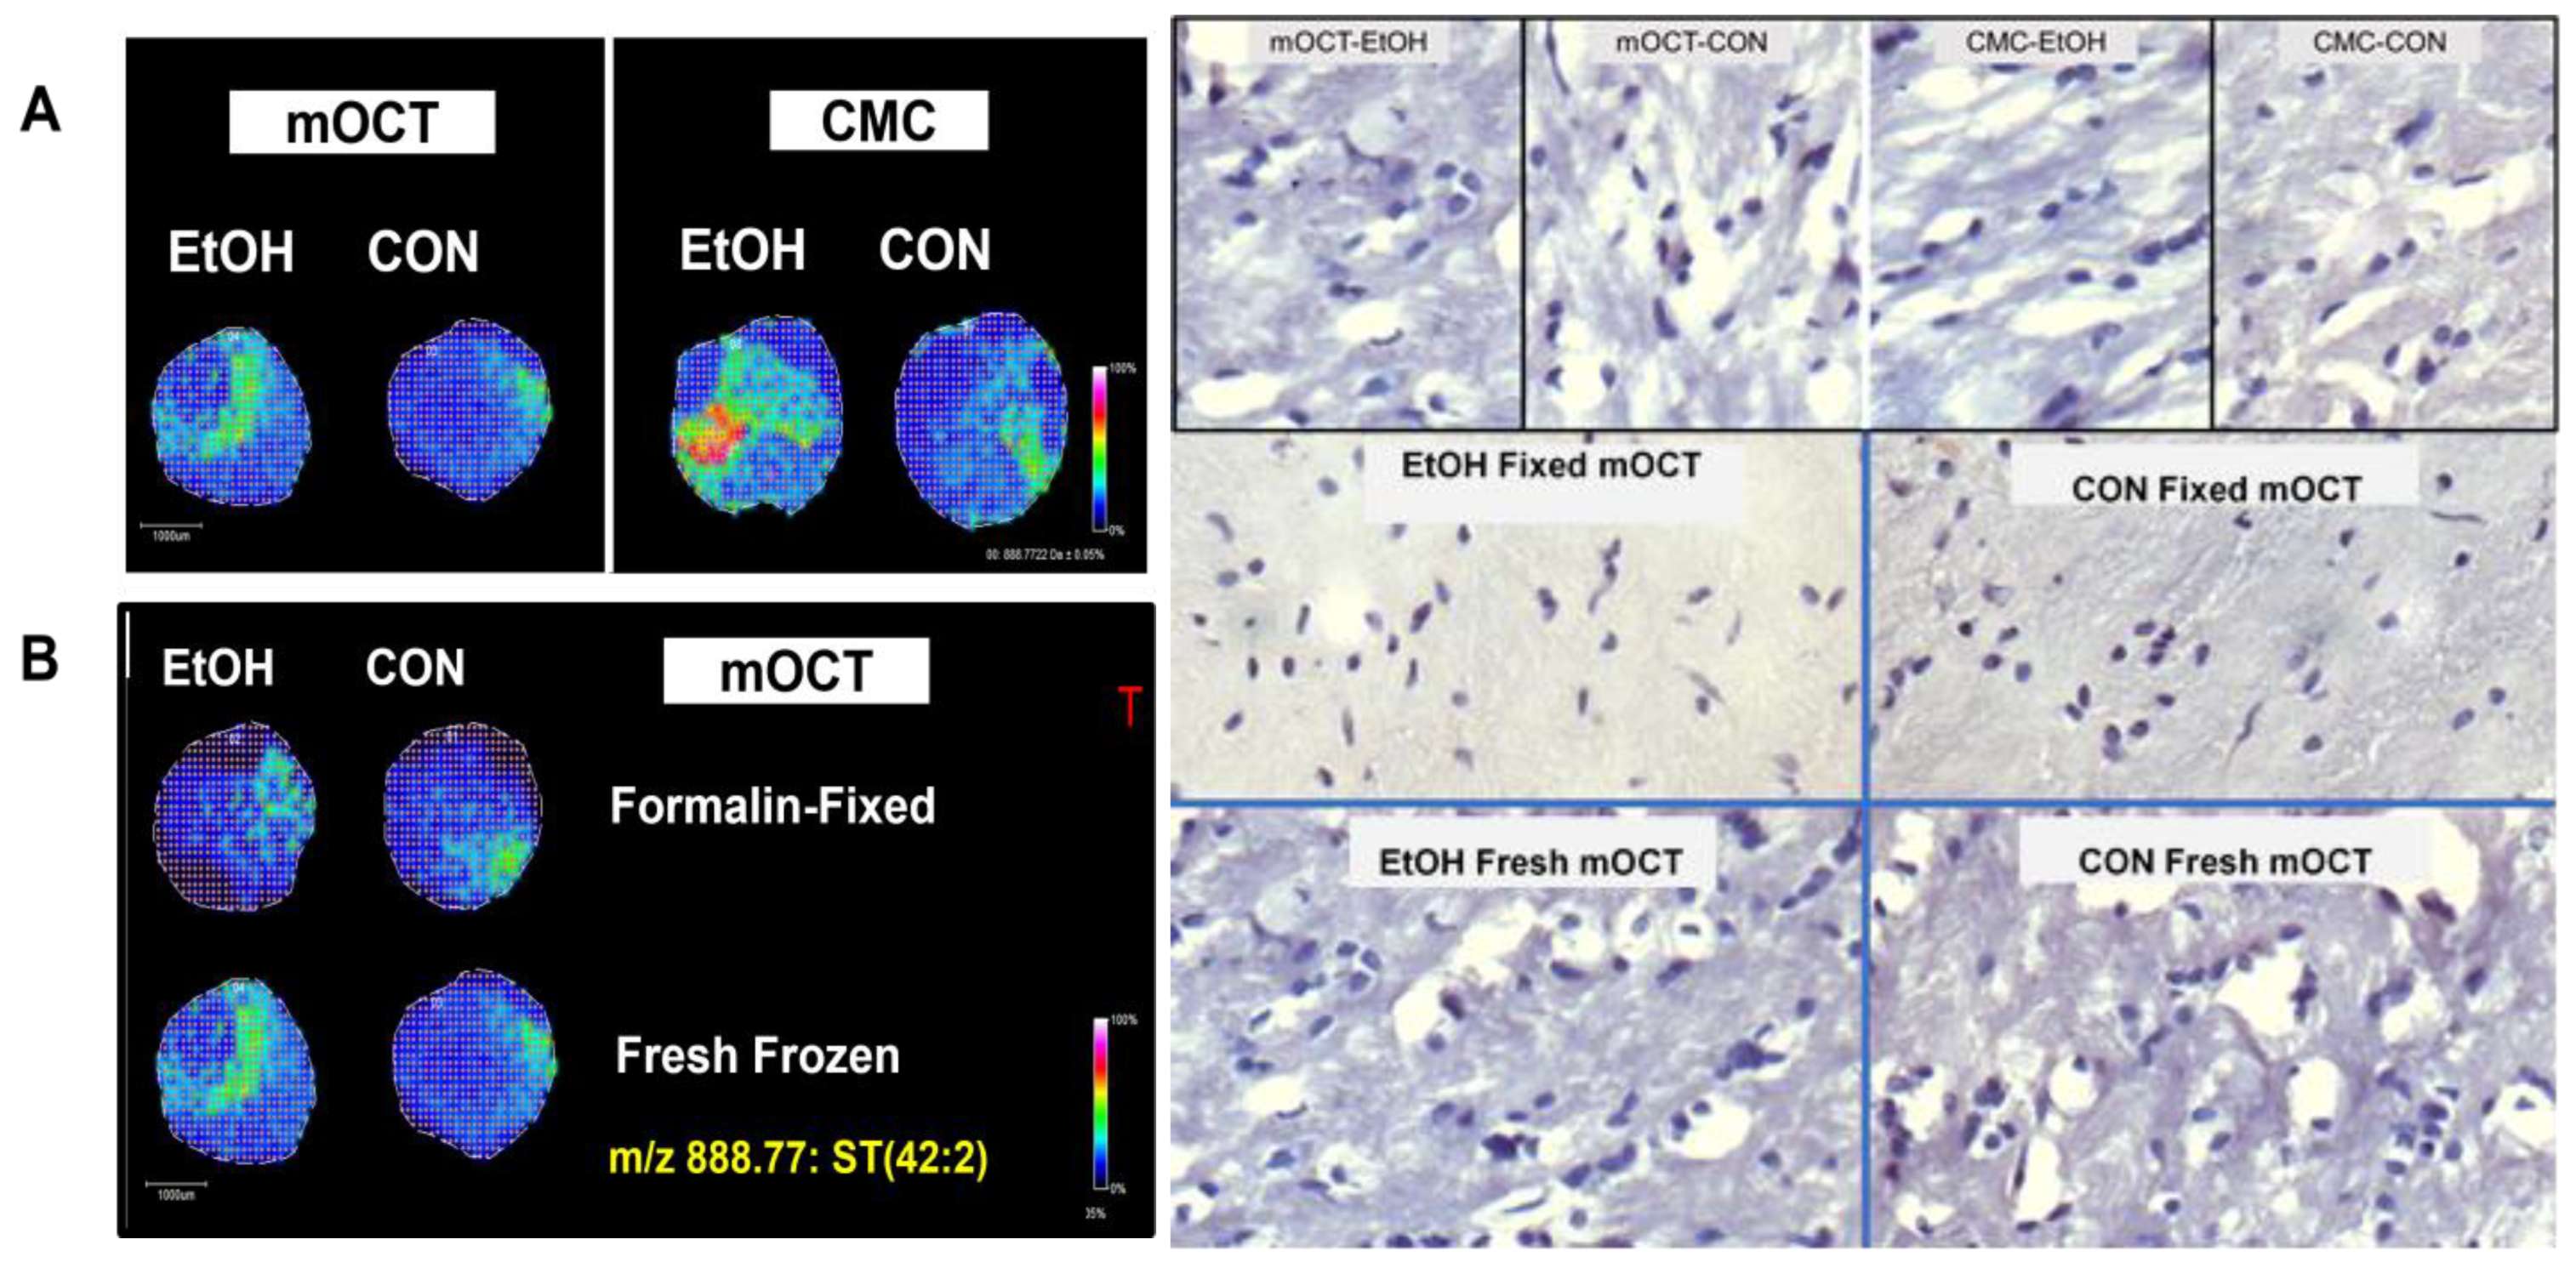
3.2. Effects of Embedding Compound on Disease Characterization with Fresh Frozen Tissue TMAs (Figure 2)
- Paired control and ethanol rat frontal lobe WM cores (3 mm) were embedded in mOCT and 2% CMC (hybrid recipient block—see Figure 2 legend).
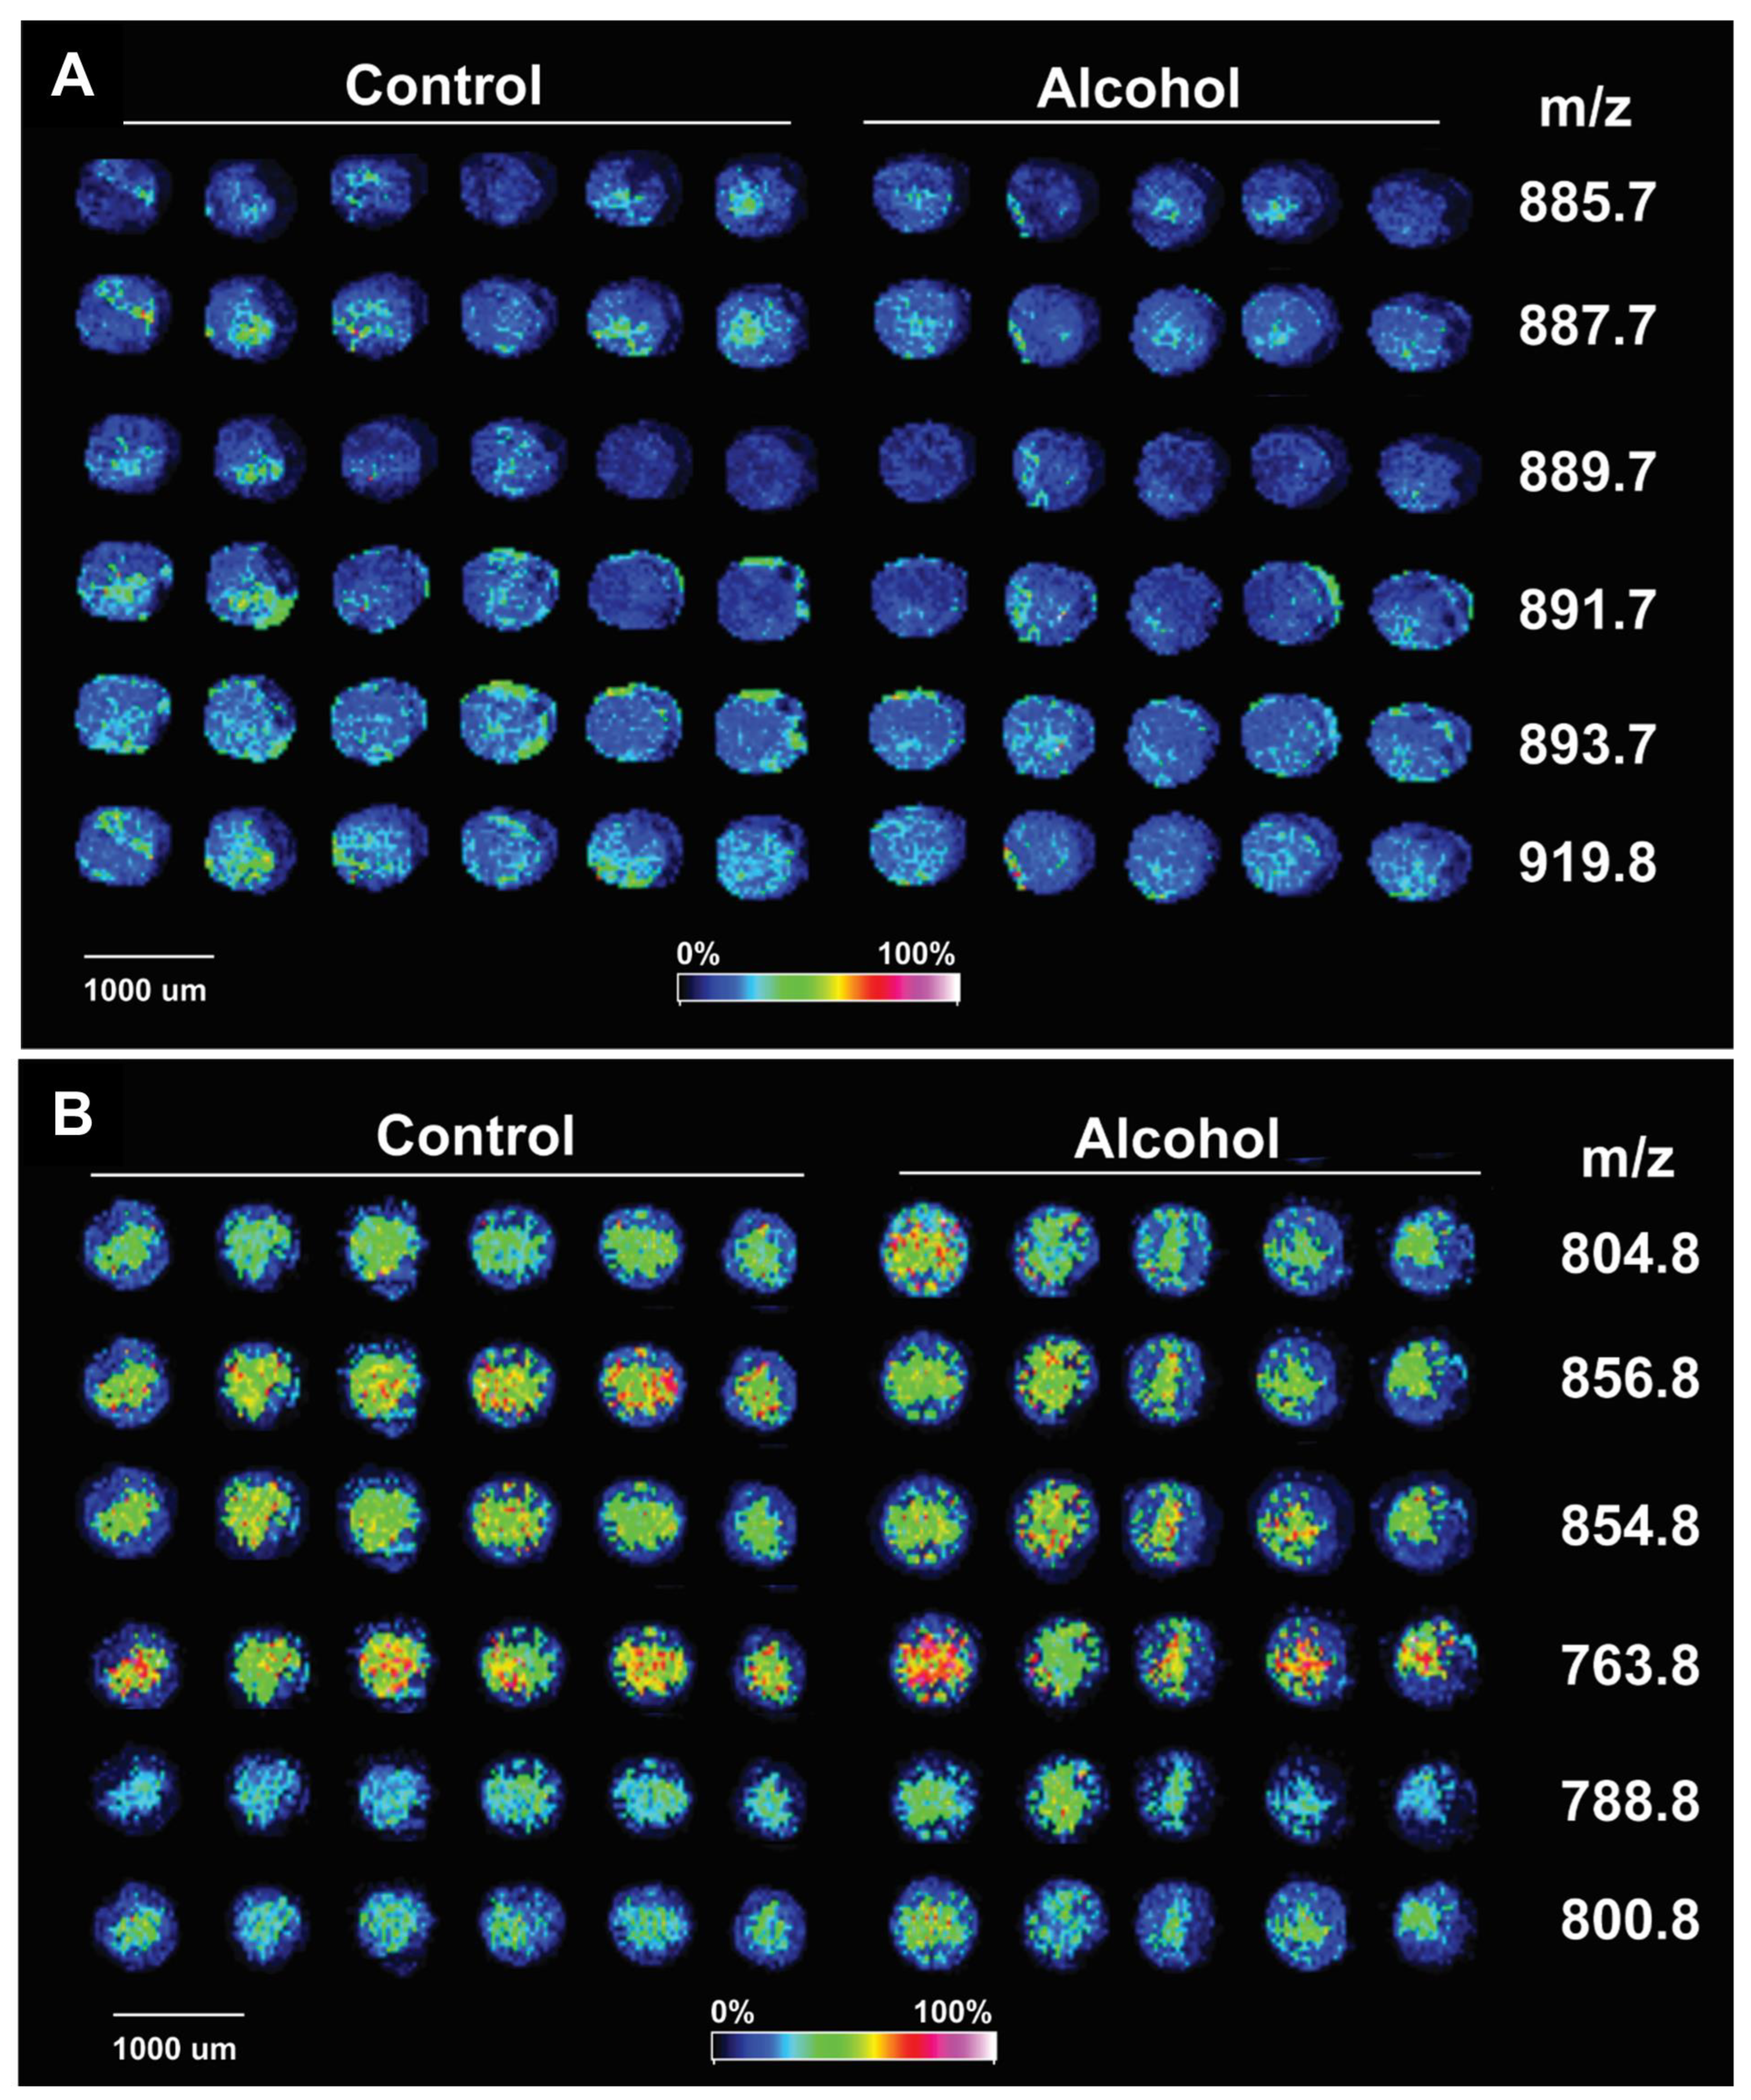
- Data analysis focused on sulfatide ST(42:2), m/z 888.772, which was identified as previously described [21,38,39,50]. A mixture of calibration standards with m/z values spanning the range of analytes of interest and applied to the MALDI target was used to visualize the tissue distribution and relative intensity of each ion at every pixel using a pseudo-color scale. In the NIM, pseudo-colored images demonstrated the following:
- Brighter (more intense) MALDI-IMS signals for cores of frontal lobe WM from the same animals embedded in 2% CMC compared to those with mOCT.
- The ethanol exposure-associated higher signal intensities were more conspicuous for samples embedded in 2% CMC compared to those with mOCT.
- However, the 2% CMC embedding compound posed challenges for generating multiple replicate TMA sections.

Conclusions
3.3. Fresh Frozen vs. Formalin-Fixed Tissue TMAs
- NIM MALDI-IMS was performed on paired fresh-frozen and formalin-fixed frontal lobe WM cores embedded in an mOCT arraymold recipient block.
- By slicing the brains in the coronal plane at the temporal tips, 3 mm cores of central white matter were obtained. The small amounts of peripheral contamination from the adjacent cortex were easy to exclude from the analysis by marking the co-registered images.
- Signal intensities were similar for the same samples and tended to be higher (brighter) for fresh-frozen compared than for formalin-fixed tissue cores embedded in mOCT (Figure 2B).
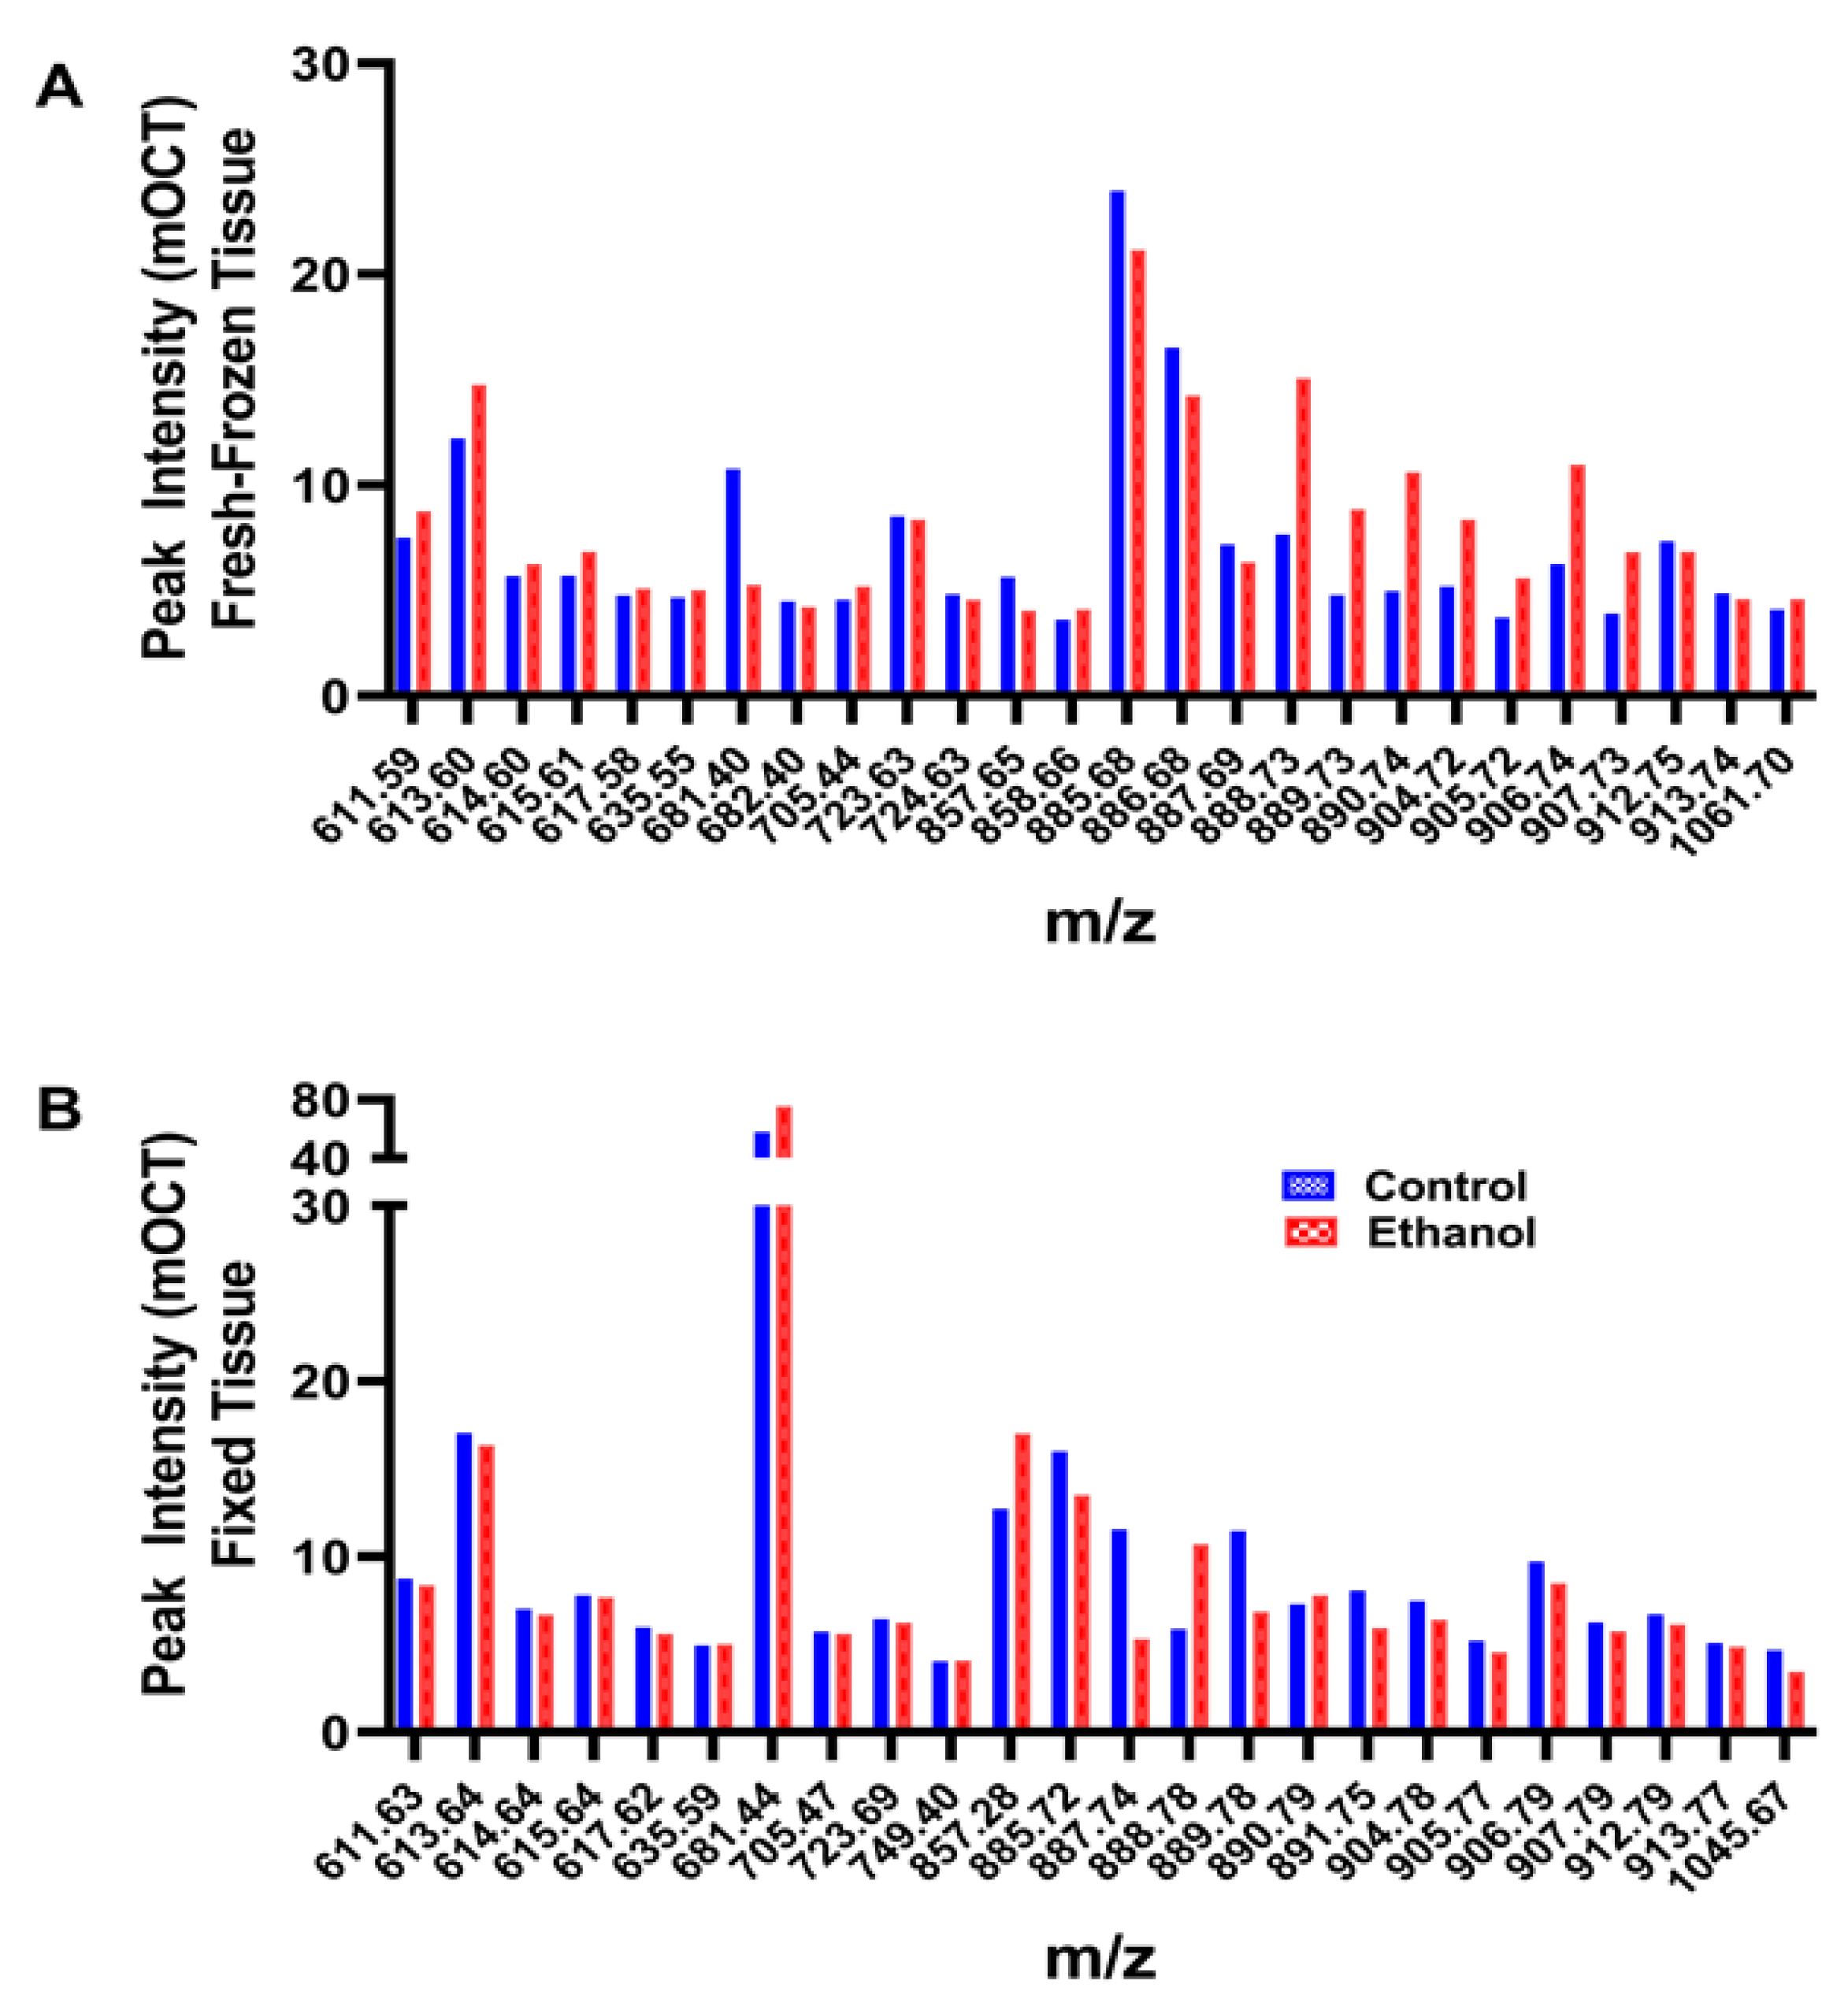
- Example graphed results from individual paired samples analyzed via NIM MALDI-IMS depict peak profiles corresponding to the 21 lipids detected in the fresh-frozen and fixed samples (Figure 3).
- However, the signal intensities (peak heights) corresponding to individual lipids differed for formalin fixed versus fresh-frozen tissue samples (Figure 3A,B).
Conclusions
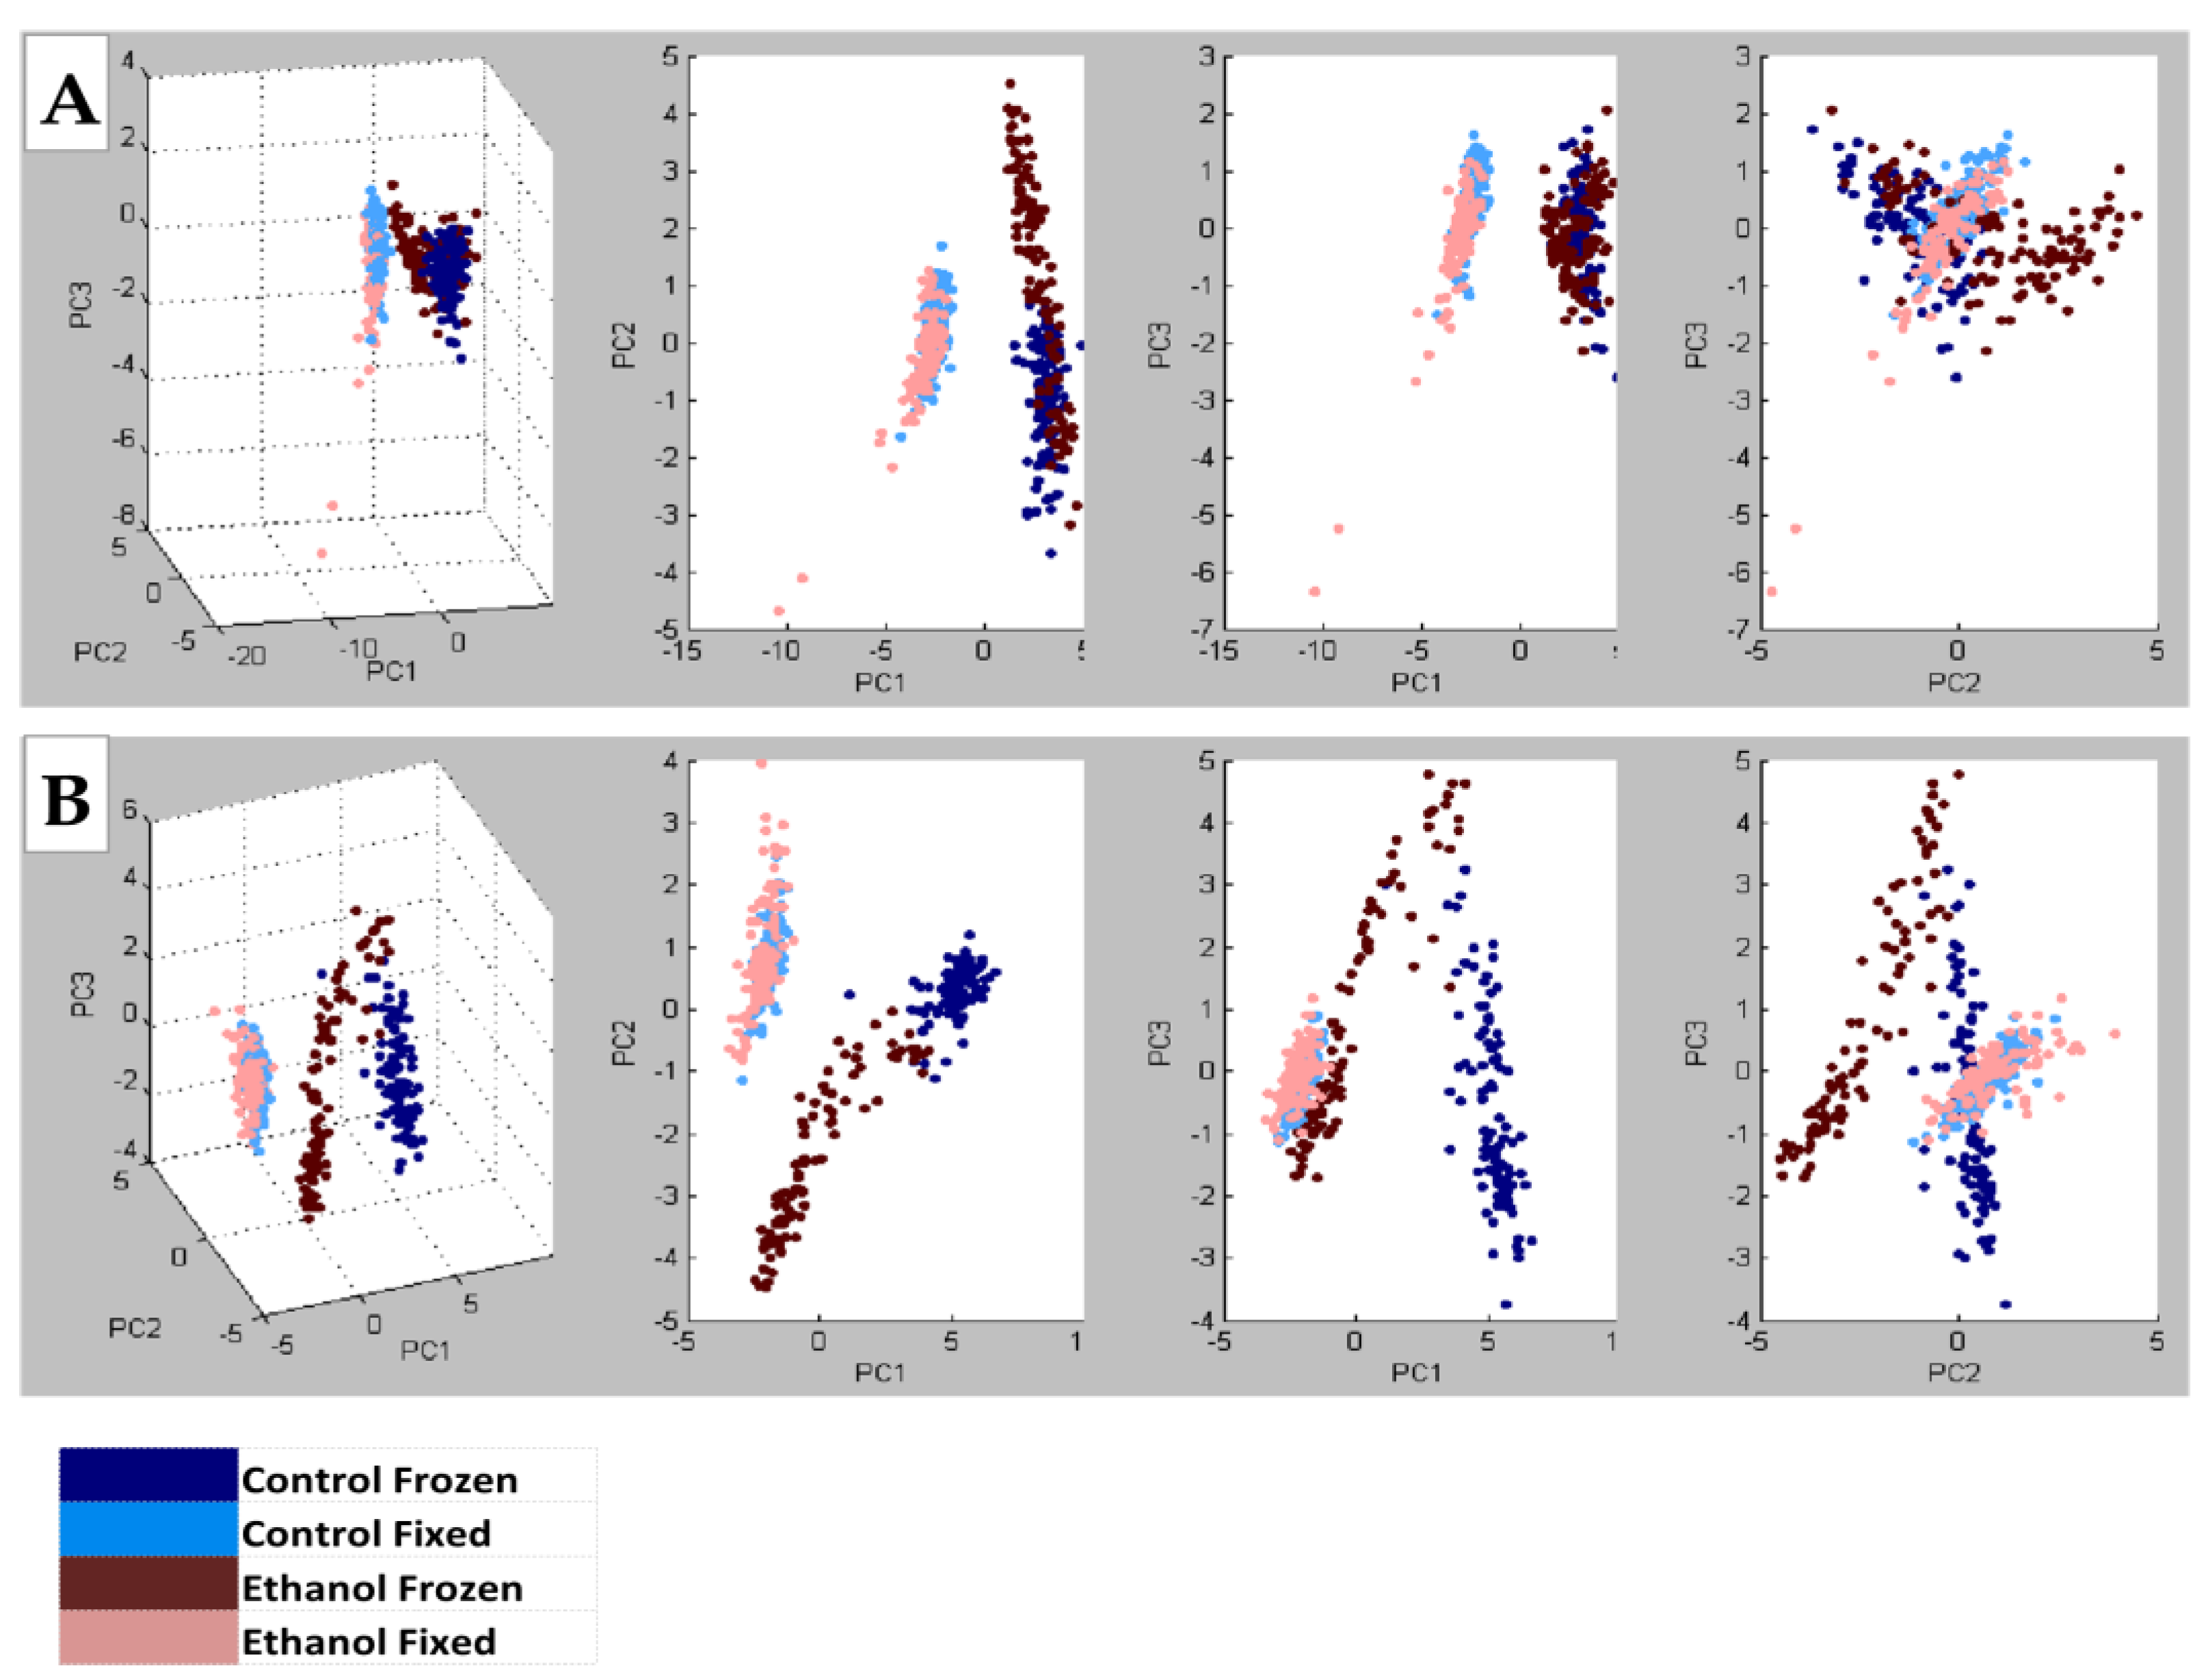
3.4. Embedding Compound Effects on Lipid Peak Profiles (Figure 4)
- NIM MALDI-IMS detected 140 shared lipid peaks (m/z 600–1200) in TMAs generated with control and ethanol-exposed fresh-frozen or formalin-fixed rat frontal WM cores embedded in mOCT or 2% CMC (n = 4 rats/group).
- PCA plots demonstrated the effects of ethanol, which were better distinguished with the 2% CMC embedding compound than with mOCT.
- These studies demonstrate the effects of the treatment/disease model but the more prominent effects of tissue processing and the embedding compound.
- Data generated with cores sampled from the same brains but spatially positioned in different regions of the TMA had a less than 5% mean coefficient of variation.

Conclusions
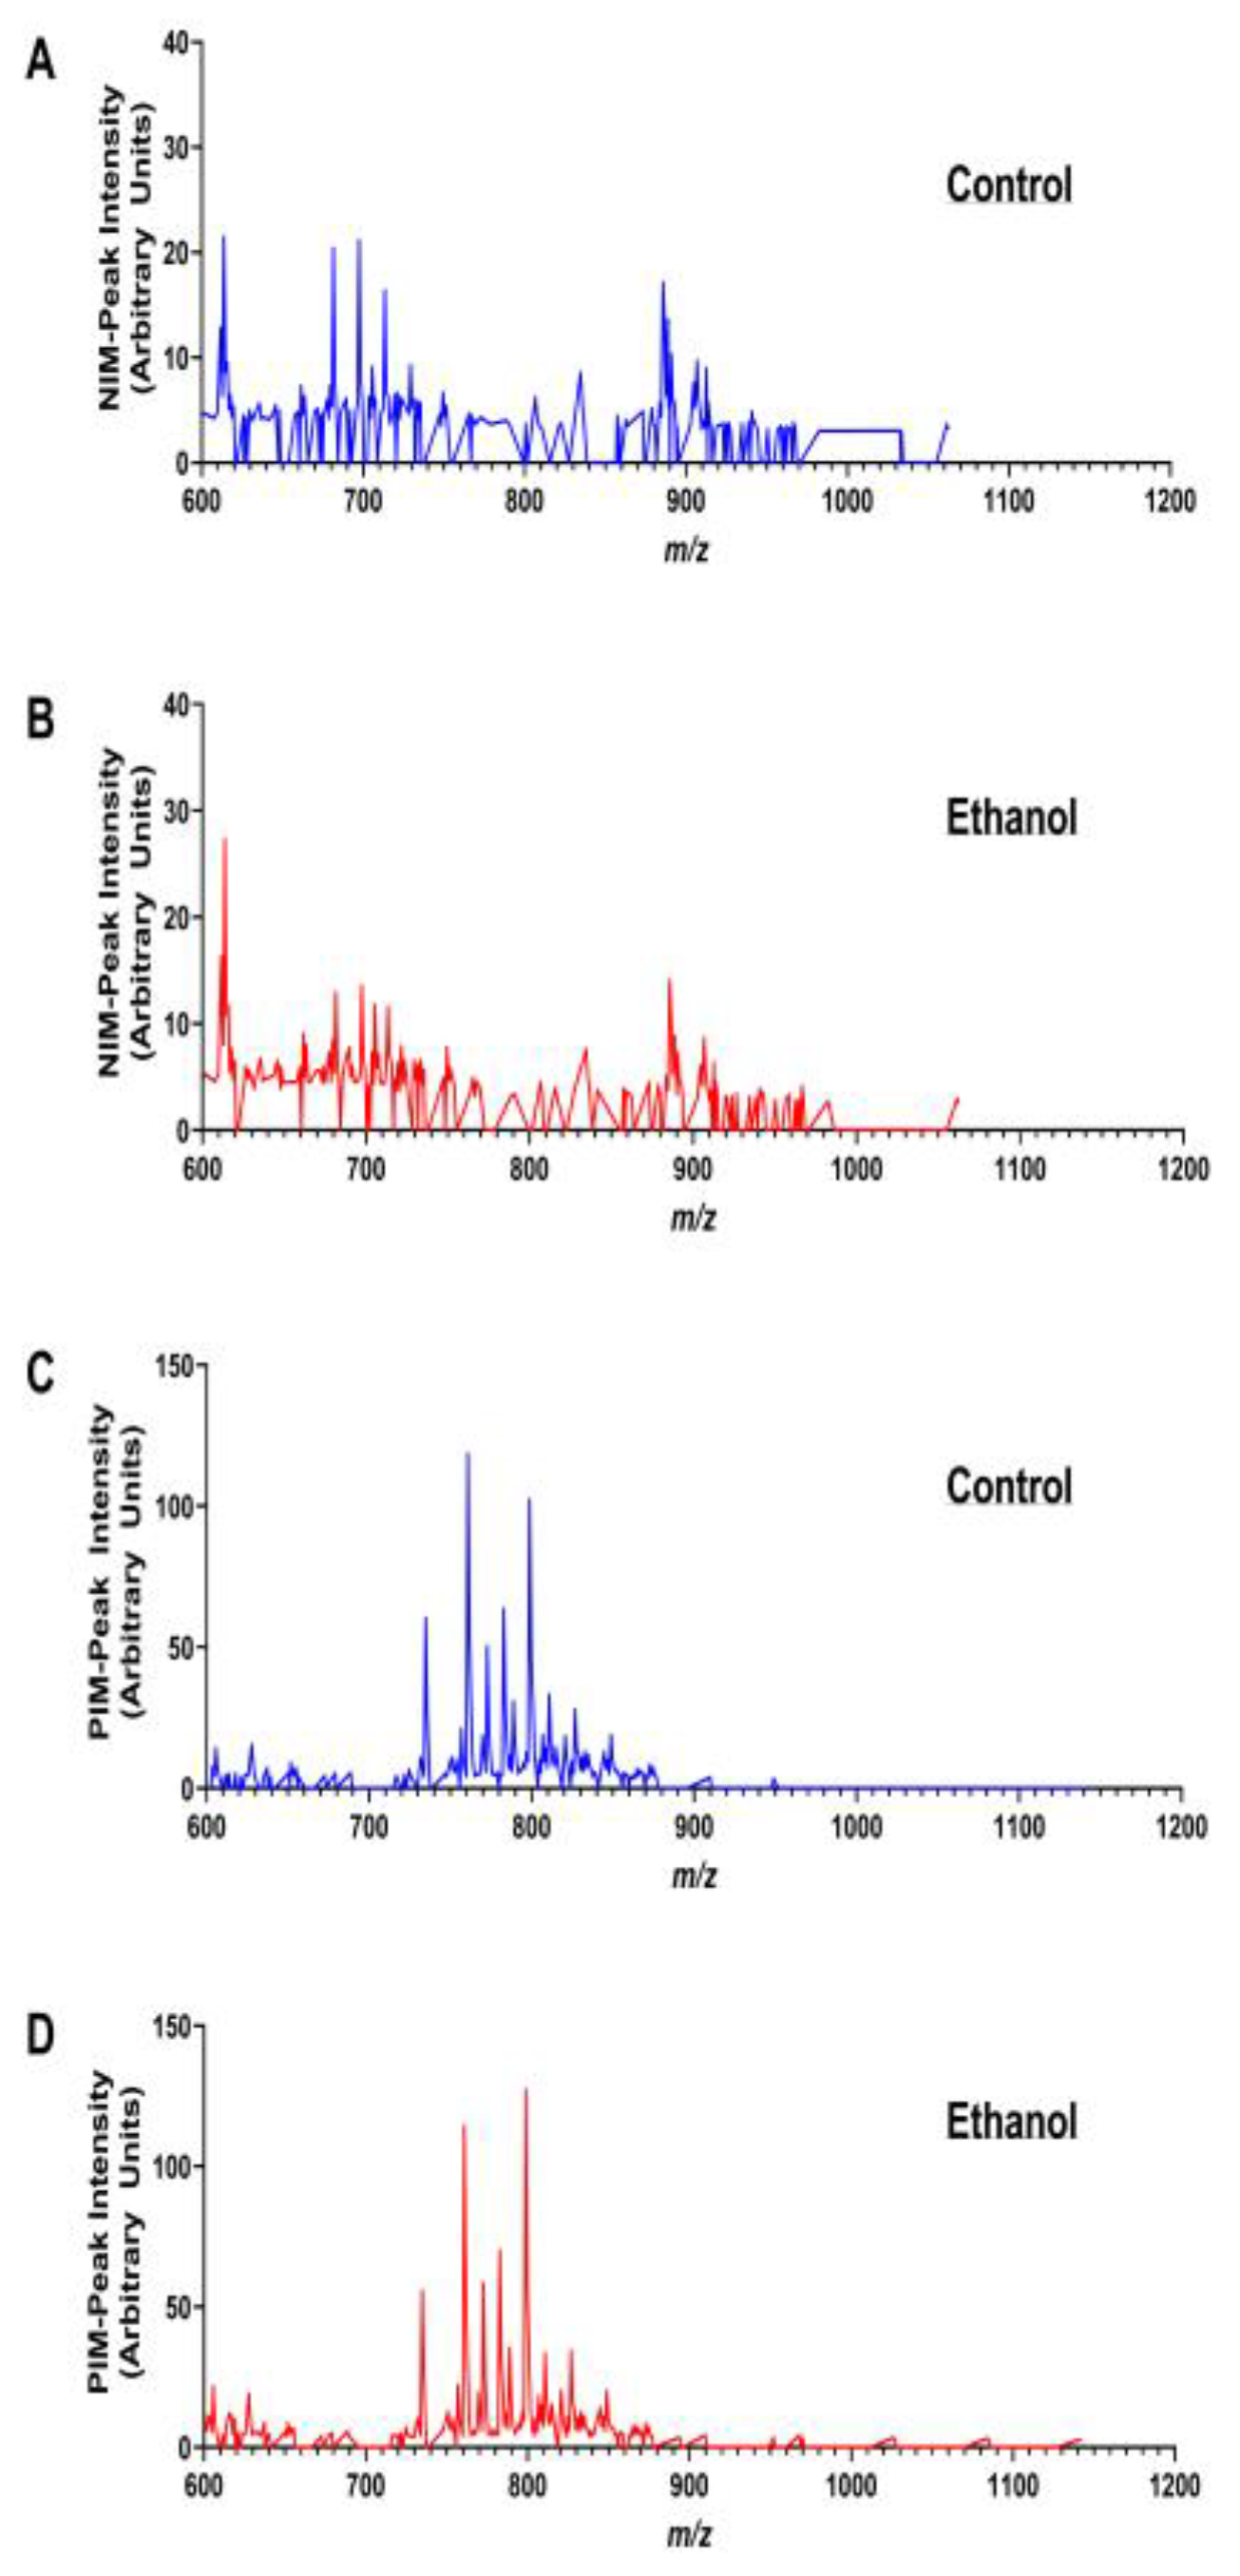
3.5. Illustrated Application of MALDI-IMS TMA Methodology
- Chronic + Binge Ethanol Exposure model [69]: Adult Long Evans rats were maintained for 8 weeks on isocaloric Lieber-DeCarli liquid diets containing 24% or 0% caloric ethanol liquid diets (BioServ, Frenchtown, NJ, USA), and during the last 3 weeks, they were gavage-binged with 2 g/kg ethanol or saline in the liquid diet (2.5 mL total volume) on Tuesdays, Thursdays, and Saturdays.
- Fresh-frozen WM cores (2 mm) from six rats per group were used to generate mOCT-embedded TMAs.
- The NIM and PIM frontal white matter MALDI-IMS lipidomics spectra were distinct (Figure 5). The control and ethanol samples mainly differed with respect to selected peak intensities, rather than specific lipids detected within the NIM or PIM.
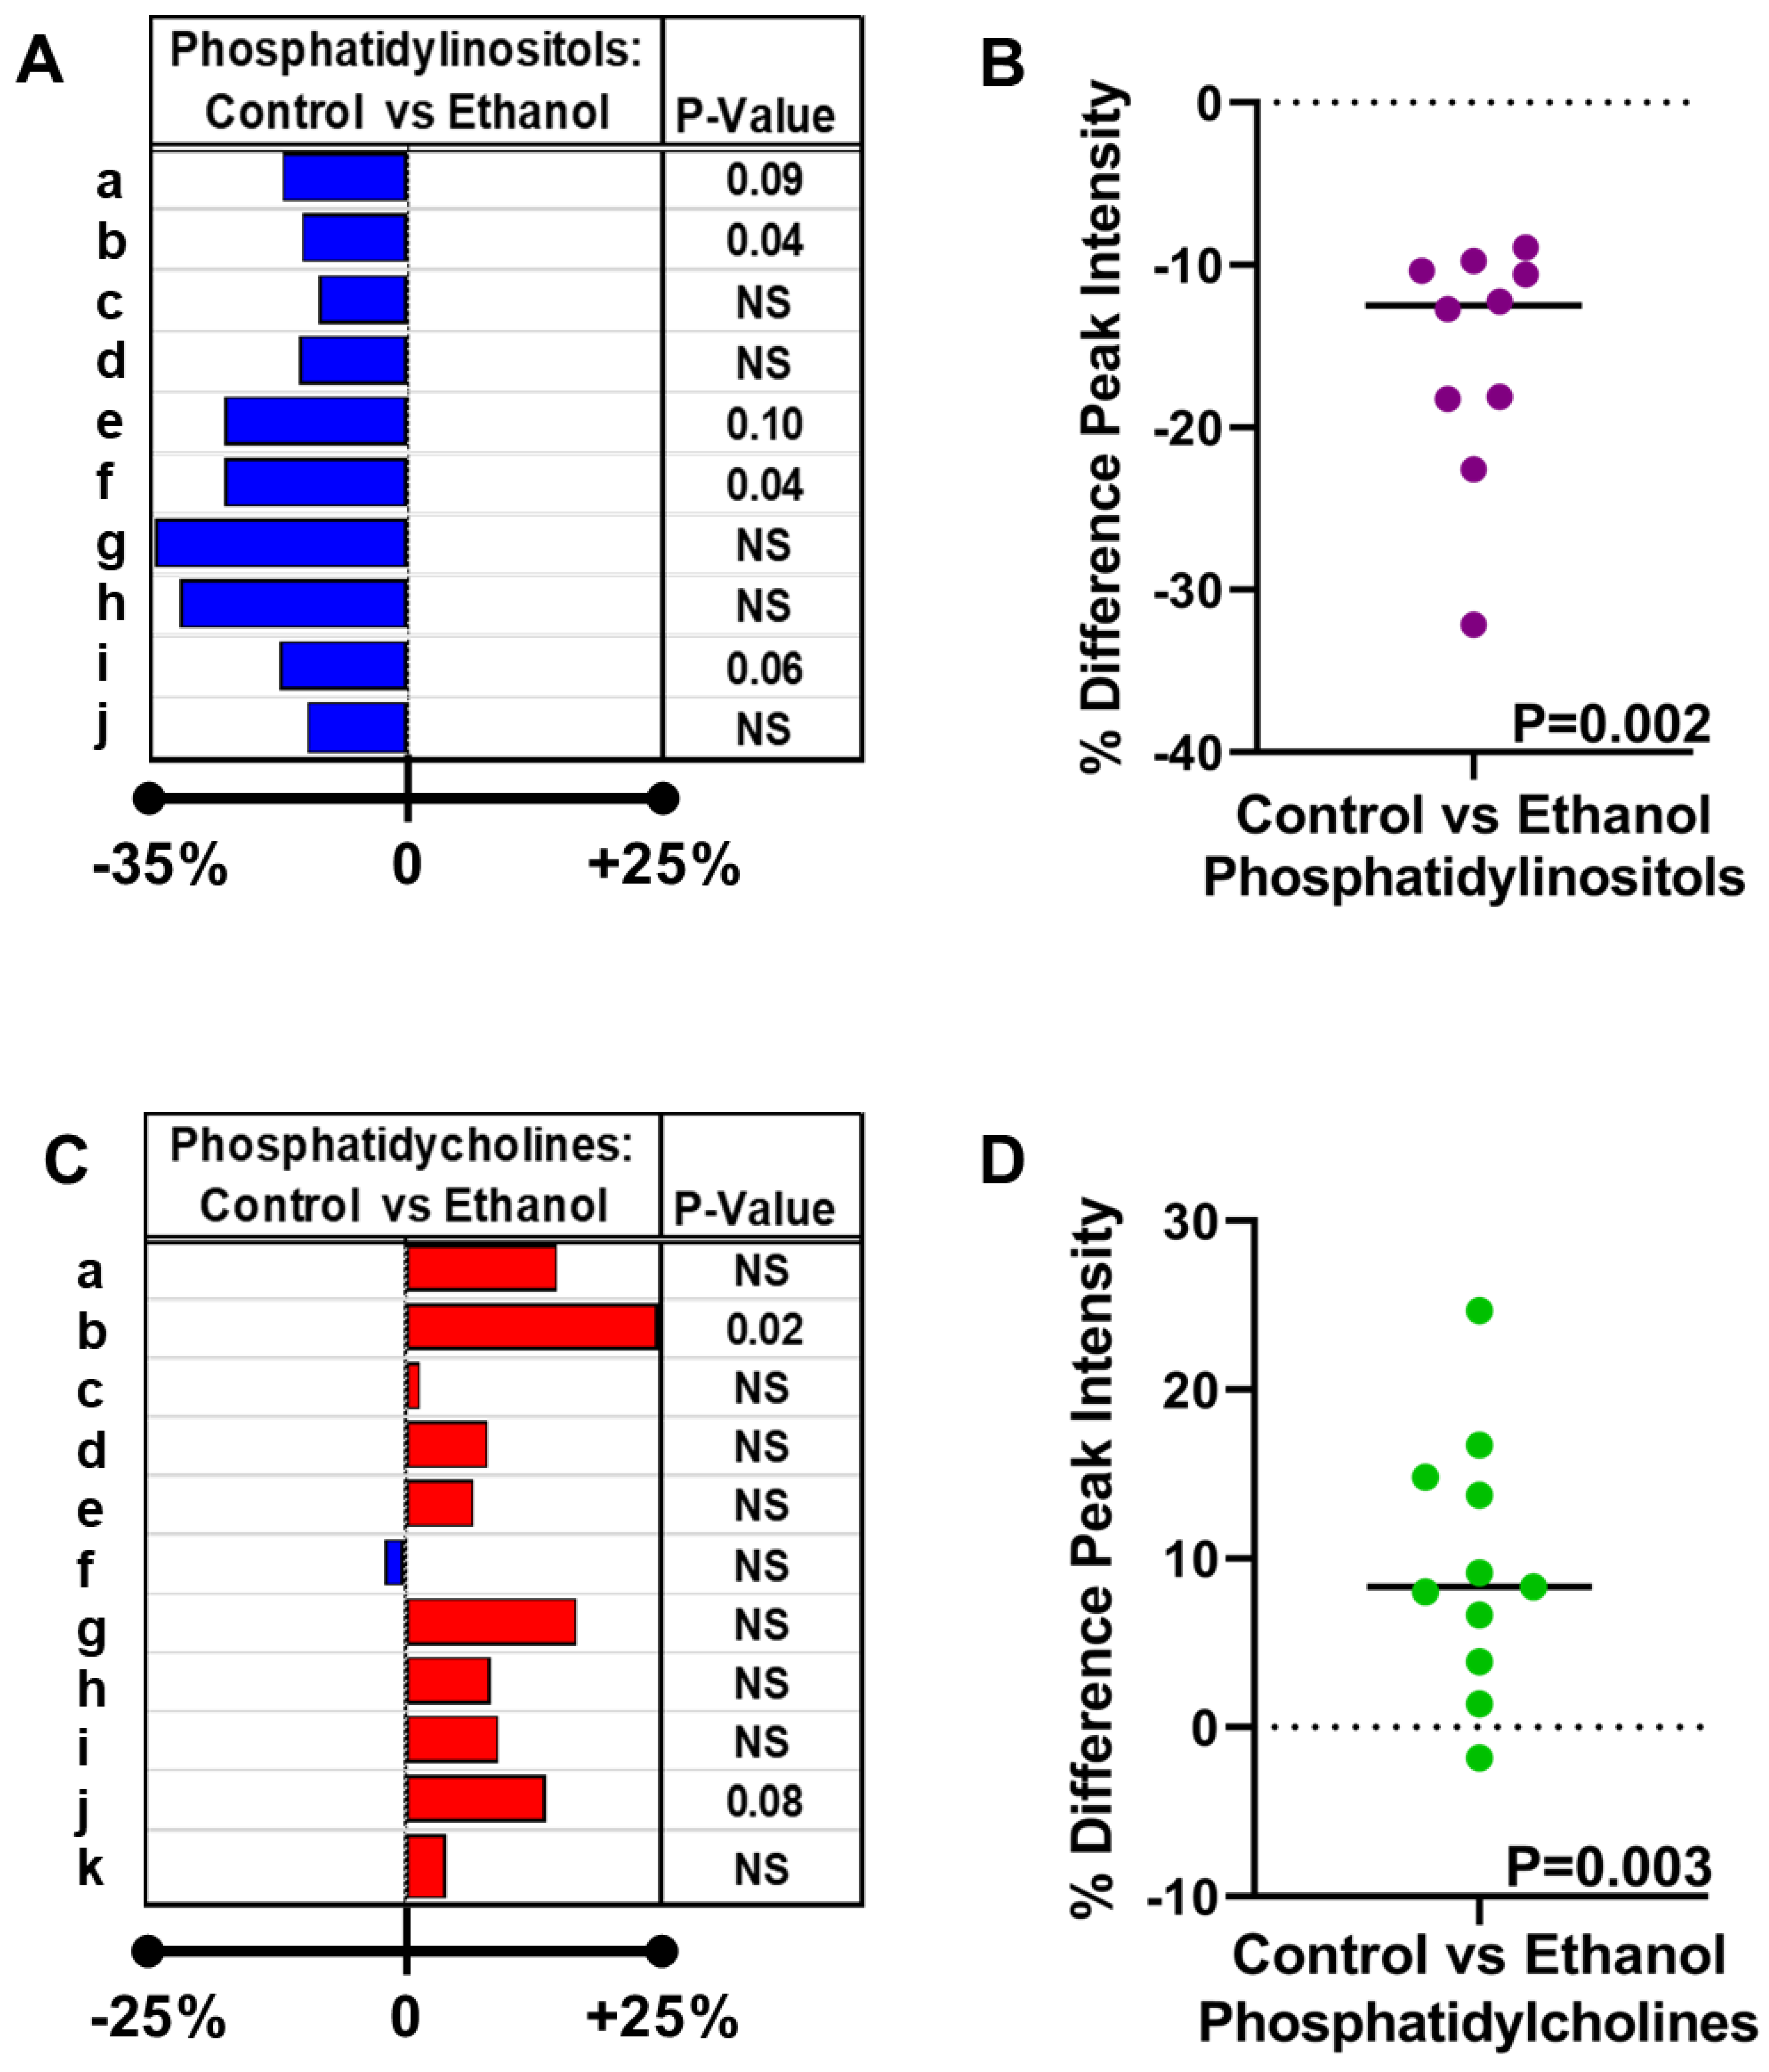
- Inter-group differences in the mean peak intensity for each lipid were assessed statistically with Student t-tests. The calculated percentage differences in the ethanol relative to control samples are depicted in databar plots alongside the p-values for the individual t-tests (Figure 7A,C).
- However, the overall effects of ethanol on PI (Figure 7B) and PC (Figure 7D) expression were further assessed using the Wilcoxon Signed Rank Test to determine if the median percentage differences differed significantly from 0.00. The test demonstrated overall significantly reduced PI (p = 0.002) and increased PC (p = 0.003) expression in ethanol-exposed frontal WM.
Conclusions
4. Discussion
- This work provides a practical, high throughput approach for generating TMAs that are suitable for MALDI-IMS lipidomic studies.
- Although the efforts were focused on brain white matter biochemical histology, the methods can be successfully applied to a broad range of tissues.
- The demonstrated feasibility of using formalin-fixed tissue expands opportunities to conduct large-scale MALDI-IMS lipidomic studies of archival specimens to study the effects of disease in humans and experimental models.
- Although the TMA approach necessitates the inclusion of smaller samples for analysis compared to that ordinarily used for MALDI-IMS and therefore bears the risk of missing data, the streamlined higher throughput strategy enabling uniform sample handling and processing and simultaneous imaging of replicate, positive, and negative control samples under the same conditions outweigh potential limitations related to smaller sample sizes. Moreover, the TMA approach bolsters overall scientific rigor.
- Potential limitations posed by the need to analyze multi-sample lipid profile TMA datasets can be resolved using the open-access rapid peak alignment method (RPAM) [64].
- The use of TMAs for MALDI-IMS could potentially facilitate the better characterization of white matter myelin-associated pathologies that correlate with disease progression or responses to treatment, particularly with respect to neurodegeneration.
Supplementary Materials
Author Contributions
Funding
Institutional Review Board Statement
Informed Consent Statement
Data Availability Statement
Acknowledgments
Conflicts of Interest
References
- Sutherland, G.T.; Sheedy, D.; Kril, J.J. Neuropathology of alcoholism. Handb. Clin. Neurol. 2014, 125, 603–615. [Google Scholar] [CrossRef]
- de la Monte, S.M. Disproportionate atrophy of cerebral white matter in chronic alcoholics. Arch. Neurol. 1988, 45, 990–992. [Google Scholar] [CrossRef] [PubMed]
- Harper, C.G.; Smith, N.A.; Kril, J.J. The effects of alcohol on the female brain: A neuropathological study. Alcohol. Alcohol. 1990, 25, 445–448. [Google Scholar] [PubMed]
- de la Monte, S.M. Quantitation of cerebral atrophy in preclinical and end-stage Alzheimer’s disease. Ann. Neurol. 1989, 25, 450–459. [Google Scholar] [CrossRef]
- Englund, E.; Brun, A. White matter changes in dementia of Alzheimer’s type: The difference in vulnerability between cell compartments. Histopathology 1990, 16, 433–439. [Google Scholar] [CrossRef]
- Englund, E.; Brun, A.; Alling, C. White matter changes in dementia of Alzheimer’s type. Biochemical and neuropathological correlates. Brain J. Neurol. 1988, 111, 1425–1439. [Google Scholar] [CrossRef] [PubMed]
- Ruchoux, M.M.; Maurage, C.A. CADASIL: Cerebral autosomal dominant arteriopathy with subcortical infarcts and leukoencephalopathy. J. Neuropathol. Exp. Neurol. 1997, 56, 947–964. [Google Scholar] [CrossRef] [Green Version]
- Wallin, A.; Blennow, K. Pathogenetic basis of vascular dementia. Alzheimer Dis. Assoc. Disord. 1991, 5, 91–102. [Google Scholar] [CrossRef] [PubMed]
- Larsson, E.; Passant, U.; Sundgren, P.C.; Englund, E.; Brun, A.; Lindgren, A.; Gustafson, L. Magnetic resonance imaging and histopathology in dementia, clinically of frontotemporal type. Dement. Geriatr. Cogn. Disord. 2000, 11, 123–134. [Google Scholar] [CrossRef]
- de la Monte, S.M.; Kril, J.J. Human alcohol-related neuropathology. Acta Neuropathol. 2014, 127, 71–90. [Google Scholar] [CrossRef]
- Schmidt, K.S.; Gallo, J.L.; Ferri, C.; Giovannetti, T.; Sestito, N.; Libon, D.J.; Schmidt, P.S. The neuropsychological profile of alcohol-related dementia suggests cortical and subcortical pathology. Dement. Geriatr. Cogn. Disord. 2005, 20, 286–291. [Google Scholar] [CrossRef]
- Elofson, J.; Gongvatana, W.; Carey, K.B. Alcohol use and cerebral white matter compromise in adolescence. Addict. Behav. 2013, 38, 2295–2305. [Google Scholar] [CrossRef] [Green Version]
- Jacobus, J.; Squeglia, L.M.; Bava, S.; Tapert, S.F. White matter characterization of adolescent binge drinking with and without co-occurring marijuana use: A 3-year investigation. Psychiatry Res. 2013, 214, 374–381. [Google Scholar] [CrossRef] [Green Version]
- Pfefferbaum, A.; Lim, K.O.; Desmond, J.E.; Sullivan, E.V. Thinning of the corpus callosum in older alcoholic men: A magnetic resonance imaging study. Alcohol. Clin. Exp. Res. 1996, 20, 752–757. [Google Scholar] [CrossRef]
- Chanraud, S.; Martelli, C.; Delain, F.; Kostogianni, N.; Douaud, G.; Aubin, H.J.; Reynaud, M.; Martinot, J.L. Brain morphometry and cognitive performance in detoxified alcohol-dependents with preserved psychosocial functioning. Neuropsychopharmacol. Off. Publ. Am. Coll. Neuropsychopharmacol. 2007, 32, 429–438. [Google Scholar] [CrossRef] [PubMed] [Green Version]
- Pfefferbaum, A.; Rosenbloom, M.J.; Adalsteinsson, E.; Sullivan, E.V. Diffusion tensor imaging with quantitative fibre tracking in HIV infection and alcoholism comorbidity: Synergistic white matter damage. Brain A J. Neurol. 2007, 130, 48–64. [Google Scholar] [CrossRef] [PubMed] [Green Version]
- Estruch, R.; Nicolas, J.M.; Salamero, M.; Aragon, C.; Sacanella, E.; Fernandez-Sola, J.; Urbano-Marquez, A. Atrophy of the corpus callosum in chronic alcoholism. J. Neurol. Sci. 1997, 146, 145–151. [Google Scholar] [CrossRef] [PubMed]
- Papp-Peka, A.; Tong, M.; Kril, J.J.; De La Monte, S.M.; Sutherland, G.T. The Differential Effects of Alcohol and Nicotine-Specific Nitrosamine Ketone on White Matter Ultrastructure. Alcohol Alcohol. 2017, 52, 165–171. [Google Scholar] [CrossRef]
- Quarles, R.H.; Macklin, W.B.; Morell, P. Myelin Formation, Structure and Biochemistry, 6th ed.; Siegel, G.J., Ed.; Elsevier: Philadelphia, PA, USA, 2006. [Google Scholar]
- Takahashi, T.; Suzuki, T. Role of sulfatide in normal and pathological cells and tissues. J. Lipid Res. 2012, 53, 1437–1450. [Google Scholar] [CrossRef] [Green Version]
- Yalcin, E.B.; Nunez, K.; Tong, M.; de la Monte, S.M. Differential Sphingolipid and Phospholipid Profiles in Alcohol and Nicotine-Derived Nitrosamine Ketone-Associated White Matter Degeneration. Alcohol. Clin. Exp. Res. 2015, 39, 2324–2333. [Google Scholar] [CrossRef] [Green Version]
- Roux, A.; Muller, L.; Jackson, S.N.; Baldwin, K.; Womack, V.; Pagiazitis, J.G.; O’Rourke, J.R.; Thanos, P.K.; Balaban, C.; Schultz, J.A.; et al. Chronic ethanol consumption profoundly alters regional brain ceramide and sphingomyelin content in rodents. ACS Chem. Neurosci. 2015, 6, 247–259. [Google Scholar] [CrossRef] [PubMed] [Green Version]
- Mollinedo, F.; Gajate, C. Lipid rafts as major platforms for signaling regulation in cancer. Adv. Biol. Regul. 2015, 57, 130–146. [Google Scholar] [CrossRef] [PubMed]
- Farooqui, A.A.; Ong, W.Y.; Horrocks, L.A.; Chen, P.; Farooqui, T. Comparison of biochemical effects of statins and fish oil in brain: The battle of the titans. Brain Res. Rev. 2007, 56, 443–471. [Google Scholar] [CrossRef]
- Kolesnick, R.N.; Kronke, M. Regulation of ceramide production and apoptosis. Annu. Rev. Physiol. 1998, 60, 643–665. [Google Scholar] [CrossRef]
- Ohanian, J.; Ohanian, V. Sphingolipids in mammalian cell signalling. Cell. Mol. Life Sci. CMLS 2001, 58, 2053–2068. [Google Scholar] [CrossRef]
- Eckhardt, M. The role and metabolism of sulfatide in the nervous system. Mol. Neurobiol. 2008, 37, 93–103. [Google Scholar] [CrossRef]
- Vos, J.P.; Lopes-Cardozo, M.; Gadella, B.M. Metabolic and functional aspects of sulfogalactolipids. Biochim. Biophys. Acta 1994, 1211, 125–149. [Google Scholar] [CrossRef] [PubMed]
- Sjobeck, M.; Haglund, M.; Persson, A.; Sturesson, K.; Englund, E. Brain tissue microarrays in dementia research: White matter microvascular pathology in Alzheimer’s disease. Neuropathology 2003, 23, 290–295. [Google Scholar] [CrossRef]
- Luu, M.; Sabo, E.; de la Monte, S.M.; Greaves, W.; Wang, J.; Tavares, R.; Simao, L.; Wands, J.R.; Resnick, M.B.; Wang, L. Prognostic value of aspartyl (asparaginyl)-beta-hydroxylase/humbug expression in non-small cell lung carcinoma. Hum. Pathol. 2009, 40, 639–644. [Google Scholar] [CrossRef] [PubMed] [Green Version]
- Casadonte, R.; Longuespee, R.; Kriegsmann, J.; Kriegsmann, M. MALDI IMS and Cancer Tissue Microarrays. Adv. Cancer Res. 2017, 134, 173–200. [Google Scholar] [CrossRef]
- Cole, L.M.; Clench, M.R. Mass spectrometry imaging tools in oncology. Biomark. Med. 2015, 9, 863–868. [Google Scholar] [CrossRef]
- de la Monte, S.M.; Kay, J.; Yalcin, E.B.; Kril, J.J.; Sheedy, D.; Sutherland, G.T. Imaging mass spectrometry of frontal white matter lipid changes in human alcoholics. Alcohol 2018, 67, 51–63. [Google Scholar] [CrossRef] [PubMed]
- O’Rourke, M.B.; Smith, C.C.; De La Monte, S.M.; Sutherland, G.T.; Padula, M.P. Higher Mass Accuracy MALDI-TOF/TOF Lipid Imaging of Human Brain Tissue in Alzheimer’s Disease. Curr. Protoc. Mol. Biol. 2019, 126, e86. [Google Scholar] [CrossRef]
- Yalcin, E.; Kay, J.; De la Monte, S.M. Mass Spectrometry Imaging of White Matter Lipid Profile Changes with Time Course of Ethanol Exposure and Withdrawal in Adult Long Evans Rats. In Proceedings of the Csaba Horvath Memorial Symposium, New Haven, CT, USA, 27 October 2016; Yale University: New Haven, CT, USA, 2016. [Google Scholar]
- Gallucci, G.M.; Tong, M.; Chen, X.; Stonestreet, B.S.; Lin, A.; de la Monte, S.M. Rapid Alterations in Cerebral White Matter Lipid Profiles After Ischemic-Reperfusion Brain Injury in Fetal Sheep as Demonstrated by MALDI-Mass Spectrometry. Pediatr. Dev. Pathol. 2019, 22, 344–355. [Google Scholar] [CrossRef]
- Homans, C.; Yalcin, E.B.; Tong, M.; Gallucci, G.; Bautista, D.; Moriel, N.; Monte, S.d.l. Therapeutic Effects of Myriocin in Experimental Alcohol-Related Neurobehavioral Dysfunction and Frontal Lobe White Matter Biochemical Pathology. J. Behav. Brain Sci. 2022, 12, 23–42. [Google Scholar] [CrossRef] [PubMed]
- Yalcin, E.B.; McLean, T.; Tong, M.; de la Monte, S.M. Progressive white matter atrophy with altered lipid profiles is partially reversed by short-term abstinence in an experimental model of alcohol-related neurodegeneration. Alcohol 2017, 65, 51–62. [Google Scholar] [CrossRef]
- Yalcin, E.B.; de la Monte, S.M. Review of matrix-assisted laser desorption ionization-imaging mass spectrometry for lipid biochemical histopathology. J. Histochem. Cytochem. 2015, 63, 762–771. [Google Scholar] [CrossRef] [Green Version]
- Tong, M.; Gonzalez-Navarrete, H.; Kirchberg, T.; Gotama, B.; Yalcin, E.B.; Kay, J.; de la Monte, S.M. Ethanol-Induced White Matter Atrophy Is Associated with Impaired Expression of Aspartyl-Asparaginyl-beta-Hydroxylase (ASPH) and Notch Signaling in an Experimental Rat Model. J. Drug Alcohol. Res. 2017, 6, 236033. [Google Scholar] [CrossRef] [PubMed] [Green Version]
- Tong, M.; Yu, R.; Silbermann, E.; Zabala, V.; Deochand, C.; de la Monte, S.M. Differential Contributions of Alcohol and Nicotine-Derived Nitrosamine Ketone (NNK) to White Matter Pathology in the Adolescent Rat Brain. Alcohol Alcohol. 2015, 50, 680–689. [Google Scholar] [CrossRef] [PubMed] [Green Version]
- Tong, M.; Longato, L.; Ramirez, T.; Zabala, V.; Wands, J.R.; de la Monte, S.M. Therapeutic reversal of chronic alcohol-related steatohepatitis with the ceramide inhibitor myriocin. Int. J. Exp. Pathol. 2014, 95, 49–63. [Google Scholar] [CrossRef] [PubMed]
- Lowe, J.M.; Menendez, D.; Bushel, P.R.; Shatz, M.; Kirk, E.L.; Troester, M.A.; Garantziotis, S.; Fessler, M.B.; Resnick, M.A. p53 and NF-kappaB coregulate proinflammatory gene responses in human macrophages. Cancer Res. 2014, 74, 2182–2192. [Google Scholar] [CrossRef] [Green Version]
- Meitner, P.A.; Resnick, M.B. LCM assisted biomarker discovery from archival neoplastic gastrointestinal tissues. Methods Mol. Biol. 2011, 755, 165–180. [Google Scholar] [CrossRef] [PubMed]
- Berry, K.A.; Li, B.; Reynolds, S.D.; Barkley, R.M.; Gijon, M.A.; Hankin, J.A.; Henson, P.M.; Murphy, R.C. MALDI imaging MS of phospholipids in the mouse lung. J. Lipid Res. 2011, 52, 1551–1560. [Google Scholar] [CrossRef] [Green Version]
- Gill, E.L.; Yost, R.A.; Vedam-Mai, V.; Garrett, T.J. Precast Gelatin-Based Molds for Tissue Embedding Compatible with Mass Spectrometry Imaging. Anal. Chem. 2017, 89, 576–580. [Google Scholar] [CrossRef] [Green Version]
- Wang, Y.; Hummon, A.B. MS imaging of multicellular tumor spheroids and organoids as an emerging tool for personalized medicine and drug discovery. J. Biol. Chem. 2021, 297, 101139. [Google Scholar] [CrossRef] [PubMed]
- Liu, X.; Flinders, C.; Mumenthaler, S.M.; Hummon, A.B. MALDI Mass Spectrometry Imaging for Evaluation of Therapeutics in Colorectal Tumor Organoids. J. Am. Soc. Mass Spectrom. 2018, 29, 516–526. [Google Scholar] [CrossRef] [PubMed]
- Angel, P.M.; Spraggins, J.M.; Baldwin, H.S.; Caprioli, R. Enhanced sensitivity for high spatial resolution lipid analysis by negative ion mode matrix assisted laser desorption ionization imaging mass spectrometry. Anal. Chem. 2012, 84, 1557–1564. [Google Scholar] [CrossRef] [Green Version]
- Yalcin, E.B.; Nunez, K.; Cornett, D.S.; de la Monte, S.M. Differential Lipid Profiles in Experimental Steatohepatitis: Role for Imaging Mass Spectrometry as a Diagnostic Aid. J. Drug Alcohol Res. 2015, 4, 1–11. [Google Scholar] [CrossRef] [Green Version]
- Yalcin, E.B.; Nunez, K.; Tong, M.; Cornett, S.D.; de la Monte, S.M. MALDI-IMS Detects Differential White Matter Degeneration-Associated Lipid Profiles in Rat Models of Chronic Alcohol, Tobacco Nitrosamine, or Both Exposures. J. Am. Soc. Mass Spectrom. 2015, 26, 95. [Google Scholar]
- Soltwisch, J.; Kettling, H.; Vens-Cappell, S.; Wiegelmann, M.; Muthing, J.; Dreisewerd, K. Mass spectrometry imaging with laser-induced postionization. Science 2015, 348, 211–215. [Google Scholar] [CrossRef]
- Lemaire, R.; Wisztorski, M.; Desmons, A.; Tabet, J.C.; Day, R.; Salzet, M.; Fournier, I. MALDI-MS direct tissue analysis of proteins: Improving signal sensitivity using organic treatments. Anal. Chem. 2006, 78, 7145–7153. [Google Scholar] [CrossRef] [Green Version]
- Shanta, S.R.; Zhou, L.H.; Park, Y.S.; Kim, Y.H.; Kim, Y.; Kim, K.P. Binary matrix for MALDI imaging mass spectrometry of phospholipids in both ion modes. Anal. Chem. 2011, 83, 1252–1259. [Google Scholar] [CrossRef] [PubMed]
- Gode, D.; Volmer, D.A. Lipid imaging by mass spectrometry—A review. Analyst 2013, 138, 1289–1315. [Google Scholar] [CrossRef] [PubMed]
- Thomas, A.; Charbonneau, J.L.; Fournaise, E.; Chaurand, P. Sublimation of new matrix candidates for high spatial resolution imaging mass spectrometry of lipids: Enhanced information in both positive and negative polarities after 1,5-diaminonapthalene deposition. Anal. Chem. 2012, 84, 2048–2054. [Google Scholar] [CrossRef]
- Jackson, S.N.; Wang, H.Y.; Woods, A.S. In situ structural characterization of glycerophospholipids and sulfatides in brain tissue using MALDI-MS/MS. J. Am. Soc. Mass Spectrom. 2007, 18, 17–26. [Google Scholar] [CrossRef] [Green Version]
- Dreisewerd, K.; Lemaire, R.; Pohlentz, G.; Salzet, M.; Wisztorski, M.; Berkenkamp, S.; Fournier, I. Molecular profiling of native and matrix-coated tissue slices from rat brain by infrared and ultraviolet laser desorption/ionization orthogonal time-of-flight mass spectrometry. Anal. Chem. 2007, 79, 2463–2471. [Google Scholar] [CrossRef] [PubMed] [Green Version]
- Carter, C.L.; Jones, J.W.; Farese, A.M.; MacVittie, T.J.; Kane, M.A. Inflation-Fixation Method for Lipidomic Mapping of Lung Biopsies by Matrix Assisted Laser Desorption/Ionization-Mass Spectrometry Imaging. Anal. Chem. 2016, 88, 4788–4794. [Google Scholar] [CrossRef]
- Dannhorn, A.; Swales, J.G.; Hamm, G.; Strittmatter, N.; Kudo, H.; Maglennon, G.; Goodwin, R.J.A.; Takats, Z. Evaluation of Formalin-Fixed and FFPE Tissues for Spatially Resolved Metabolomics and Drug Distribution Studies. Pharmaceuticals 2022, 15, 1307. [Google Scholar] [CrossRef]
- Fournier, I.; Salzet, M.; Meriaux, C.; Franck, J. Matrices for Mass Spectrometry Imaging. Patent World Intellectual Property. Patent Application No. PCT/1B2009/056037.
- Afshinnia, F.; Rajendiran, T.M.; Soni, T.; Byun, J.; Wernisch, S.; Sas, K.M.; Hawkins, J.; Bellovich, K.; Gipson, D.; Michailidis, G.; et al. Impaired beta-Oxidation and Altered Complex Lipid Fatty Acid Partitioning with Advancing CKD. J. Am. Soc. Nephrol. JASN 2018, 29, 295–306. [Google Scholar] [CrossRef] [Green Version]
- Meriaux, C.; Franck, J.; Wisztorski, M.; Salzet, M.; Fournier, I. Liquid ionic matrixes for MALDI mass spectrometry imaging of lipids. J. Proteom. 2010, 73, 1204–1218. [Google Scholar] [CrossRef]
- Pelit, W.; de la Monte, S.M.; Yalcin, E.B. Rapid Peak Alignment for MALDI-TOF Lipid Analysis. J. Bioanal. Methods Tech. 2021, 1, 104. [Google Scholar] [PubMed]
- Carter, C.L.; McLeod, C.W.; Bunch, J. Imaging of phospholipids in formalin fixed rat brain sections by matrix assisted laser desorption/ionization mass spectrometry. J. Am. Soc. Mass Spectrom. 2011, 22, 1991–1998. [Google Scholar] [CrossRef] [PubMed] [Green Version]
- Buck, A.; Ly, A.; Balluff, B.; Sun, N.; Gorzolka, K.; Feuchtinger, A.; Janssen, K.P.; Kuppen, P.J.; van de Velde, C.J.; Weirich, G.; et al. High-resolution MALDI-FT-ICR MS imaging for the analysis of metabolites from formalin-fixed, paraffin-embedded clinical tissue samples. J. Pathol. 2015, 237, 123–132. [Google Scholar] [CrossRef] [PubMed] [Green Version]
- Neef, S.K.; Winter, S.; Hofmann, U.; Murdter, T.E.; Schaeffeler, E.; Horn, H.; Buck, A.; Walch, A.; Hennenlotter, J.; Ott, G.; et al. Optimized protocol for metabolomic and lipidomic profiling in formalin-fixed paraffin-embedded kidney tissue by LC-MS. Anal. Chim. Acta 2020, 1134, 125–135. [Google Scholar] [CrossRef]
- Leopold, J.; Popkova, Y.; Engel, K.M.; Schiller, J. Recent Developments of Useful MALDI Matrices for the Mass Spectrometric Characterization of Lipids. Biomolecules 2018, 8, 173. [Google Scholar] [CrossRef] [PubMed] [Green Version]
- Yalcin, E.B.; Tong, M.; Homans, C.; de la Monte, S.M. Myriocin Treatment Reverses Alcohol-Induced Alterations in Polyunsaturated Fatty Acid-Containing Phospholipid Expression in the Liver. Nutr. Metab. Insights 2022, 15, 11786388221082012. [Google Scholar] [CrossRef]


| Code | Phosphatidylinositols-NIM | Ionization Form | m/z |
|---|---|---|---|
| a | PI(34:1) | [M-H]- | 835.7 |
| b | PI(36:4) | [M-H]- | 857.6 |
| c | PI(O-38:3)/PI(P-38:2) | [M-H]- | 873.2 |
| d | PI(38:5) | [M-H]- | 883.7 |
| e | PI(38:4) | [M-H]- | 885.7 |
| f | PI(38:3) | [M-H]- | 887.7 |
| g | PI(38:2) | [M-H]- | 889.7 |
| h | PI(38:1) | [M-H]- | 891.7 |
| i | PI(38:0) | [M-H]- | 893.7 |
| j | PI(40:1)/PI(P-41:0)/LPIM2(18:2) | [M-H]- | 919.8 |
| Phosphatidylcholines-PIM | Ionization Form | m/z | |
| a | (1) PC(36:1); (2) pPC(36:4); (3) PC(34:6) | (1) [M+H]+; (2) [M+Na]+; (3) [M+K]+ | 788.8 |
| b | (1) PC(36:7); (2) PC(O-36:0); (3) PC(34:1) | (1) [M+Na]+; (2) [M+Na]+; (3) [M+K]+ | 798.8 |
| c | (1) PC(38:7); (2) PC(36:4) | (1) [M+H]+; (2) [M+Na]+ | 804.8 |
| d | (1) PC(40:9); (2) PC(O-40:2); (3) PC(38:6); 4) PC(36:0) | (1) [M+H]+; (2) [M+H]+; (3) [M+Na]+; (4) [M+K]+ | 828.8 |
| e | (1) PC(42:10); (2) PC(40:7); (3) PC(38:1) | (1) [M+H]+; (2) [M+Na]+; (3) [M+K]+ | 854.8 |
| f | (1) PC(42:9); (2) PC(40:6) | (1) [M+H]+; (2) [M+Na]+ | 856.8 |
| g | (1) PC(O-38:2); (2) PC(36:6); (3) PC(34:0) | (1) [M+H]+; (2) [M+Na]+; (3) [M+K]+ | 800.8 |
| h | PC(32:0) | [M+H]+ | 734.8 |
| i | PC(34:0) | [M+H]+ | 762.8 |
| j | PC(34:1) | [M+H]+ | 760.8 |
| k | PC(36:3) | [M+K-N(CH3)3]+ | 763.8 |
Disclaimer/Publisher’s Note: The statements, opinions and data contained in all publications are solely those of the individual author(s) and contributor(s) and not of MDPI and/or the editor(s). MDPI and/or the editor(s) disclaim responsibility for any injury to people or property resulting from any ideas, methods, instructions or products referred to in the content. |
© 2023 by the authors. Licensee MDPI, Basel, Switzerland. This article is an open access article distributed under the terms and conditions of the Creative Commons Attribution (CC BY) license (https://creativecommons.org/licenses/by/4.0/).
Share and Cite
Gameiro-Ros, I.; Noble, L.; Tong, M.; Yalcin, E.B.; de la Monte, S.M. Tissue Microarray Lipidomic Imaging Mass Spectrometry Method: Application to the Study of Alcohol-Related White Matter Neurodegeneration. Appl. Biosci. 2023, 2, 173-193. https://doi.org/10.3390/applbiosci2020013
Gameiro-Ros I, Noble L, Tong M, Yalcin EB, de la Monte SM. Tissue Microarray Lipidomic Imaging Mass Spectrometry Method: Application to the Study of Alcohol-Related White Matter Neurodegeneration. Applied Biosciences. 2023; 2(2):173-193. https://doi.org/10.3390/applbiosci2020013
Chicago/Turabian StyleGameiro-Ros, Isabel, Lelia Noble, Ming Tong, Emine B. Yalcin, and Suzanne M. de la Monte. 2023. "Tissue Microarray Lipidomic Imaging Mass Spectrometry Method: Application to the Study of Alcohol-Related White Matter Neurodegeneration" Applied Biosciences 2, no. 2: 173-193. https://doi.org/10.3390/applbiosci2020013