Article

Are There Wheat Cultivars Allowing Enhanced Carbon Allocation to Soils?

1
School of Agricultural, Earth and Environmental Sciences, University of KwaZulu-Natal, Pietermaritzburg 3209, South Africa
2
Laboratory of Oceanography and Climate, Experiments and Numerical Approaches (LOCEAN), UMR 7159, IRD/C NRS/UPMC/MNHN, IPSL, 75005 Paris, France
*
Author to whom correspondence should be addressed.
Appl. Biosci. 2023, 2(1), 115-135; https://doi.org/10.3390/applbiosci2010010
Submission received: 17 November 2022 / Revised: 13 January 2023 / Accepted: 17 February 2023 / Published: 20 March 2023
(This article belongs to the Special Issue Feature Papers for the Inaugural Issue of Applied Biosciences)

Abstract

:
The transfer of atmospheric carbon (C) in soils is a possible strategy for climate change mitigation and for restoring land productivity. While some studies have compared the ability of existing crops to allocate C into the soil, the genetic variations between crop genotypes have received less attention. The objective of this study was to compare the allocation to the soil of atmospheric C by genetically diverse wheat genotypes under different scenarios of soil water availability. The experiments were set up under open-field and greenhouse conditions with 100 wheat genotypes sourced from the International Maize and Wheat Improvement Centre and grown at 25% (drought stressed) and 75% (non-stressed) field capacity, using an alpha lattice design with 10 incomplete blocks and 10 genotypes per block. The genotypes were analyzed for grain yield (GY), plant shoot and root biomass (SB and RB, respectively) and C content, and stocks in plant parts. Additionally, 13C pulse labeling was performed during the crop growth period of 10 selected genotypes for assessing soil C inputs. The average GY varied from 75 to 4696 g m−2 and total plant biomass (PB) from 1967 to 13,528 g m−2. The plant C stocks ranged from 592 to 1109 g C m−2 (i.e., an 87% difference) under drought condition and between 1324 and 2881 g C m−2 (i.e., 117%) under well-watered conditions. Atmospheric C transfer to the soil only occurred under well-drained conditions and increased with the increase in the root to shoot ratio for C stocks (r = 0.71). Interestingly, the highest transfer to the soil was found for LM-26 and LM-47 (13C/12C of 7.6 and 6.5 per mille, respectively) as compared to LM-70 and BW-162 (0.75; 0.85). More is to be done to estimate the differences in C fluxes to the soil over entire growing seasons and to assess the long-term stabilization of the newly allocated C. Future research studies also need to identify genomic regions associated with GY and soil C transfer to enable the breeding of “carbon-superior” cultivars.

1. Introduction

Climate change is mainly driven by the human-induced release of large quantities of carbon (C), as greenhouse gases (GHGs), to the atmosphere. The C was initially sequestered in soils and rocks by plants through photosynthesis and by other organisms. Evidence points to agriculture as a major source of GHGs starting several thousand years ago through the conversion of natural ecosystems (e.g., forests and grasslands) into croplands. Following this conversion, most of the C from the biomass and soil pools, the latter consisting of plant and animal residues at various stages of decomposition, enters into the atmosphere through oxidation by microbes. A total amount of 133 Pg of soil C is estimated to have been lost to the atmosphere [1].
The subsequent rise in atmospheric CO2 concentrations has caused an increase in global temperatures, which has significantly affected precipitation patterns, leading to intermittent warmer and drier environments. This, in turn, has negatively affected agriculture. For instance, rising surface temperatures curtail crop production because crops are adapted to specific optimal temperature ranges, and deviations from the optimal range negatively affect biomass production, grain yield (GY) and grain quality [2]. Specifically, higher temperatures exacerbate drought stress by increasing transpiration and reducing crop water use efficiency [3]. In addition, higher atmospheric CO2 concentrations reduce the nutritional quality of grains, thus impacting on the dietary requirements of billions of people across the world [2,4].
Several propositions have been made to mitigate climate change, such as agroforestry and changes in farming practices, e.g., from conventional to reduced tillage systems, but they are shrouded in controversy and not easy to adopt [5]. The low adoption rates could be partly because farmers, in their large majority, do not necessarily want to change their farming practices. Therefore, pragmatic solutions for transferring and storing the excess atmospheric C into soils that fit well into farmers’ already-established production systems are still needed. One such solution could be the identification of genetic resources that are useful to farmers, while at the same time enhancing the amount of soil C. In particular, special attention to the ability of food and cash crops to allocate C in their rooting system and to the soil is needed. Studies have reported that 50–80% of soil C comes from root activity during growth and decomposition after senescence [6,7,8]. Moreover, a larger root system, is not only expected to increase root C inputs to the soil, but also to increase the water extraction capacity of plants [9], which is a key defense trait to counter potential climate change-driven water scarcity.
Mathew et al. [10], in their analysis of different crop types from 389 trials worldwide, reported that the highest C allocation to roots was in grasses (R:S = 1.19), followed by cereals (0.95), legumes (0.86), oil crops (0.85), and fiber crops (0.50). Further analysis pointed to a decrease in C allocation to roots from humid to dry climates, while, as C allocation to roots increases, C inputs to the soil rise (r = 0.33) [11].
Several studies have shown that R:S for annual cereals varies greatly. For example, Amanullah and Stewart [12] reported values of 0.41 and 0.29 for sorghum and maize, respectively. Yang et al. [13] reported a mean of 0.25 for maize and wheat, and Bolinder et al. [14] showed that the average R:S for winter wheat (0.2) was significantly lower than for oats (0.4) and barley (0.5). Variations of R:S within single species have also been reported. Fang et al. [15] reported a ratio of 1.13 for landrace wheat compared to 0.61 and 0.81 for two modern cultivars. Similarly, Siddique et al. [16] reported ratios ranging from 0.72 to 0.84 for modern wheat cultivars. However, Bolinger et al. (1997) [14] did not find differences between cultivars.
Despite several studies on plant C stocks, little is known about the potential ability of different cultivars of a single crop to transfer C to soils. Experimental verification of variations in soil C resulting from changes, such as the activity of different genotypes, may require long-term experiments (e.g., Paustian et al. [17]). Alternatively, the advent of isotopic CO2 labeling allows for C transfers within the atmosphere–plant–soil system to be accessed over short periods of time, such as days or crop growing seasons. Isotopic labeling exploits the differences in the atomic signature of atmospheric CO2 and commercially labeled CO2 (13CO2 or 14CO2) to estimate the transfer of C from one pool to another.
In numerous studies, the transfer of atmospheric C to soils has been investigated using C isotopes [8,18]. indicated that annual crops retained more C (45% of assimilated 13C or 14C) in shoots than grasses (34%), mainly perennials, and allocated 1.5 times less C below ground. Similarly, Kuzyakov and Domanski [19] reported that grasses allocate 2200 kg C ha−1yr−1 below ground, versus 1500 kg C ha−1 yr−1 for cereals.
Further, assimilation in aboveground organs [20] and the proportion of the belowground allocation being dependent on plant genetics and environmental conditions were shown by Rangel-Castro et al. [21], de Neergaard and Gorissen [22] and Brüggemann et al. [23].
The objective of the current study was to evaluate and compare the capacity to capture and transfer atmospheric C to roots among wheat cultivars with diverse rooting capabilities and drought tolerance for selecting “carbon superior” cultivars. Here we considered 100 wheat cultivars from the International Maize and Wheat Improvement Centre (CIMMYT). These were grown in the field and in a glasshouse and subjected to water-stressed and -non-stressed conditions, and a subset of 10 cultivars was selected for further C translocation studies. The results could be helpful to crop breeders breeding carbon-efficient cultivars, and to farmers who seek solutions for storing more C into soils without changing their current practices.

2. Materials and Methods

2.1. Selection of the Plant Material

One hundred wheat genotypes from the International Maize and Wheat Improvement Centre (CIMMYT) were chosen for their genetic variability in terms of rooting abilities and breeding history for drought tolerance. The performance of these genotypes in terms of GY, total biomass production, and biomass allocation to shoots and to roots was evaluated at the University of KwaZulu-Natal (UKZN), Pietermaritzburg, South Africa, under controlled conditions. One experiment was conducted in the field and another one in a greenhouse. Two water regimes were tested in order to enhance the generality of the results.
A subset of 10 genotypes was selected and thereafter planted in the greenhouse to evaluate through 13C multiple pulse labeling variations in the ability to capture atmospheric C and transfer it to crop tissues and to the soil.

2.2. Field Experiment for Grain Yield and Biomass Production

The field experiment was carried out in 2017 during the winter season at the Ukulinga Research farm (Latitude: 29.667°; longitude: 30.406°; and altitude above sea level of 811 m). The 30-year mean annual temperature at Ukulinga is 18 °C and the mean annual precipication is 738 mm.
The soil was classified as Westleigh (Soil Classification Working Group) [24] or Plinthic Acrisols (WRB) [25] and was characterized by a surface Orthic A horizon and a subsurface plinthic B horizon. The A horizon (0–0.3 m) was clay–loamy with a clay content of 28% and an organic content of 2.6%. It was relatively loose (bulk density of 1.04 g cm−3) and acidic (pH = 4.6) (Table 1).
Soil tillage occurred before planting in May 2017 at the end of the dry season with the soil surface being immediately covered with a plastic sheet to control the moisture entering the soil. For planting following a 10 × 10 alpha lattice design with three replicates per genotype, small holes of about 5 cm in diameter were drilled every 10 cm along 30 cm spaced lines. The plot size was 0.24 m2 per genotype per replication for each water regime. In total, the experiment was conducted in 96.0 m2 of land. Three seeds were planted in each hole on May 15th. Each row was constituted by 10 genotypes and was further treated as an incomplete block. The application of 120 kg ha−1 of nitrogen, 30 kg ha−1 of phosphorus and 30 kg ha−1 of potassium was conducted prior to planting followed by 30 kg ha−1 of nitrogen at tillering to stem elongation stage, which is common practice in the area, and crop protection practices followed the recommendations by the Department of Agriculture, Forestry and Fisheries [26].
Drip irrigation was applied throughout the duration of the study for the two treatments. The two treatments were well-watered (75% FC) where the water applied was maintained at 75% field capacity, and water stress (25% FC) where water applied was maintained at 25% of FC. Irrigation was withheld 5 weeks after crop emergence in the drought stress treatment, and was further re-established after the appearance of wilting signs. Irrigation was subsequently withheld before anthesis to mimic drought stress at a key stage of the wheat growing cycle until harvest, which occurred on the 15th of September. Intermittent irrigation was provided to avoid permanent wilting under the drought stress treatment. The amount of water applied, hourly temperature, wind direction and wind speed, and soil water content from 0 to 1 m deep using TDRs every 10 cm depth at 3 locations in each watering treatment were recorded for the duration of the trial to determine water consumption.

2.3. Greenhouse Experiment for Grain Yield and Biomass Production

The first greenhouse experiment, which was performed on the 100 genotypes, was carried out from October 2016 to February 2017. The humidity in the greenhouse was between 55% and 65%, with an average of 11 h of natural day light and daily temperature between 20 and 30 °C. In the 10 × 10 alpha lattice design the 100 genotypes (with 3 replicates per genotype) were randomly assigned to minimize experimental errors associated with location. Five-liter plastic pots with holes at their bottom and were filled with soil material obtained from the 0–30 cm soil layer of the Ukulinga farm. In each pot, 10 seeds were planted and watered to field capacity. Two weeks after germination, the seedlings were adjusted to eight seedlings per pot by removing the two weakest seedlings. The plants were watered and fertilized (300 kg N ha−1 and 200 kg P2O5 ha−1) using drip irrigation. Two water regimes were used: drought-stressed by maintaining soil moisture at 25% field, and a well-watered treatment that maintained a minimum soil moisture at 75% field capacity. Watering to 75% and 25% FC was determined by a soil moisture probe and weighing of a sample of 10 randomly selected pots daily. The drought stress treatments were initiated 6 weeks after growth crop in the greenhouse and maintained by intermittent irrigation to avoid permanent wilting.

2.4. Selection of the Subset of 10 Genotypes

Several agronomic traits were considered. These included (i) number of days from sowing to heading (DTH) when 50% of the plants had fully emerged spikes, (ii) number of days to maturity (DTM) when 50% of the plants were dry, (iii) number of productive tillers (NPT), (iv) grain yield (GY), (v) shoot and root biomass (SB, RB) at harvest after oven drying at 60 °C for 72 h and the resulting root to shoot (R:S) ratio for biomass, and (vi) thousand kernel weight (TKW).
Hierarchical clustering based on phenotypic data from the field and the glasshouse trials combined across water regimes was used to group the 100 genotypes into 10 sub-groups. A Dendrogram of similarities was derived using the Unweighted Pair Group Method with Arithmetic mean algorithm (UPGMA) and, based on this, the genotype with the highest GY and plant biomass (root + shoot) in each sub-group was selected for further carbon studies. In total, 10 genotypes were selected for carbon allocation analyses.

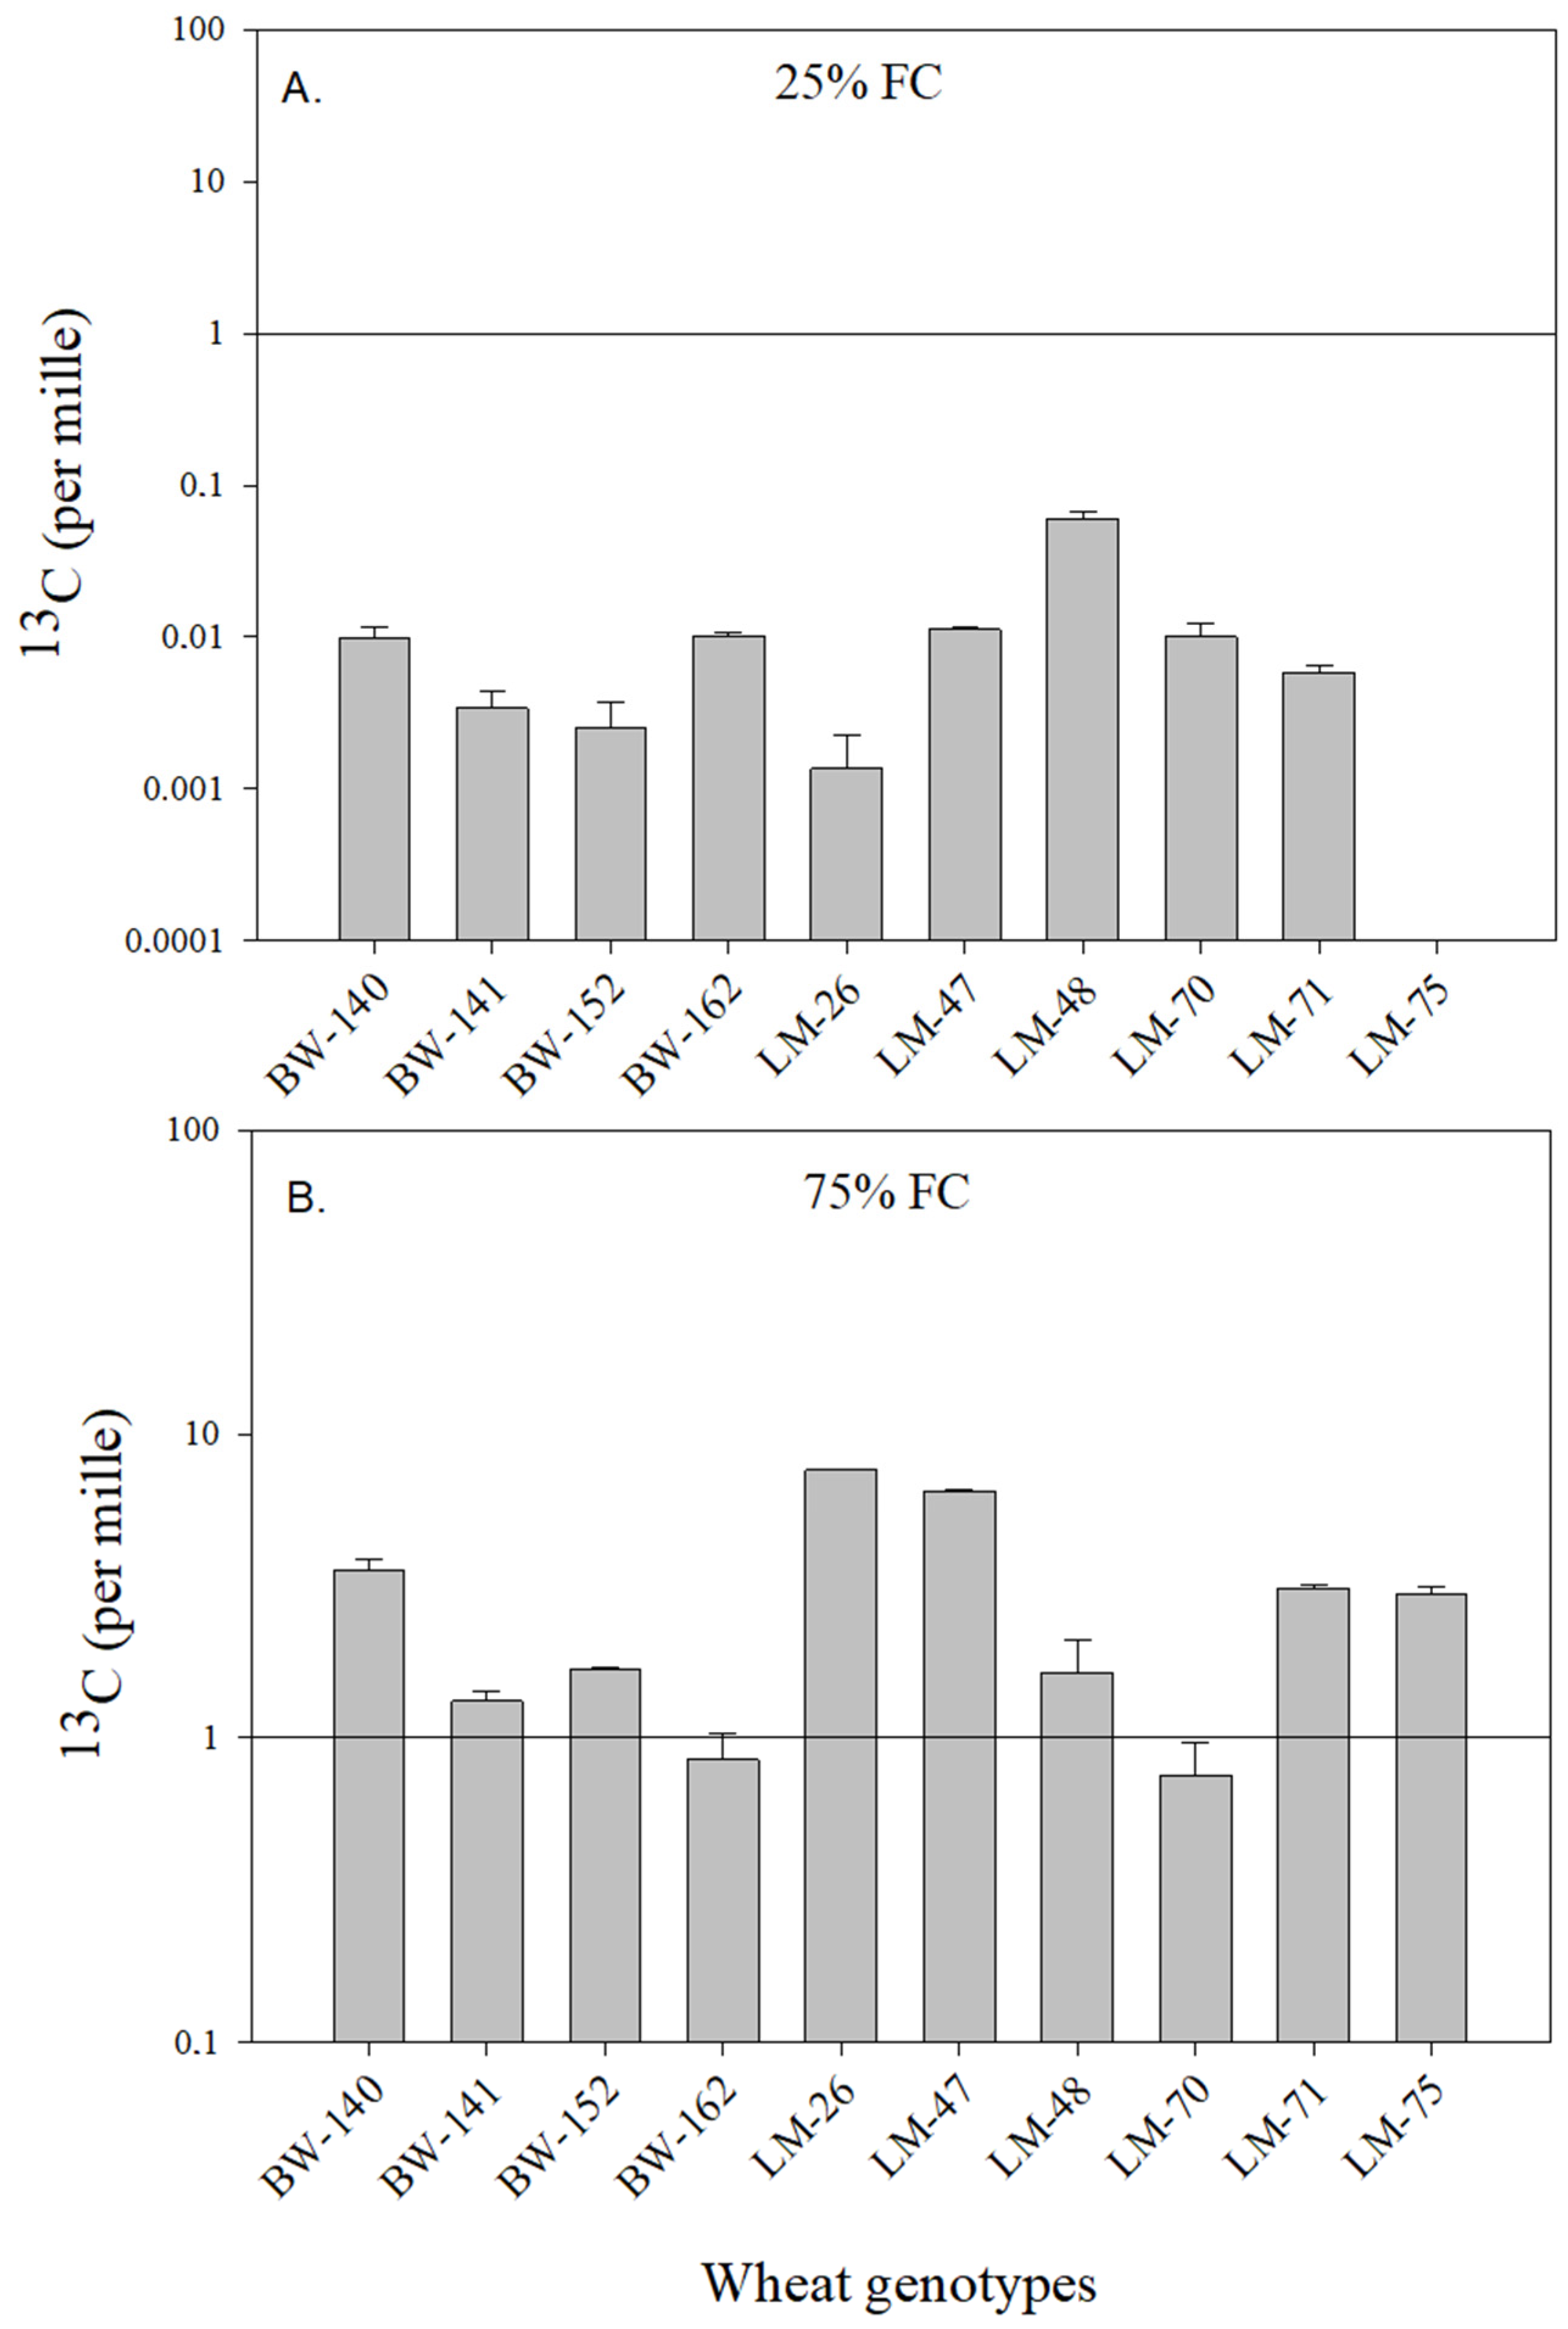
2.5. Assessment of C Transfer to the Soil

The subset of 10 genotypes was considered in a second greenhouse experiment dedicated to assess the variation among the genotypes to transfer atmospheric C into the soil. The genotypes were planted on 13 January 2018 with 3 pots per genotype and per water regime and laid out in a randomized complete block design. The 10 genotypes were treated similarly to the initial 100 genotypes. Similar water regimes (25 and 75% FC) were used and applied at similar stages as previously explained.
Four pulse labelings (i.e., enrichment of stable 13C isotope in the atmosphere during short periods called pulses) were carried out starting from 4 weeks after emergence (9 February, i.e., 27 days after sowing) until maturity (110 days). Each pulse labeling event was performed using a closed system, which consisted of an upper chamber made of plastic sheeting. The chamber was installed in the late afternoon of the day before isotope labeling. Extra fine earth was packed firmly around the base of the chamber to reduce gas leakage. The airtight chamber was 1.2 m long, 0.6 m wide and 1 m high, and was built in a greenhouse where the air temperature was 25 ± 5 °C. The inner surface of the chamber was smeared with anti-fog agent to reduce water vapor condensation during labeling, thus maintaining light intensity and reducing the dissolution of 13CO2 in water drops forming on the chamber’s inner plastic sheet.
The 13C-labeling was achieved by replacing the ambient CO2 in the chamber with 13CO2, as common practice (e.g., Liu et al. [27]). The ambient CO2 from the chamber was trapped in a 1 M NaOH solution in a beaker placed in the center of the chamber. This was performed until the CO2 concentration, monitored by an infrared gas analyzer (EGM-1; Environmental Gas Monitor, PP Systems, Hitchin, UK), reached 10 ppmv. When the ambient CO2 concentration reached 10 ppmv, approximately 5 g Na213CO3 (∼97 atom%) powder was added into a second beaker containing 1 M H2SO4 solution to generate 13CO2 to bring the carbon dioxide concentration back to 450 ppmv. More Na213CO3 powder was added to the H2SO4 solution when necessary to maintain the chamber carbon dioxide concentration at about 450 ppmv. Each labeling process lasted 6 h to ensure sufficiently high 13C abundance in both shoot and root samples compared with unlabeled control samples. The air inside the chamber was circulated by a vertically mounted electric (12 V, 0.21 A) fan placed in the center of the chamber to ensure good distribution of the 13CO2 within the chamber throughout the labeling session. All the chamber carbon dioxide was trapped into the NaOH solution at the end of labeling session before opening the chamber to prevent 13CO2 assimilation by the non-labeled neighboring plants.
The content in 13C in the soil represents the balance between 13C allocation to the soil by the genotypes during the pulse labeling events and C mineralization between the pulse labeling events and soil sampling. Since all wheat genotypes were treated equally, i.e., same ambient CO2 concentration, same 13CO2 pulsing protocol, it is assumed that the differences in 13C allocation to the soil constitute a fair predictor of overall C allocation to the soil, and we assume differences in the temporal dynamics of C allocation to the soil between genotypes, or in the 13C signal of the C allocated, to be secondary, and if not secondary, to be out of scope of the present study.

2.6. Descriptive Variables

2.6.1. Primary Variables

Plant shoots of all experiments were harvested by clipping at the soil surface after crop maturity. Stems and leaves were pooled and used for C analysis. Soil and roots from the pots were separated manually, by stirring the soil–root mixture in a bucket to ensure complete disaggregation of the soil followed by sieving. The plants were cut off at the soil surface to separate above- from belowground biomass. The roots were then manually separated from the soil by gently washing off the soil under running tap-water and using a 2 mm sieve.
All plant and soil materials were dried in an oven at 60 °C for 72 h before weighing and grinding in ceramic mortar. The ground materials were passed through 2 mm sieves. The sieved samples were stored at room temperature prior to analysis for total C and 13C contents.
Grain, shoot and root samples of the 10 selected genotypes were ground to <0.5 mm and analyzed for total C and N in triplicates using a LECO CNS-2000 Dumas dry matter combustion analyzer (LECO Corp., St. Joseph, MI, USA). The organic C content (OCC) was used to estimate C stocks in the different plant parts as follows:
GC S = GY × GC C × b
where GCS is the grain C stock in kg C m−2, GY is the grain yield (g m−2) and GCC is the C concentration in the grain (g C kg−1); b is a constant equal to 0.00001.
SC S = SB × SC C × b
where SCS is the shoot C stock (kg C m−2), SB is the shoot biomass (g m−2) and SCC is the C concentration in the shoots (g C kg−1); b is a constant equal to 0.00001.
RC S = RB × RC C × b
where RCS is the root C stock (kg C m−2), RB is the root biomass (g m−2) and RCC is the C concentration in the roots (g C kg−1); b is a constant equal to 0.00001.
The plant C stocks (PCS) correspond to the sum of the stocks from the different plant parts (e.g., GCS + SCS + RCS for C stocks).
The 13C/12C ratios in the bulk soil sampled immediately after harvest were analyzed using an isotope ratio mass spectrometer (Deltaplus, Finnigan MAT GmbH, Bremen, Germany) coupled with an elemental analyzer (NC 2500, ThermoQuest Italia S.p.A., Milan, Italy) by an interface (ConFlo II, Finnigan MAT GmbH, Bremen, Germany). The natural abundance of 13C in the soil was expressed as 13C (%) relative to Pee Dee Belemnite following Equations (4) and (5):
R sample = ( δ 13 C 1000 + 1 ) × 0.011237
C 13 ( % ) = ( R sample R sample + 1 ) × 100
where Rsample is the isotope ratio (13C/12C) of a sample and 0.011237 is the ratio of 13C/12C in Pee Dee Belemnite; 13C (%) represents the percent of 13C atom in total C atoms in a given sample. Here we considered the difference in soil 13C content before the multiple pulse labeling and after harvest.

2.6.2. Secondary Variables

The water-use efficiency of productivity, typically defined as the ratio of mass produced to the rate of evapotranspiration, was calculated for the selected variables: GY, SB, RB, GCS, SCS, RCS, PCS and 13C (‰). Meteorological data, such as air temperature, air humidity, wind speed, and quantity of water applied through irrigation or natural rains, were recorded using a standard weather station located in the vicinity of the pots. These data were recorded each day to estimate crop evapotranspiration as follows:
ET = ∆W + I + P + CR − D − R
where ET is crop evapotranspiration (mm day−1), ∆W is the change in soil or pot water mass between two consecutive measurements of soil water content (g converted to mm day−1), I is the amount irrigation water applied (mm day−1), P is the amount of rainfall (mm day−1), CR is the capillary rise from the water table to the crop root zone (mm day−1), D is the downward drainage from the crop root zone (mm day−1) and R is the surface runoff (mm day−1). The soils at the open field experiment exhibited high infiltration by water and the water table was below 20 m, hence runoff and capillary contribution from groundwater were ignored. Crop water use efficiency for biomass, C stocks and 13C (‰) was calculated as biomass or C stocks divided by crop total evapotranspiration.

2.6.3. Data Analysis

Descriptive statistics were estimated for the study variables. In addition, data were tested for normality using the Shapiro–Wilk test and homogeneity of variance, and subjected to an analysis of variance (ANOVA) using the general linear model procedure for unbalanced designs. A multivariate procedure for hierarchical clustering was performed based on phenotypic data from the field and greenhouse trials combined across water regimes to group the genotypes based on their similarities. Principal Component Analysis (PCA) was performed to depict the multiple relationships between plant biomass, C allocation and stocks, and C transfer to the soil. The PCA axes were generated using 13C content in the different plant parts and the other variables of plant biomass and plant C, based on mean values across the field and greenhouse experiments.

3. Results

3.1. Variations in Grain Yield and Plant Biomass Amongst the 100 Genotypes

The overall average GY of the initial set of 100 genotypes, across the open-field and glasshouse trials for both water regimes, was 1387 g m−2 with a standard error of ± 84 g m−2 (Table 2). GY varied by a factor of 62, from a minimum of 75 g m−2 to a maximum of 4696 g m−2, and showed a positively skewed distribution (Skew = 1.53). Total plant biomass (PB) among the 100 genotypes was much less variable than GY as values ranged from 1967 to 13,528 g m−2, a difference of only 6.8 times, which was significant at p < 0.001. The 100 genotypes had an average R:S for biomass of 0.12, with values from 0.03 to 0.38 (Table 2).
In addition, the mean GY of the 10 selected genotypes in the glasshouse increased from 326 g m−2 at 25% FC to 414 g m−2 at 75% FC, which corresponded to a 27% increase (Table 3). In the open field, the overall increase was from 1700 gm−2 at 25% FC to 2062 g m−2 at 75% FC, i.e., a 21% increase. A similar trend of greater overall mean values of the 10 selected genotypes at 75% FC as compared to 25% FC was observed for all the biomass variables studied. For instance, the overall mean PB of the 10 genotypes decreased in the glasshouse from 6289 gm−2 at 75% FC to 2992 gm−2 at 25% FC, as did the overall mean R:S of the 10 genotypes, from 0.57 to 0.43 (Table 3). Overall, the impact of water regime was significant for all the studied variables (Table 4).
The dendrogram generated from UPGMA using the results from the two water regimes and conditions (field and greenhouse) revealed two major distinct clusters of the 100 wheat genotypes based on their similarity in agronomic performance (Figure 1). The first cluster comprised 97 genotypes, and was further divided into subgroups A and B. Sub-cluster A was further divided into four sub-sub-clusters comprising genotypes such as LM26, BW141, BW140, LM70 and LM48. Sub-cluster B was further divided into two sub-sub-clusters with genotypes such as BW152, LM47, LM75, BW162 and LM71. Mean values of the selected phenotypic variables for each of the 10 clusters and for all experiments are displayed in Table 5. The highest grain yields were obtained for B1 (706 g m−2), followed by B22 (695 g m−2), while the poorest-performing cluster was C (215 g m−2). The greatest plant biomass was also observed for B1 (2218 g m−2) and the highest R:S ratio for C, at 0.82. In contrast, the lowest plant biomass was found for A12, and the lowest R:S (0.44) for A11, A12 and B21 (Table 5).

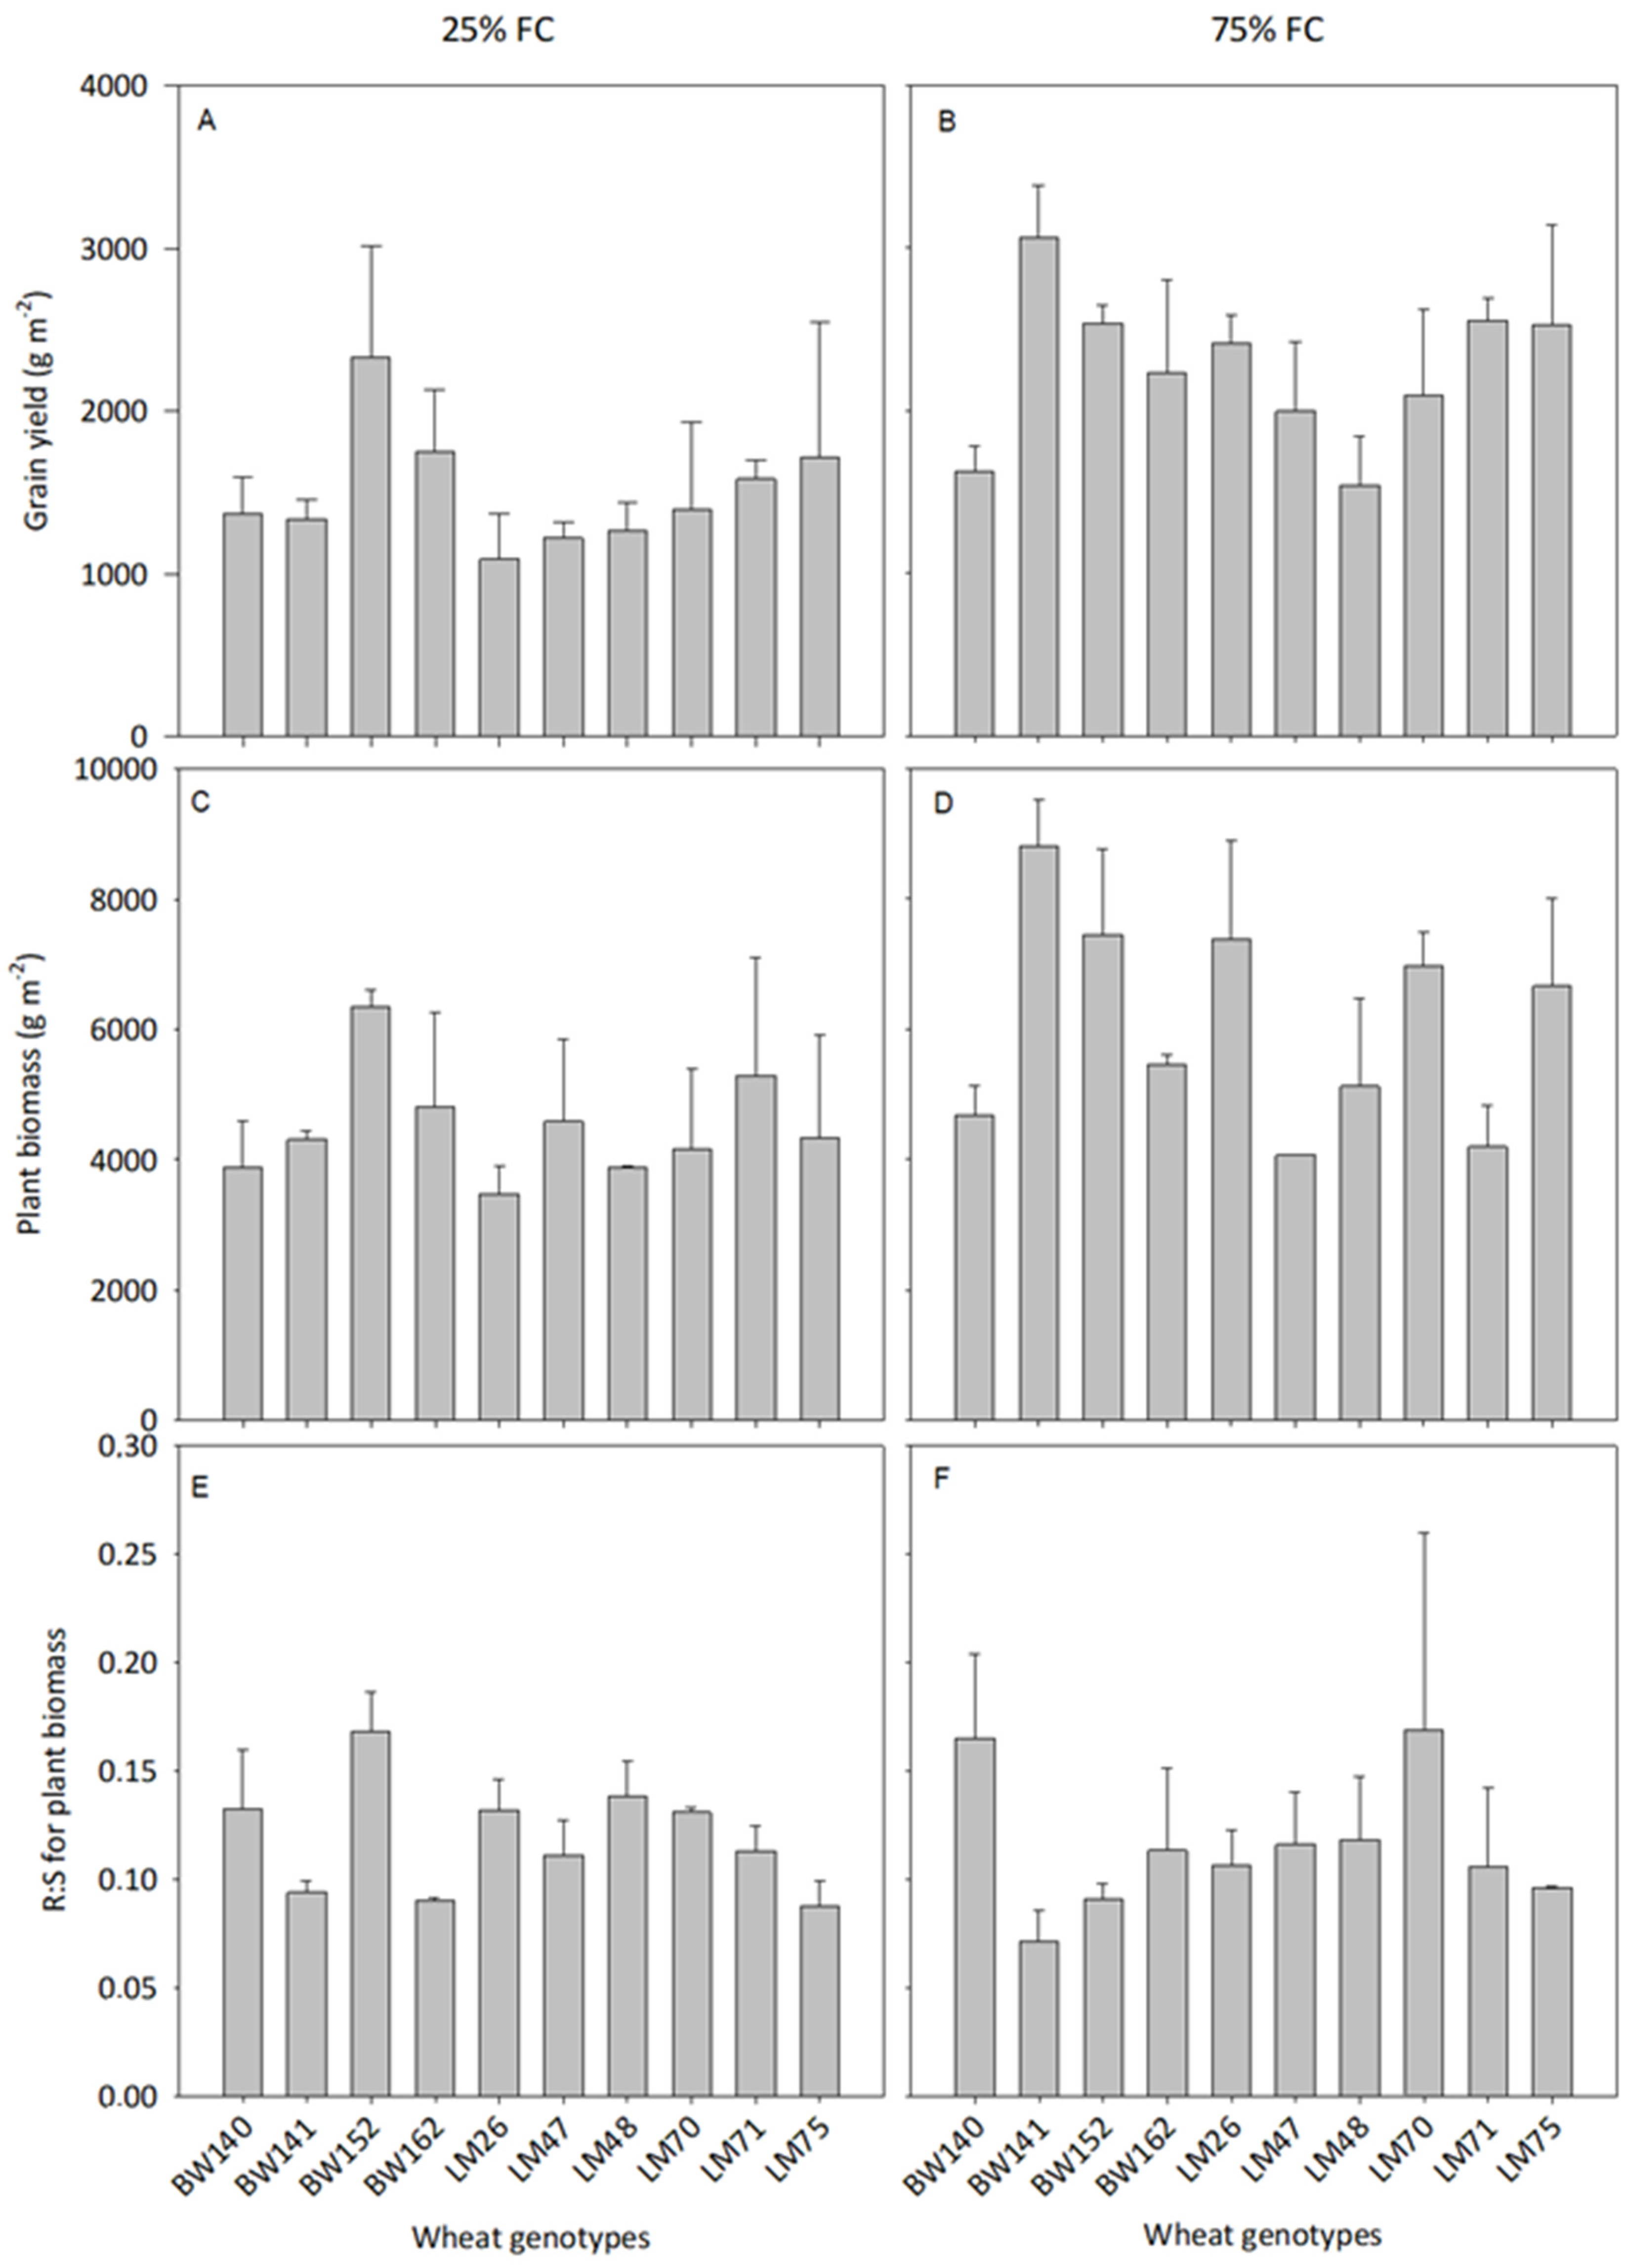
3.2. Variations Amongst the 10 Best Performing Genotypes

The best-performing genotype in terms of plant biomass of each of the 10 clusters was selected for further investigation. The plant biomass variables are displayed in Figure 2 for the field experiments and in Figure 3 for the glasshouse experiments. In the field and under drought stress, BW152 was the highest grain-yielding amongst the 10 selected genotypes, with 2330 g m−2, followed by BW162 (1748 g m−2), LM75 (1716 g m−2) and LM71 (1582 g m−2), while LM26 was the worst one (1088 g m−2) (Figure 2). Plant biomass ranged between 3471 g m−2 for LM26 and 6351 g m−2 for BW152, and the R:S varied between 0.087 for LM75 and 0.17 for BW152. Under 75% FC, BW141 ranked first for GY at 3061 g m−2, and LM71 was second at 2554 g m−2, immediately followed by LM75 (2530 g m−2). Seven genotypes had a GY over 2000 g m−2. BW141 had the highest PB, followed by BW152, LM26, LM70 and LM75 (Figure 2). R:S varied between 0.071 for BW141 and 0.17 for LM70.
Greenhouse GY values were significantly lower than in the field, with values from 170 g m−2 for BW162 to 490 g m−2 for LM75 under 25% FC, and from 195 g m−2 for BW141 to 815 g m−2 for LM75 under 75% FC. BW162 and BW140 had the highest RB under well-watered conditions, while LM26 and BW162 ranked first for water-stressed conditions.
From Figure 3, we can see that LM75 was on average the most water-efficient genotype in terms of GY, shoot and plant biomass and carbon stocks, but ranked second in terms of water use efficiency for RB. In contrast, LM47, which ranked second for water use efficiency (WUE) in terms of GY, was the least efficient genotype for RB. BW162 and BW140 were the most water-efficient for RB.

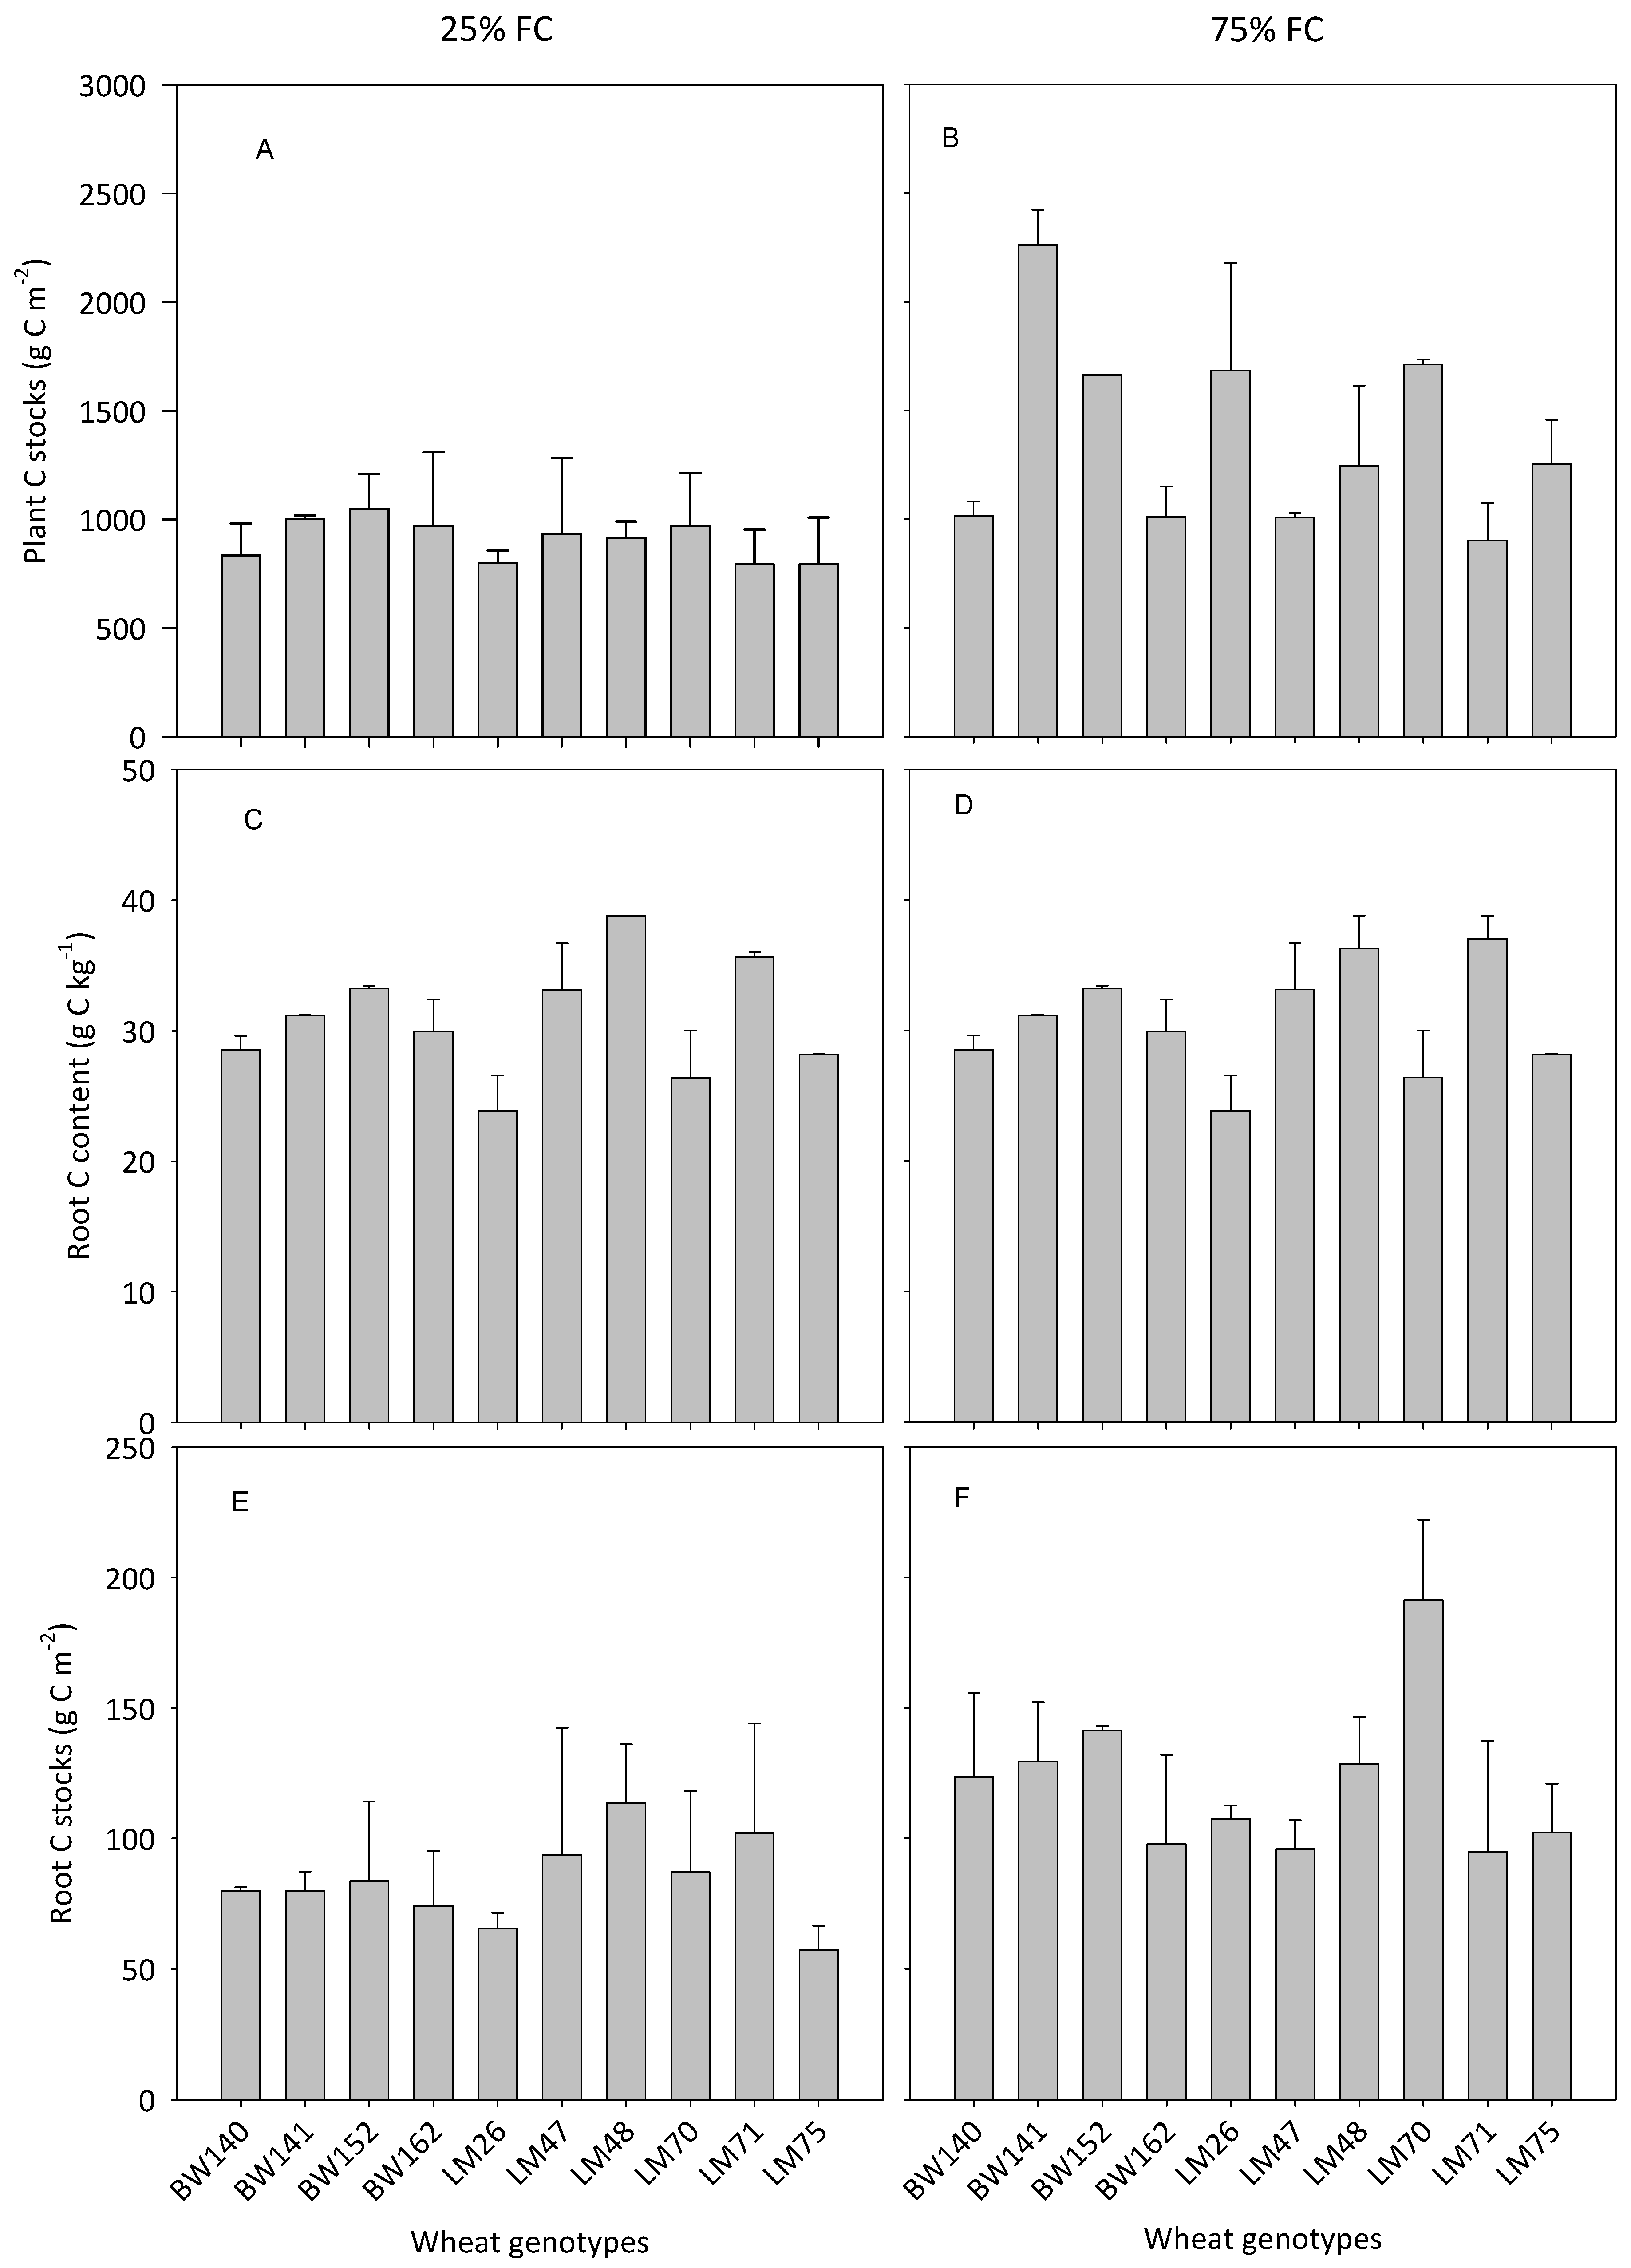
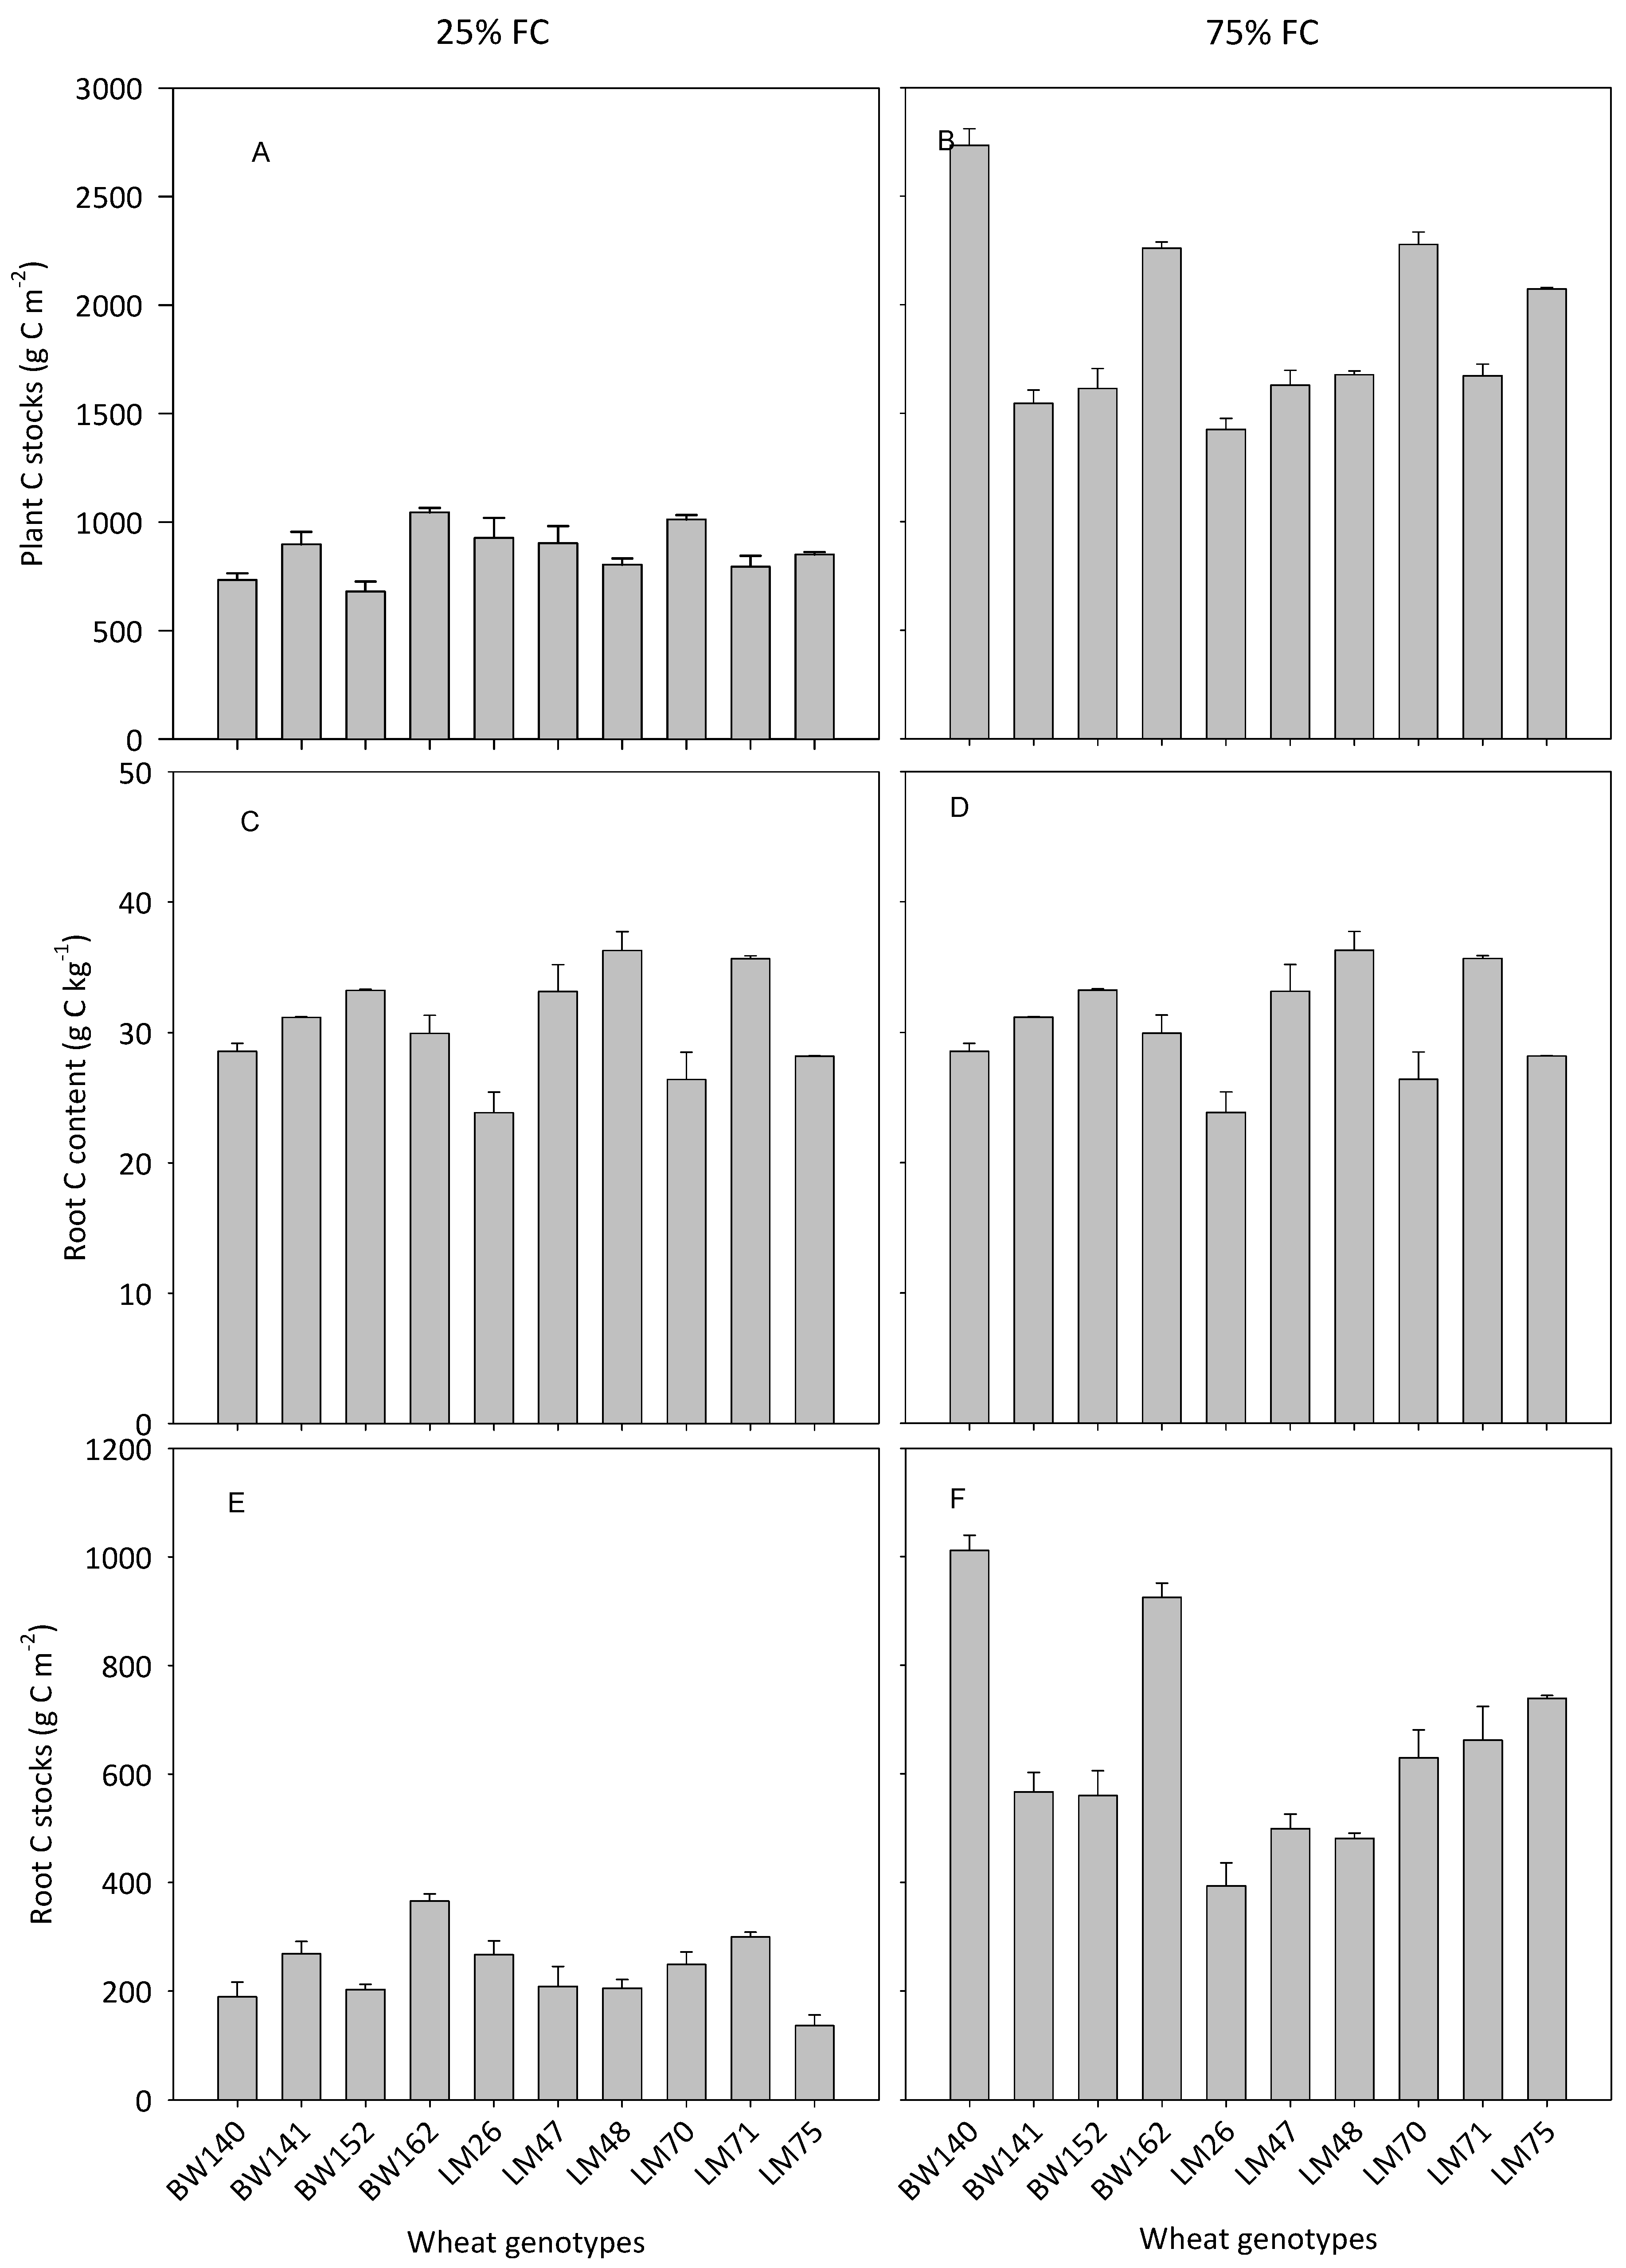
3.3. Variations in Below- and Aboveground C Allocation among the Selected Genotypes

The average C content of the selected 10 genotypes was 34 ± 0.9% in the shoots (SCC), which decreased to 30 ± 1.1% in the roots (RCC) (Table 3), corresponding to a significant difference at p < 0.05. SCC ranged from 30 to 37%, while RCc varied from 21 to 39%, with all the differences being significant at p < 0.05. Plant C stocks (PCs) exhibited large variations between the tested genotypes, with a mean value from all experiments of 1174± 64 g m−2. The values ranged from 582 g m−2 (in the field and under 25% FC) to 3022 g m−2 (field and 75% FC), i.e., a 5-fold difference. From Table 3, we also learn that the distribution of plant C stocks (PCS) was positively skewed (skewness = 4.7), with most of the PCS being found in shoots (91%) rather than in roots (9%).
In the field, plant C stocks (PCs) under 25% FC were the highest for BW 152 (1059 g C m−2) and BW 141 (1004 g C m−2), while four genotypes had values below 850 g C m−2 (BW140, LM26, LM75 and LM71) (Figure 4). PCs under 75% FC were the highest for BW141 (2260 g C m−2), followed by LM70 (1712 g C m−2), LM26 (1684 g C m−2) and BW152 (1663 g C m−2), the lowest values being found for LM71 (901). Under glasshouse conditions, PCs under 25% FC were the highest for BW162 (1043 g C m−2) and LM70 (1012 g C m−2), and the lowest for BW152 (679 g C m−2), LM140 (732 g C m−2) and LM71 (794 g C m−2) (Figure 5). Under 75% FC, BW140 ranked first for PCs (2733 g C m−2), followed by BW162 (2259 g C m−2), LM70 (2277 g C m−2) and LM75 (2072 g C m−2), while all the other cultivars had significantly lower PCs.
Excess 13C in the soil after harvesting as compared to the bulk soil at sowing was significantly higher under well-watered than under dry conditions (3.0 ± 0.16‰ vs. 0.011 ± 0.0018‰) (Figure 6). Under water-stressed conditions, excess 13C ranged between 0‰ for LM-75 and 0.059‰ for LM-48, but even though these differences were significant, they remained very close to zero (Figure 4). In contrast, the soil 13C content of the well-watered treatment ranged between 0.75 ± 0.21‰ for LM-70 and 7.58 ± 0.058‰ for LM-26, which corresponded to a 1006% difference, significant at the p < 0.05 level (Figure 4). Contents over 3‰ also appeared for LM-71 (3.1‰), BW-140 (3.5‰), and LM-47 (6.5‰), while contents below 3‰ occurred for LM-75 (2.9‰), LM-48, BW-152 (1.6‰), BW-141 (1.3‰) and BW-162 (0.84‰) (Figure 6).

4. Discussion

4.1. Large Variations in Below- and Aboveground C Allocation among the Selected Genotypes

The results point to a maximum 102% difference in wheat C stocks between the studied cultivars, the poorest-performing one storing 592 g C m−2 under drought conditions and 1324 g C m−2 under well-watered conditions, while the best-performing cultivar allocated 1109 and 2881 g C m−2, respectively.
Such a difference in the ability of cultivars to allocate C in their body was unexpected. Our investigations show that the “carbon superior” cultivars had higher total biomass (grain, shoot and root) and greater concentrations of C in the biomass.
Large variations in total biomass production among cultivars agree with reports by Nevo and Chen [28], Waines et al. [29], and more recently by Akman et al. [30] and Fang et al. [15], and can be explained by differences in genotypic characteristics leading to variations in the production and the storage of assimilates by photosynthesis.
The higher shoot biomass C of some cultivars can most likely be explained by a greater ability for C uptake, and the ability of the phloem to transport the C compounds belowground, probably as a result of a greater pressure applied to the flow system and a higher size and continuity of the “tubes” that allow C to be transported over long distances (Liu et al. [27]). Wide differences were also observed in the ability of the genotypes to allocate C into their roots, as shown by a 3.7-times difference between the lowest and the highest root C stocks. This translated into wide variations in R:S for C stocks (CV of 34% with values between 0.15 and 0.70), which was also most unexpected, as wheat genotypes have been shown so far to only slightly vary in their biomass allocation to roots with, for instance, Fang et al. [15] pointing to ratios between 1 and 1.36.
Such considerable variations in root traits among genotypes have been previously suggested [31,32], and the higher allocation of biomass and plant C in the roots of the selected CIMMYT genotypes might be explained by the fact that these have been developed for heat and drought tolerance, for which the root system is key. The impacts of drought stress on sensitive genotypes include stomatal closure, high root death, compromised cell membranes and reduced mesophyll conductance [33,34]. These changes may cause leakages of cell sap, reduced enzyme activity, reduced photosynthetic activity and ultimately the low transportation of photosynthates to plant organs and rhizodeposition [35]. However, these effects are less pronounced in drought-tolerant genotypes, which could explain the significantly higher biomass productivity and C content in the CIMMYT heat- and drought-tolerant genotypes compared to the other genotypes in the test population. Lavinsky et al. [36] found that drought-tolerant maize reduced starch and total soluble sugar production, while increasing the production of phenolics, which helped in avoiding excessive losses of water and the collapse of the xylem vessels. This ensured that photosynthesis was maintained at a higher rate compared to the drought-sensitive genotypes, whose photosynthetic capacity decline, as evidenced by reductions in lignin content, grain yield and biomass allocation to roots and shoots. These mechanisms could also have been used by the CIMMYT heat- and drought-tolerant varieties, since maize and wheat share a common ancestry and their physiology is largely governed by syntenic genes. In contrast, Aljazairi [37] indicated that modern genotypes tend to invest more C in their spikes than the traditional genotypes, which invested more C in non-reproductive shoot tissues such as roots, thus probably explaining the low variability in RB observed in previous studies. Interestingly, van der Graaff et al. [38] reported an R:S of 0.6 for the wild genotype, as compared to 0.3 for a modern one. Not only did the present study point to a higher range of R:S values, but it also indicates the higher C translocation to roots and potentially to soils than previously though [27].
The average root C content was 33% in shoots and 31% in roots, which are low, as Poaceas generally exhibit shoot C contents in the 40–45% range. A meta-analysis study on world data showed that the mean C content was 45% in shoots and 41% in roots [10]. However, the values in the present study differed highly, for instance in the glasshouse from 25% to 37% in shoots, and from 21% to 39% in roots. The low C content values were lower than our expectations. However, deviations from expected values in mineral content have been reported as a function of soil or environmental conditions affecting nutrient uptake and plant development. Gavito et al. [39] found that soil temperature, atmospheric CO2 concentration and soil nitrogen content had significant interactive effects on N and P acquisition and content in plant biomass. Rengel [40] also indicated that C and other mineral contents in crops change with differences in genotype and soil conditions.
The existence of large C content differences between crop cultivars and between crop parts (stems vs. roots) is similar to reports by Corneo et al. [31], and might be explained by different abilities to produce C compounds, such as lignin of high C:N. In support, Luquet et al. [41] showed for instance that the lignin content in stems is positively correlated with plant height, because lignin has a high tensile strength, which is required to support tall plants. The differences in plant height among the test genotypes would indicate that they have different lignin contents, and thus the C content would vary widely.

4.2. Variations in the Ability of Wheat Genotypes to Transfer Atmospheric C into the Soil

Several reasons might be given to explain the differences in C translocation to soils by the studied cultivars, where a 1006% maximum difference was observed. These are likely to involve differences in the supply of assimilates to roots as mentioned above, but also differences in: (1) the ability of roots to exudate C to the rhizosphere while limiting respiration; (2) the capacity of exudates to be stabilized, either adsorbed by clay particles or assimilated by mycorrhizal fungi and other rhizosphere microorganisms from the rhizosphere [42]. A further process (3), which mostly occurs at later stages, after harvest, is the ability of root tissues to become stable organic matter following decomposition [43,44].
Several other reasons might explain the differences in C transfer into the soil of the different genotypes. Hütsch et al. [45] showed that cereal root exudates, which are 80% water-soluble (64% carbohydrates, 22% amino acids and 14% organic acids), are rapidly (1–2 days) stabilized into water-insoluble forms and bound preferentially to clay particles. Warembourg and Estelrich [46] also indicated that only 13% to 21% of total root exudates are found in the soil matrix as water-insoluble or stable organic matter. The present study, which involved soil sampling after harvest, weeks after the last pulse labeling occurred, thus most likely identifies the presence in the soil of water-insoluble forms of organic matter. Genotypes such as LM47 and LM48 showed a superior ability to produce water-insoluble organic matter in the soil, which we estimated to be about 30% higher than the least efficient genotypes. The underlying reasons are still unknown. Do these cultivars produce higher amounts of root exudates? Are these exudates of higher stability (high C:N)? Do exudates support a rhizobiome that is enhancing the biological, chemical and physical C stabilization in soils? What genetic factors are associated with this? These are important research questions to be investigated. Moreover, increased C transfer to the soil, as we estimated for certain genotypes, might induce a detrimental effect for soil organic matter. Indeed, the production of root exudates by the best C genotypes could, indeed, stimulate microbial activity and accelerate the turnover of soil organic matter [47], a process known as the “priming effect”, where soil organic matter (SOM) decomposition is stimulated by the addition of labile substrates to the soil. However, this process might be limited because exudate stabilization is quick, and a large fraction of root exudates become stable organic matter [46]. Finally, the large amounts of dead root and shoot material produced by LM48 and LM47 might also become important sources of soil organic matter, hence their contribution to total soil organic matter should also be further investigated.
A high level of C translocation to the soil was observed for LM47, which was also one of the highest grain-yielding cultivars, ranking 2nd out of the 10 studied cultivars. This points out that in spite of water supply, this cultivar not only showed an efficient production of sugars but also an optimized transfer belowground and to the soil.

4.3. Impact of Soil Water Availability on Plant C Storage and C Transfer to the Soil

Overall, water stress decreased wheat’s ability to allocate C into the soil. There was an average 2.2-fold decrease in plant C stocks following water stress, and the decrease was more acute for root C stocks (2.7-fold) than shoot C stocks (1.9-fold). Such a decrease in plant C stocks is not explained by changes in C content in body parts, but by a decrease in biomass. As water becomes less available, plants tend to respond by reducing the stem height and diameter, as well as the dry weight [48], with cell elongation being more impacted than cell division [49]. As the content of water in stem cells decreases, there is an increase in the content of soluble sugars to maintain tissue turgor, and consequently, less of it is transported belowground as reserves in roots [41]. Such an adaptation mechanism to drought is likely to explain the sharper decrease in root C stocks than in shoot C stocks following water stress.
In addition, not only did water stress decrease root C stocks, but it also tended to significantly decrease C transfers to the soil, and to lessen the differences between cultivars. In water-stressed conditions, the excess soil 13C content only differed by less than half a percent among the genotypes, while the difference increased to 21% under well-watered conditions. This is likely to be due to a shortage of exudate supply to the soil for all cultivars as water becomes scarce.
From the PCA, there was a trend for C transfer to the soil to increase with R:S. This may be explained by the fact that the more a plant builds roots, the more carbon is exudated to the soil, thus calling for breeding strategies enhancing the R:S ratio. LM47 could thus be considered as a “carbon superior” wheat cultivar since it induced the highest C transfer to the soil. It interestingly exhibited the highest root C content amongst the cultivars, while it ranked second in terms of GY. The latter is a very promising result, pointing out that the objectives of grain production and soil C sequestration are not necessarily antinomic.
The present study showed that drought stress significantly affected C translocation to roots and to the soil. Indeed, not only is the production of photosynthesis products reduced, but its transport from leaf to roots is too, as previously demonstrated [50].

5. Conclusions

Three main conclusions can be drawn from this study that investigated the ability of 100 wheat cultivars from the CIMMYT gene bank to transfer atmospheric carbon (C) into soils. The first conclusion is that wheat genotypes highly differed in their ability to allocate C into the soil, with differences of up to 1006%. The second conclusion is that C allocation to soil was highly correlated with soil water availability, with greater allocation under well-watered soil conditions. The third conclusion is that soil C transfer tended to increase with the increase in plant biomass and biomass allocation to roots, and this was not systematically to the detriment of grain yield. These findings point out the enormous potential of the available genetic resources in wheat to meet the multiple objectives of grain and biomass production, the sustainable use of soils, and climate mitigation and adaptation. Such an improved understanding of the links between plant characteristics and soil C storage may open up opportunities for wheat breeding with multiple objectives in mind. Research on the mechanisms of the decomposition of roots, as well as of aboveground post-harvest biomass, with management that addresses farmers’ needs, is also required. As the results were obtained under clay–loam conditions in South Africa, confirmation of the trends should be made under different soil conditions and climates. In addition, further research on the factors that control the transfer and storage of atmospheric C into soils is still important. Amongst the emerging research questions that may need to be addressed in the near future are: How does a cultivar’s physiology affect the transfer of carbohydrates to the soil and their incorporation into stable organic matter? What are the exact differences in C input to the soil amongst the cultivars at the level of the entire wheat-growing cycle? What role do exudates play in C translocation to soils, as well as their quantity and quality?

Author Contributions

Conceptualization and methodology, V.C. and H.S.; investigation, data curation, I.M. and A.C.; writing, review and editing by all authors. All authors have read and agreed to the published version of the manuscript.

Funding

This research was funded by the South African Water Research Commission (WRC) Project No. K5-2721-4.

Institutional Review Board Statement

The study did not require ethical approval.

Informed Consent Statement

Not applicable.

Data Availability Statement

All available data are present in the resent paper.

Acknowledgments

The authors appreciate the funding from the South African Water Research Commission (WRC) Project No. K5-2721-4 and the National Research Foundation (NRF) of South Africa. This manuscript is based upon a report to the funders entitled “WATER USE EFFICIENCY AND CARBON SEQUESTRATION POTENTIAL OF INDIGENOUS CROPS”. We would also like to acknowledge technical support from The African Centre for Crop Improvement (ACCI).

Conflicts of Interest

The authors declare no conflict of interest.

References

  1. Sanderman, J.; Hengl, T.; Fiske, G.J. Soil carbon debt of 12,000 years of human land use. Proc. Natl. Acad. Sci. USA 2017, 114, 9575–9580. [Google Scholar] [CrossRef] [Green Version]
  2. Pandey, Y.; Vyas, R.P.; Kumar, J.; Singh, L.; Singh, H.C.; Yadav, P.C. Heritability, Correlation and Path Coefficient Analysis for Determining Interrelationships among Grain Yield and Related characters in Maize (Zea mays L.). Int. J. Pure App. Biosci. 2017, 5, 595–603. [Google Scholar] [CrossRef]
  3. Ray, J.D.; Gesch, R.W.; Sinclair, T.R.; Allen, L.H. The effect of vapor pressure deficit on maize transpiration response to drying soil. Plant Soil 2002, 239, 113–121. [Google Scholar] [CrossRef]
  4. Smith, M.R.; Myers, S.S. Impact of anthropogenic CO2 emissions on global human nutrition. Nat. Clim. Chang. 2018, 8, 834. [Google Scholar] [CrossRef]
  5. Minasny, B.; Malone, B.P.; McBratney, A.B.; Angers, D.A.; Arrouays, D.; Chambers, A.; Chaplot, V.; Chen, Z.-S.; Cheng, K.; Bhabani, S.; et al. Soil carbon 4 per mille. Geoderma 2017, 292, 59–86. [Google Scholar] [CrossRef]
  6. Rasse, D.P.; Rumpel, C.; Dignac, M.-F. Is soil carbon mostly root carbon? Mechanisms for a specific stabilization. Plant Soil 2005, 269, 341–356. [Google Scholar] [CrossRef]
  7. Yang, Y.; Fang, J.; Ji, C.; Ma, W.; Mohammat, A.; Wang, S.; Smith, P. Widespread decreases in topsoil inorganic carbon stocks across China’s grasslands during 1980s–2000s. Glob. Chang. Biol. 2012, 18, 3672–3680. [Google Scholar] [CrossRef]
  8. Hirte, J.; Leifeld, J.; Abiven, S.; Oberholzer, H.-R.; Mayer, J. Below ground carbon inputs to soil via root biomass and rhizodeposition of field-grown maize and wheat at harvest are independent of net primary productivity. Agric. Ecosyst. Environ. 2018, 265, 556–566. [Google Scholar] [CrossRef]
  9. Lynch, J.P.; Wojciechowski, T. Opportunities and challenges in the subsoil: Pathways to deeper rooted crops. J. Exp. Bot. 2015, 66, 2199–2210. [Google Scholar] [CrossRef] [Green Version]
  10. Mathew, I.; Shimelis, H.; Mutema, M.; Chaplot, V. What crop type for atmospheric carbon sequestration: Results from a global data analysis. Agric. Ecosyst. Environ. 2017, 243, 34–46. [Google Scholar] [CrossRef]
  11. Mathew, I.; Shimelis, H.; Mutema, M.; Minasny, B.; Chaplot, V. Crops for increasing soil organic carbon stocks—A global meta analysis. Geoderma 2020, 367, 114230. [Google Scholar] [CrossRef]
  12. Amanullah, Jr.; Stewart, B.A. Dry matter partitioning, growth analysis and water use efficiency response of oats (Avena sativa L.) to excessive nitrogen and phosphorus application. J. Agr. Sci. Tech. 2013, 15, 479–489. [Google Scholar]
  13. Yang, C.H.; Chai, Q.; Huang, G.B. Root distribution and yield responses of wheat/maize intercropping to alternate irrigation in the arid areas of northwest China. Plant Soil Environ. 2010, 56, 253–262. [Google Scholar] [CrossRef] [Green Version]
  14. Bolinder, M.A.; Angers, D.A.; Dubuc, J.P. Estimating shoot to root ratios and annual carbon inputs in soils for cereal crops. Agric. Ecosyst. Environ. 1997, 63, 61–66. [Google Scholar] [CrossRef]
  15. Fang, Y.; Du, Y.; Wang, J.; Wu, A.; Qiao, S.; Xu, B.; Chen, Y. Moderate drought stress affected root growth and grain yield in old, modern and newly released cultivars of winter wheat. Front. Plant Sci. 2017, 8, 672. [Google Scholar] [CrossRef] [PubMed] [Green Version]
  16. Siddique, K.H.M.; Belford, R.K.; Tennant, D. Root: Shoot ratios of old and modern, tall and semi-dwarf wheats in a Mediterranean environment. Plant Soil 1990, 121, 89–98. [Google Scholar] [CrossRef]
  17. Paustian, K.; Lehmann, J.; Ogle, S.; Reay, D.; Robertson, G.P.; Smith, P. Climate-smart soils. Nature 2016, 532, 49–57. [Google Scholar] [CrossRef] [Green Version]
  18. Pausch, J.; Kuzyakov, Y. Carbon input by roots into the soil: Quantification of rhizodeposition from root to ecosystem scale. Glob. Chang. Biol. 2018, 24, 1–12. [Google Scholar] [CrossRef]
  19. Kuzyakov, Y.; Domanski, G. Carbon input by plants into the soil. Review. J. Plant Nutr. Soil Sci. 2000, 163, 421–431. [Google Scholar] [CrossRef]
  20. Kaštovská, E.; Šantrůčková, H. Fate and dynamics of recently fixed C in pasture plant-soil system under field conditions. Plant Soil 2007, 300, 61–69. [Google Scholar] [CrossRef]
  21. Rangel-Castro, J.I.; Killham, K.; Ostle, N.; Nicol, G.W.; Anderson, I.C.; Scrimgeour, C.M. Stable isotope probing analysis of the influence of liming on root exudates utilization by soil microorganisms. Environ. Microbiol. 2005, 7, 828–838. [Google Scholar] [CrossRef] [PubMed]
  22. De Neergaard, A.; Gorissen, A. Carbon allocation to roots, rhizodeposits and soil after pulse labeling: A comparison of white clover (Trifolium repens L.) and perennial ryegrass (Lolium perenne L.). Biol. Fertil. Soils 2004, 39, 228–234. [Google Scholar] [CrossRef]
  23. Brüggemann, E.N.; Gessler, A.; Kayler, Z.; Keel, S.G.; Badeck, F.; Barthel, M.; Boeckx, P.; Buchmann, N.; Brugnoli, E.; Esperschütz, J.; et al. Carbon allocation and carbon isotope fluxes in the plant-soil-atmosphere continuum: A review. Biogeosciences 2011, 8, 3457–3489. [Google Scholar] [CrossRef] [Green Version]
  24. Soil Classification Working Group. Soil Classification—A Taxonomic System for South Africa; Department of Agricultural Development: Pretoria, South Africa, 1991. [Google Scholar]
  25. IUSS Working Group WRB. World Reference Base for Soil Resources. A Framework for International Classification, Correlation and Communication; World Soil Resources Report No. 103; FAO: Rome, Italy, 2006. [Google Scholar]
  26. DAFF. Wheat Production Guideline; Department of Agriculture, Forestry and Fisheries: Pretoria, South Africa, 2010. [Google Scholar]
  27. Liu, X.; Bonhomme, J.; Merbach, I.; Kümmel, S.; Richnow, H.H. Uptake of a-HCH by wheat from the gas phase and translocation to soil analyzed by a stable carbon isotope labeling experiment. Chemosphere 2021, 264, 128489. [Google Scholar] [CrossRef] [PubMed]
  28. Nevo, E.; Chen, G. Drought and salt tolerances in wild relatives for wheat and barley improvement. Plant Cell Environ. 2010, 33, 670–685. [Google Scholar] [CrossRef] [PubMed]
  29. Waines, J.G. Determination of Optimum Root and Shoot Size in Bread Wheat for Increased Water and Nutrient Use Efficiency and Grain Yield; Report to California Wheat Commission: GH 2011–2012 Experiments; California Wheat Commission: Woodland, CA, USA, 2012. [Google Scholar]
  30. Akman, H.; Akgün, N.; Tamkoç, A. Comparison of root and shoot traits of different wheat species and wild wheat relatives: Does feature of shoot biomass have positive and significant relationships with grain yield and root traits? Rev. Fac. Agron. 2017, 34, 428–447. [Google Scholar]
  31. Corneo, P.E.; Suenaga, H.; Kertesz, M.A.; Dijkstra, F.A. Effect of twenty four wheat genotypes on soil biochemical 734 and microbial properties. Plant Soil. 2016, 404, 141–155. [Google Scholar] [CrossRef]
  32. Comas, L.H.; Becker, S.R.; Cruz, V.M.V.; Byrne, P.F.; Dierig, D.A. Root traits contributing to plant productivity under drought. Front. Plant Sci. 2013, 4, 442. [Google Scholar] [CrossRef] [Green Version]
  33. Grassi, G.; Magnani, F. Stomatal, mesophyll conductance and biochemical limitations to photosynthesis as affected by drought and leaf ontogeny in ash and oak trees. Plant Cell Environ. 2005, 28, 834–849. [Google Scholar] [CrossRef]
  34. Henry, A.; Doucette, W.; Norton, J.; Bugbee, B. Changes in crested wheatgrass root exudation caused by flood, drought, and nutrient stress. J. Environ. Qual. 2007, 36, 904–912. [Google Scholar] [CrossRef] [Green Version]
  35. Canarini, A.; Merchant, A.; Dijkstra, F.A. Drought effects on Helianthus annuus and Glycine max metabolites: From phloem to root exudates. Rhizosphere 2016, 2, 85–97. [Google Scholar] [CrossRef]
  36. Lavinsky, A.O.; Magalhães, P.C.; Ávila, R.G.; Diniz, M.M.; De Souza, T.C. Partitioning between primary and secondary metabolism of carbon allocated to roots in four maize genotypes under water deficit and its effects on productivity. Crop J. 2015, 3, 379–386. [Google Scholar] [CrossRef] [Green Version]
  37. Aljazairi, S.; Arias, C.; Nogues, S. Carbon and nitrogen allocation and partitioning in traditional and modern wheat genotypes under pre-industrial and future CO2 conditions. Plant Biol. 2015, 17, 647–659. [Google Scholar] [CrossRef] [PubMed] [Green Version]
  38. Van der Graaff, E.; Laux, T.; Rensing, S.A. The WUS homeobox-containing (WOX) protein family. Genome Biol. 2009, 10, 248. [Google Scholar] [CrossRef] [PubMed]
  39. Gavito, M.E.; Curtis, P.S.; Mikkelsen, T.N.; Jakobsen, I. Interactive effects of soil temperature, atmospheric carbon dioxide and soil N on root development, biomass and nutrient uptake of winter wheat during vegetative growth. J. Exp. Bot. 2001, 52, 1913–1923. [Google Scholar] [CrossRef] [Green Version]
  40. Rengel, Z. The role of crop residues in improving soil fertility. In Nutrient Cycling in Terrestrial Ecosystems; Springer: Berlin/Heidelberg, Germany, 2007; pp. 183–214. [Google Scholar]
  41. Luquet, D.; Perrier, L.; Clément-Vidal, A.; Jaffuel, S.; Verdeil, J.L.; Roques, S.; Soutiras, A.; Baptiste, C.; Fabre, D.; Bastianelli, D. Genotypic covariation of traits underlying sorghum stem biomass production and quality and its regulation by water availability: Insight from studies at organ and tissue levels. GCB Bioenergy 2018, 11, 444–462. [Google Scholar] [CrossRef] [Green Version]
  42. Kuzyakov, Y.; Friedel, J.K.; Stahr, K. Review of mechanisms and quantification of priming effects. Soil Biol. Biochem. 2000, 32, 1485–1498. [Google Scholar] [CrossRef]
  43. Whipps, J.M.; Budge, S.P. Screening for sclerotial mycoparasites of Sclerotinia sclerotiorum. Mycol. Res. 1990, 94, 607–612. [Google Scholar] [CrossRef]
  44. Kuzyakov, Y.; Cheng, W. Photosynthesis controls of rhizosphere respiration and organic matter decomposition. Soil Biol. Biochem. 2001, 33, 1915–1925. [Google Scholar] [CrossRef]
  45. Hutsch, B.W.; Augustin, J.; Merbach, W. Plant rhizodeposition—An important source for carbon turnover in soils. J. Plant Nutr. Soil Sci. 2002, 165, 397–407. [Google Scholar] [CrossRef]
  46. Warembourg, F.R.; Estelrich, D.H. Towards a better understanding of carbon flow in the rhizosphere: A time-dependent approach using carbon-14. Biol. Fertil. Soils 2000, 30, 528–534. [Google Scholar] [CrossRef]
  47. Phillips, R.P.; Finzi, A.C.; Bernhardt, E.S. Enhanced root exudation induces microbial feedbacks to N cycling in a pine forest under long-term CO2 fumigation. Ecol. Lett. 2011, 14, 187–194. [Google Scholar] [CrossRef] [PubMed]
  48. Perrier, L.; Rouan, L.; Jaffuel, S.; Clement-Vidal, A.; Roques, S.; Soutiras, A.; Luquet, D. Plasticity of sorghum stem biomass accumulation in response to water deficit: A multiscale analysis from internode tissue to plant level. Front. Plant Sci. 2017, 8, 1516. [Google Scholar] [CrossRef] [PubMed] [Green Version]
  49. Lacube, S.; Fournier, C.; Palaffre, C.; Millet, E.J.; Tardieu, F.; Parent, B. Distinct controls of leaf widening and elongation by light and evaporative demand in maize. Plant Cell Environ. 2017, 40, 2017–2028. [Google Scholar] [CrossRef]
  50. Barthel, M.; Hammerle, A.; Sturm, P.; Baur, T.; Gentsch, L.; Knohl, A. The diel imprint of leaf metabolism on the δ13C signal of soil respiration under control and drought conditions. New Phytol. 2011, 192, 925–938. [Google Scholar] [CrossRef]
Figure 1. Dendrogram showing clusters according to phenotypic relatedness of 100 genotypes evaluated.
Applbiosci 02 00010 g001
Figure 2. Variations in grain yield (A,B), plant biomass (C,D) root to shoot ratio for plant biomass (E,F) due to genotype and soil water availability (25 and 75% field capacity) under field conditions. Data are mean and standard errors (n = 9).
Applbiosci 02 00010 g002
Figure 3. Variation in grain yield (A,B), plant biomass (C,D) root to shoot ratio for plant biomass (E,F) due to genotype and soil water availability (25 and 75% field capacity) under greenhouse conditions. Data are mean and standard errors (n = 9).
Applbiosci 02 00010 g003
Figure 4. Variation in plant C stocks (A,B), root C content (C,D) and root C stocks (E,F) due to genotype and soil water availability (25 and 75% field capacity) under field conditions. Data are mean and standard errors (n = 9).
Applbiosci 02 00010 g004
Figure 5. Variation in plant C stocks (A,B), root C content (C,D) and root C stocks (E,F) due to genotype and soil water availability (25 and 75% field capacity) under greenhouse conditions. Data are mean and standard errors (n = 9).
Applbiosci 02 00010 g005
Figure 6. Excess 13C content in the soil after harvest as compared to before pulse labeling for drought (A) and well-watered (B) treatments and for the studied wheat genotypes. Data are mean and standard errors (n = 3).
Applbiosci 02 00010 g006
Table 1. Selected soil properties of the surface A horizon (0–0.3 m) at the field trial (Ukulinga farm of the University of KwaZulu Natal, Pietermaritzburg, South Africa).
Bulk density1.04
Phosphorus (g kg−1)39
Potassium (g kg−1)241
Calcium (g kg−1)1.4
Magnesium (mg kg−1)369
Electrical conductivity (cmol L−1)11
pH KCl4.6
Organic carbon (%)2.6
Nitrogen (%)0.23
Clay (%)28
Table 2. Summary statistics (min = minimum: max = maximum; Q1 = 1st quartile; Q3 = 3rd quartile; CV = coefficient of variation; SEM = standard mean error; skew = skewness; kurt = kurtosis) for grain yield (GY), selected morphological variables (SB: shoot biomass, RB: root biomass, PB: total plant biomass, R:S: root to shoot) for the 100 wheat genotypes grown in the field and in the glasshouse, and across water regimes.
GYSBRBPBR:S
----------------------g m2 -----------------------
Mean1387249830541890.12
Median1309233226339300.11
Min7511796519760.03
Max46968658121913,5290.38
Q1959182718930260.09
Q31644290836548930.15
CV%4737573741
SEM84121222000.01
Skew1.532.042.031.821.67
Kurt4.357.155.765.664.39
Table 3. Summary statistics (min = minimum: max = maximum; CV = coefficient of variation; SEM = standard mean error) for grain yield (GY), selected morphological variables (SB: shoot biomass, RB: root biomass, PB: total plant biomass, R:S: root to shoot), and plant carbon variables (SCC: shoot carbon content, RCC: root carbon content, SCS: shoot carbon stocks, RCS: root carbon stocks and PCS: plant carbon stocks) for the selected 10 wheat varieties grown in the field and glasshouse, and across water regimes.
GYSBRBPBR:SSCCRCCSCSRCSPCS
-----------------------g m2 ----------------------- ----------%----------------------g m2 ----------------
Glasshouse
25% Field capacity
Mean326187379229920.433331625239865
Median266182676229180.443431621225854
Min58134936821560.152521409103592
Max8692415126339830.7037398053791109
CV%68243624341923253423
SEM285737940.0211201026
75% Field capacity
Mean4143726214962890.57333112436471890
Median3973440182355080.57343111866051716
Min1362779129045310.3725218513331324
Max8115192357593050.783739182210592881
CV%50263830261923273528
SEM271271042470.0211442969
Field
25% Field capacity
Mean1700250730245080.12333183295927
Median1401253427740420.12343182780968
Min621159815224750.08252153445582
Max4488377564281000.19373912152141409
CV%5327393424816264727
SEM11687151990.0040.360.6228.105.7932.30
75% Field capacity
Mean2062371440361790.12343112541211375
Median1720315438254620.10353110521121170
Min1118195413535550.06302167553728
Max43838658100613,5290.26373928693023022
CV%4442443943615424339
SEM117202233130.010.260.6167.576.6969.93
Table 4. Mean squares after combined analysis of variance for phenotypic traits of 100 wheat genotypes evaluated across the two water regimes and the two environments (field and glasshouse). GY: grain yield; SB: shoot biomass weight; RB: root biomass weight; R:S: root to shoot ratio.
DFGYSBRBR:S
Rep11.543.213.90.07
Block18117.1 ***236.418.50.10 ***
Genotype99101.7 ***556.552.1 *0.06 *
Water regime143.7 *43.1 *2.8 *1.12 *
Phenotypic coefficient of variation at 0.05 (*) and 0.001 (***), respectively.
Table 5. Mean of selected phenotypic traits for the 10 clusters presented in Figure 1 and for the different water regimes and environments (field and glasshouse).
ClusterTreatmentGYSBRBPBR:S
2A11Overall613.8992.5224.11830.40.44
Drought480.9777.6187.11445.70.44
Well-watered746.71207.5261.12215.20.45
2A12Overall586.8860.7216.21663.60.44
Drought385.5678.1166.01229.60.43
Well-watered771.31028.2262.12061.50.44
2A1Overall481.5983.3227.31686.30.45
Drought317.3795.1186.31295.00.40
Well-watered649.61176.1269.22087.10.49
2A2Overall576.4986.1238.41795.30.46
Drought432.5824.9197.61447.50.42
Well-watered717.81147.3279.52143.00.50
2B1Overall706.61159.1352.92218.60.50
Drought610.3968.5243.91822.70.43
Well-watered802.91349.8461.92614.50.57
2B21Overall568.41182.4270.72005.70.44
Drought413.4929.9223.81555.40.42
Well-watered719.11427.9316.42443.70.46
2B22Overall695.31125.9264.82067.00.48
Drought502.7873.8210.81567.20.45
Well-watered885.61376.5318.72566.80.50
Grand Mean603.01040.5256.11893.40.46
Disclaimer/Publisher’s Note: The statements, opinions and data contained in all publications are solely those of the individual author(s) and contributor(s) and not of MDPI and/or the editor(s). MDPI and/or the editor(s) disclaim responsibility for any injury to people or property resulting from any ideas, methods, instructions or products referred to in the content.

