
Microbiological Analysis of the Air in a Popular Fish Processing and Marketing Area
 , and
, and 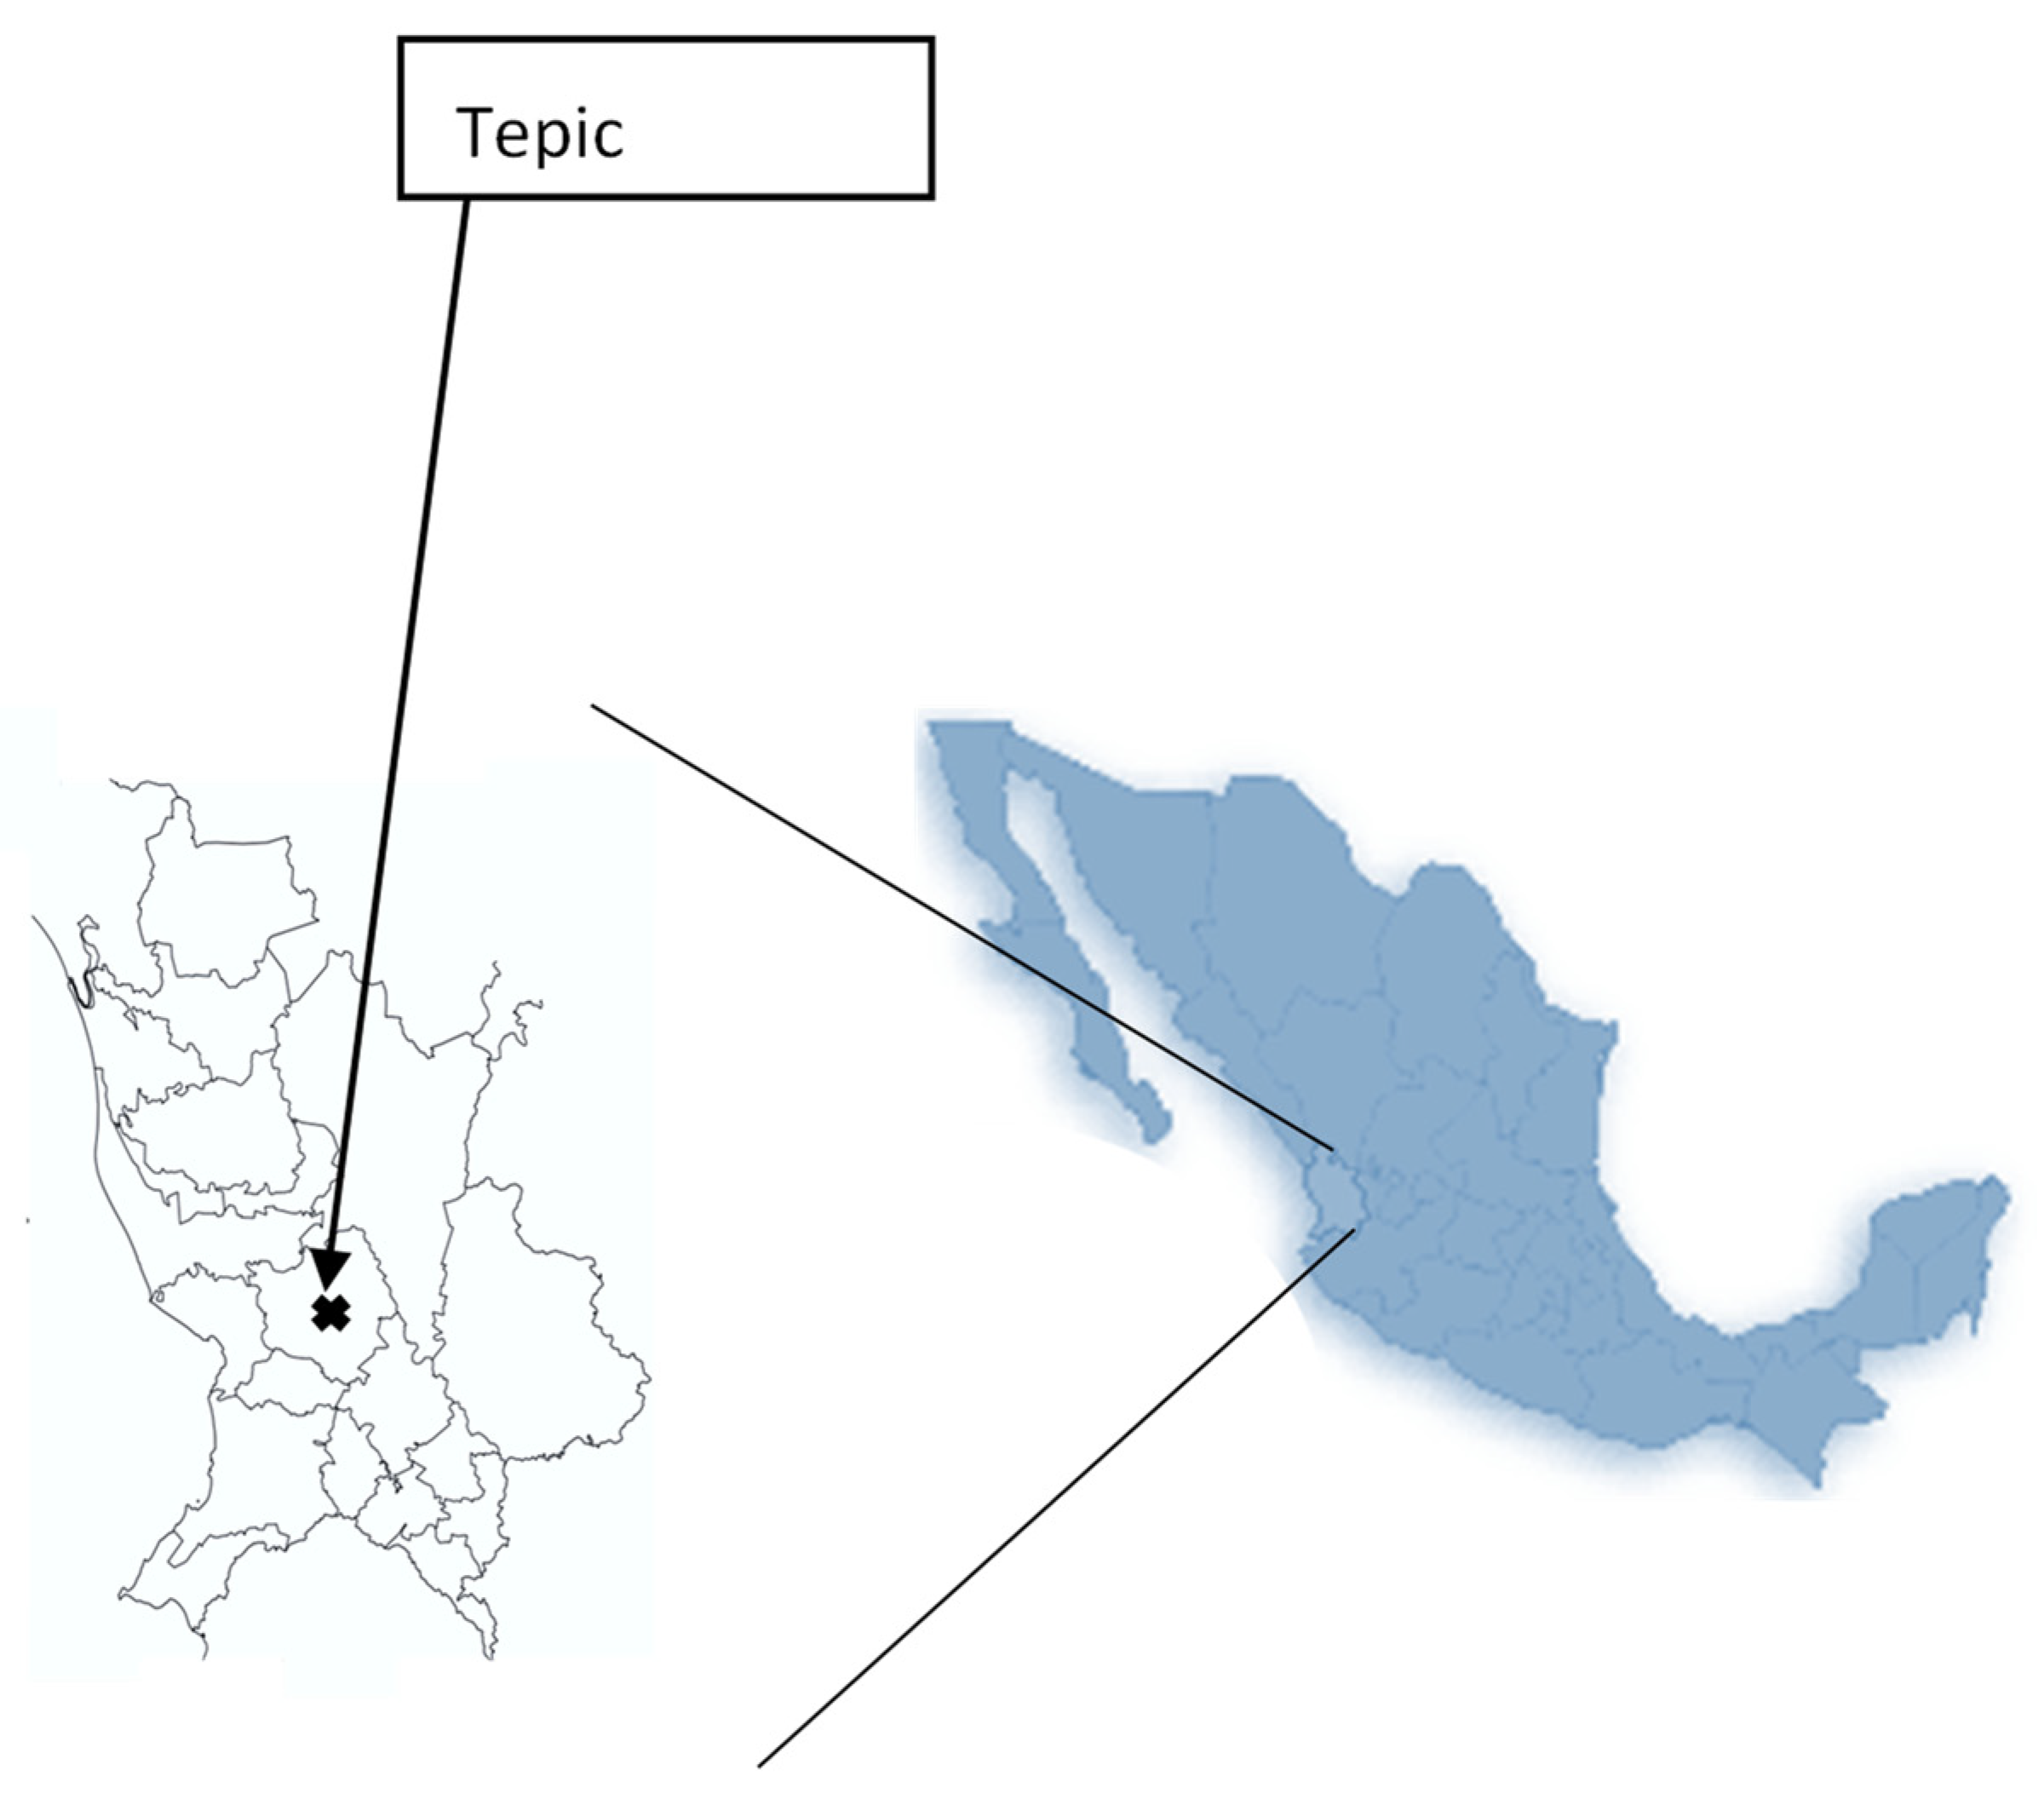
Abstract
:1. Introduction
2. Materials and Methods
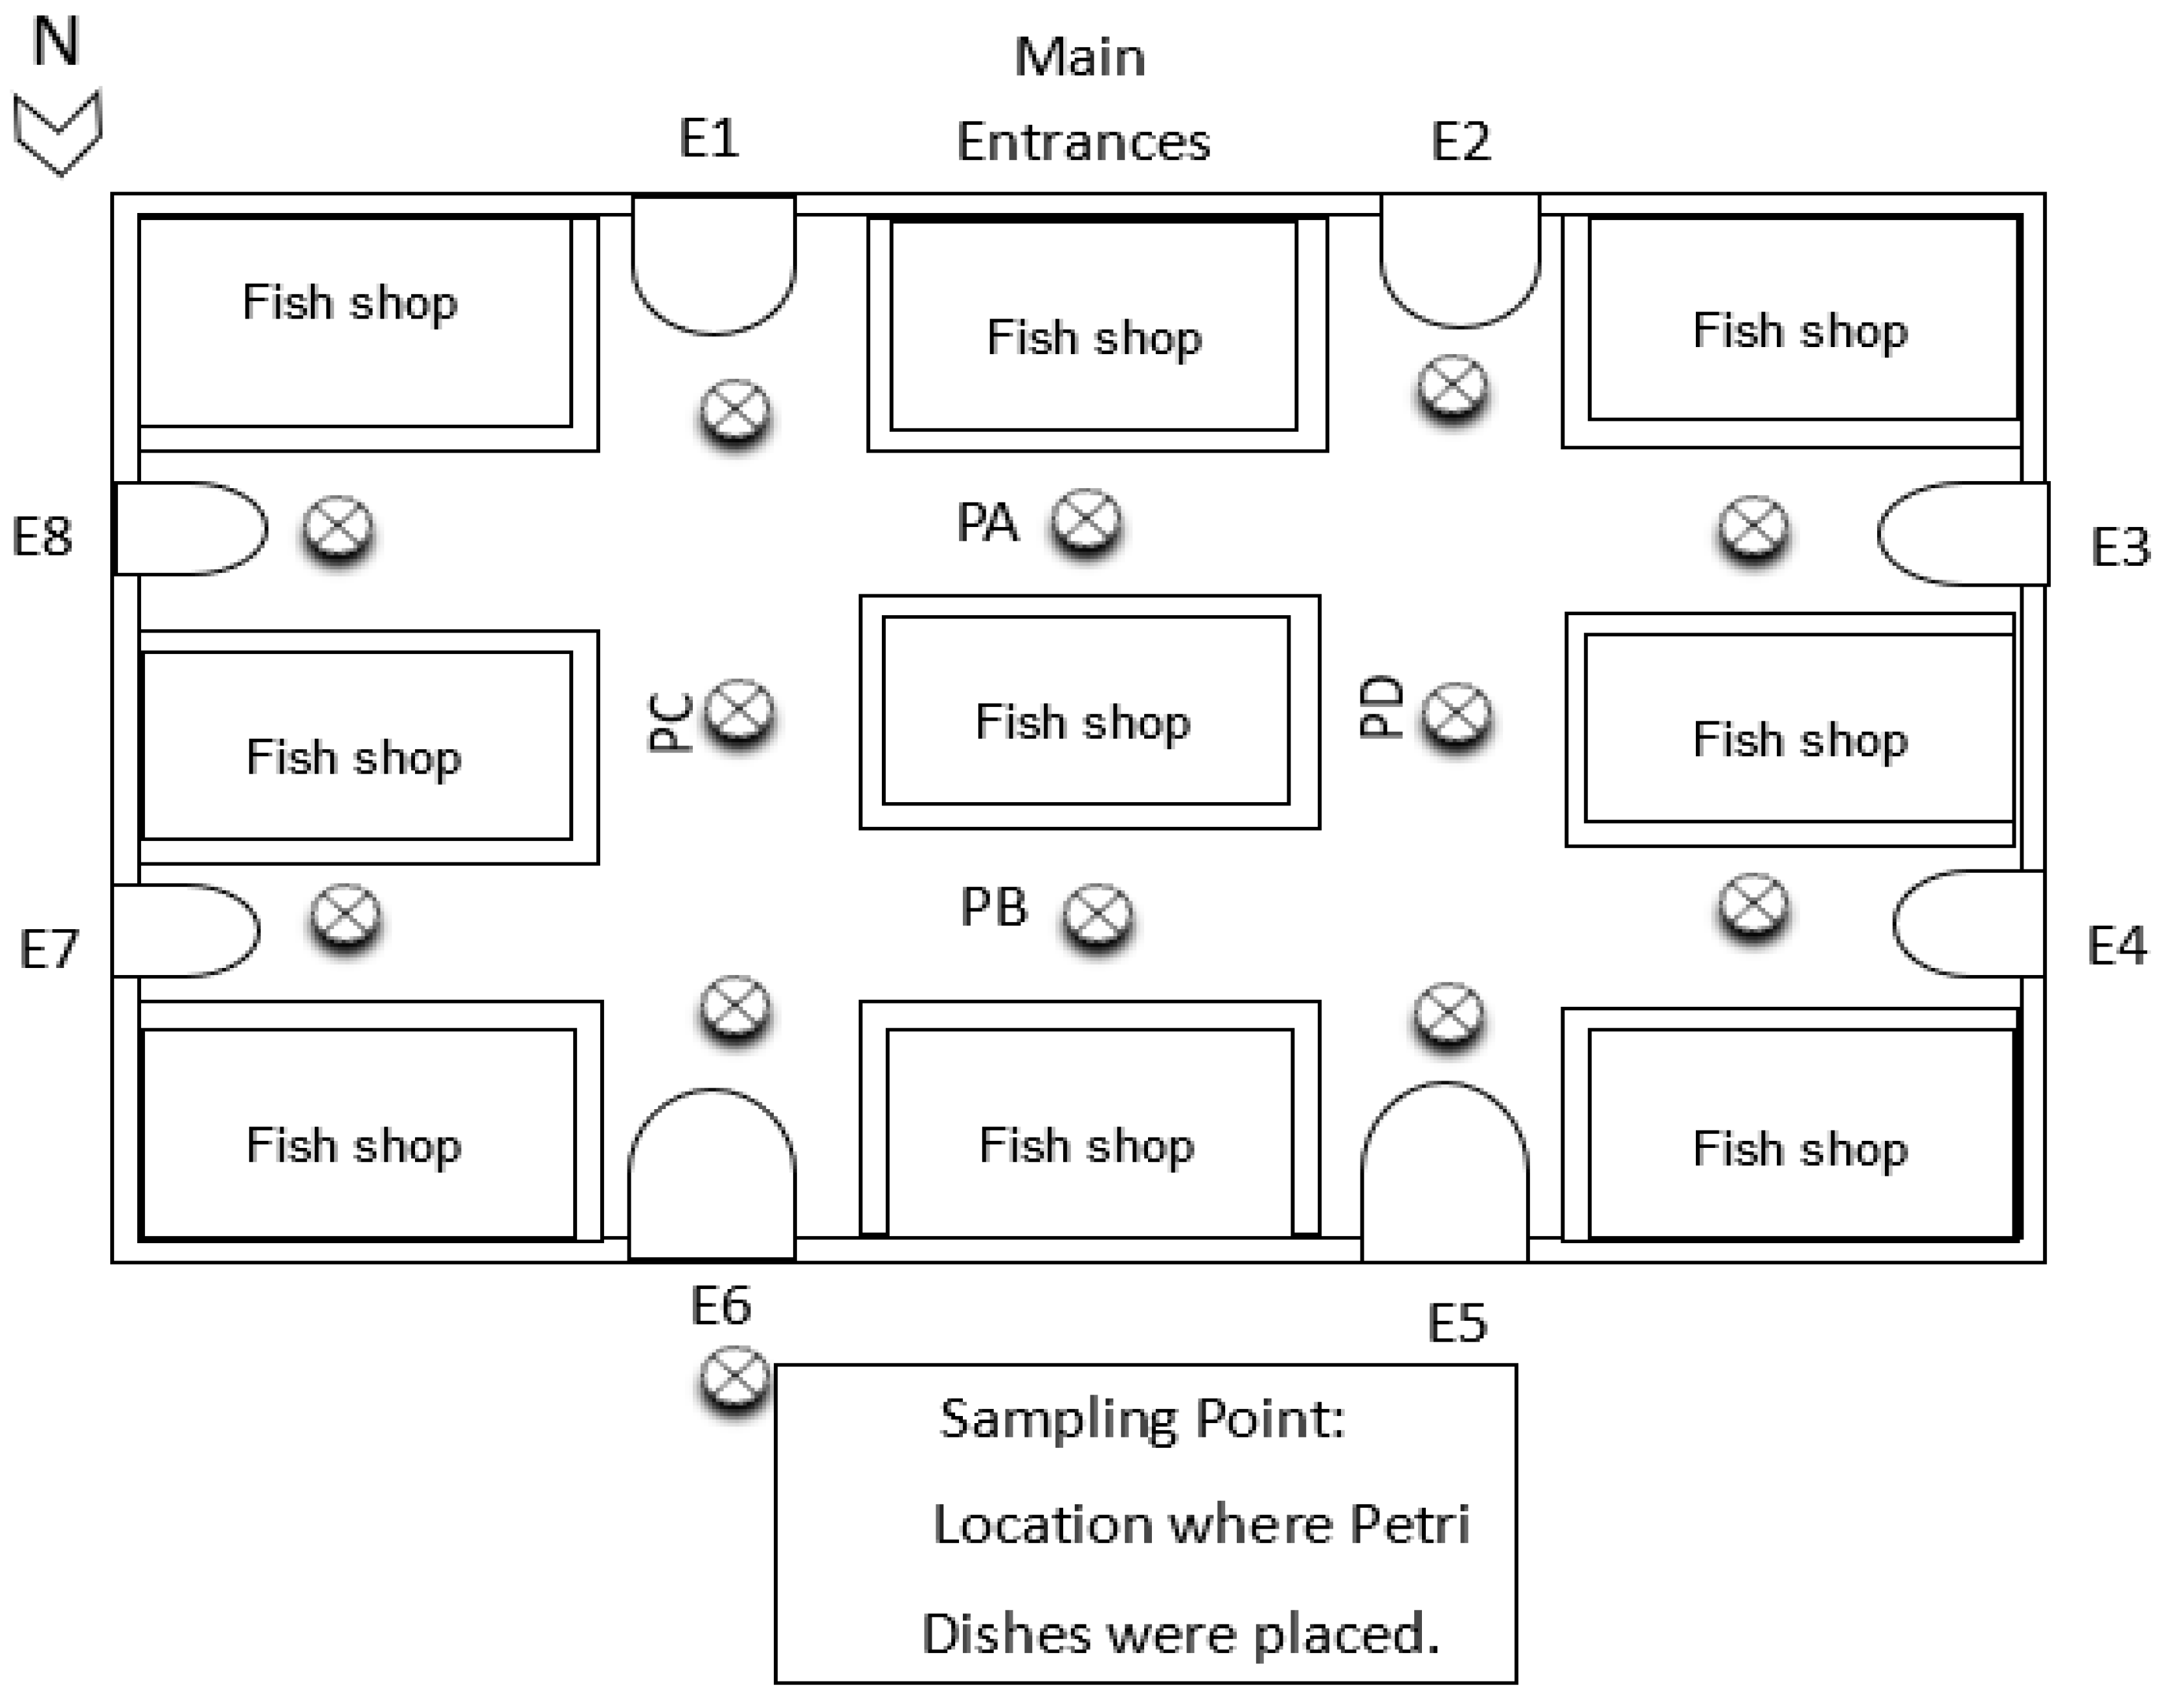
2.1. Air Sampling
2.2. Temperature and Humidity Analysis of the Marketing and Processing Area
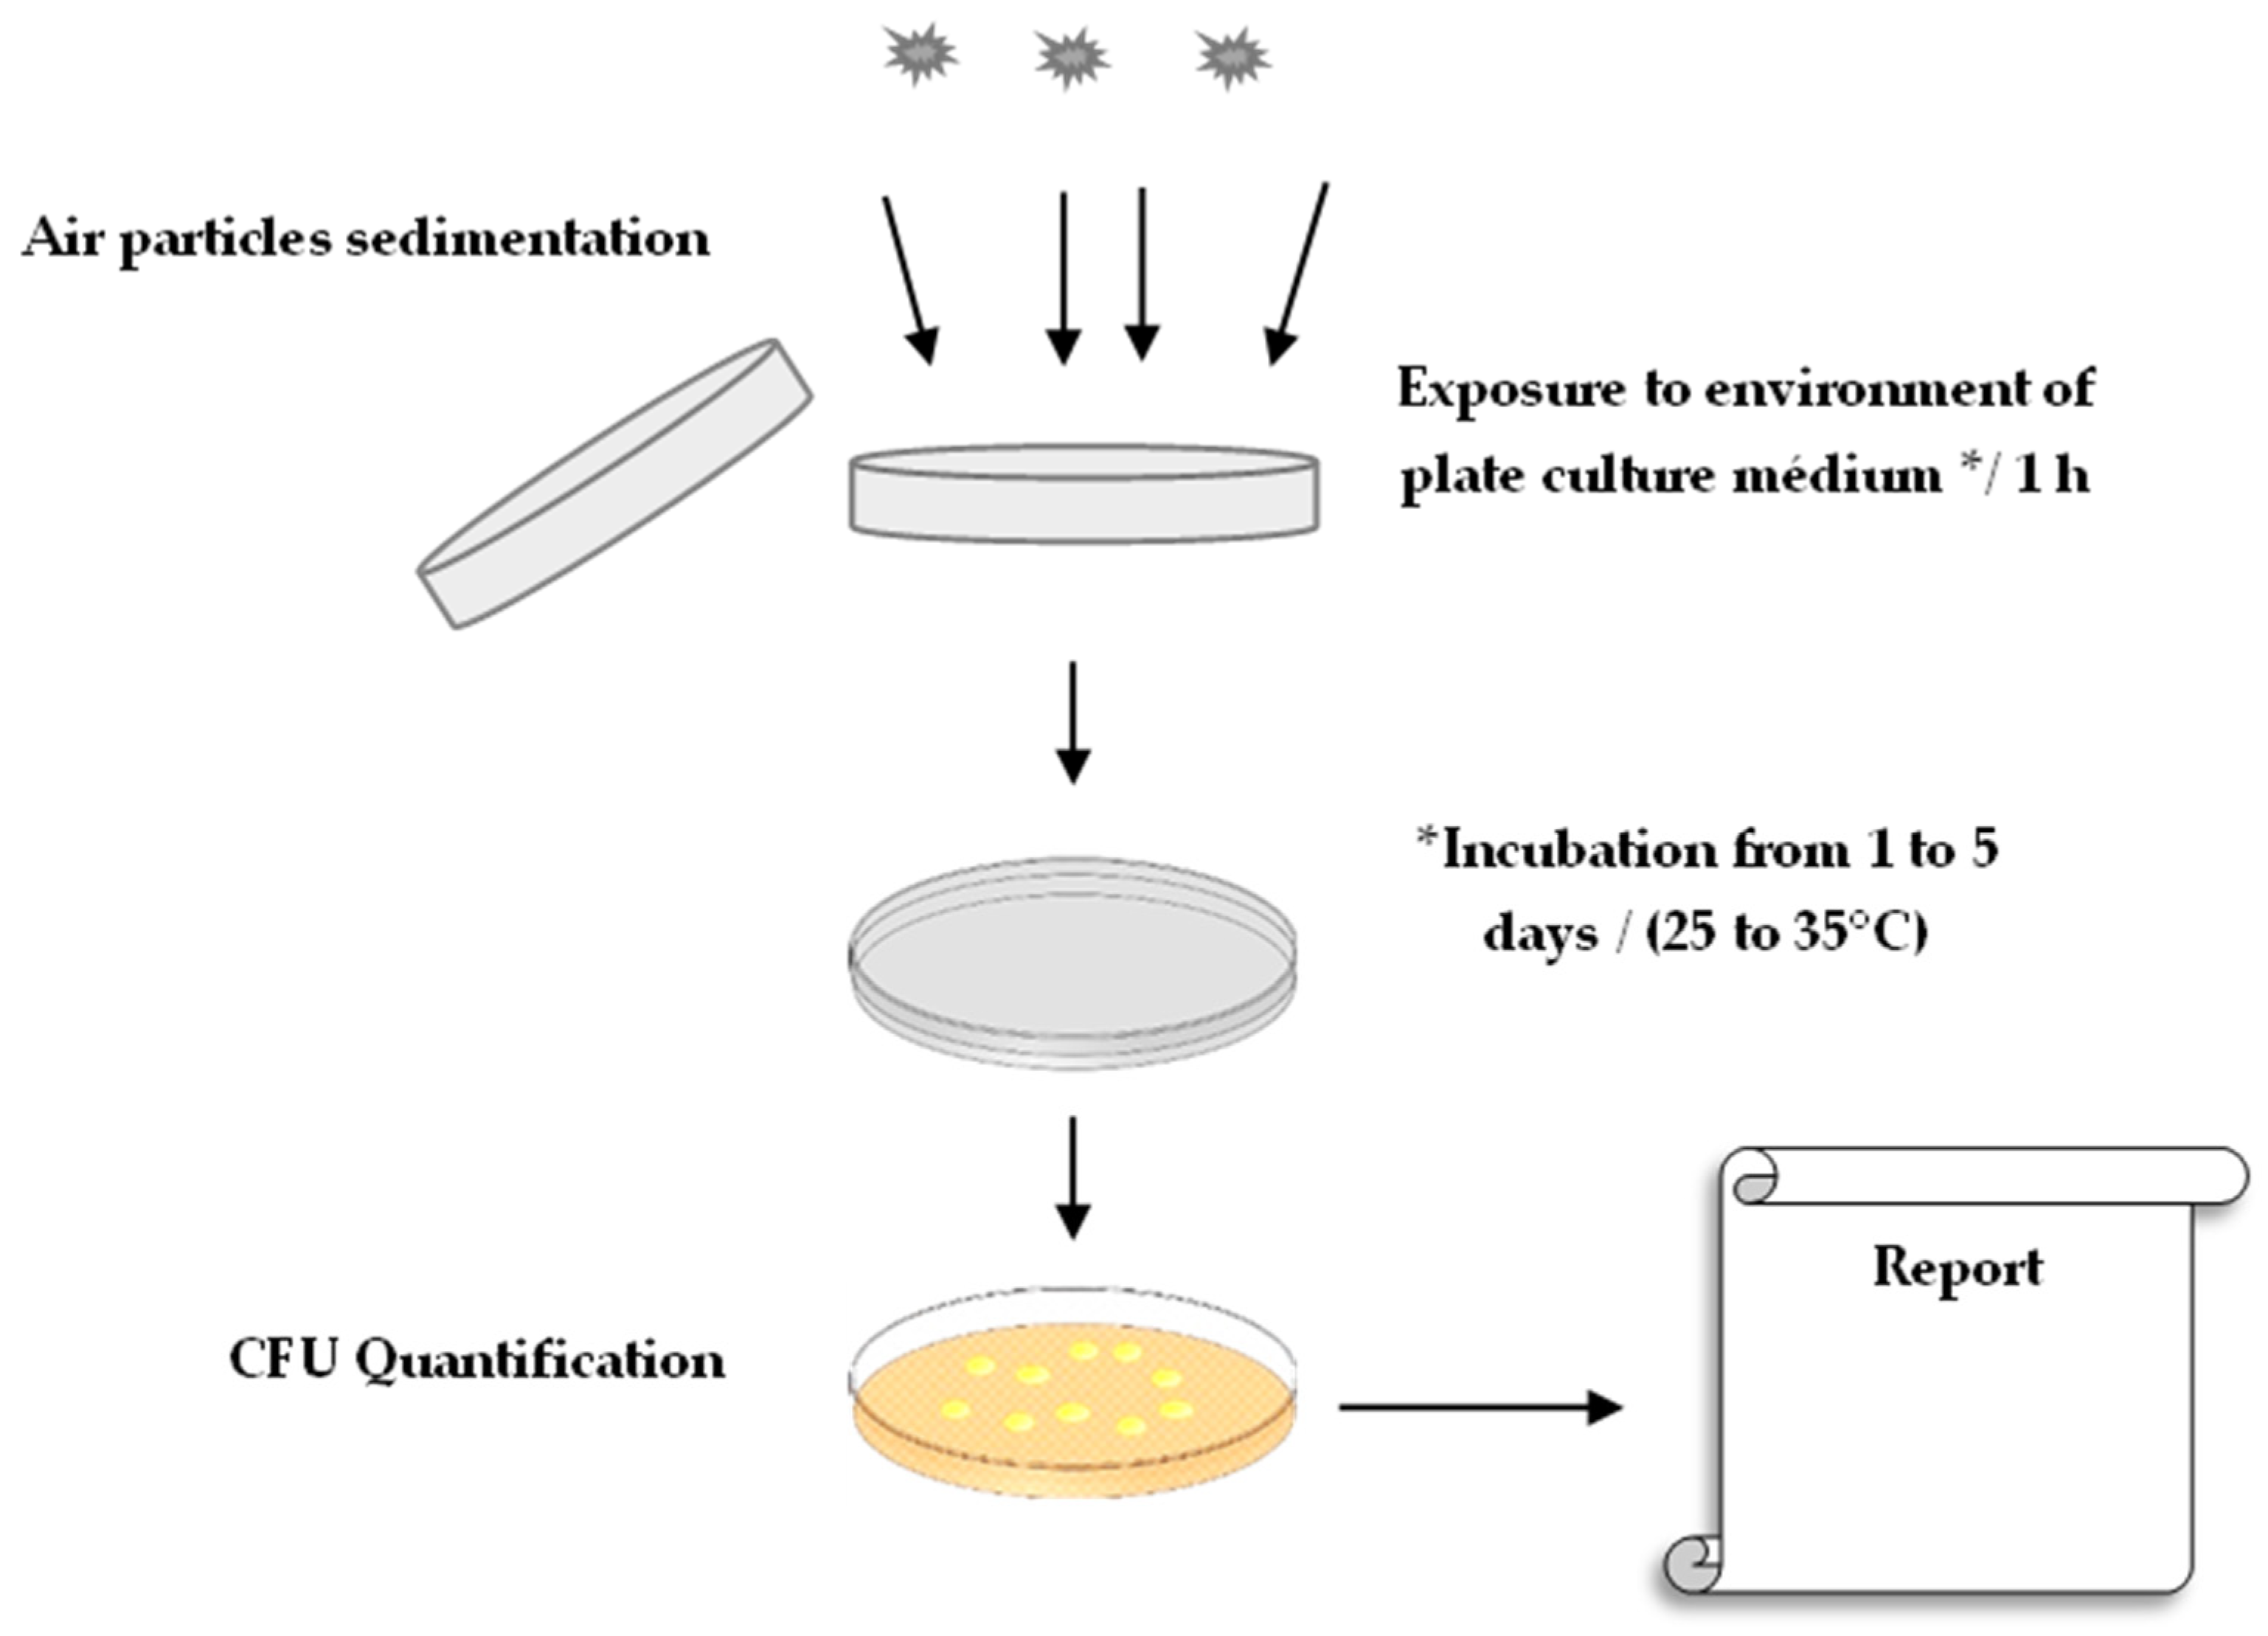
2.3. Microbiological Analysis
2.4. Data Analysis
3. Results and Discussion
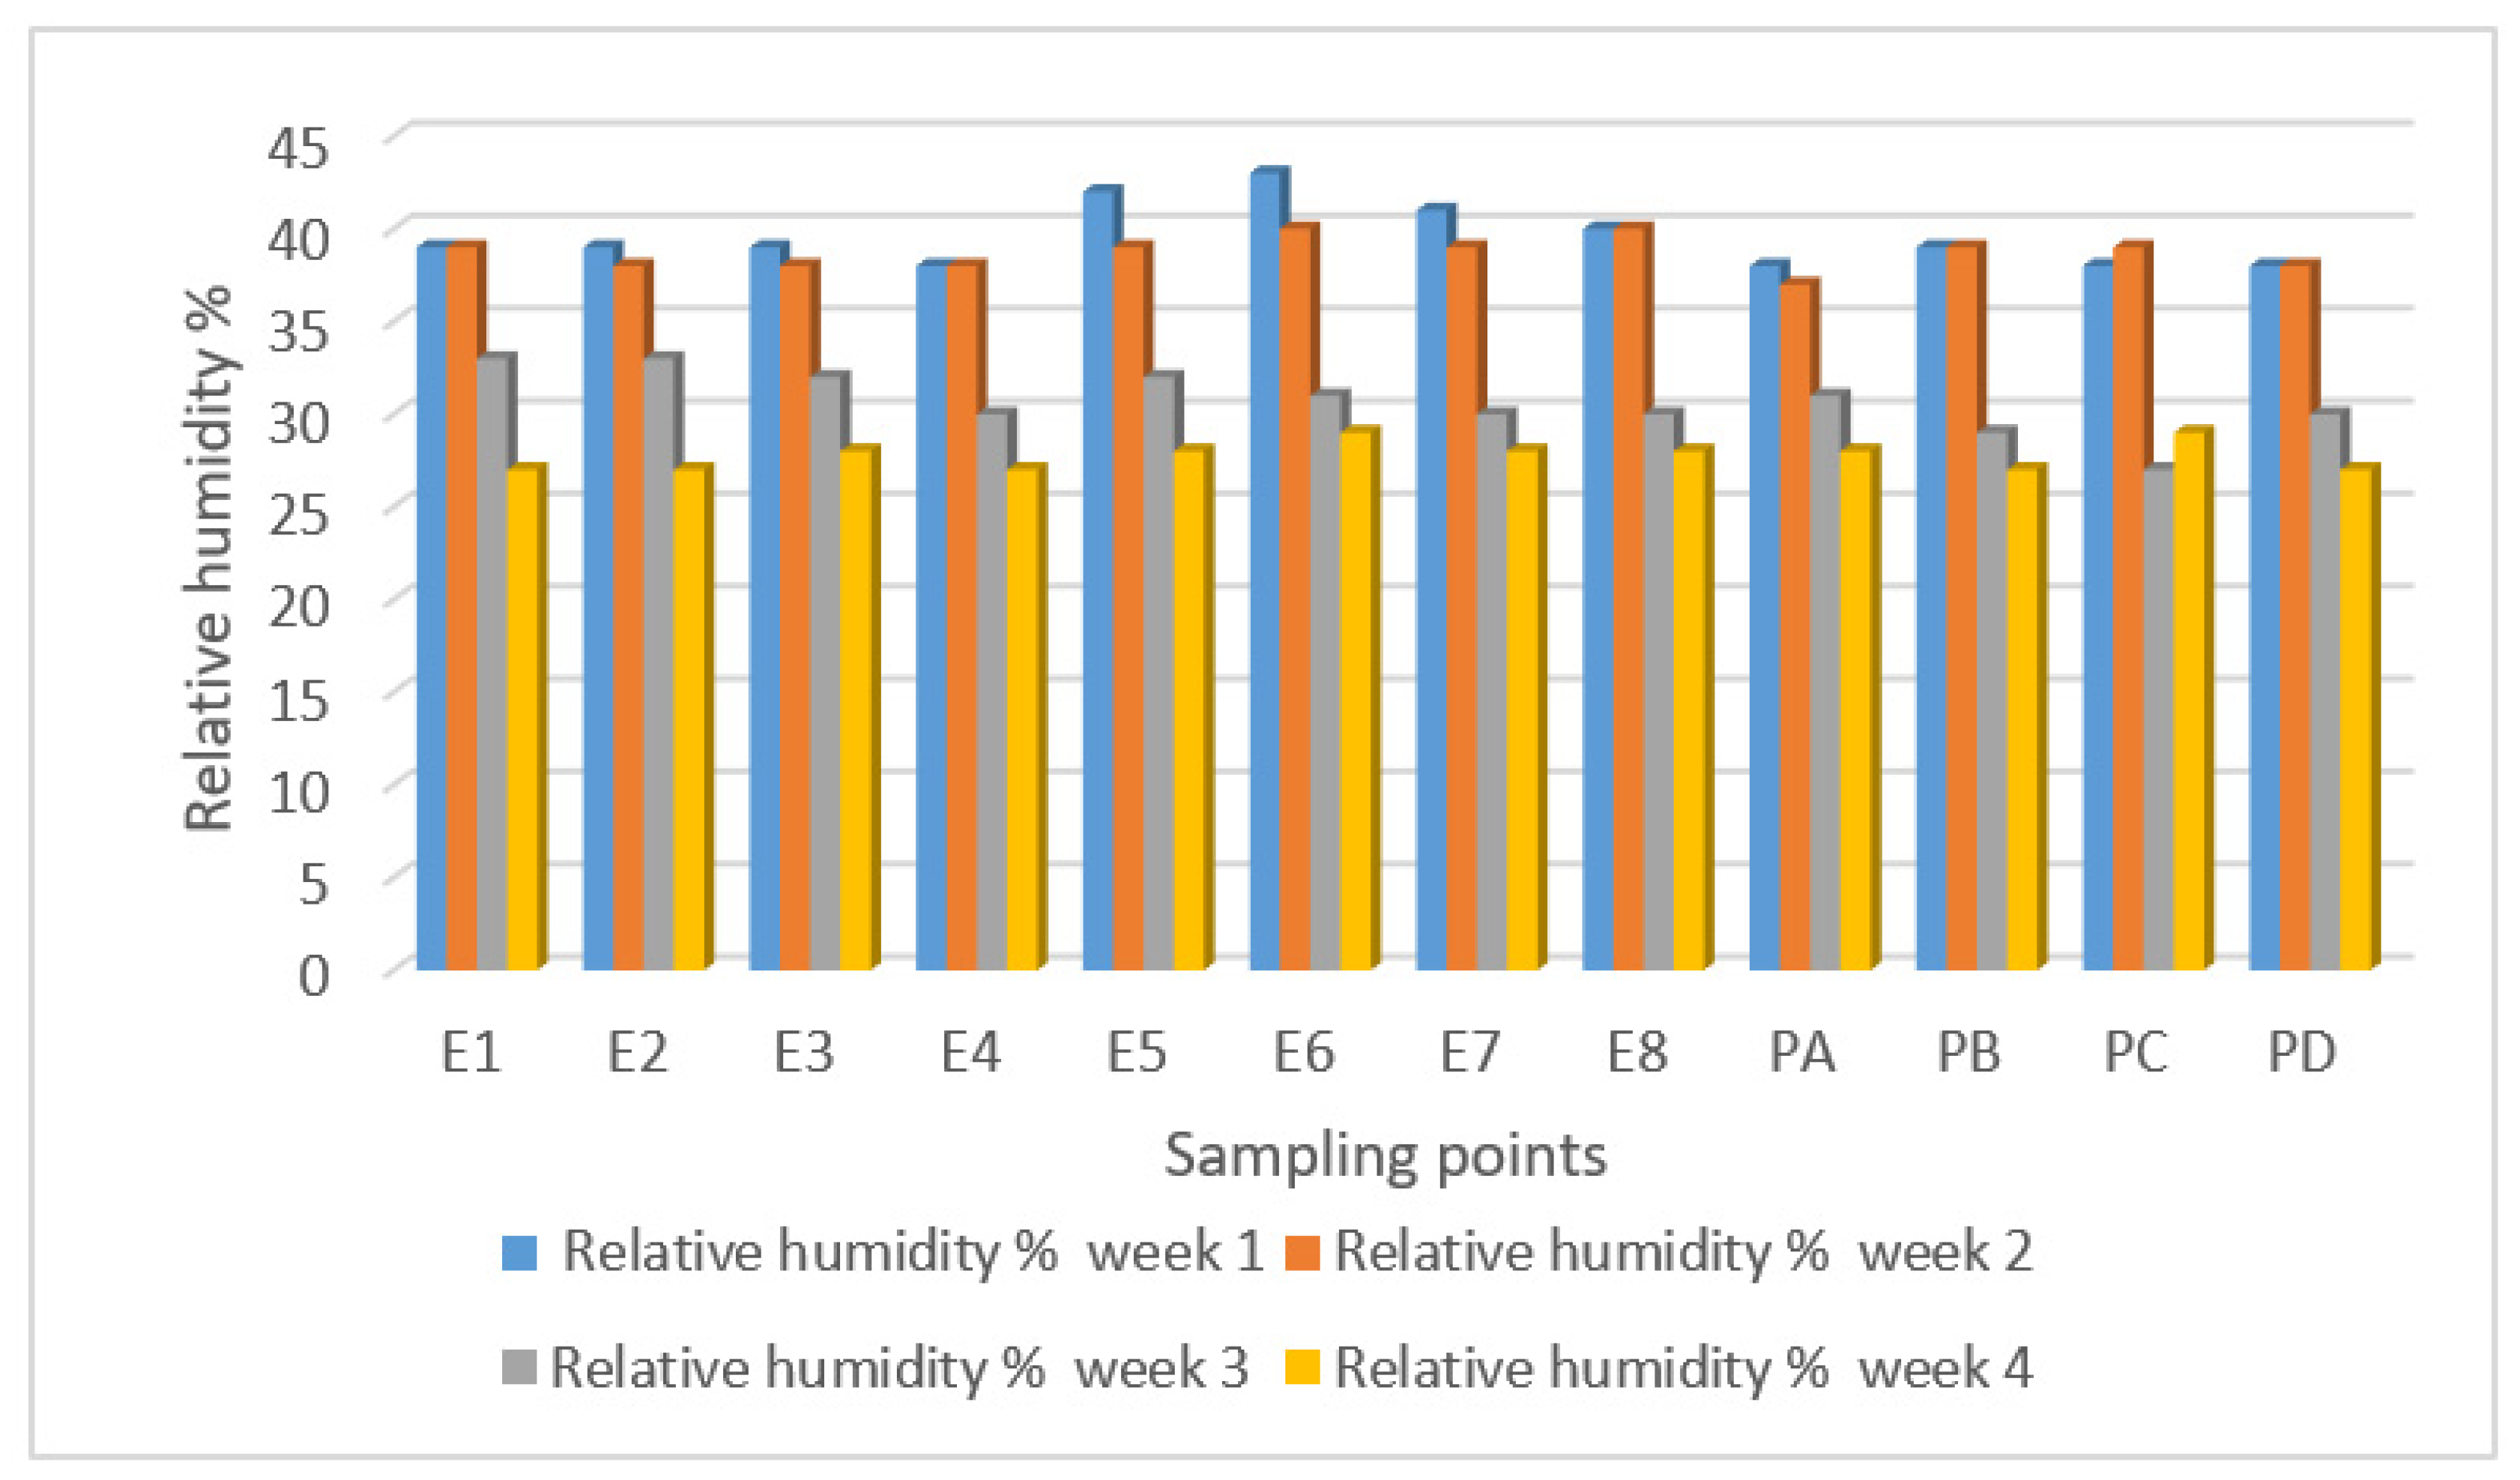
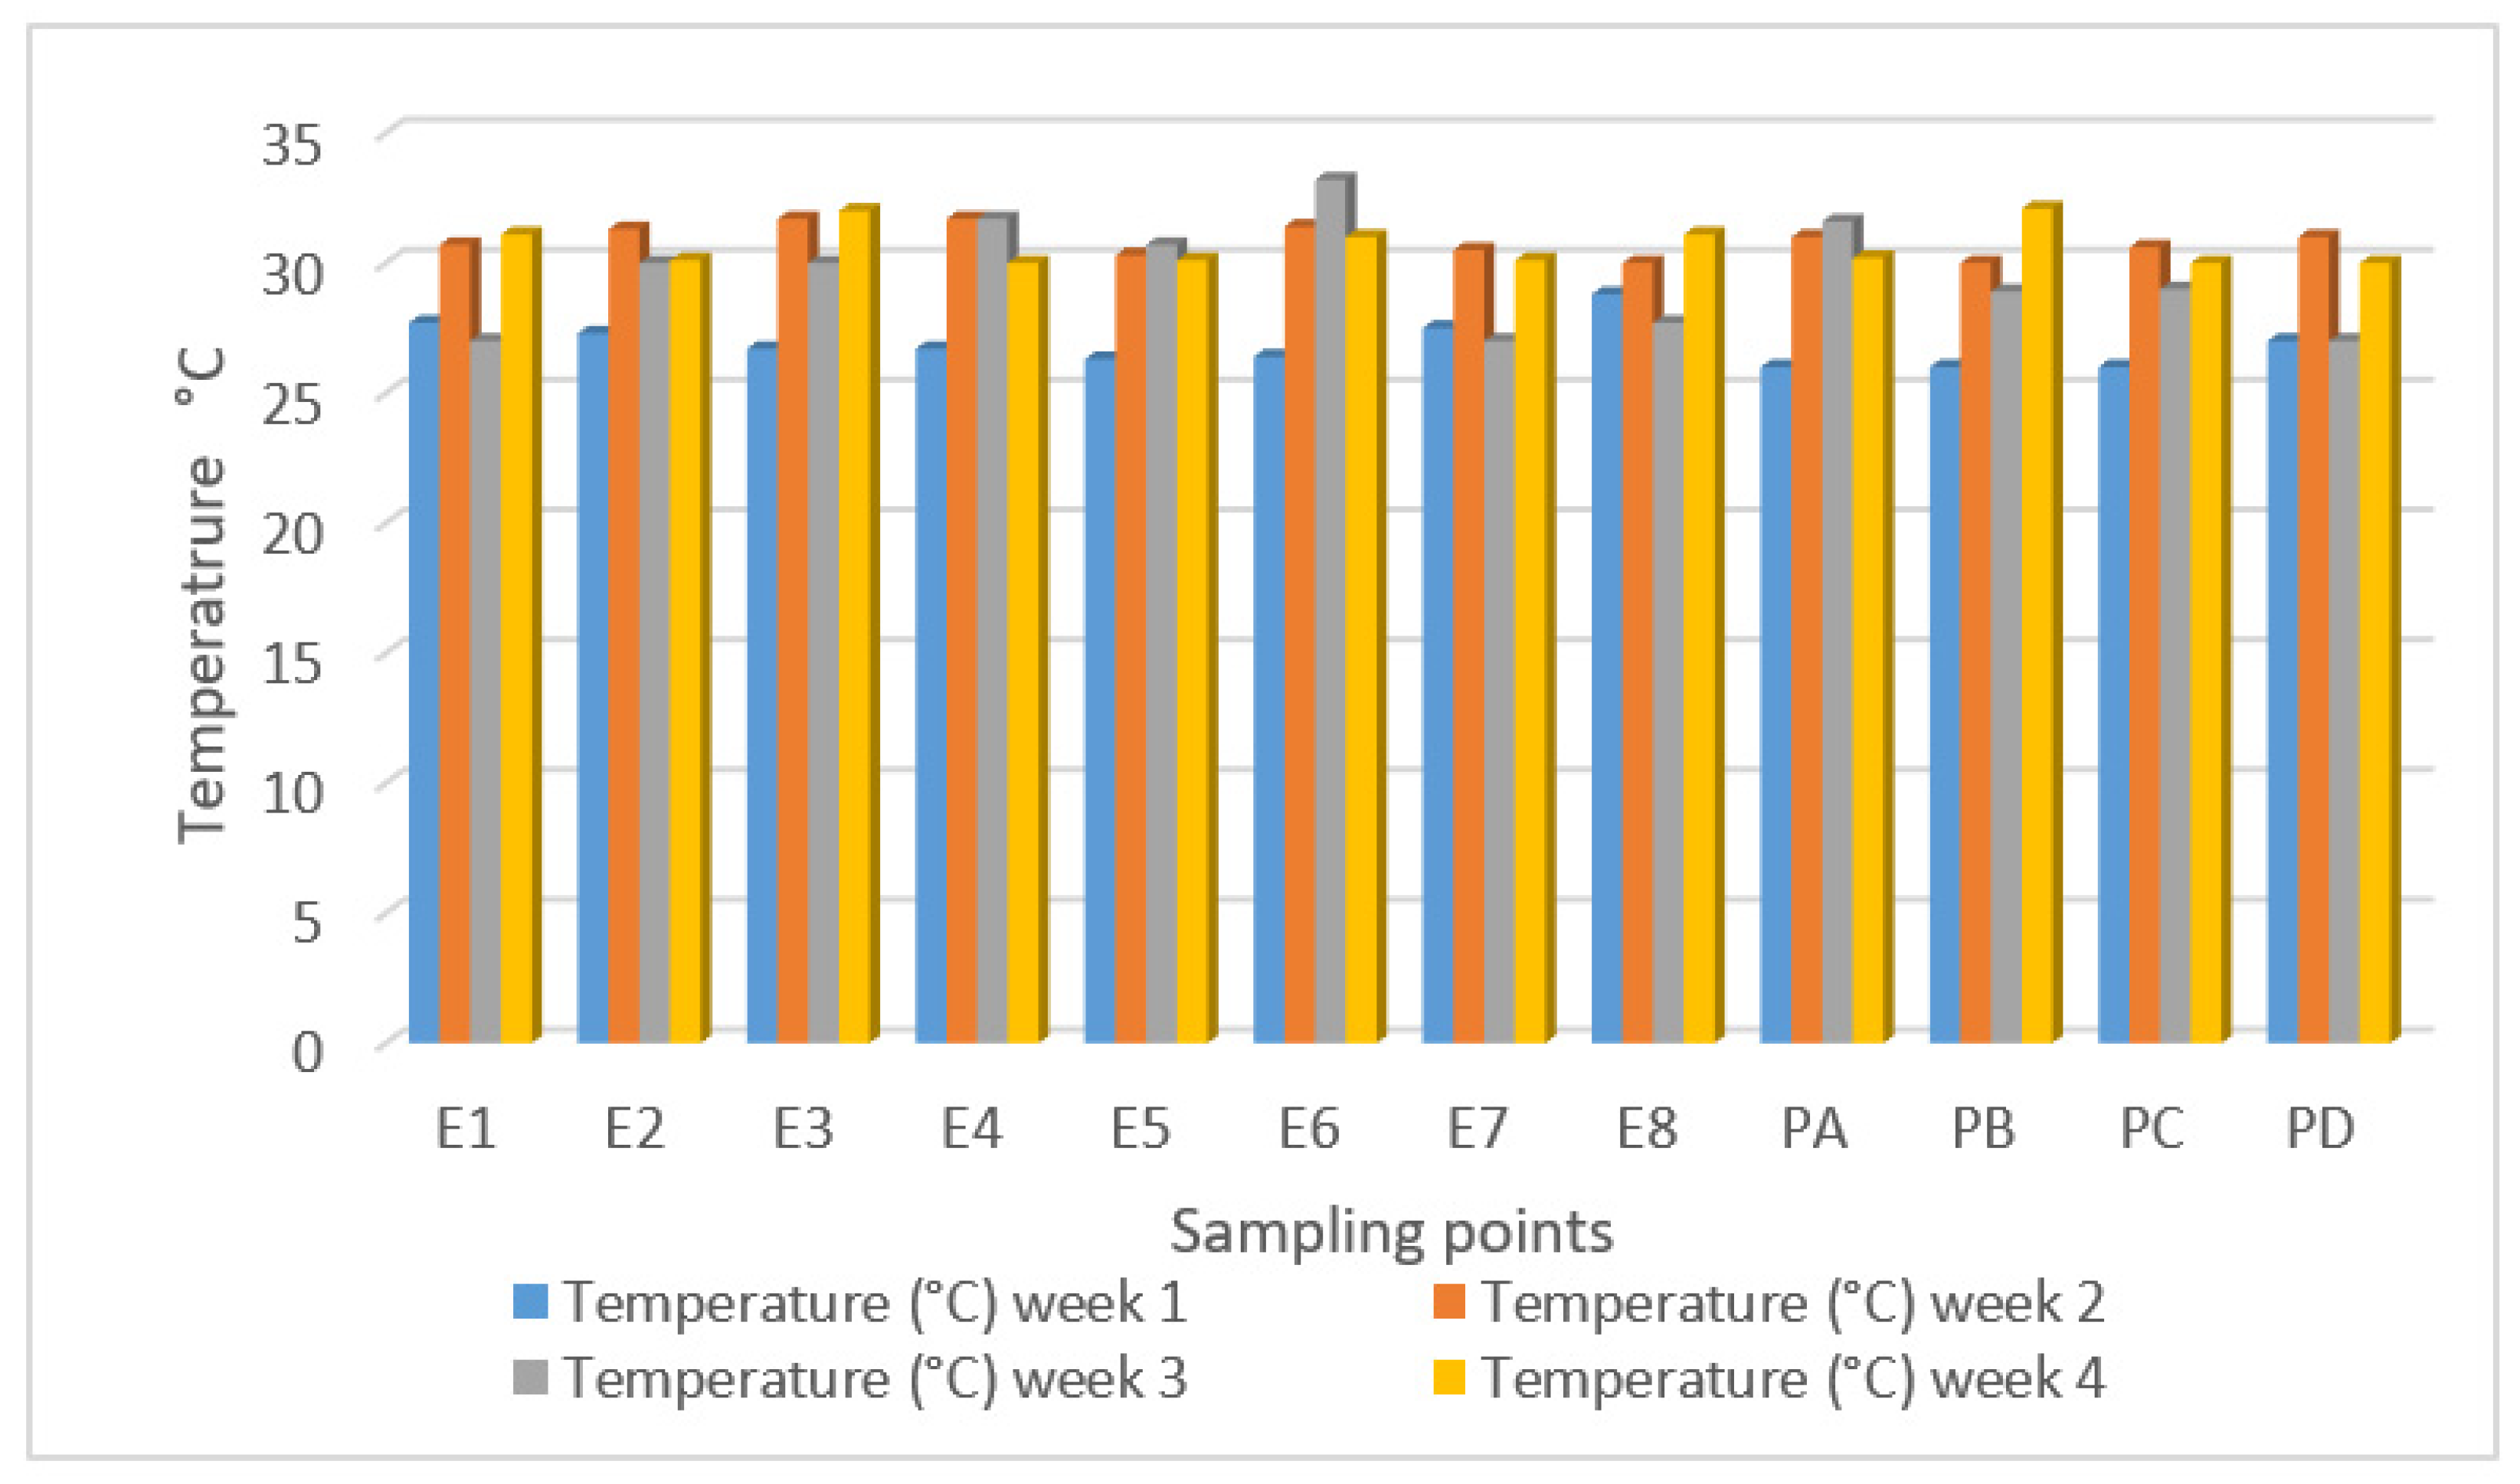
3.1. Relative Humidity and Temperature in the Fish Processing and Marketing Areas
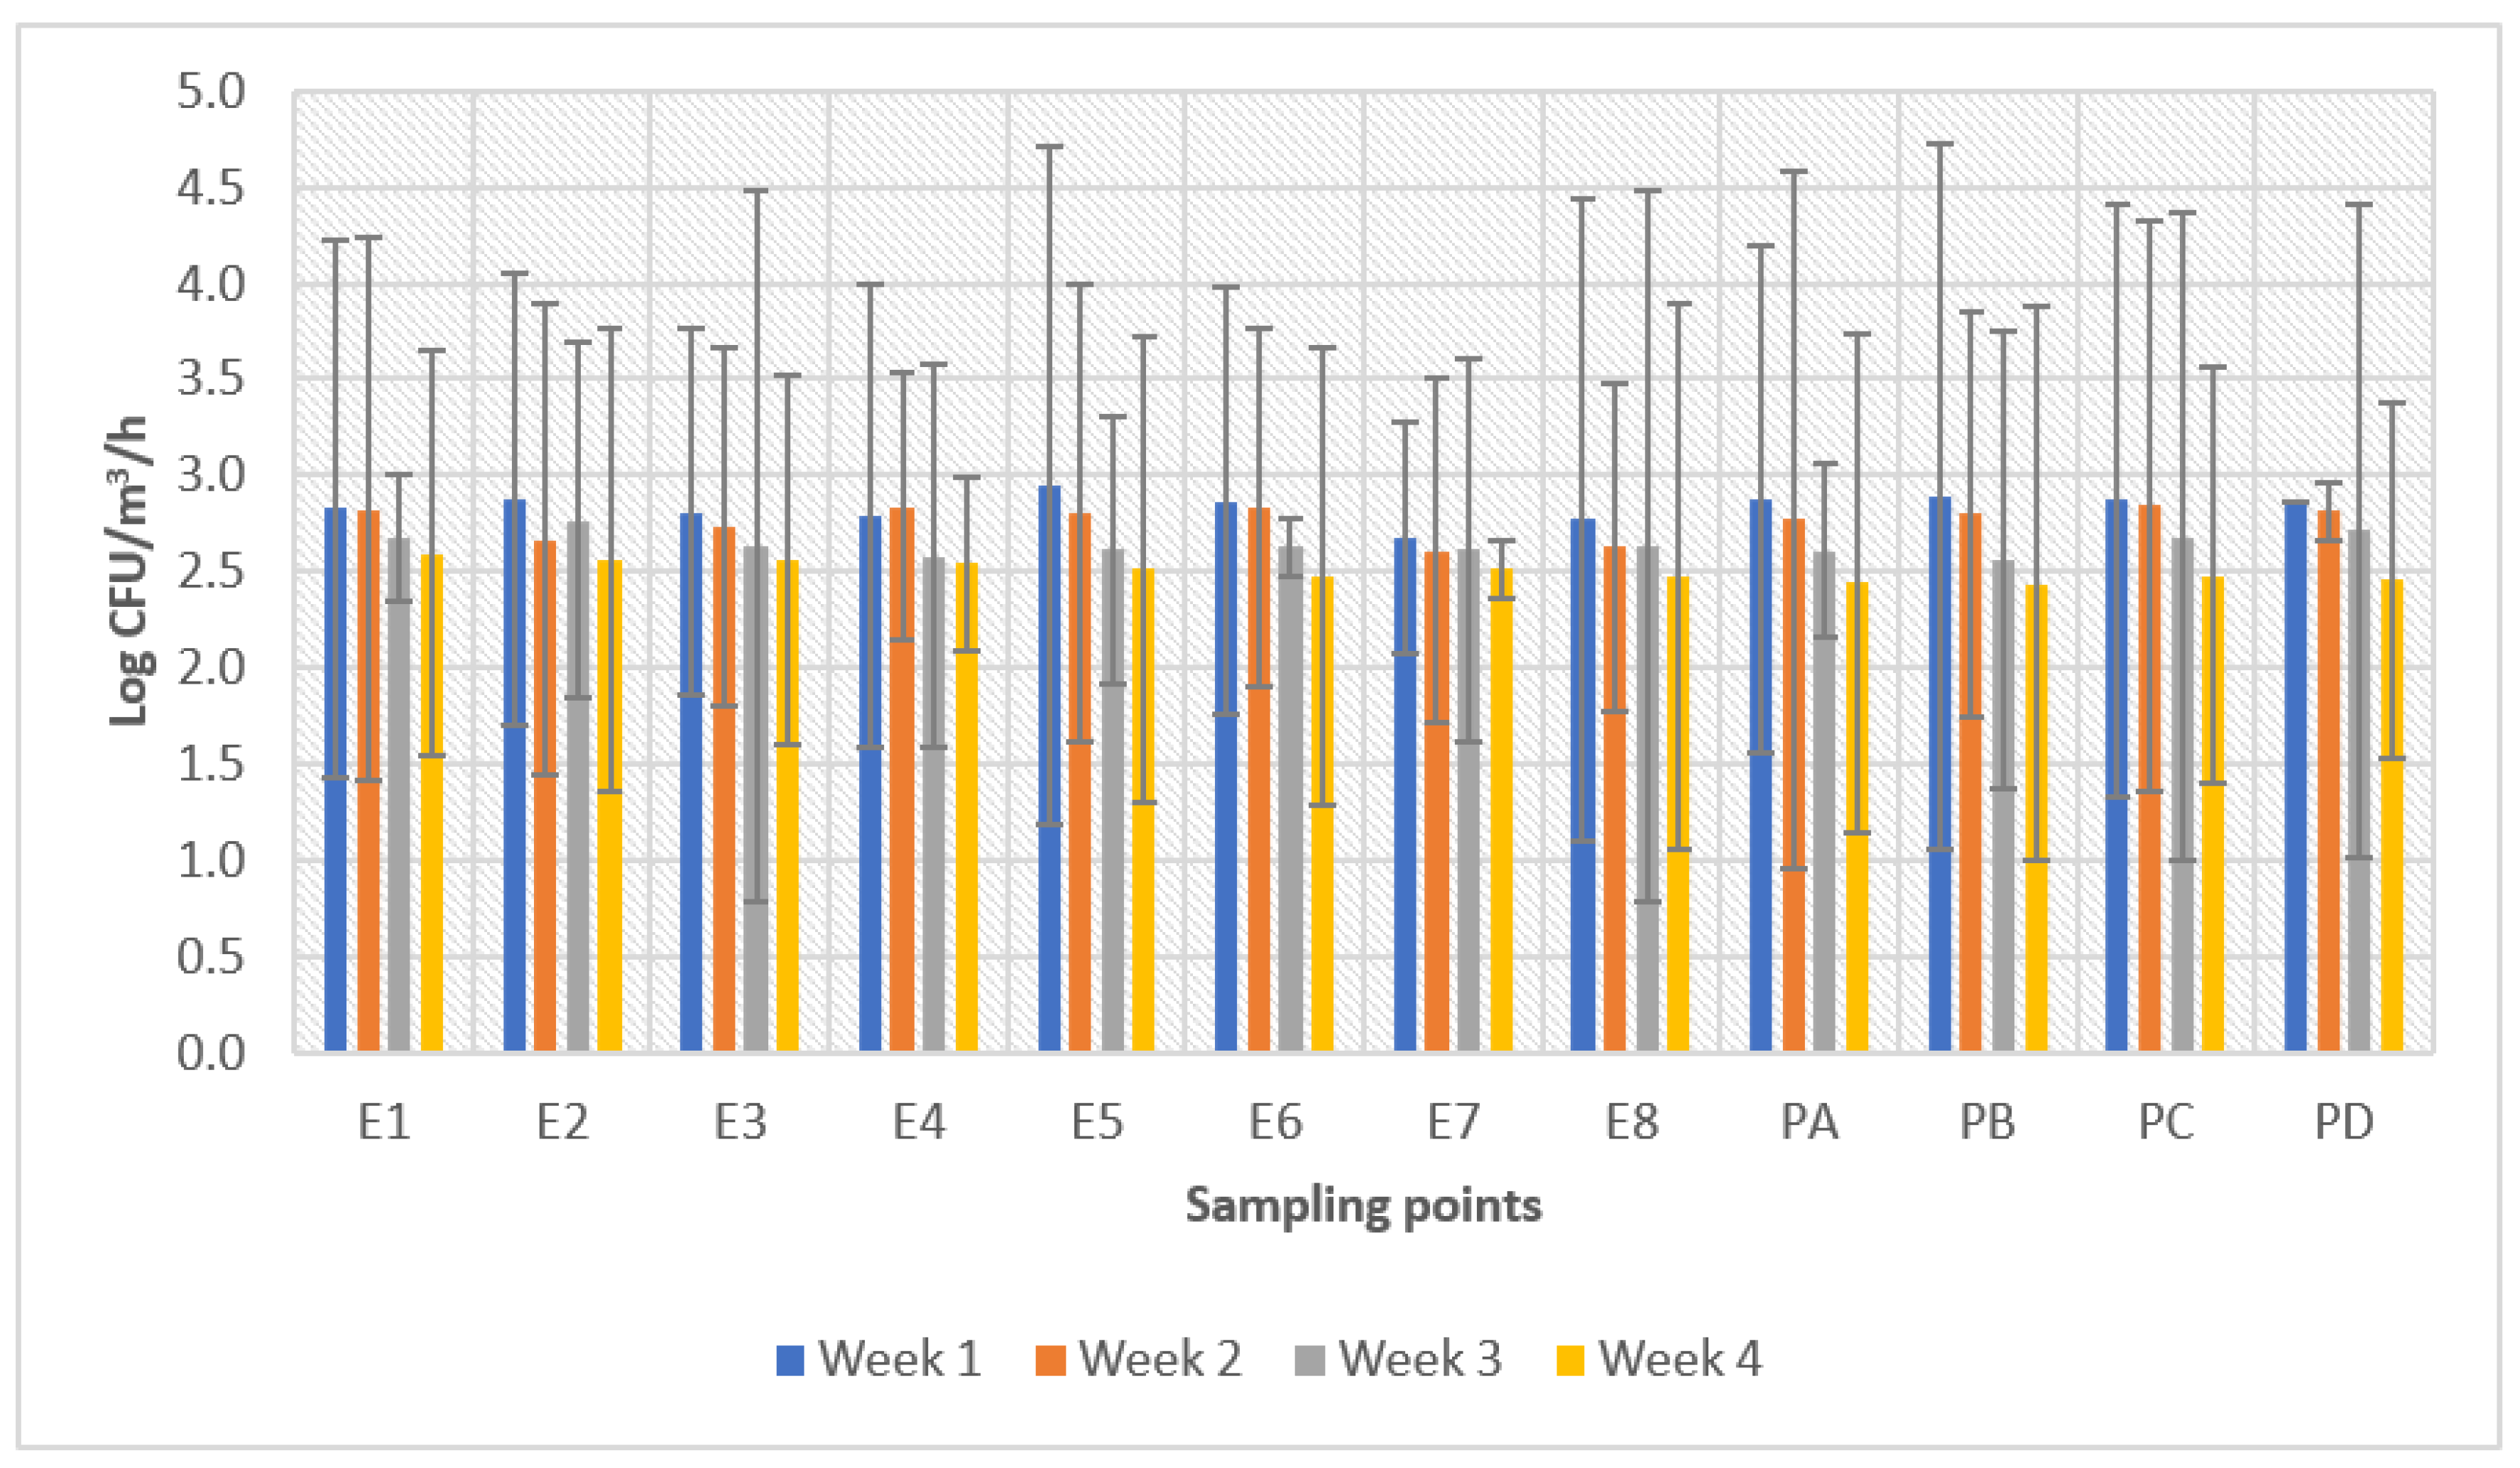
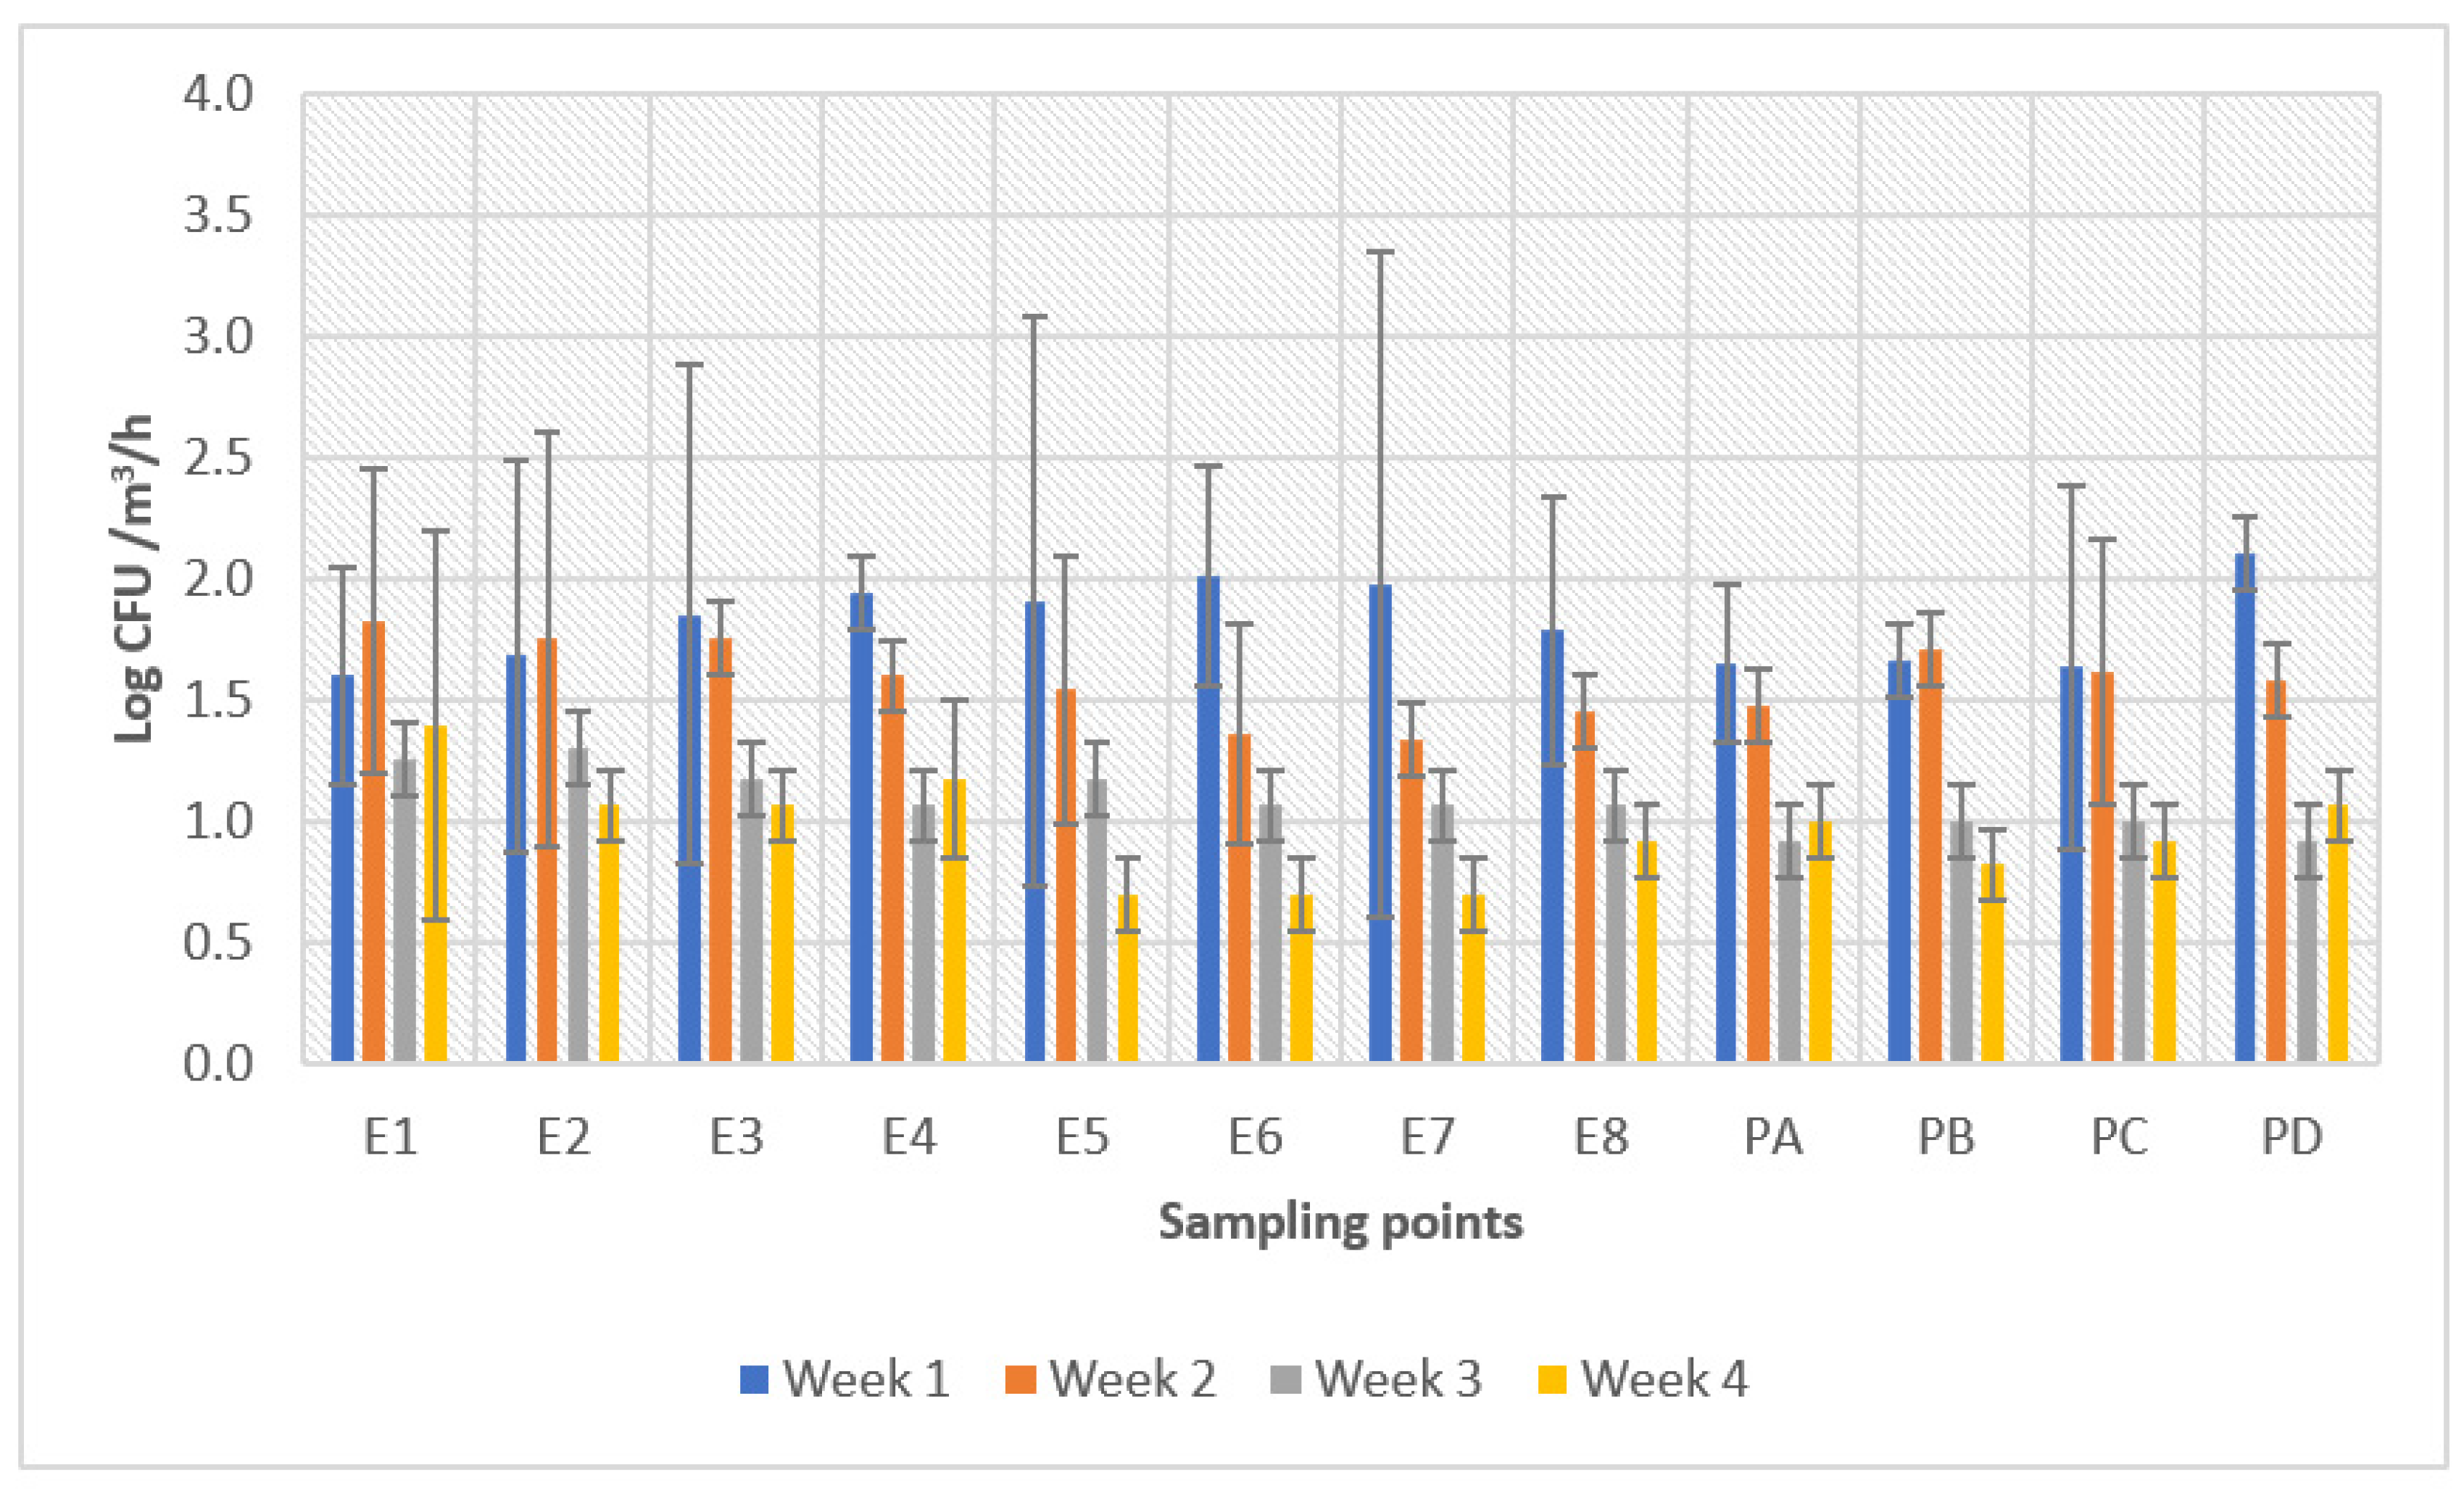
3.2. Aerobic Mesophiles
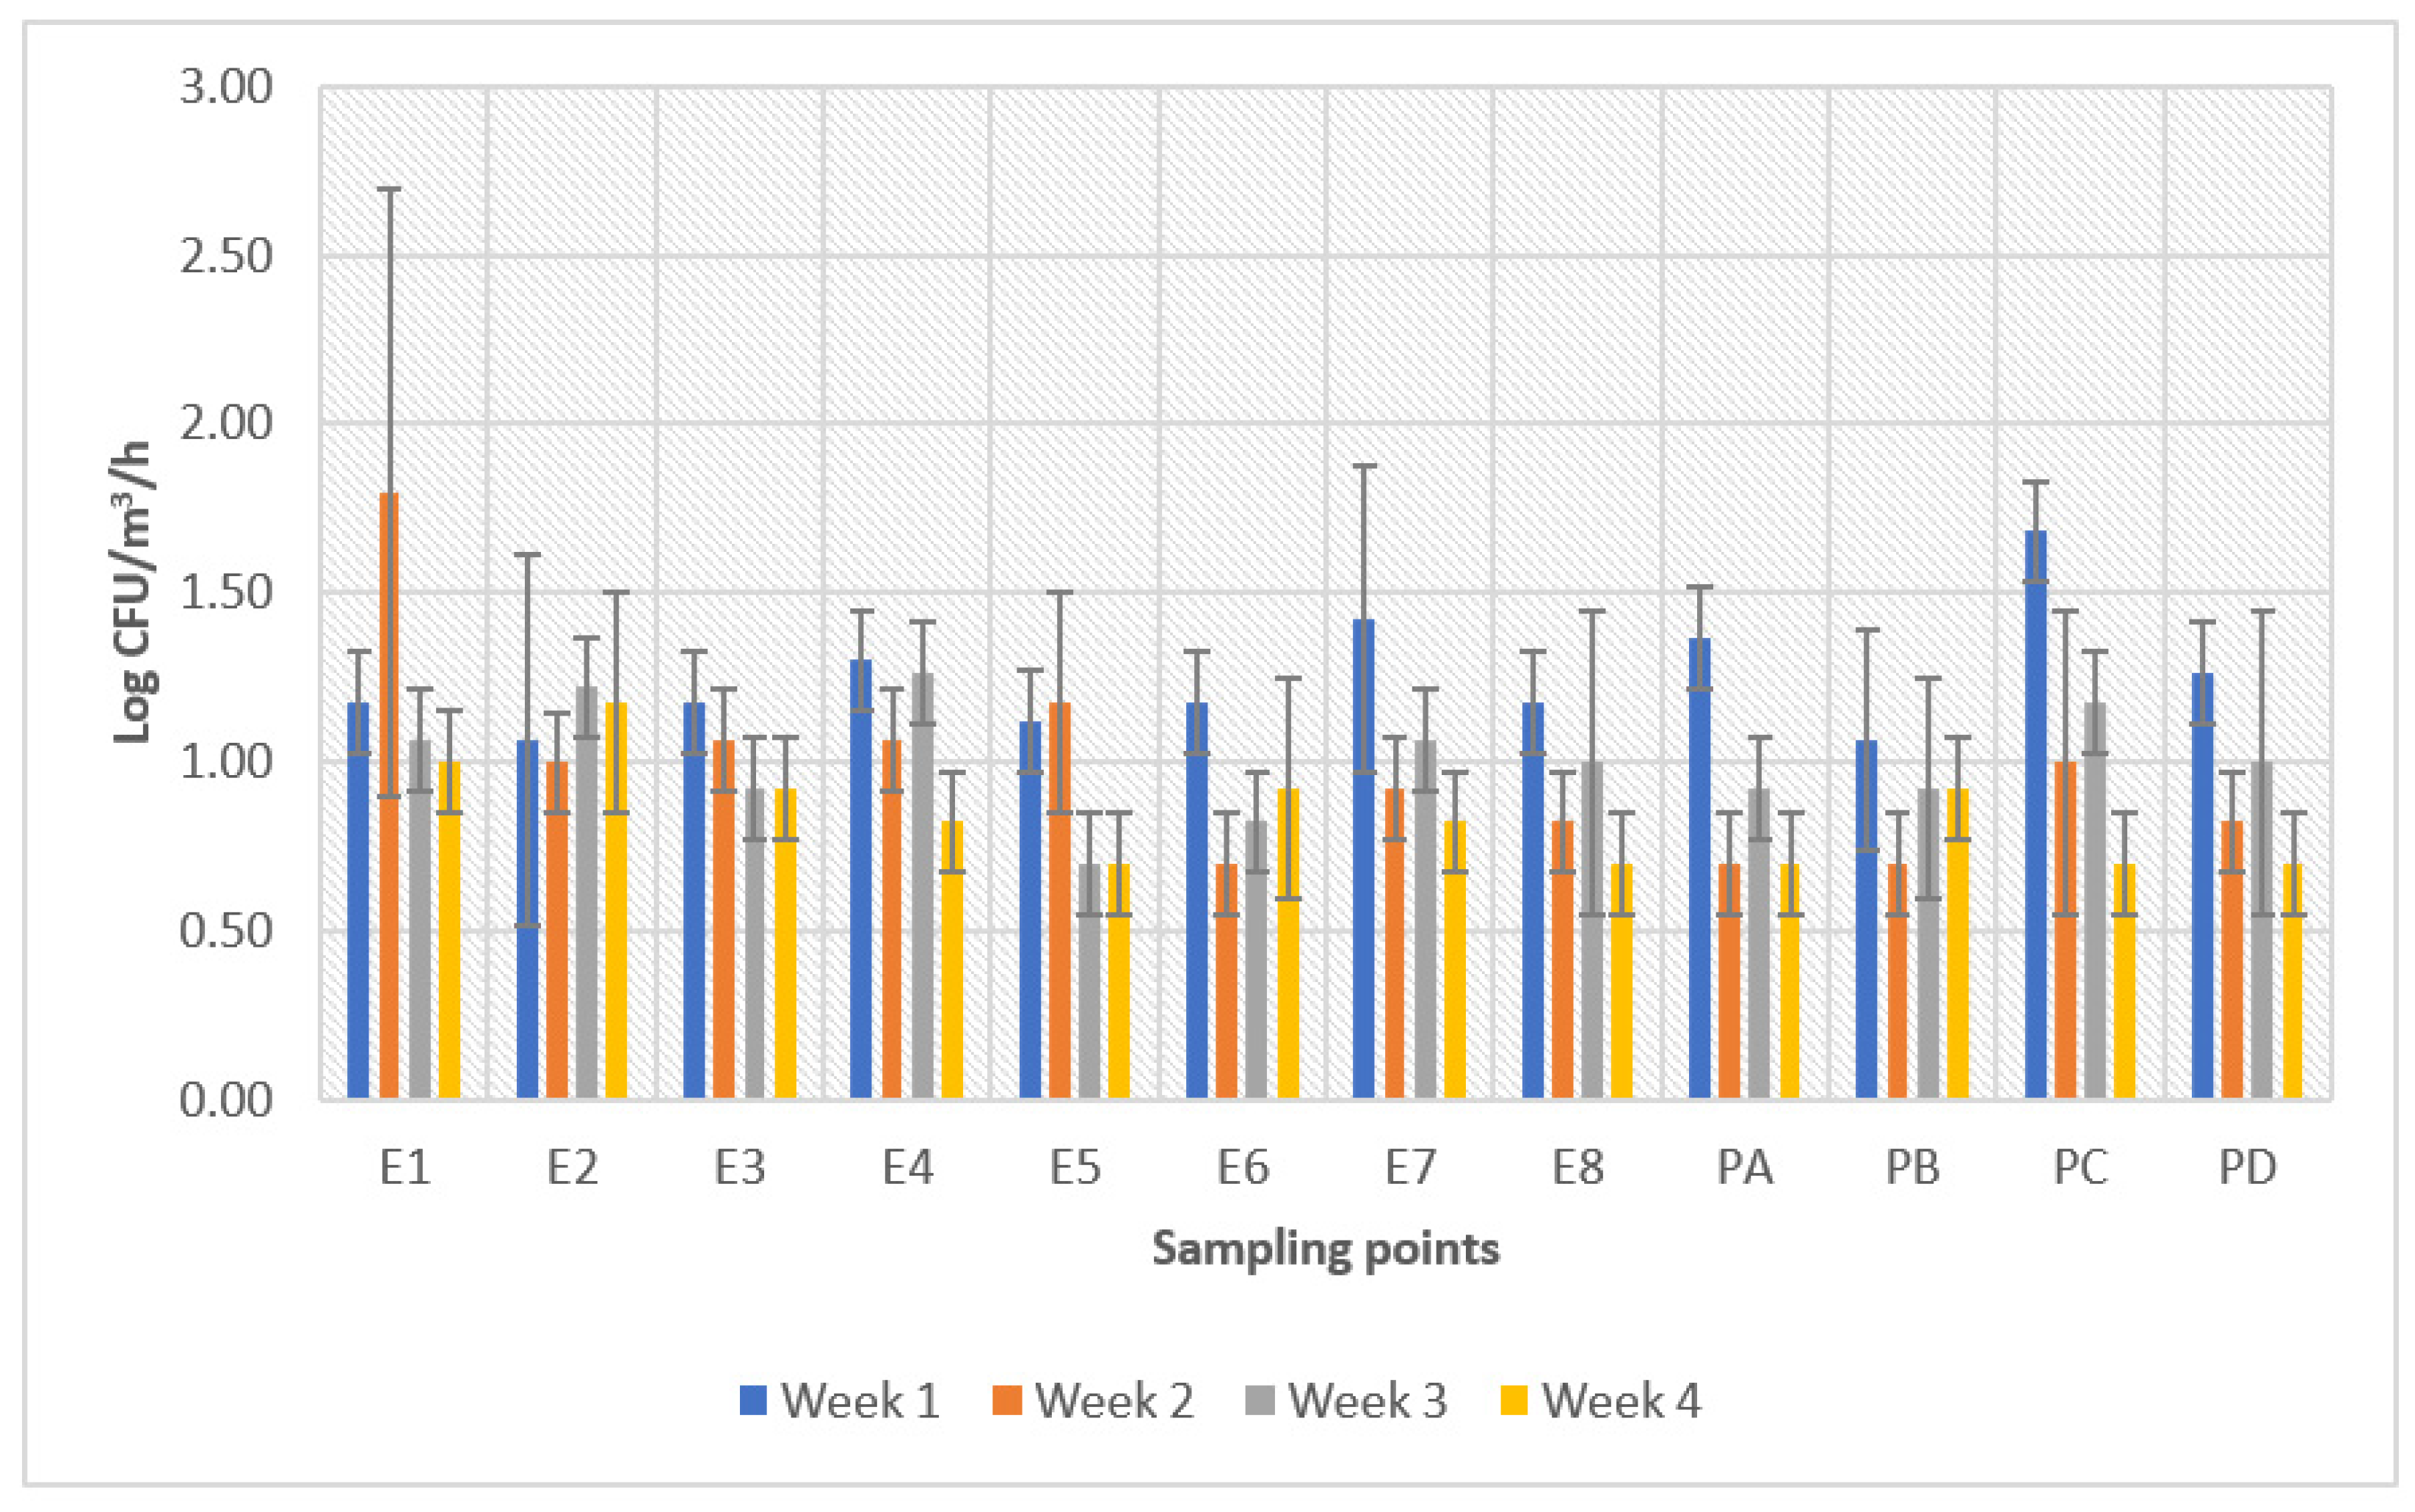
3.3. Coliforms
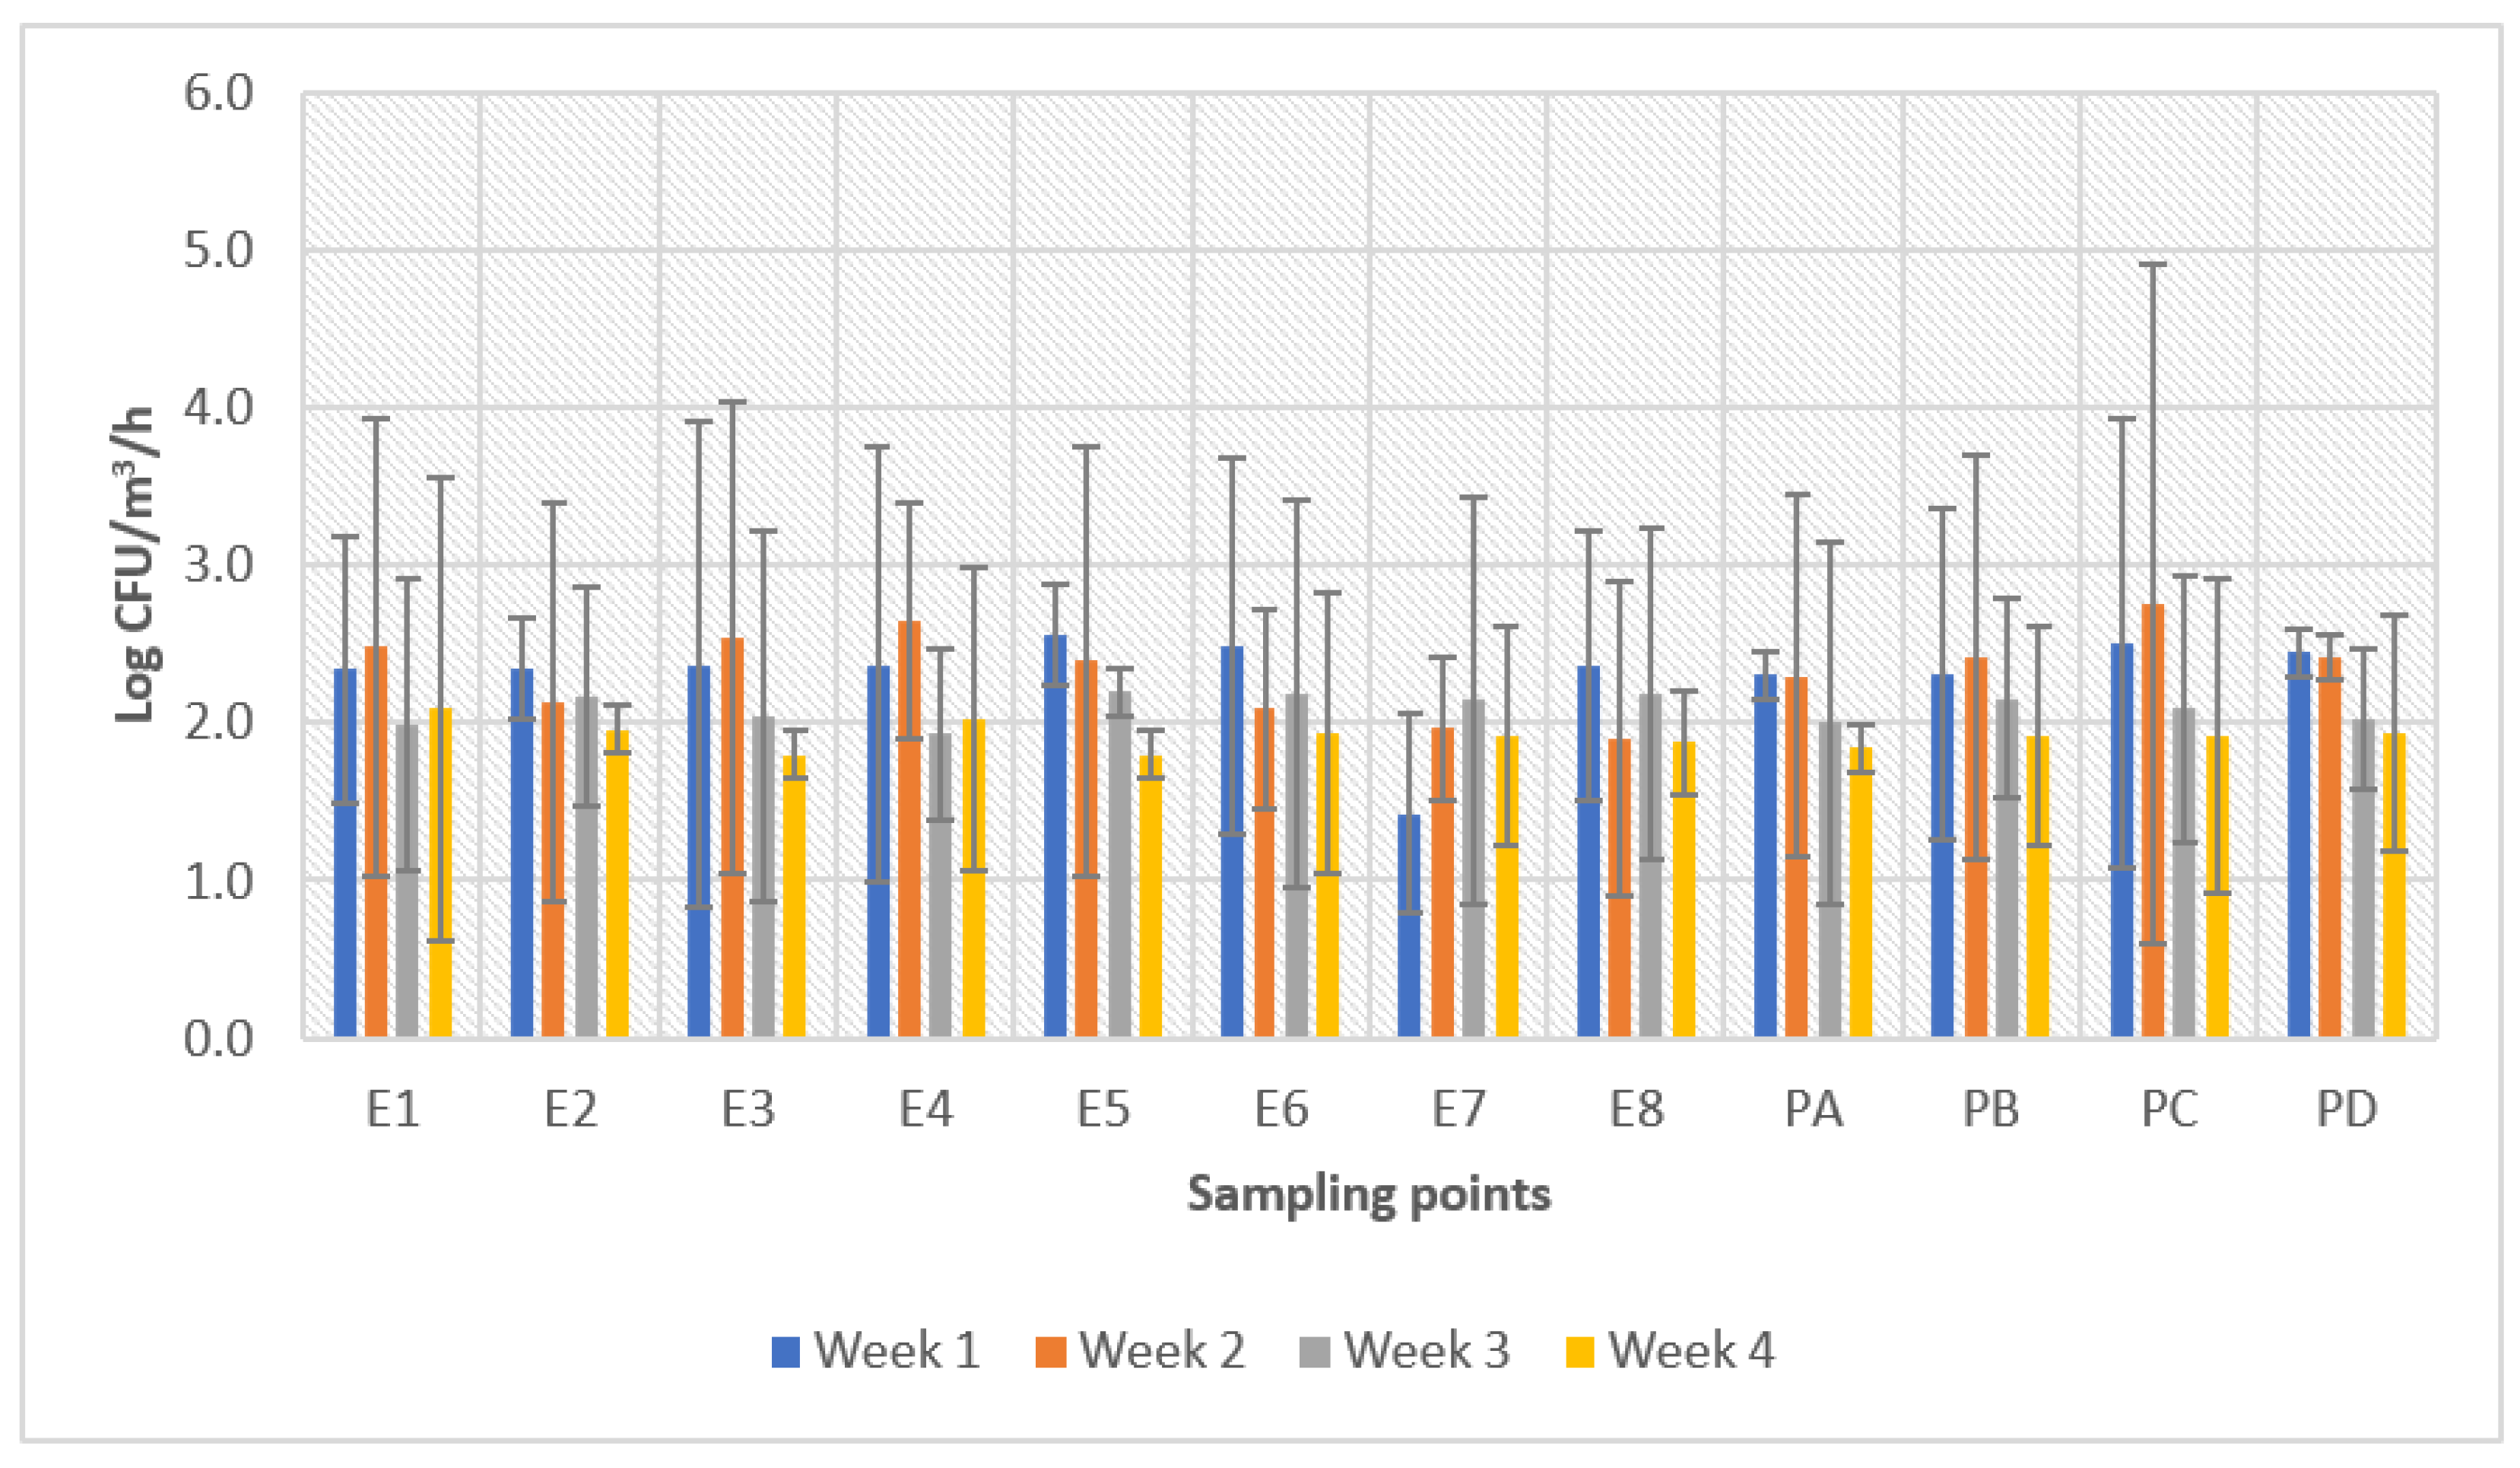
3.4. Molds and Yeast
4. Conclusions
Author Contributions
Funding
Institutional Review Board Statement
Informed Consent Statement
Data Availability Statement
Acknowledgments
Conflicts of Interest
References
- Soares, K.M.P.; Gonçalves, A.A. Qualidade e segurança do pescado. Rev. Inst. Adolfo Lutz 2012, 71, 1–10. [Google Scholar]
- FAO. El Estado Mundial de la Pesca y la Acuicultura 2020; La Sostenibilidad en Acción; Food and Agriculture Organization of the United Nations (FAO): Rome, Italy, 2020. [Google Scholar] [CrossRef]
- Fuertes Vicente, H.G.; Paredes López, F.; Saavedra Gálvez, D.I. Buenas prácticas de manufactura y preservación a bordo: Pescado inocuo. Big Bang Faustiniano 2014, 3, 41–45. [Google Scholar] [CrossRef]
- Rosas, M.R. Contaminaciones alimentarias. Offarm Farm. Y Soc. 2007, 26, 95–100. Available online: https://www.elsevier.es/es-revista-offarm-4-pdf-13107676 (accessed on 3 October 2022).
- Masotti, F.; Cattaneo, S.; Stuknytė, M.; De Noni, I. Airborne contamination in the food industry: An update on monitoring and disinfection techniques of air. Trends Food Sci. Technol. 2019, 90, 147–156. [Google Scholar] [CrossRef]
- Després, V.; Huffman, J.A.; Burrows, S.M.; Hoose, C.; Safatov, A.; Buryak, G.; Jaenicke, R. Primary biological aerosol particles in the atmosphere: A review. Tellus B Chem. Phys. Meteorol. 2012, 64, 15598. [Google Scholar] [CrossRef] [Green Version]
- Pumkaeo, P.; Iwahashi, H. Bioaerosol sources, sampling methods, and major categories: A comprehensive overview. Rev. Agric. Sci. 2020, 8, 261–278. [Google Scholar] [CrossRef]
- Moldoveanu, A.M. Biological Contamination of Air in Indoor Spaces. In Current Air Quality Issues; Nejadkoorki, F., Ed.; IntechOpen: London, UK, 2015. [Google Scholar] [CrossRef] [Green Version]
- Nazaroff, W.W. Indoor bioaerosol dynamics. Indoor Air 2016, 26, 61–78. [Google Scholar] [CrossRef] [Green Version]
- Mainelis, G. Bioaerosol sampling: Classical approaches, advances, and perspectives. Aerosol Sci. Technol. 2020, 54, 496–519. [Google Scholar] [CrossRef]
- De la Rosa, M.C.; Mosso, M.A.; Ullán, C. El aire: Hábitat y medio de transmisión de microorganismos. Obs. Medioambient. 2002, 5, 375–402. [Google Scholar]
- Méndez-Puentes, C.A.; Camacho-Suárez, J.G.; Echeverry-Hernández, S. Identification of bacteria and fungi in the air of Neiva, Colombia. Rev. De Salud Pública 2015, 17, 728–737. [Google Scholar] [CrossRef] [Green Version]
- Quintana, Á.R.; Seseña, S.; Garzón, A.; Arias, R. Factors affecting levels of airborne bacteria in dairy farms: A review. Animals 2020, 10, 526. [Google Scholar] [CrossRef] [PubMed]
- Borrego, S.C.; Perdomo, I.; de la Paz, J.; de Saravia, S.G.G.; Guiamet, P.S. Relevamiento microbiológico del aire y de materiales almacenados en el Archivo Histórico del Museo de La Plata, Argentina y en el Archivo Nacional de la República de Cuba. Rev. Del Mus. De La Plata 2011, 18, 1–18. [Google Scholar]
- Romero Bohórquez, C.A.; Castañeda Alvarado, D.F.; Acosta Peñaloza, G.S. Determinación de la calidad bacteriológica del aire en un laboratorio de microbiología en la Universidad Distrital Francisco José de Caldas en Bogotá, Colombia. Nova 2016, 14, 103–111. [Google Scholar] [CrossRef] [Green Version]
- Daza Pérez, M.Á.; Martínez Benavides, D.X.; Caro Hernández, P.A. Contaminación microbiológica del aire al interior y el síndrome del edificio enfermo. Biociencias 2015, 10, 37–50. [Google Scholar] [CrossRef] [Green Version]
- Sociedad Andaluza de Medicina Preventiva y Salud Pública (SAMPSP). Recomendaciones para la monitorización de la calidad microbiológica del aire (bioseguridad ambiental) en zonas hospitalarias de riesgo. 2016. Available online: https://es.scribd.com/document/425738517/recomendacion-para-el-monitoreo-ambiental (accessed on 30 July 2022).
- Anaya, M.; Gámez-Espinosa, E.; Falco, A.S.; Benítez, E.; Carballo, G. Characterization of indoor air mycobiota of two locals in a food industry, Cuba. Air Qual. Atmos. Health 2019, 12, 797–805. [Google Scholar] [CrossRef] [Green Version]
- Pérez, H.; Sánchez, V.L. Propuesta de diseño de monitoreo ambiental microbiológico para diagnóstico de niveles de contaminación en áreas de procesamiento aséptico. ICIDCA Sobre Los Deriv. De La Caña De Azúcar 2010, 44, 7–14. [Google Scholar]
- Wong-González, E. Metodología para realizar estudios de evidencia microbiológica en plantas procesadoras de alimentos. Agron. Mesoam. 2008, 19, 131–137. [Google Scholar] [CrossRef]
- Maldonado-Vega, M.; Peña-Cabriales, J.J.; De los Santos Villalobos, S.; Castellanos-Arévalo, A.P.; Camarena-Pozos, D.; Arévalo-Rivas, B.; Valdés-Santiago, L.; Hernández-Valadez, L.J.; Guzmán de Peña, D.L. Bioaerosols and Air Quality Assessment in Two Hospitals Located in León, Guanajuato, Mexico. Rev. Int. de Contam. Ambient. 2014, 30, 351–363. [Google Scholar]
- Google Earth. Available online: https://earth.google.com/web/search/mercado+del+mar+tepic/@21.52376293,-104.89082323,929.07108178a,973.97074908d,35y,125.18978547h,44.99999569t,0r/data=CoABGlYSUAolMHg4NDI3MzdhZDIzNzJhZmYxOjB4NzQzYjJkNjlhYzczZGQzNBmqn5LOG4Y1QCFjtmRVBDlawCoVbWVyY2FkbyBkZWwgbWFyIHRlcGljGAIgASImCiQJ--pxAGKINUARlQXJvMiDNUAZrOqgwVo4WsAhKt2vhqs5WsA (accessed on 3 October 2022).
- INEGI. Información por Entidad/Nayarit/Territorio. Instituto Nacional de Estadística y Geografía (INEGI). 2020. Gobierno de México. Available online: https://cuentame.inegi.org.mx/monografias/informacion/nay/territorio/default.aspx?tema=me&e=18 (accessed on 3 October 2022).
- NOM-092-SSA1-1994, Bienes y Servicios; Método Para la Cuenta de Bacterias Aerobias en Placa. NORMA Oficial Mexicana: Mexico, 1995. Available online: http://www.dof.gob.mx/nota_detalle.php?codigo=4886029&fecha=12/12/1995 (accessed on 2 October 2022).
- NOM-111-SSA1-1994, Bienes y Servicios; Método Para la Cuenta de Mohos y Levaduras en Alimentos. NORMA Oficial Mexicana: Mexico, 1995. Available online: http://dof.gob.mx/nota_detalle.php?codigo=4881226&fecha=13/09/1995 (accessed on 2 October 2022).
- NOM-113-SSA1-1994, Bienes y Servicios; Método Para la Cuenta de Microorganismos Coliformes Totales en Placa. NORMA Oficial Mexicana: Mexico, 1995. Available online: http://www.ordenjuridico.gob.mx/Documentos/Federal/wo69536.pdf (accessed on 2 October 2022).
- Viani, I.; Colucci, M.E.; Pergreffi, M.; Rossi, D.; Veronesi, L.; Bizzarro, A.; Capobianco, E.; Affanni, P.; Zoni, R.; Saccani, E.; et al. Passive air sampling: The use of the index of microbial air contamination. Acta Biomed. 2020, 10, 92–105. [Google Scholar] [CrossRef]
- INEGI. Información por Identidad. Instituto Nacional de Geografía y Estadística. 2022. Gobierno de México. Available online: https://cuentame.inegi.org.mx/monografias/informacion/nay/territorio/clima.aspx?tema=me&e=18#:~:text=Clima.,Nayarit&text=El%2091.5%25%20del%20estado%20presenta,restante%200.5%25%20es%20c%C3%A1lido%20h%C3%BAmedo (accessed on 2 October 2022).
- Ortiz, G.; Catalán, V. Calidad microbiológica en ambientes interiores. Gestión Pract. De Riesgos Labor. 2007, 40, 26–31. [Google Scholar]
- Salustiano, V.C.; Andrade, N.J.; Brandão, S.C.C.; Azeredo, R.M.C.; Lima, S.A.K. Microbiological air quality of processing areas in a dairy plant as evaluated by the sedimentation technique and a one-stage air sampler. Braz. J. Microbiol. 2003, 34, 255–259. [Google Scholar] [CrossRef]
- ANMAT. Análisis Microbiológico de los Alimentos. Metodología Analítica Oficial. Microorganismos Indicadores 2014, 3, 1–153. Available online: http://www.anmat.gov.ar/renaloa/docs/analisis_microbiologico_de_los_alimentos_vol_iii.pdf (accessed on 2 October 2022).
- Mansilla Valles, L.M. Calidad Microbiológica del Aire y Superficies en Interiores del Comedor de la Universidad Nacional Agraria de la Selva–Tingo María. Bachelor’s Thesis, Facultad de Recursos Naturales, Universidad Nacional Agraria de la Selva–Tingo María, Tingo María, Perú, 2019. Available online: https://repositorio.unas.edu.pe/bitstream/handle/UNAS/1734/TS_LMMV_2019.pdf?sequence=1&isAllowed=y (accessed on 14 September 2022).
- Douwes, J.; Thorne, P.; Pearce, N.; Heederik, D. Bioaerosol health effects and exposure assessment: Progress and prospects. Ann. Occup. Hyg. 2003, 47, 187–200. [Google Scholar] [CrossRef] [PubMed] [Green Version]
- Karwowska, E. Microbiological Air Contamination in Farming Environment. Pol. J. Environ. Stud. 2005, 14, 445–449. [Google Scholar]
- Solano Cornejo, M.A. Determinación de Mohos Asociados con Alimentos en el Aire de la Ciudad de Lambayeque. Bachelor’s Thesis, Universidad nacional Pedro Ruiz Gallo, Facultad de Ingeniería Química e Industrias Alimentarias, Lambayeque, Perú, 2013. Available online: https://www.researchgate.net/profile/Miguel-Angel-Cornejo-2/publication/322355910_DETERMINATION_OF_MOLDS_ASSOCIATED_WITH_FOOD_IN_THE_AIR_OF_THE_CITY_OF_LAMBAYEQUE/links/5a55b0ffa6fdcc30f86c141b/DETERMINATION-OF-MOLDS-ASSOCIATED-WITH-FOOD-IN-THE-AIR-OF-THE-CITY-OF-LAMBAYEQUE.pdf (accessed on 16 September 2022).
- Alonso, S.B.; Amistad, I.P. Caracterización de la micobiota aérea en dos depósitos del Archivo Nacional de la República de Cuba. Rev. Iberoam. Micol. 2014, 31, 182–187. [Google Scholar] [CrossRef] [PubMed]
- Chang, C.-Y.; Tseng, L.; Yang, L.-S. Microbial air contamination in an intensive care unit. Int. J. Public Health Sci. 2015, 4, 145–151. [Google Scholar]
- Zaravia Peralta, M.I. Control de la Microbiología del Aire, Métodos de Purificación y Microbiología del Hielo. Bachelor’s Thesis, Universidad Nacional de San Agustín, Facultad de Ingeniería de Procesos, Arequipa, Perú, 2014. Available online: http://repositorio.unsa.edu.pe/bitstream/handle/UNSA/4102/IAzapemi028.pdf?sequence=1&isAllowed=y (accessed on 20 September 2022).
- Infante, A.; Bautista, R. El muestreo microbiológico del aire como herramienta de gestión. En Aliment. 2022. Available online: https://enalimentos.lat/articulos/2883-el-muestreo-microbiolo-gico-del-aire-como-herramienta-de-gestio-n.html#:~:text=El%20muestreo%20microbiol%C3%B3gico%20apoya%20a,la%20carga%20ambiental%20de%20microorganismos (accessed on 23 September 2022).
- García Ricárdez, J.J.; Magaña Villegas, E. Calidad del aire en la cafetería principal de la división académica de ciencias biológicas-UJAT. Kuxulkab’ 2019, 24, 5–13. [Google Scholar] [CrossRef]
- Garcinuño Martínez, R.M. Contaminación de los alimentos durante los procesos de origen y almacenamiento. Aldaba Rev. Del Cent. Asoc. A La UNED Melilla 2013, 36, 51–64. [Google Scholar] [CrossRef]


Publisher’s Note: MDPI stays neutral with regard to jurisdictional claims in published maps and institutional affiliations. |
© 2022 by the authors. Licensee MDPI, Basel, Switzerland. This article is an open access article distributed under the terms and conditions of the Creative Commons Attribution (CC BY) license (https://creativecommons.org/licenses/by/4.0/).
Share and Cite
Quintanilla-Martínez, A.S.; Aguirre-Güitrón, L.; Espinosa-Chaurand, L.D.; Diaz-Ramírez, M.; Cortés-Sánchez, A.D.J. Microbiological Analysis of the Air in a Popular Fish Processing and Marketing Area. Appl. Biosci. 2022, 1, 299-314. https://doi.org/10.3390/applbiosci1030019
Quintanilla-Martínez AS, Aguirre-Güitrón L, Espinosa-Chaurand LD, Diaz-Ramírez M, Cortés-Sánchez ADJ. Microbiological Analysis of the Air in a Popular Fish Processing and Marketing Area. Applied Biosciences. 2022; 1(3):299-314. https://doi.org/10.3390/applbiosci1030019
Chicago/Turabian StyleQuintanilla-Martínez, Angélica Sinaí, Lizet Aguirre-Güitrón, Luis Daniel Espinosa-Chaurand, Mayra Diaz-Ramírez, and Alejandro De Jesús Cortés-Sánchez. 2022. "Microbiological Analysis of the Air in a Popular Fish Processing and Marketing Area" Applied Biosciences 1, no. 3: 299-314. https://doi.org/10.3390/applbiosci1030019