1. Introduction
The transport of nutrients from foods inside the gastrointestinal tract to the bloodstream is an important part of all animal digestion, including that of humans, and nutrients are examples of solutes. This solute transport is an example of mass transfer, because various nutrient (solute) components of the food may be transported at different mass-transfer rates. There appear to be two main general schools of thought about in vitro food digestion: those that emphasise the importance of the chemistry [
1,
2] and those that emphasise the geometry and operational appearance of the in vitro system [
3]. One theory that connects these two points of emphasis is mass-transfer theory.
When discussing mass-transfer theory, the focus here is specifically on the fundamentals of the mass-transfer process, from the basic equation to the implementation in food digestion. The overall equation for the mass-transfer rate of any component [
4] is
Here, NA is the mass-transfer rate (kg s−1), K is the overall mass-transfer coefficient (m·s−1), A is the interfacial surface area (between phases, m2), and C1 and C2 are the concentrations inside the food and inside the bloodstream, respectively (kg m−3).
An underlying theme of some reviews of food digestion [
3] is the suggestion that the “realism” of the in vitro food-digestion system is critical in achieving good agreement between in vitro and in vivo food-digestion outcomes. In this context, “realism” appears to be connected with the geometry, shape and morphology and anatomy of the in vitro system. It is suggested here that the main reason why the morphology and anatomy matter is because they affect the surface area (
A) and the mass-transfer coefficient (
K). However, the same values of these parameters (
A and
K) may be obtained from different geometries and operating conditions. Apart from the surface area (
A), which is a fairly obvious parameter affecting the mass-transfer rate, the mass-transfer coefficient, which is not such an obvious parameter as the surface area, is the main parameter affecting the mass-transfer rate between food and the gastric juices and between the gastric juices and the walls of the gastrointestinal tract. The main parameters affecting the concentrations and concentration differences are the state of the biochemical environment, including the chemicals (enzymes, reactants, products) and the microorganisms that are present. It is at least possible to keep the biochemical environment the same, or very similar, in in vivo and in vitro systems.
If there are two systems—for example, a real in vivo system and any in vitro (model) system—they should behave in the same way from a mass-transfer and biochemical-reaction perspective if the mass-transfer coefficient is the same and if all aspects of the biochemical environment (enzymes, solutions, microorganisms) are also the same. These considerations mean that the reasons for disagreement between in vivo and in vitro systems may be seen in the light of differences in surface areas in mass-transfer coefficients and in the biochemical environments. It is possible to suggest that the digestion process is more complicated than this apparently simple picture, but the complications are included in this theory. For example, particle-size reduction is part of the digestion process, and according to the above perspective, the particle size of a food affects the mass-transfer coefficient. Hence, particle-size reduction fits into the mass-transfer perspective, and particle size also affects the residence time of food in the gastrointestinal system [
5].
The comparison of in vivo and in vitro (model) systems has been extensively reviewed in the literature [
3,
6], and interest continues [
7,
8] in the development and use of in vitro systems. The perspective given in this paper (mass transfer) may be useful to translate results from the static to the dynamic simulations, because the dynamics of gastrointestinal microbiome composition are associated with many factors, including age, nutrition, health status, and drug treatments. A “unit operations” approach to considering food digestion as a multiscale process has been discussed by Bornhorst et al. [
9], which mentions mass transfer and discusses it qualitatively.
The aim of this review is to show several ways in which mass-transfer theory can contribute to the understanding of food digestion. In the first section, it is shown that there may be several mass-transfer resistances at any point in a system, and these resistances tend to be additive, as will now be reviewed. In the second section, the time constants for mass transfer will be reviewed, showing how they contribute a time scale to the understanding of various sections of the gastrointestinal (GI) tract. Finally, an example will be given, showing how the calculations of individual mass-transfer coefficients for the time constants can also be used to estimate overall multifilm mass-transfer resistances and coefficients, and a gut-on-a chip system will also be reviewed in this context.
2. Multifilm Mass-Transfer Theory
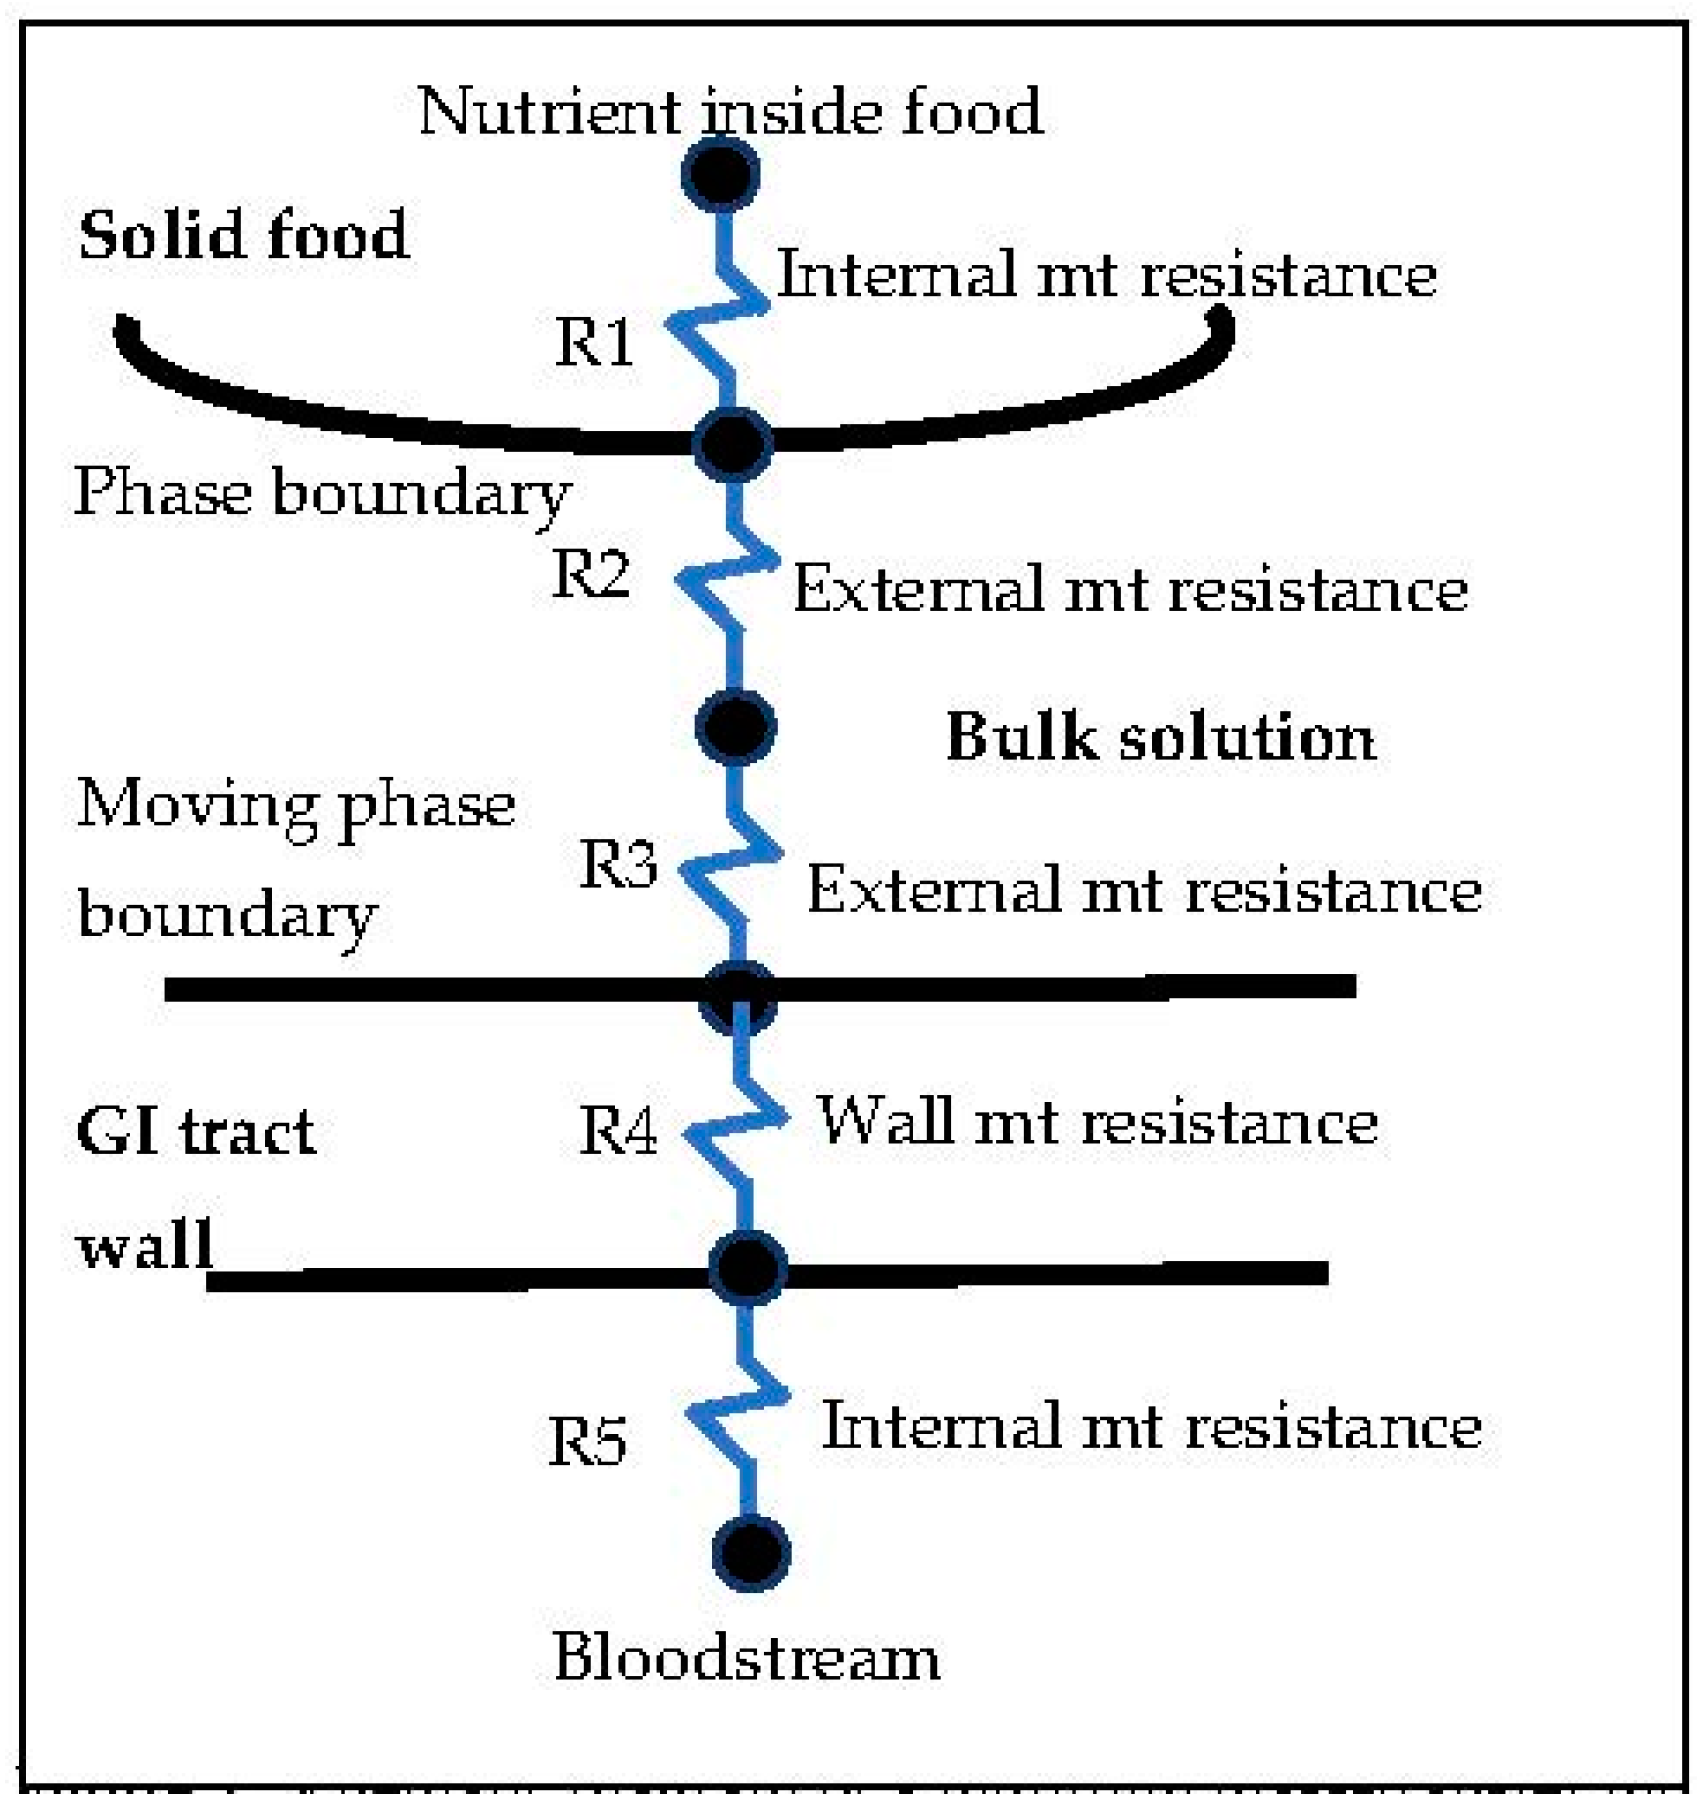
As shown in
Figure 1, this transport process, as described in this paper, includes several mass-transfer resistances, including the resistance inside a food (
R1), outside the food in the external boundary layer (
R2), outside the walls of the intestine in another boundary layer (
R3), inside the walls of the intestine (
R4), and between the intestine walls and the bloodstream (
R5) [
4]. The internal mass-transfer resistance inside a food may be zero if the food is a pure substance, which is very rare. There will always be external mass-transfer resistances (
R2 and
R3) because of boundary layers that must form, due to velocity differences between the walls or external surfaces of the food and of the intestine, on one hand, and the bulk of the solutions inside the gastrointestinal tract, on the other hand.
Two-film mass-transfer theory [
4] can be extended to this situation, giving the equation
where the subscript
i refers to each of the boundary layers or film mass-transfer resistances shown in
Figure 1,
Ri is the mass-transfer resistance for each part of the transport process,
Ai is the corresponding interfacial surface area,
ki is the film mass-transfer coefficient,
K is the overall coefficient, and
H1i is the equilibrium or partition coefficient between the food (1) and each location in
Figure 1.
A potential objection to the use of two-film mass-transfer theory is that, anecdotally, some might say that it has been developed for steady-state mass transfer and therefore that it cannot be applied to the inherently unsteady-state mass-transfer situation in food digestion. However, this is not true. The development of two-film theory for steady-state mass transfer does not limit its application to steady-state situations, due to the following part of the derivation (e.g., pp. 238–239, [
4]). The only requirement in two-film theory for steady state is that the interface region should be thin, so the flux across it must achieve steady state quickly relative to the rates of change for the bulk concentrations. There is nothing in the derivations that limits the theory to overall steady-state situations. In addition, there are some papers in the literature, such as Tharakan et al. [
10], where two-film mass-transfer theory has been applied to food digestion with some success.
A particular feature of Equation (2), which has important implications for the overall mass-transfer rate, is the addition of the inverses of various film mass-transfer resistances, which means that the largest film mass-transfer coefficients have the smallest impact on the overall mass-transfer coefficient. The equation also implies that adding another film to the series of mass-transfer resistances will reduce the overall mass-transfer coefficient. Since the overall mass-transfer coefficient is proportional to the rate of change for the bulk concentration in a system with a fixed geometry, adding another film to the series of mass-transfer resistances will also reduce the rate of bulk concentration change.
A dimensionless group, the Biot number (
Bi), has been used to compare the internal and external resistances to heat and mass transfer in many unsteady-state situations, such as drying [
11,
12]. In the case of a food, the internal resistance to mass transfer might be represented by
L/
D, with
L being the effective half-thickness and
D being the diffusion coefficient, while the external resistance to mass transfer might be represented by 1/
k, where
k is the external-film mass-transfer coefficient. Then, the Biot number is given by the ratios of the internal to the external resistances, or
Bi = (
L/
D)/(1/
k) = (
Lk/
D). This dimensionless group is useful for indicating where the main resistance to nutrient movement occurs in a system.
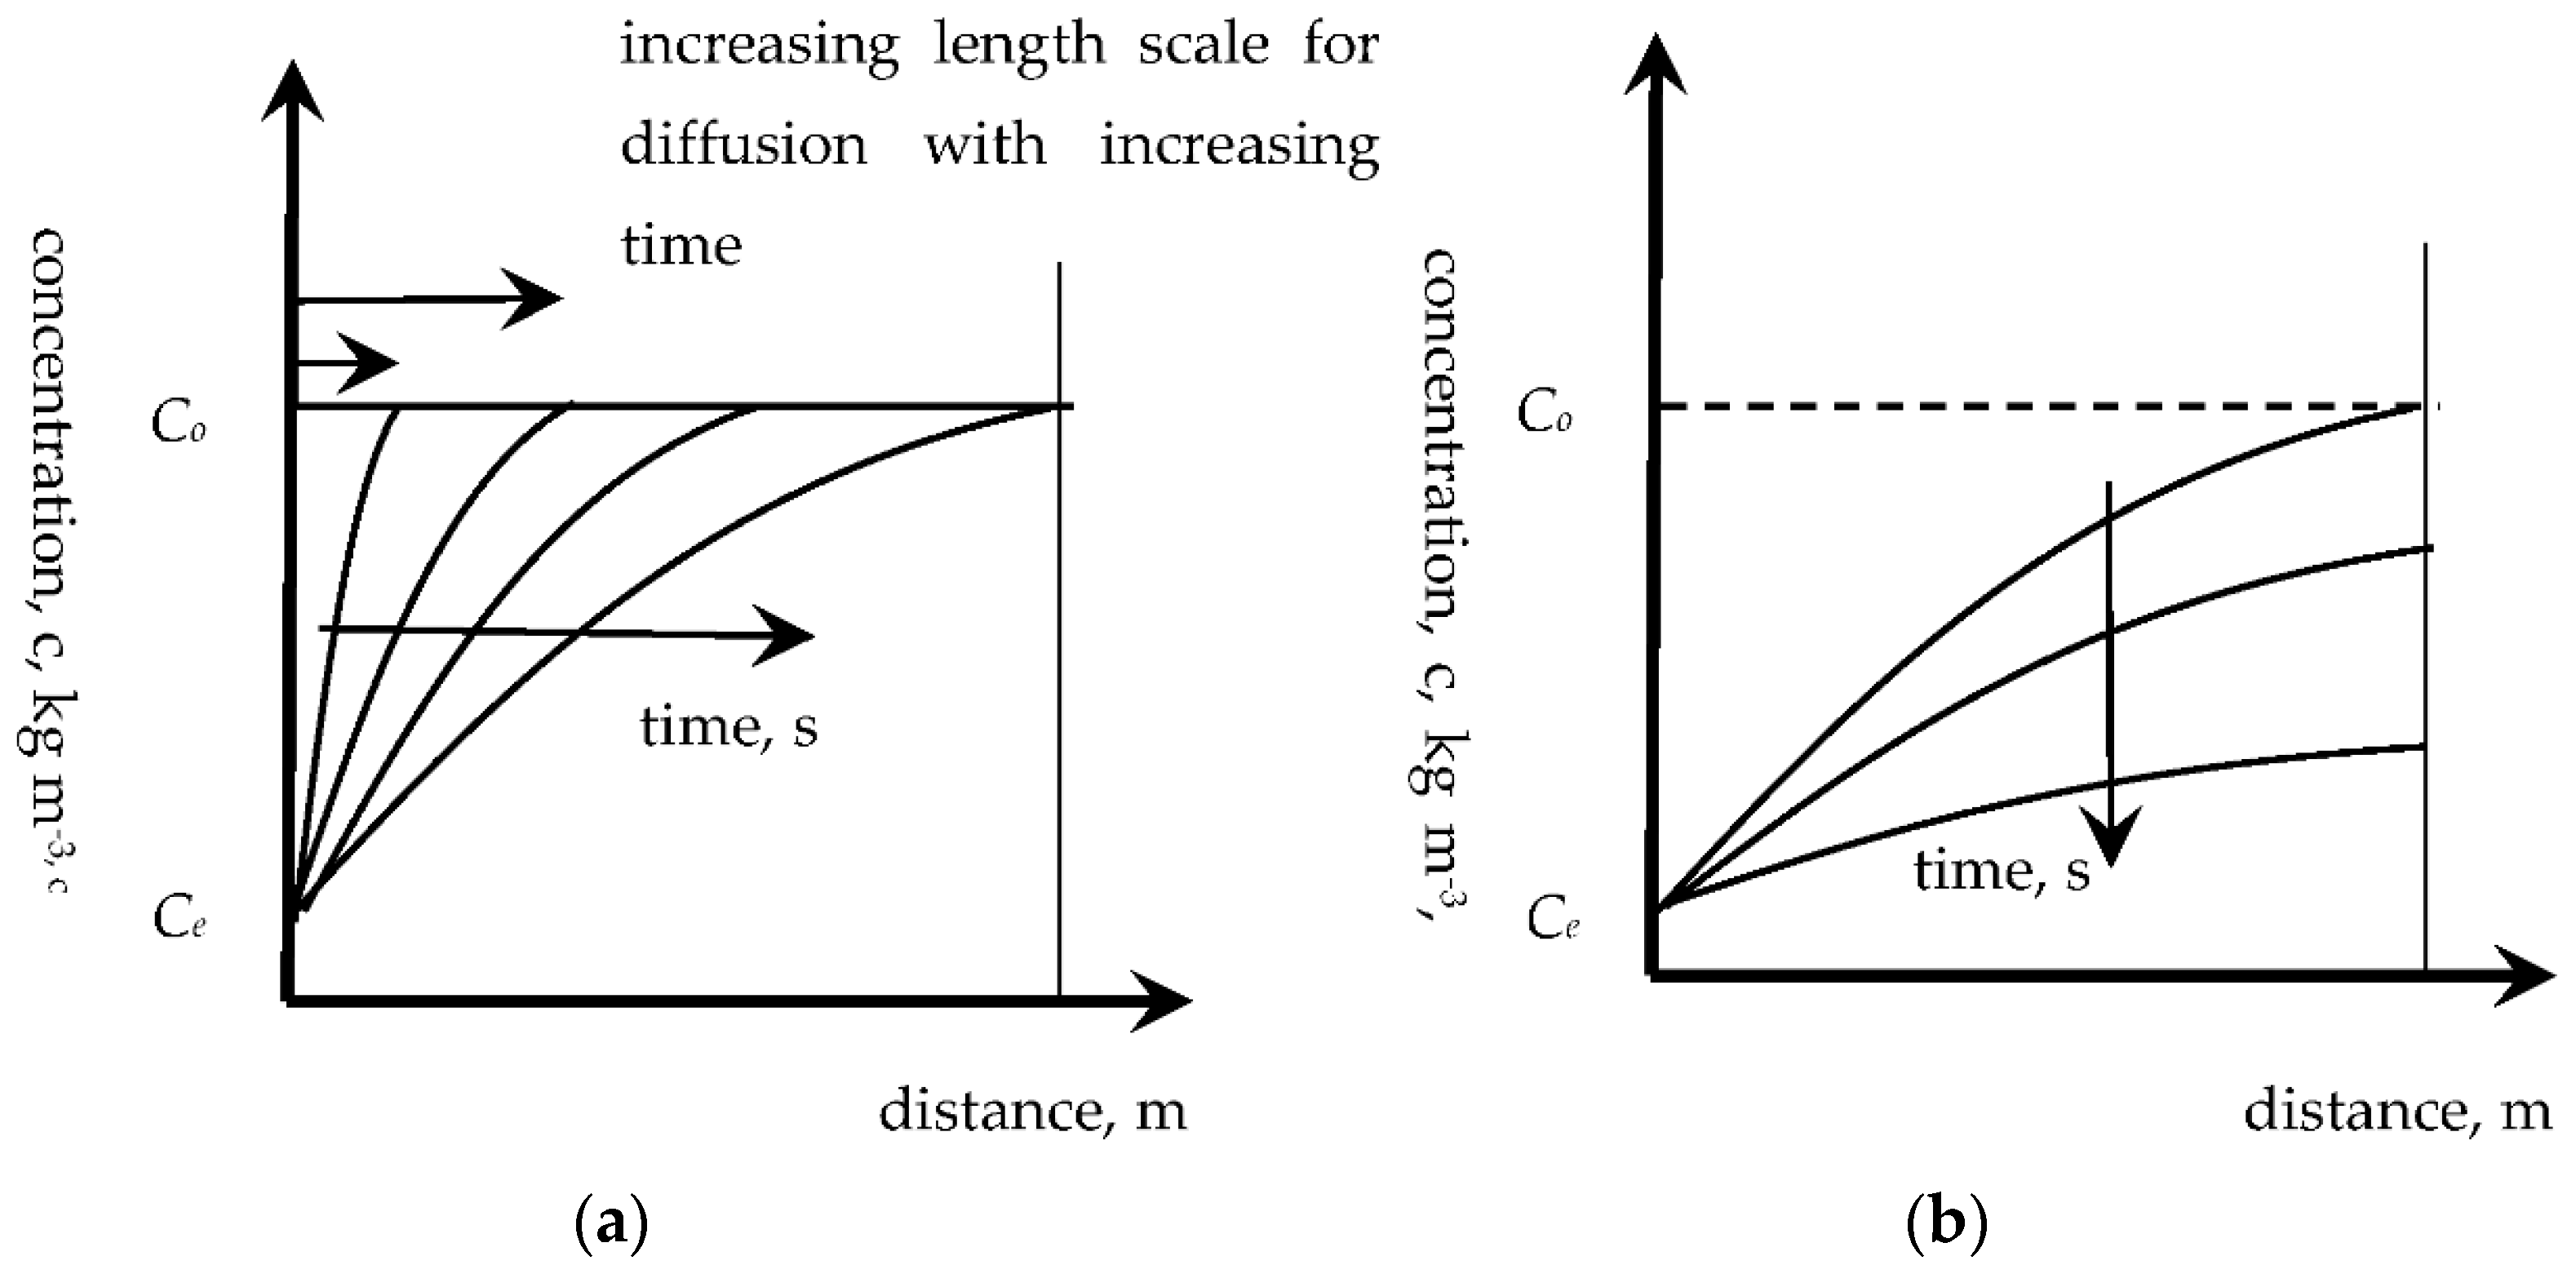
Further reviewing the concept of multifilm mass-transfer theory and its application to the unsteady-state situation of food digestion, the fundamental process of diffusion out of a food can also be viewed from the perspective of mass-transfer film theory, in the following way. As highlighted by Hallström et al. [
13], the unsteady-state diffusion process proceeds by a diffusive front moving through a material (shown in
Figure 2 for a finite slab, but similar in general shape and behaviour for any shape of material) initially penetrating through the material. This penetration period extends until the diffusive front has moved through the material (or halfway, if the penetration occurs from both sides of a slab). The remaining period, the so-called regular regime, involves the concentrations decreasing throughout the material, more quickly at the surface and more slowly in the bulk.
Therefore, the development of a diffusive profile has some similarities with the concept of a receding front, although a receding front typically has a sharper and steeper concentration change and the two transport processes are, of course, different. It is possible to define a distance,
L, during the penetration period, over which the main change in concentration occurs, where the distance
L varies from zero to the centre, or the centreline, or the halfway point through the solid material. In this case, the overall mass-transfer resistance consists of external and internal resistances, as expressed in the following equation:
Here, k1 is the external mass-transfer coefficient, H12 is the partition or equilibrium coefficient for the solute between the two phases, and k2 is the internal mass-transfer coefficient, which can be further expressed as the diffusion coefficient (D) divided by the distance over which the diffusion occurs (L). In the early stages, when the solute is just starting to diffuse out of the food, the effective distance over which diffusion occurs (L) is small, so the effective internal mass-transfer coefficient is very high (k2 = D/L), so the effective internal mass-transfer resistance is very low (H12/k2 = H12/(D/L)). This situation means that, in the early stages, the overall mass-transfer coefficient (K) is dominated by the external mass-transfer coefficient (k1).
This situation also means that as the diffusion of the solute out of the food continues, the effective diffusion distance L increases, increasing the effective internal mass-transfer resistance (H12/k2 = H12/(D/L) = L H12/D) and decreasing the effective internal mass-transfer coefficient. This decrease in the internal mass-transfer coefficient decreases the overall mass-transfer coefficient (K) as diffusion increases. It is now shown how this decrease in the overall mass-transfer coefficient affects the overall mass-transfer rate (NA), as shown in Equation (1), from the perspective of how the bulk concentration (Cb) in the solution surrounding the food changes as a function of time (d·Cb/dt).
This discussion connects with some tablet dissolution models, particularly the zero-order model, in that zero-order kinetics [
14] may be expected if there is a resistive layer of thickness
L, with a diffusivity through that layer of
D, giving an effective internal mass-transfer coefficient of
k2 =
D/
L, and an effective internal mass-transfer resistance of
H12/
k2 =
H12/(
D/
L)). A similar type of diffusive resistance across a finite distance may be imagined for the mass transfer of solutes (including reactants and products) across a plant cell wall, as described for the hydrolysis of starch by Li et al. [
15].
The external mass-transfer coefficients, outside the foods, have received some attention (
R2 and
R3 in
Figure 1) in Langrish et al. [
16], who measured these external coefficients outside tablets. They found that the Ranz–Marshall correlation could be used to give a lower estimate of the external coefficients, and this work could be extended to foods, with irregular shapes, using equivalent diameters. The equivalent diameter may be used to estimate the Reynolds number (
Re), the fluid properties are then used to estimate the Schmidt number (
Sc), and the resulting Sherwood number (
Sh) is then used to estimate the external mass-transfer coefficient (
k1). The Reynolds (
Re) and Schmidt (
Sc) numbers are defined by the following two equations:
The Ranz–Marshall correlation [
17] for mass transfer and the Sherwood number (
Sh) are defined as follows:
In the above equations, d is the equivalent diameter of the food (m), D is the diffusivity of the solute (nutrient) through the solvent (m2·s−1), U is the relative velocity between the food and the solvent (m·s−1), and ρ (kg·m−3) and μ (kg·m−1·s−1) are the density and viscosity of the solvent, respectively. The external mass-transfer coefficient, k1·(m·s−1), has been discussed previously.
The relationship between the external mass-transfer coefficient and the shear stresses and shear strains in the solid–fluid system for food digestion (as reviewed by Zhong and Langrish [
6]) may be estimated using analogies between mass and momentum transfer (fluid mechanics). These analogies allow, for example, momentum-transfer parameters to be estimated from external mass-transfer coefficients. These analogies have a long track record, reviewed in Cussler ([
4], pp. 509–511). The fundamental idea is that heat, mass and momentum transfer are all similar processes, limited by transport processes through a boundary layer inside or outside a material (here, a food). The shear stress (
τ) is related to the friction factor (
f) by the following equation:
The Chilton–Colburn analogy is a well-known way to relate friction factors, heat-transfer coefficients (
h) and external mass-transfer coefficients (
k):
Here,
Pr is the Prandtl number, which is a dimensionless group containing fluid properties for heat transfer, and
Cp is the specific heat capacity of the fluid. Equations (7) and (8) allow the shear stresses and the external mass-transfer coefficients to be related to each other and compared, by rearranging Equation (8), as follows:
This approach may be used to compare trends in estimated shear stresses with corresponding trends in mass-transfer coefficients and/or dissolution rates.
Hopgood et al. [
18] have presented a comparison of two in vitro systems, namely TIMagc (a relatively realistic stomach system, in terms of the geometry) and the industrially common USP-II dissolution apparatus (a formalised beaker and stirrer system)for the dissolution of erosion-limited tablets. Shear rates were predicted in both type of equipment using Computational Fluid Dynamics, and erosion rates were both predicted and measured experimentally. The predicted Reynolds numbers were also compared with in vivo estimates (
Re = 0.01–30). The TIMagc apparatus, featuring intermittent flows, showed wall shear rates that were time-dependent, while the rates in the USP-II apparatus were more constant and were directly proportional to the impeller speed. Regarding the Reynolds numbers, they concluded that the conditions (
Re) in the TIMagc were mainly in the same range as found with in vivo stomachs, but that the Reynolds numbers at the bottom of the USP-II apparatus were above the range of in vivo conditions for impeller speeds of 25–100 rpm, with the flow regime for these USP-II conditions being turbulent. The overall conclusion was that on the basis of the wall shear rates and range of Reynolds number, the TIMagc apparatus was more likely to successfully approach in vivo dissolution rates for tablets. Mass-transfer coefficients were not compared in this study.
The discussion of mass-transfer coefficients (and hence mass-transfer rates) is also relevant to estimating the time scales over which the mass-transfer processes occur, as will be reviewed in the following section.
3. Time Constants and Time Scale for Food Digestion
As demonstrated by Langrish et al. [
16], the time constant may be used to characterise a mass-transfer process, where the time constant for mass transfer (
τ, s) may be defined in terms of the mass-transfer coefficient (
k, m·s
−1), the volume of solution (
V, m
3), and the interfacial surface area (
A, m
2),
τ =
V/(
A k). The general significance of a time constant is that it characterises the dynamic response of any system [
19], such that a period of one time constant means that 63% of a step change in an input will be seen in the output. For periods of two and three time constants, the percentages (of a complete response to a step change in the input) increase to 87% and 95%, respectively.
For each section of the gastrointestinal tract, volumes and surface areas for absorption (including villi, which are small projections which increase the surface areas over the values for a cylinder) may be estimated from the values of the lengths and diameters given by Ritschel [
20]. The volumes of each section may be estimated from the volumes of equivalent cylinders with the stated lengths and diameters. In addition, it is possible to estimate mass-transfer coefficients and time constants for each section. These mass-transfer coefficients represent the mass-transfer process from the fluid inside the GI tract to the walls of different parts of this GI tract (R3 in
Figure 1).
A sample calculation for the time constant or time scale for the duodenum follows, using a flow velocity of 0.02 m·s
−1 [
3]. Using the absorption area of 0.09 m
2 from Ritschel [
20], the length of 0.25 m, and the diameter of 0.05 m from Ritschel [
20], with the physical properties of water (density,
ρ, 1000 kg·m
−3; viscosity, μ, 0.001 kg·m
−1·s
−1) gives the Reynolds number, according to the equation:
An appropriate correlation for laminar flow along a tube, for mass transfer to the tube wall, is given in Table 8.3.3 of Cussler [
4], with an estimate of the diffusivity being given by a representative value from Table 5.2-1 of Cussler [
4], 0.5228 × 10
−9 m
2·s
−1, for sucrose at infinite dilution through water at 25 °C. The correlation gives:
From the length (0.25 m) and the diameter (0.05 m), the volume of this cylindrical region is 0.491 × 10
−3 m
3. With the previous absorption area of 0.09 m
2, the time constant is then given by the following equation:
This time constant may be compared with the typical range of residence times in the small intestine stated by Li et al. [
3] of 2–5 h, suggesting that the characteristic times for mass transfer (1–3 time constants = 1.2–3.6 h) are a substantial part of the residence time. This comparison further suggests that mass transfer is a significant process in that section (the duodenum) of the gastrointestinal tract. This conclusion is perhaps not too surprising, because the duodenum is well-known [
3] to be responsible for a significant part of the absorption processes in the GI tract, and absorption is a mass-transfer process. However, this comparison does highlight and validate the use of mass-transfer time constants for assessing the importance of mass transfer in different sections of the GI tract.
These calculations have been repeated for various sections of the gastrointestinal tract, including calculations for the corresponding Reynolds numbers, mass-transfer coefficients, and time constants, as shown in
Table 1. The residence time in the large intestine quoted by Li et al. [
3] of 12–24 h may be compared with the time constants from
Table 1 of 3.6 h for the cecum and 4.8 h for the colon. Again, the mass-transfer time constants are smaller than the residence time, but the orders of magnitude are similar, pointing to some mass-transfer processes occurring in the large intestine too, such as the absorption of water from foods.
Apart from the mass-transfer process from the fluid solution inside the GI tract to the walls of different parts of this GI tract (
R3 in
Figure 1), there is also some relevant research on the mass-transfer process from the outside of the food into the fluid solution inside the GI tract (
R2 in
Figure 1). This work was reviewed and extended by Langrish et al. [
16], who found that the external mass-transfer coefficients from 13 mm diameter tablets ranged from 0.193–4.48 × 10
−5 m·s
−1 in a beaker and stirrer system and 0.222–3.45 × 10
−5 m·s
−1 in a copy of the USP dissolution apparatus 2. It is reasonable to suggest that a similar range of external mass-transfer coefficients should be found outside tablets and outside foods of the same sizes and dimensions, since the concept of an external mass-transfer coefficient is that it does not depend on the nature of the internal material. For predicting these external mass-transfer coefficients, the use of dimensional analysis showed that the Ranz–Marshall correlation gave reasonable estimates.
These external mass-transfer coefficients from tablets or foods are of the order of 10
−5 m·s
−1, which are at least an order of magnitude larger than those listed in
Table 1, which are generally around 10
−6 m·s
−1. However, the interfacial areas for the tablets or foods are also smaller than the wall areas for the GI tract. Given these competing considerations, it is not too surprising that the time constants for external mass transfer from the surface of the food into the gastrointestinal fluid may also be significant. Langrish et al. [
16] estimated time constants for external mass transfer outside tablets as ranging from 67 s for 0.3 mm diameter tablets to 6750 s for 3 mm objects, or up to 2 h. These time constants cover the same range as the stomach residence times quoted by Zhong and Langrish [
6] and Li et al. [
3] of 85–120 min and 15 min to 3 h, respectively.
4. Sample Calculation
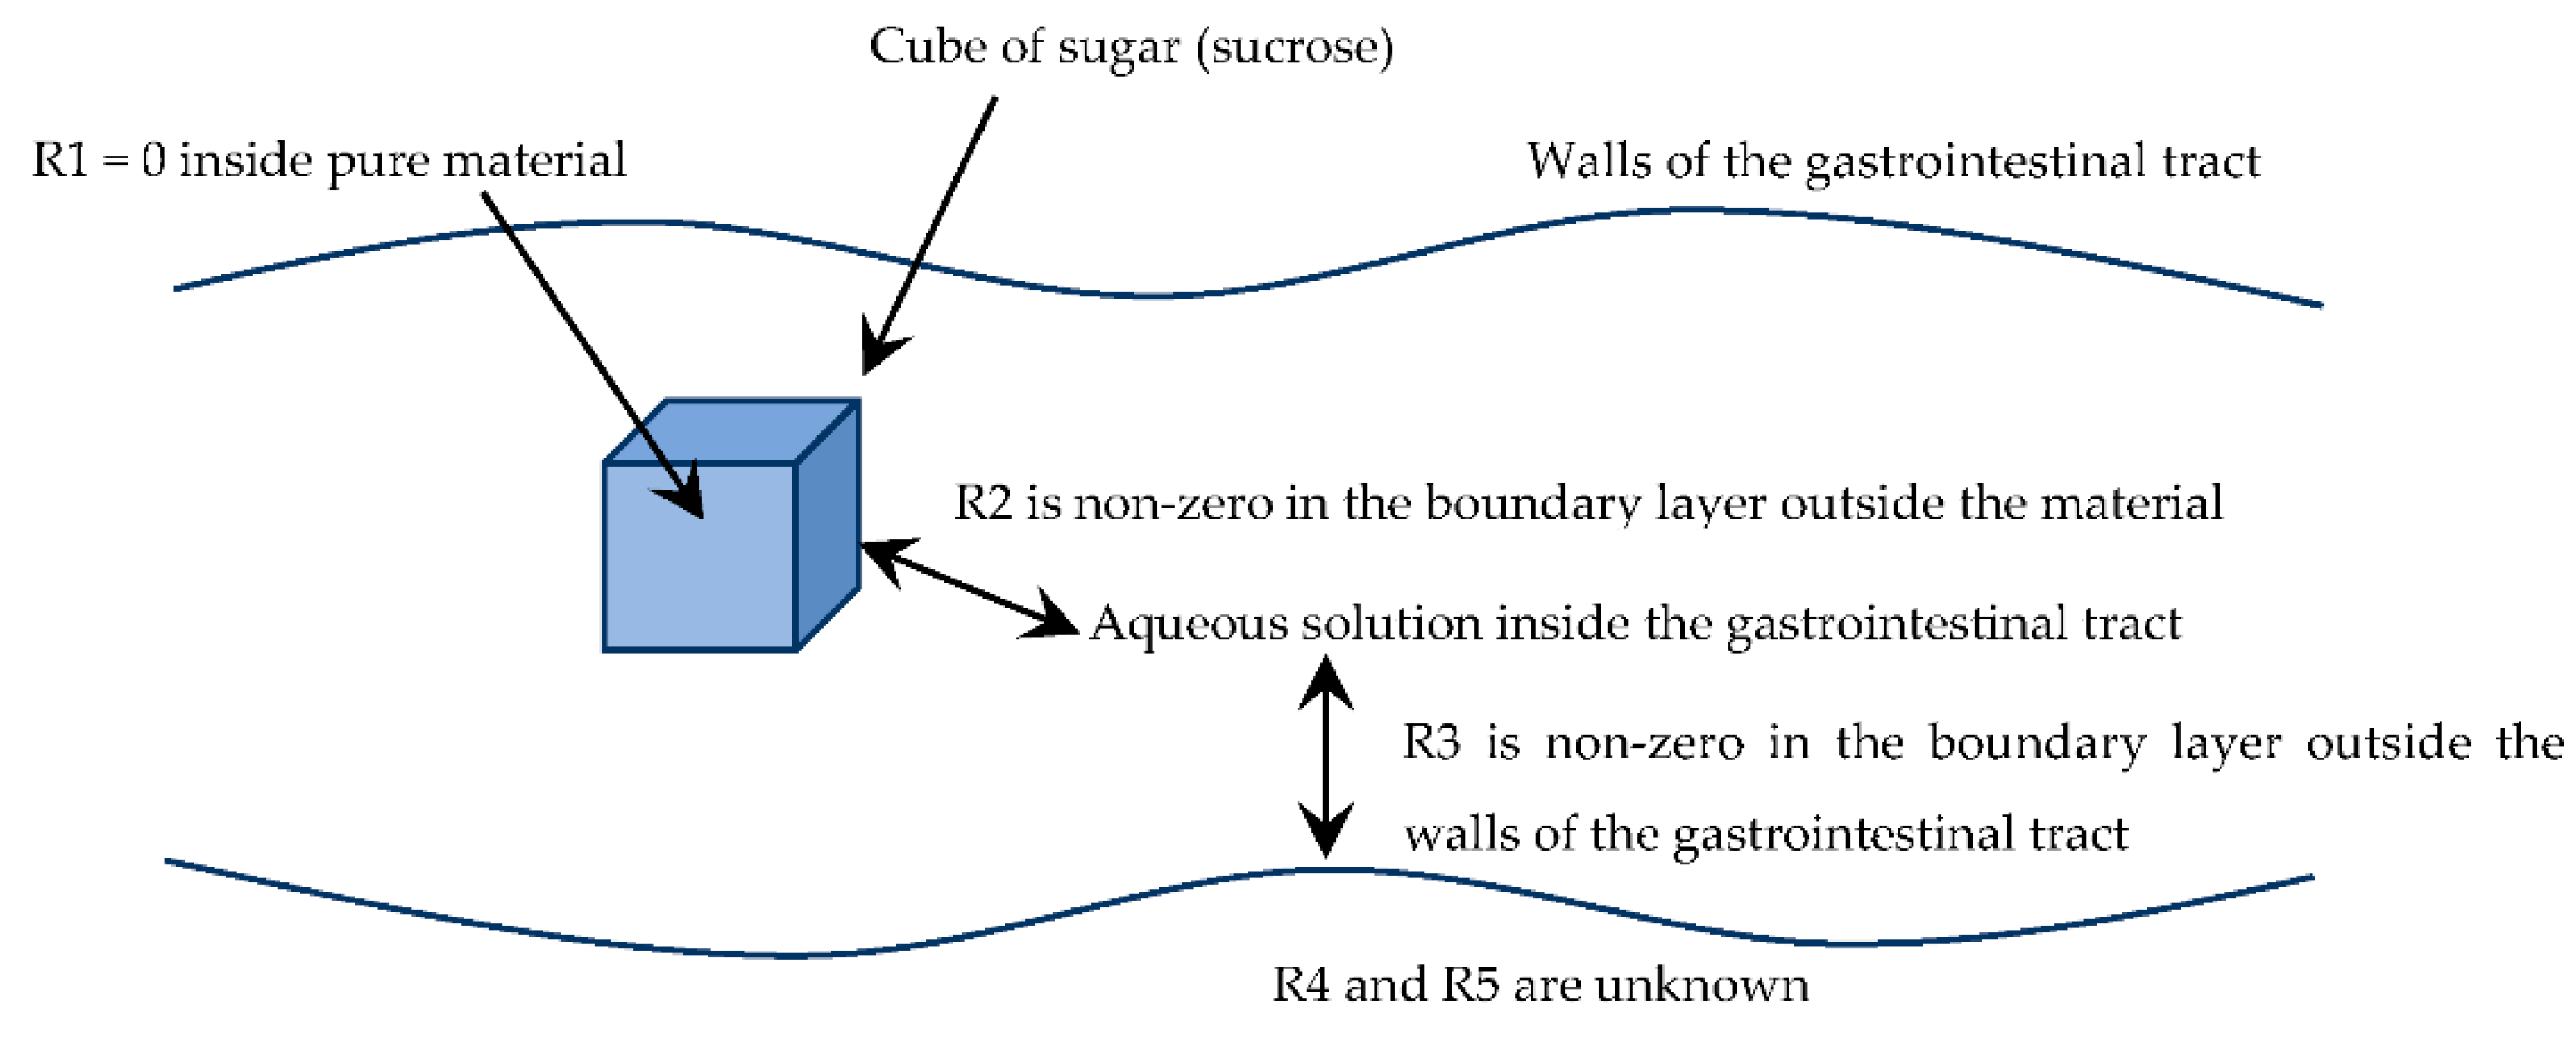
To give an example of how multifilm mass-transfer theory might be applied to the transfer of food nutrients, consider the dissolution of a 3 mm cube of sugar (sucrose), and its transfer into solution and then through the walls of the gastrointestinal tract, as shown in
Figure 3.
In the situation shown in
Figure 3, the mass-transfer resistance
R1 is zero, because a pure sugar cube is being considered. Mass-transfer resistance
R2 is certainly not zero, being governed by the external mass-transfer coefficient outside the sugar cube. The mass-transfer resistance R
3 is likewise non-zero, being governed by the external mass-transfer coefficient outside the walls of the gastrointestinal tract. The mass-transfer resistances
R4 and
R5 are unknown, being within the walls of the gastrointestinal tract. Even if these resistances are initially neglected, it is meaningful to compare resistances
R2 and
R3, as follows.
In this case, the focus is the external boundary layer outside the tablet, so the approach suggested in Langrish et al. [
16] is appropriate. With a flow velocity of 0.02 m·s
−1 [
3], it is necessary to estimate the effective or equivalent diameter of the sugar cube. For a cube, the equivalent diameter, based on the same surface-area-to-volume ratio as a sphere, is the side length of the cube, in this case 0.003 m. The surface area is then 6 × (0.003 m)
2 = 5.4 × 10
−5 m
2. Using the physical properties of water (density,
ρ, 1000 kg·m
−3; viscosity, μ, 0.001 kg·m
−1·s
−1) gives the Reynolds number, according to the equation
An appropriate correlation [
17] for flow along a tube, for mass transfer to the tube wall, is given by the Ranz–Marshall equation [
16], with the same diffusivity as before, 0.5228 × 10
−9 m
2·s
−1. The correlation gives:
where Sc is the Schmidt number, as defined in Equation (6). This information may be summarised as
k1 = 1.04 × 10
−5 m·s
−1 and
A1 = 5.4 × 10
−5 m
2.
This calculation follows from the worked example given above in the section on time constants and time scales, for a sample calculation of the mass-transfer coefficient for the duodenum, between the liquid inside the duodenum and the walls of the gastrointestinal tract, and the same film mass-transfer coefficient applies here (1.23 × 10
−6 m·s
−1). The absorption area is 0.09 m
2, from Ritschel [
20]. This information may be summarised as
k2 = 1.23 × 10
−6 m·s
−1 and
A2 = 0.09 m
2.
Rtotal: Then the two mass-transfer resistances are as follows:
Since the overall mass-transfer coefficient is the inverse of the overall mass-transfer resistance, and based on the surface area of the cube, the overall mass-transfer coefficient is then given by the equation
This value is less than 1% different to the individual external mass-transfer coefficient outside the cube, since the external resistance outside the sugar cube dominates the total mass-transfer resistance in this case, due to the small surface area of the cube. The resistance of the intestine wall is complicated by the presence of villi, which add to the interfacial surface area, and the movement of the villi and their pumping action reduces the mass-transfer resistance (R4) of the wall [
21,
22].
5. Applications to Guts-on-a-Chip
This engineering (mass transfer) perspective on digestion provides strong fundamental support for the development of gut-on-chip models (Fois et al. [
23,
24]) in a number of ways, both qualitatively and quantitatively. In the qualitative sense, the mass-transfer coefficient and mass-transfer behaviour do not require strict geometrical similarity with in vivo systems. From a mass-transfer perspective, this consideration means that if a gut-on-a-chip has a similar mass-transfer coefficient to an in vivo system, then the mass-transfer behaviour of the in vitro gut-on-a-chip system can readily be made very similar to an in vivo system by ensuring that the chemistry on the two systems is also very similar, and hence that the driving force,
C1–
C2, from Equation (1) is very similar. This situation then begs the question about the quantitative similarity between the mass-transfer coefficients for the in vitro gut-on-a-chip system of Fois et al. [
24] and the coefficients estimated in
Table 1 for the in vivo human digestive system. The following quantitative analysis uses the geometrical and operating parameters quoted in the paper of Fois et al. [
24], and this analysis provides some good news for such a comparison.
Quantitative Analysis of Mass and Momentum Transfer, comparing in vitro guts-on-a-chip with the in vivo human digestive system, Table 1.
From the viewpoint of transport phenomena, the most important single parameter in the work of Fois et al. [
24] is the wall shear stress, 0.002 N m
−2. This shear stress will now be translated, through an analogy between momentum and mass transfer, into a mass-transfer coefficient for this in vitro gut-on-a-chip system that will be compared with the mass-transfer coefficients estimated in
Table 1 for the in vivo human digestive system, particularly for the duodenum and the small intestine.
Considering now the analogy between momentum and mass transfer, the Chilton–Colburn analogy, given in Equation (8), is valid up to Schmidt numbers (
Sc) of about 160–200, while the simpler Reynolds analogy (
f/2 =
k/
u) is valid for
Sc about 1. For higher
Sc (less than 3000), the Friend–Metzger analogy [
25] should be used, and it is given by the following equation:
From the work of Fois et al. [
24], the shear stress (
𝜏) for which their apparatus was designed was 0.02 dyne cm
−2 (0.002 N·m
−2). They also used flow rates of 18 μL·h
−1 and 29 μL·h
−1 through a rectangular flow passage with cross-sectional dimensions of 1 mm × 0.15 mm (
A = 1.5 × 10
−7 m
2), giving average velocities (
u) of (3.33–5.37) × 10
−5 m·s
−1. These values of the shear stress and average velocities give values for the group (
f/2 =
𝜏/(
ρ·u2)) in the range from 693 to 1800 (dimensionless).
The Schmidt number (
Sc =
μ/(
ρ D)) depends on the diffusivity—and hence on the selection—of solute and solvent. Fois et al. [
24] used water as the solvent, so the density and viscosity were 1000 kg·m
−3 and 9.3 × 10
−4 kg·m
−1·s
−1, respectively. If the dilute sucrose-water system is selected as a representative one, as discussed previously, the diffusivity (sucrose through water) is 0.5228 × 10
−9 m
2·s
−1 [
4]. These parameters give a Schmidt number of (9.3 × 10
−4 kg·m
−1·s
−1/(1000 kg·m
−3 × 0.5228 × 10
−9 m
2·s
−1) = 1779).
Once these values for (
f/2) and
Sc are substituted into Equation (17), the resulting predictions for the values of
k, irrespective of the velocity
u in this range of flow rates, are around 8.2 × 10
−7 m·s
−1, which are very close to the predicted
k values for the duodenum and small intestine of 1.23 × 10
−6 m·s
−1 and 5.37 × 10
−7 m·s
−1 from
Table 1, respectively. This similarity should be rather reassuring for developers of in vitro guts-on-a-chip, such as Fois et al. [
24], in the following sense. Specifically, there is no reason, providing that the chemistry for the in vitro guts-on-a-chip is maintained similarly to that for in vitro human digestive systems (
Table 1), why the mass-transfer and transport behaviour for in vivo human digestive systems should not be well-mimicked by in vitro guts-on-a-chip. Similar mass-transfer behaviour should ensure similarity for the transport of nutrients to, and waste products away from, bowel cancer cells, as studied by Fois et al. (2021). It is noteworthy that no wider claim of reproducing the entire food-digestion process, from the food to the bloodstream, is made for such a gut-on-a chip model, which is reasonable given that pieces of food cannot physically fit inside a 1 mm × 0.15 mm flow passage. This analysis has suggested that such gut-on-a-chip (in vitro) models are likely to reproduce the in vivo process of mass transfer to and from the walls of the intestine (and any cells on these walls) very well.


