
Effects of Blood Flow Restricted Exercise on Electromechanical Delay and Time to Peak Force after Task Failure: A Randomized Crossover Trial

 ,
,  , and
, and
Abstract
:1. Introduction
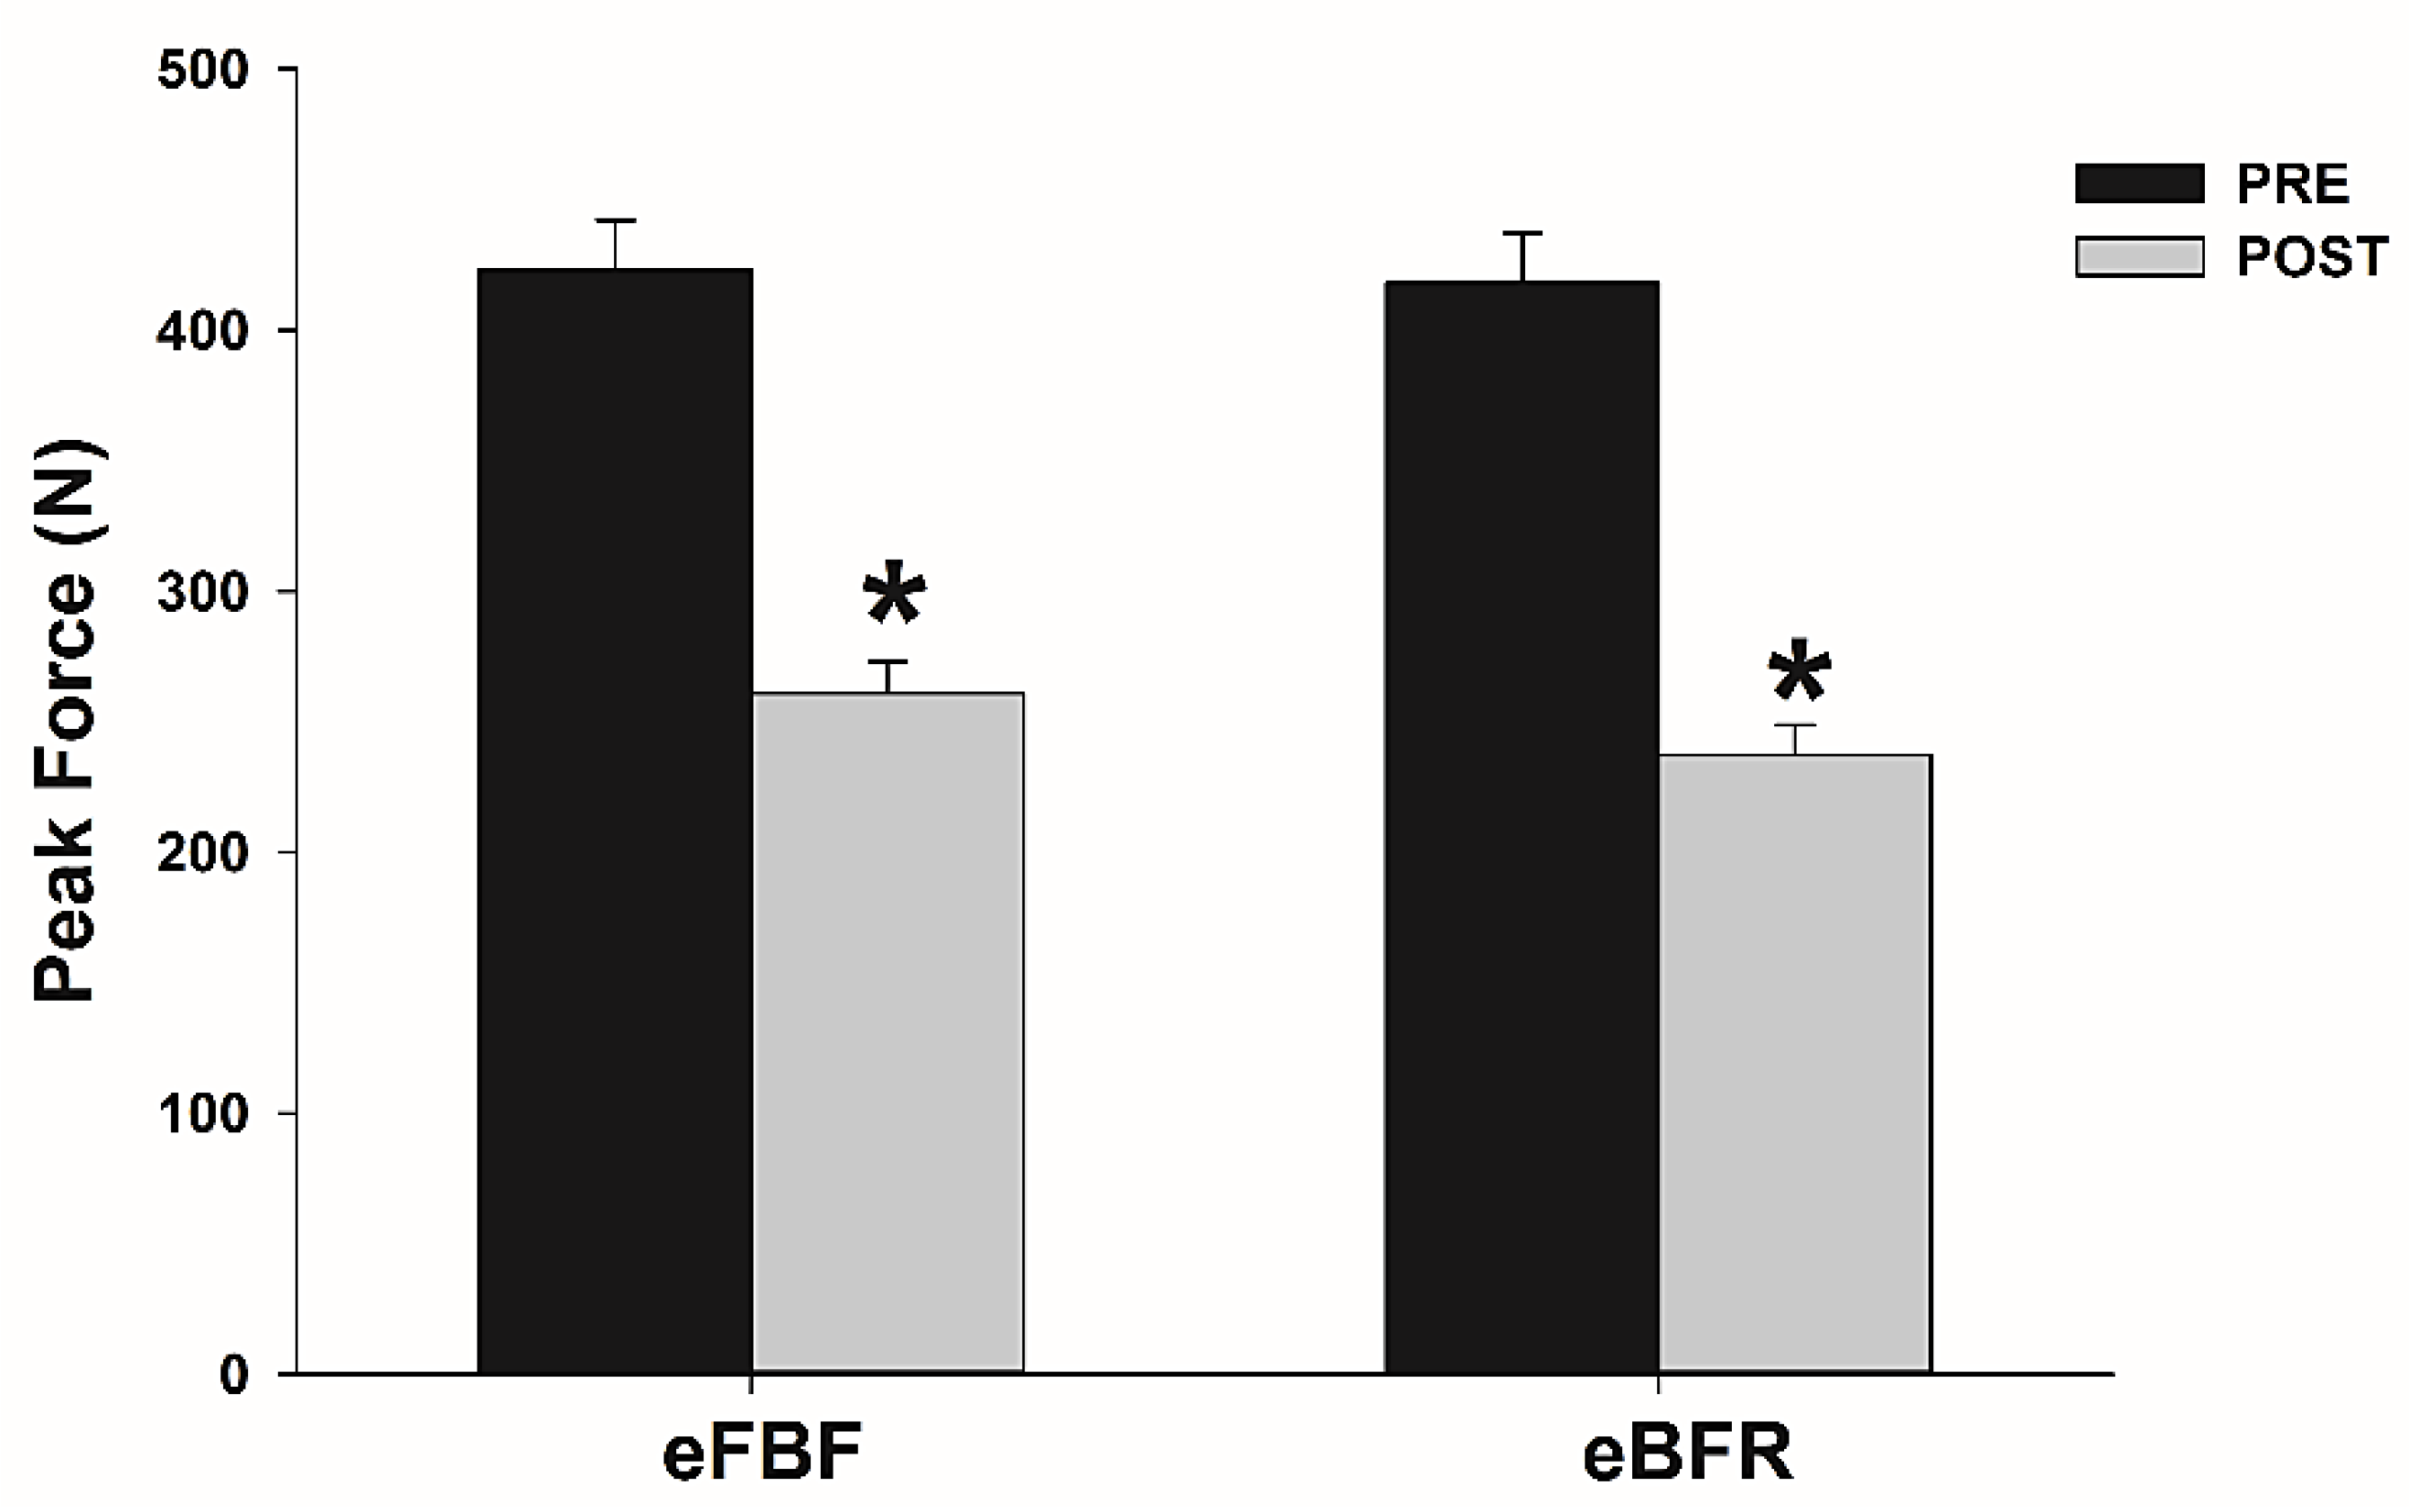
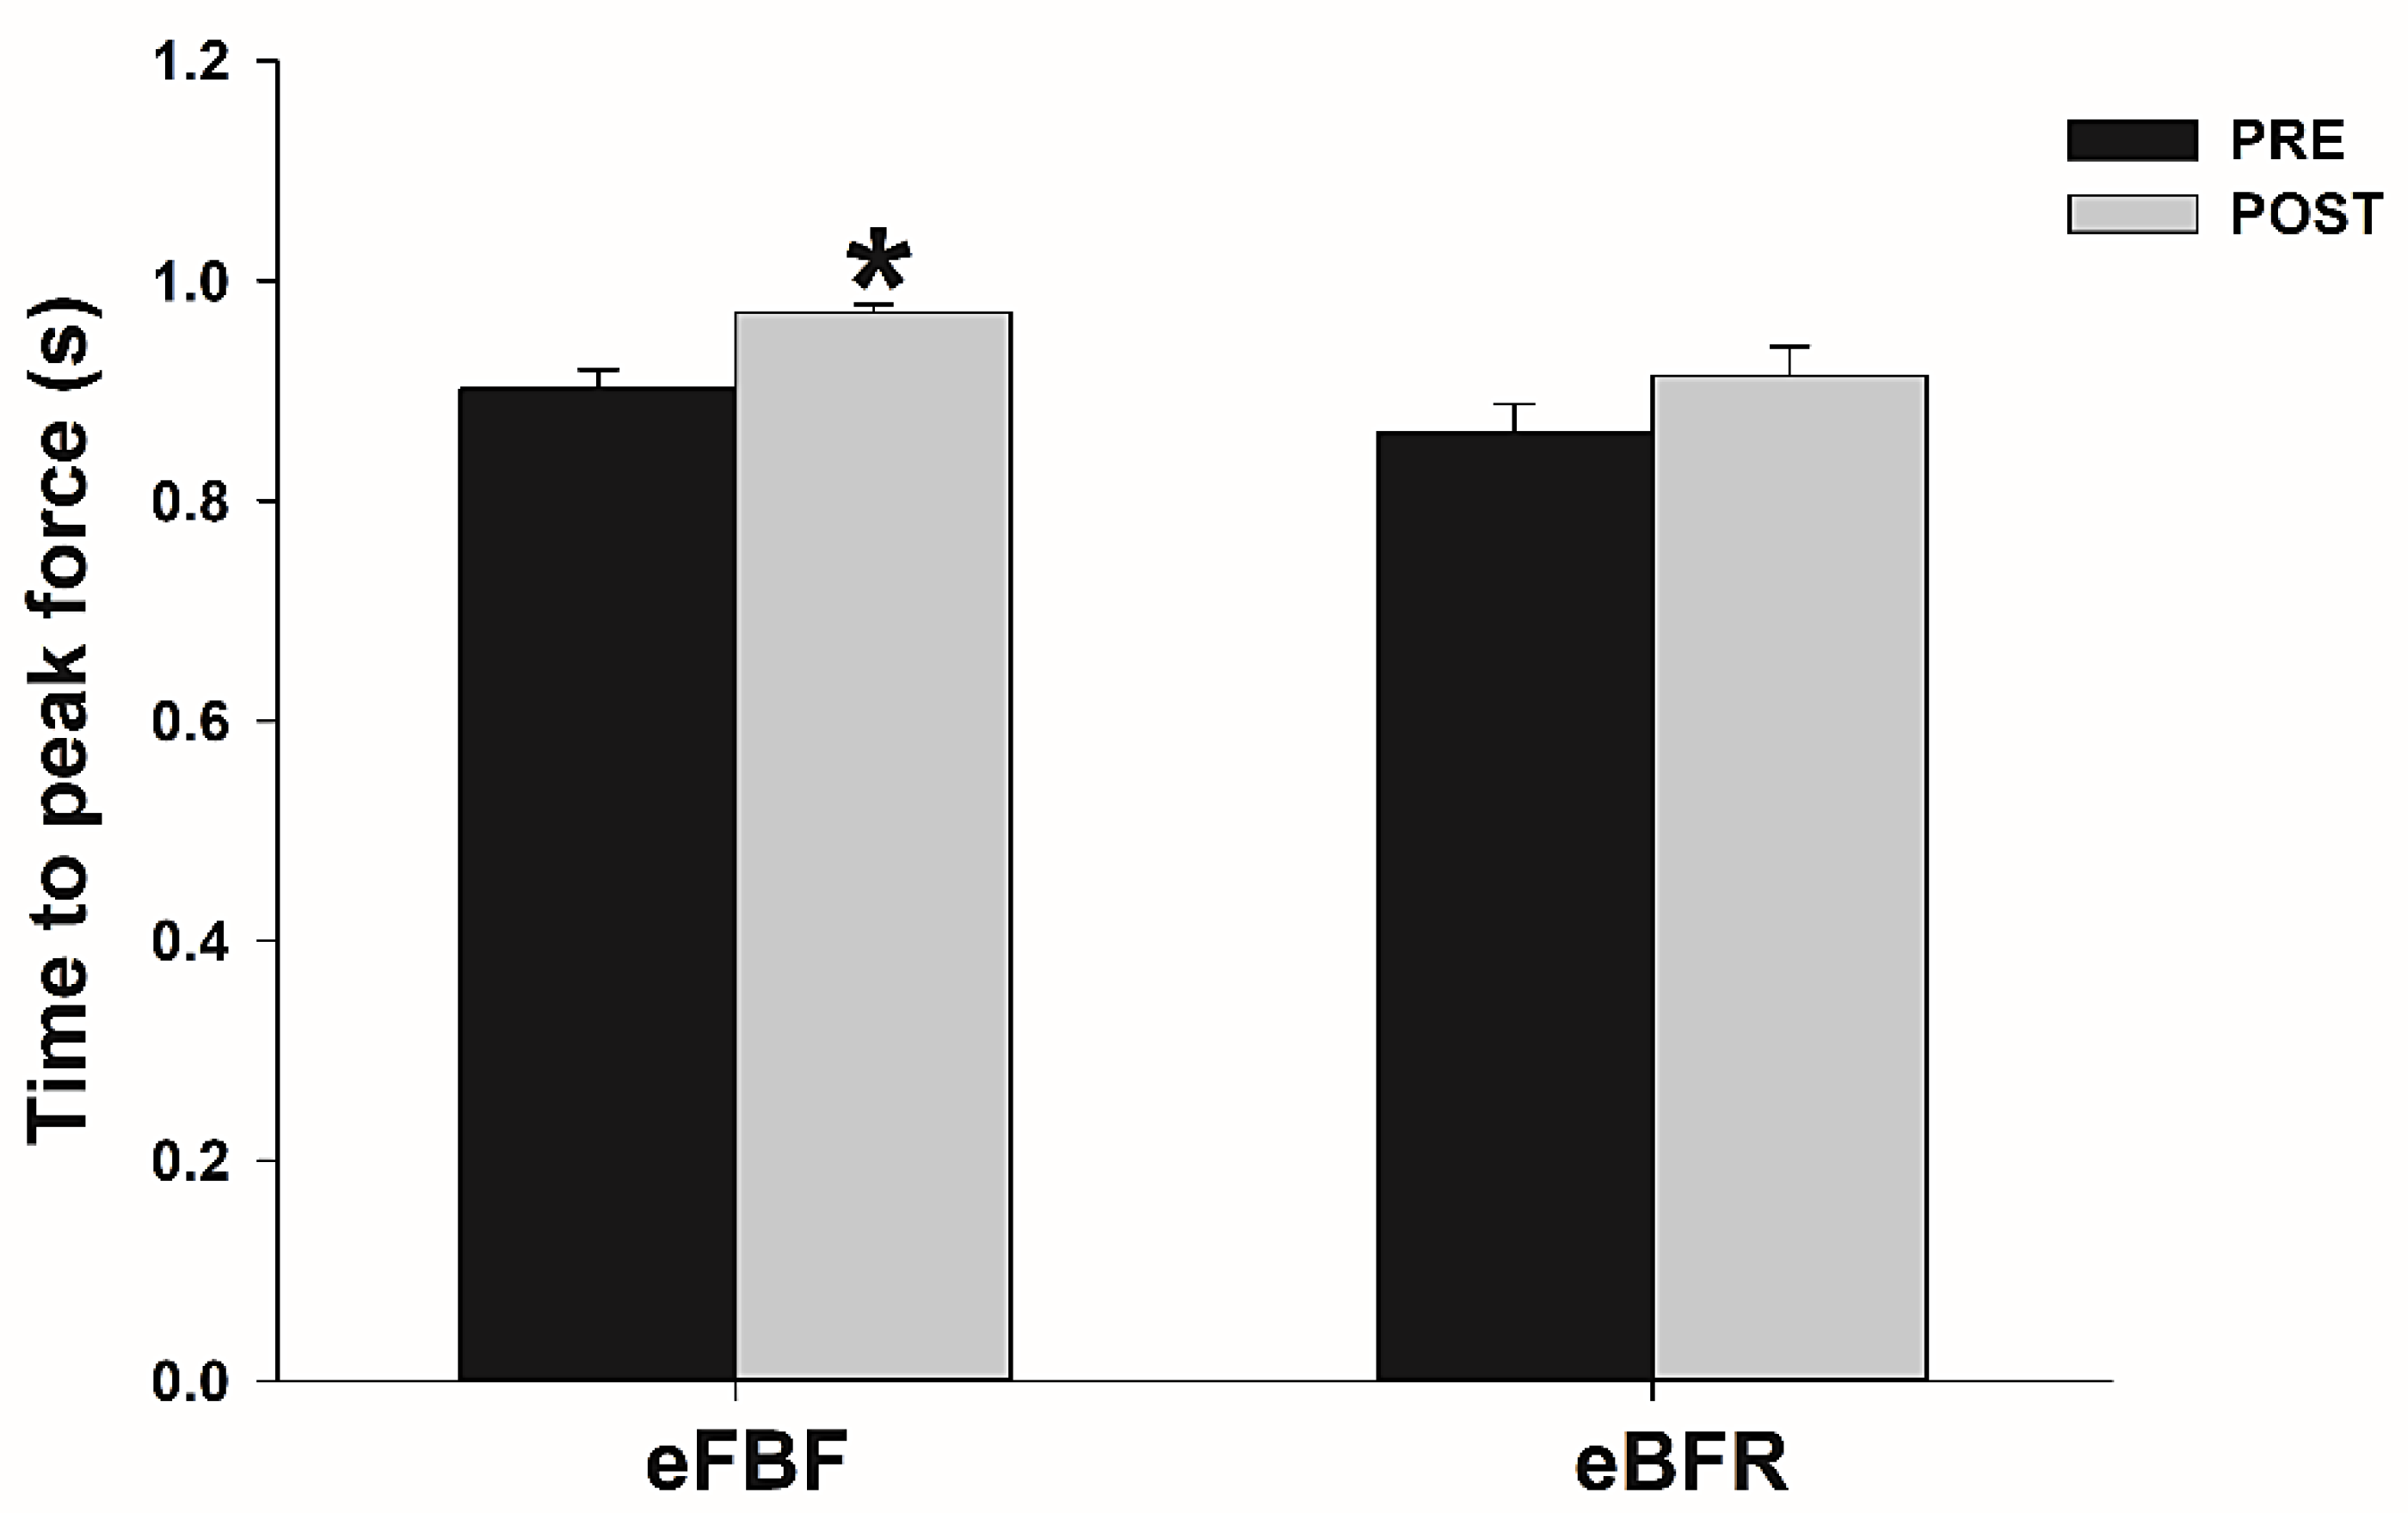
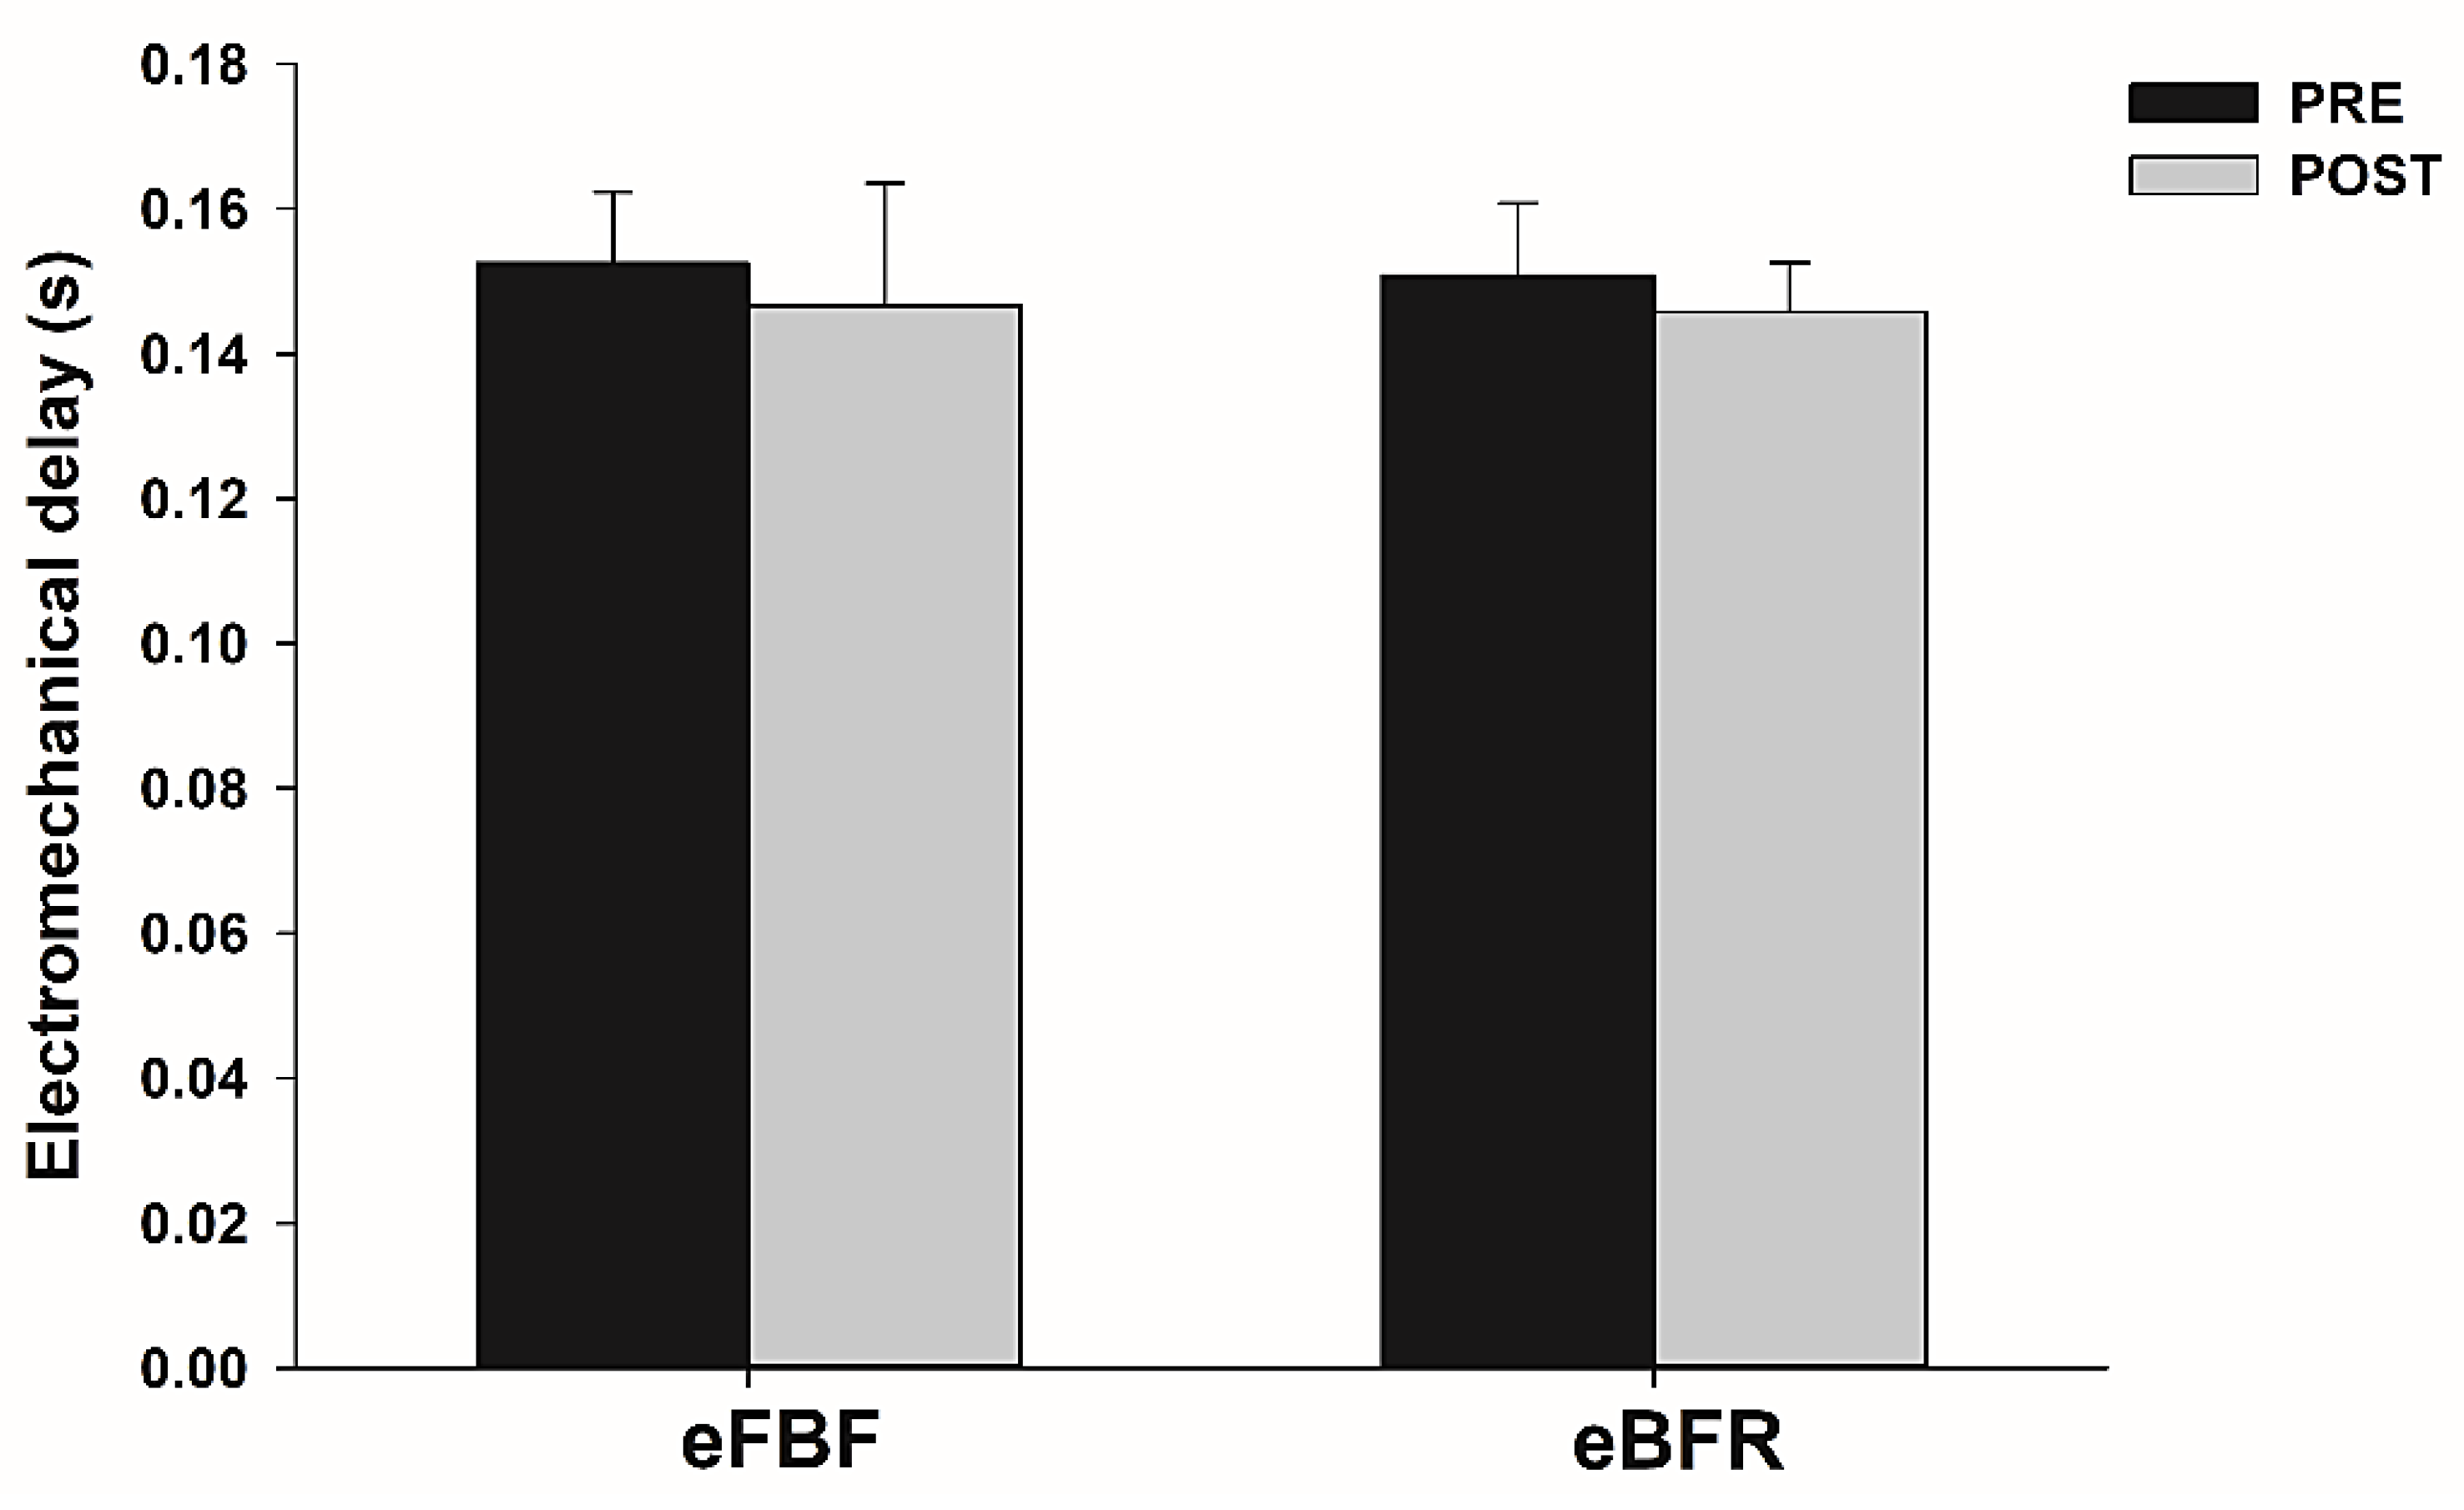
2. Results
3. Discussion
4. Materials and Methods
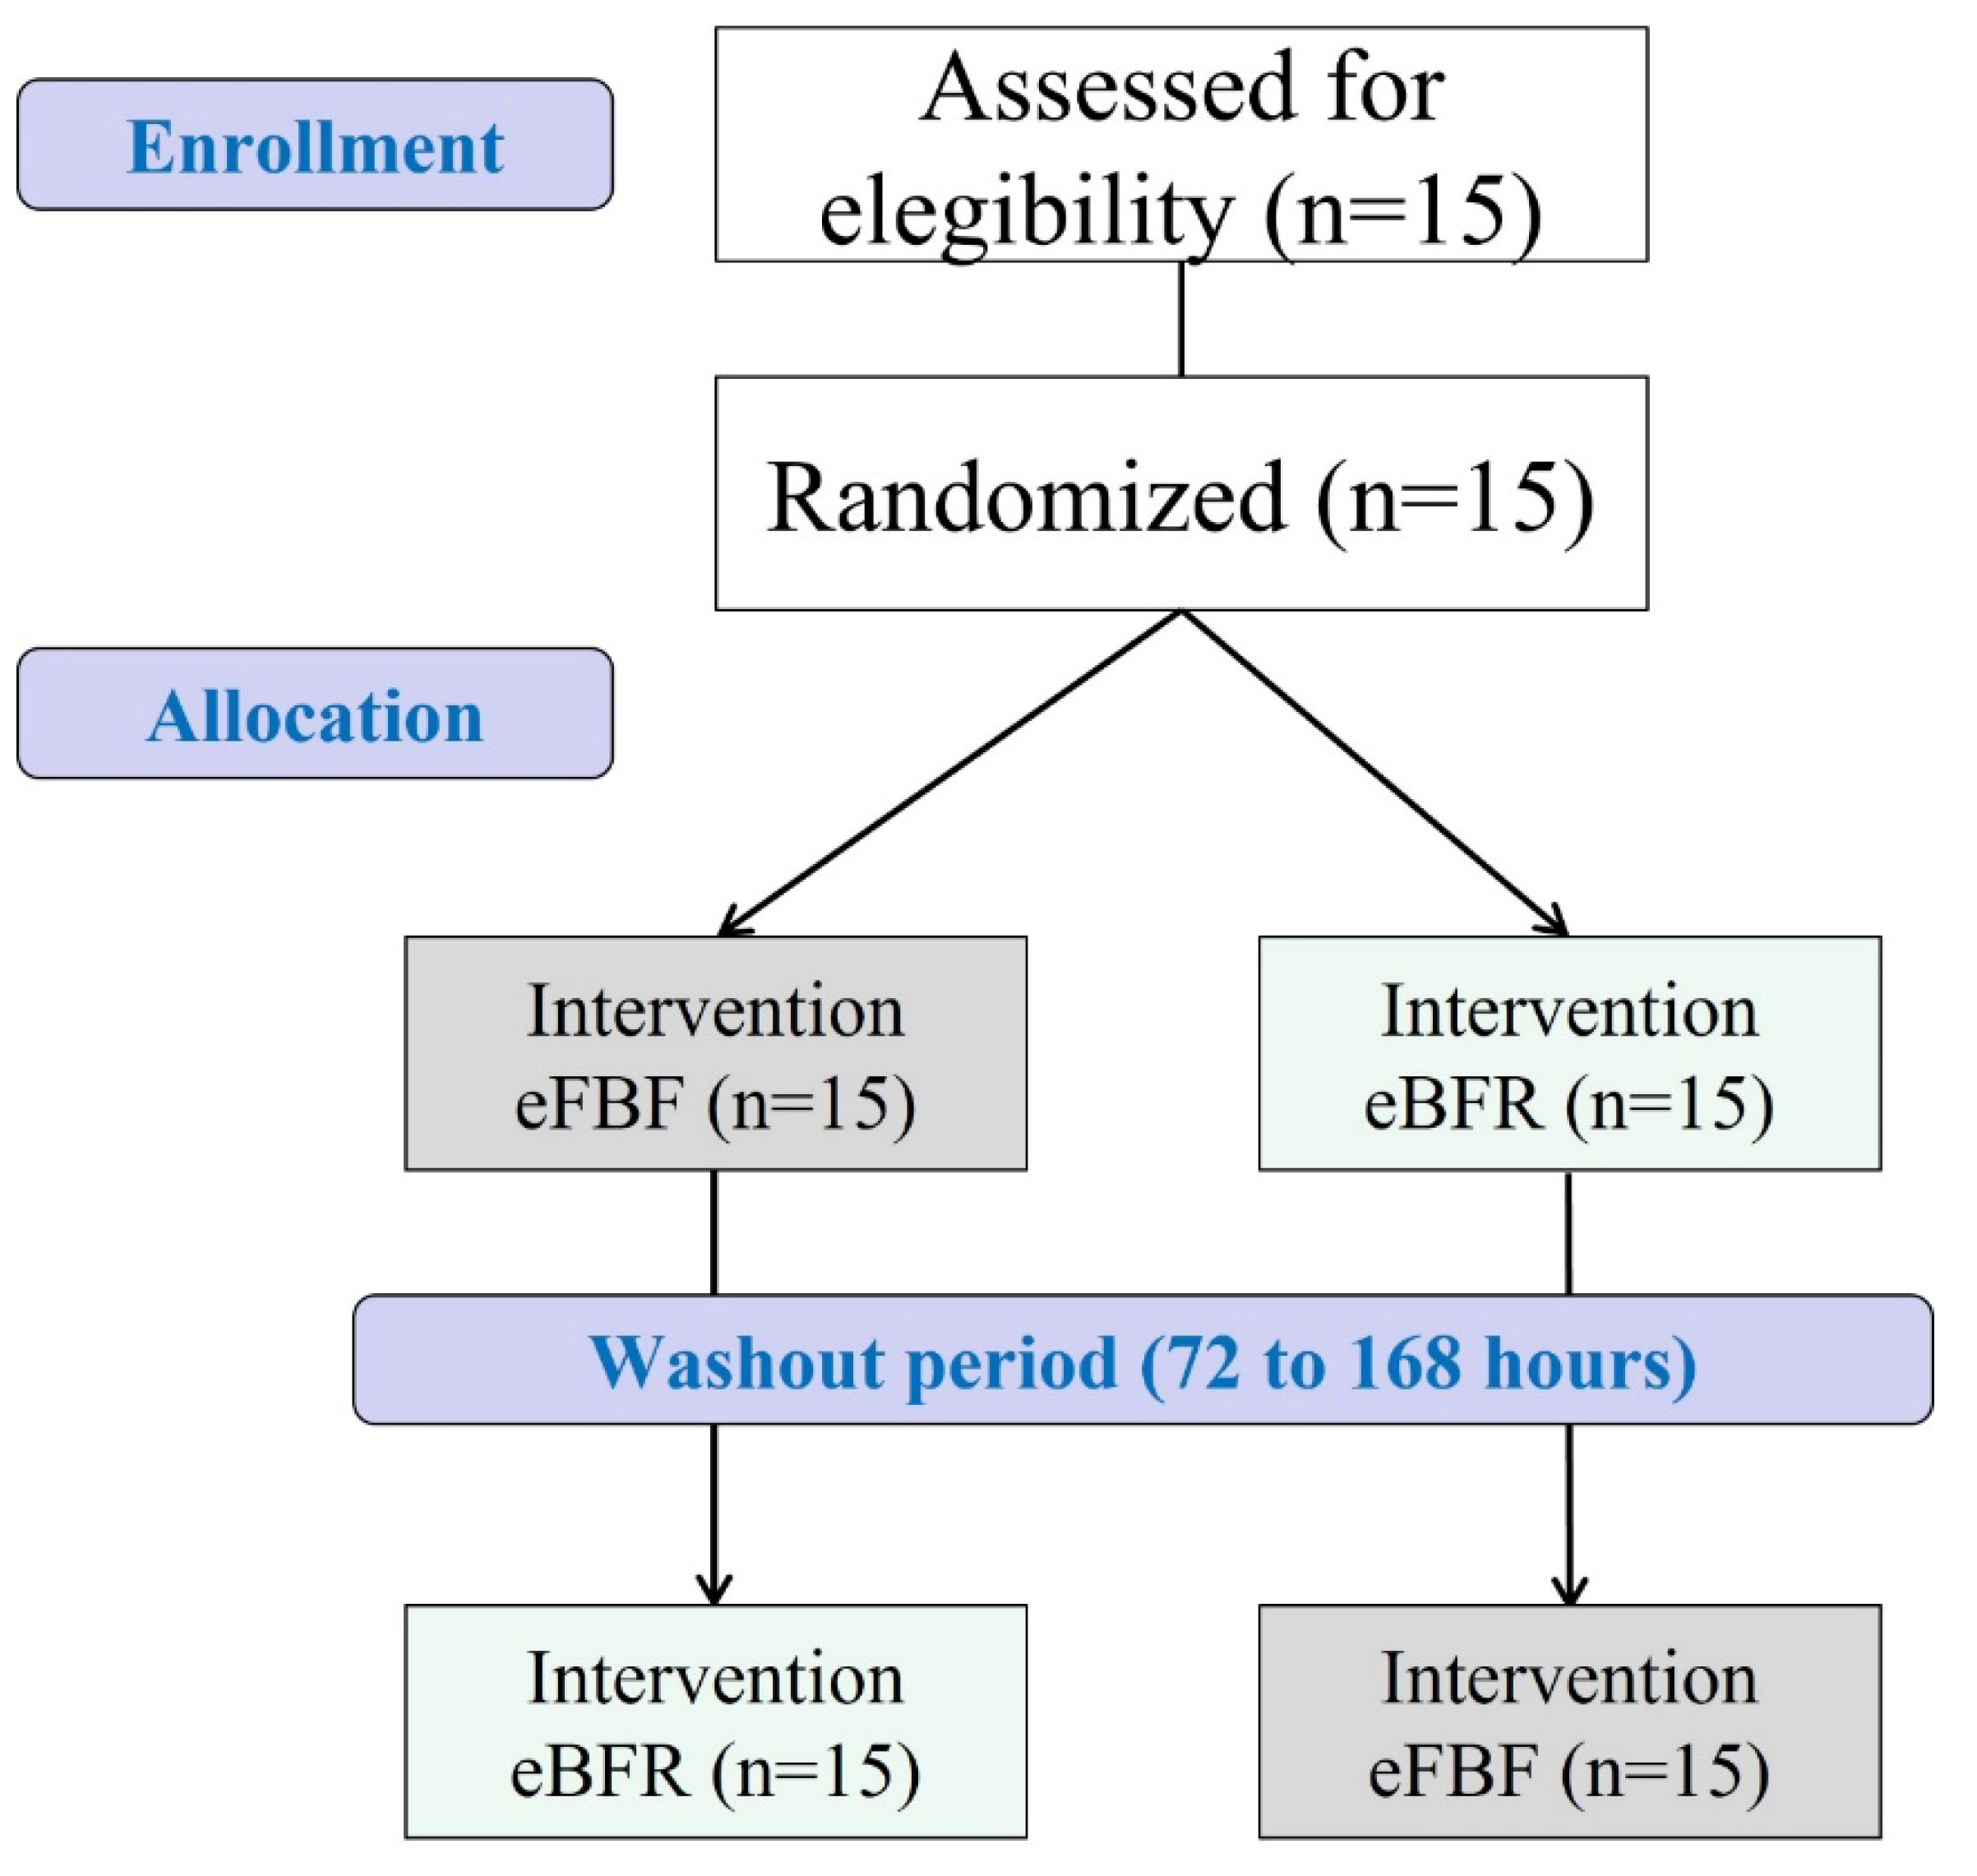
4.1. Study Design and Ethical Aspects
4.2. Participants
4.3. Randomization, Allocation, and Blinding
4.4. Experimental Procedures
4.4.1. Total Restriction Pressure Evaluation
4.4.2. Maximum Voluntary Isometric Force (MVIF) and Surface Electromyography (sEMG)
4.4.3. Intermittent Isometric Handgrip Exercise (IIHE)
4.5. Data Analysis (Time to Peak Force, Rate of Force Development, and Electromechanical Delay)
4.6. Statistical Analysis
5. Limitations
6. Conclusions
Author Contributions
Funding
Institutional Review Board Statement
Informed Consent Statement
Data Availability Statement
Acknowledgments
Conflicts of Interest
References
- Takano, H.; Morita, T.; Iida, H.; Asada, K.; Kato, M.; Uno, K.; Hirose, K.; Matsumoto, A.; Takenaka, K.; Hirata, Y.; et al. Hemodynamic and hormonal responses to a short-term low-intensity resistance exercise with the reduction of muscle blood flow. Eur. J. Appl. Physiol. 2005, 95, 65–73. [Google Scholar] [CrossRef] [PubMed]
- Loenneke, J.P.; Kearney, M.L.; Thrower, A.D.; Collins, S.; Pujol, T.J. The acute response of practical occlusion in the knee extensors. J. Strength Cond. Res. 2010, 24, 2831–2834. [Google Scholar] [CrossRef] [PubMed]
- Shinohara, M.; Kouzaki, M.; Yoshihisa, T.; Fukunaga, T. Efficacy of tourniquet ischemia for strength training with low resistance. Eur. J. Appl. Physiol. Occup. Physiol. 1997, 77, 189–191. [Google Scholar] [CrossRef] [PubMed]
- Kaijser, L.; Sundberg, C.J.; Eiken, O.; Nygren, A.; Esbjornsson, M.; Sylven, C.; Jansson, E. Muscle oxidative capacity and work performance after training under local leg ischemia. J. Appl. Physiol. 1990, 69, 785–787. [Google Scholar] [CrossRef] [PubMed]
- Takada, S.; Okita, K.; Suga, T.; Omokawa, M.; Kadoguchi, T.; Sato, T.; Takahashi, M.; Yokota, T.; Hirabayashi, K.; Morita, N.; et al. Low-intensity exercise can increase muscle mass and strength proportionally to enhanced metabolic stress under ischemic conditions. J. Appl. Physiol. 2012, 113, 199–205. [Google Scholar] [CrossRef] [Green Version]
- Pearson, S.J.; Hussain, S.R. A Review on the Mechanisms of Blood-Flow Restriction Resistance Training-Induced Muscle Hypertrophy. Sport. Med. 2015, 45, 187–200. [Google Scholar] [CrossRef]
- Husmann, F.; Mittlmeier, T.; Bruhn, S.; Zschorlich, V.; Behrens, M. Impact of Blood Flow Restriction Exercise on Muscle Fatigue Development and Recovery. Med. Sci. Sport. Exerc. 2018, 50, 436–446. [Google Scholar] [CrossRef]
- Kent-Braun, J.A.; Fitts, R.H.; Christie, A. Skeletal muscle fatigue. Compr. Physiol. 2012, 2, 997–1044. [Google Scholar] [CrossRef]
- Goodall, S.; Ross, E.Z.; Romer, L.M. Effect of graded hypoxia on supraspinal contributions to fatigue with unilateral knee-extensor contractions. J. Appl. Physiol. 2010, 109, 1842–1851. [Google Scholar] [CrossRef] [Green Version]
- Millet, G.Y.; Aubert, D.; Favier, F.B.; Busso, T.; Benoît, H. Effect of acute hypoxia on central fatigue during repeated isometric leg contractions. Scand. J. Med. Sci. Sport. 2009, 19, 695–702. [Google Scholar] [CrossRef]
- Cook, S.B.; Clark, B.C.; Ploutz-Snyder, L.L. Effects of exercise load and blood-flow restriction on skeletal muscle function. Med. Sci. Sport. Exerc. 2007, 39, 1708–1713. [Google Scholar] [CrossRef]
- Cerqueira, M.S.; Pereira, R.; Rocha, T.; Mesquita, G.; Oliveira de Paiva Lima, C.R.; Cristina Falcão Raposo, M.; Galvão De Moura Filho, A. Time to failure and neuromuscular response to intermittent isometric exercise at different levels of vascular occlusion: A randomized crossover study. Int. J. Appl. Exerc. Physiol. 2017, 6, 55–70. [Google Scholar] [CrossRef] [Green Version]
- Merletti, R.; Roy, S. Myoelectric and mechanical manifestations of muscle fatigue in voluntary contractions. J. Orthop. Sport. Phys. Ther. 1996, 24, 342–353. [Google Scholar] [CrossRef] [Green Version]
- Falla, D.; Rainoldi, A.; Merletti, R.; Jull, G. Myoelectric manifestations of sternocleidomastoid and anterior scalene muscle fatigue in chronic neck pain patients. Clin. Neurophysiol. 2003, 114, 488–495. [Google Scholar] [CrossRef]
- Merletti, R.; Knaflitz, M.; De Luca, C.J. Myoelectric manifestations of fatigue in voluntary and electrically elicited contractions. J. Appl. Physiol. 1990, 69, 1810–1820. [Google Scholar] [CrossRef] [Green Version]
- Moritani, T.; Nagata, A.; Muro, M. Electromyographic manifestations of muscular fatigue. Med. Sci. Sport. Exerc. 1982, 14, 198–202. [Google Scholar] [CrossRef]
- Bigland-Ritchie, B. Factors contributing to quantitative surface electromyographic recording and how they are affected by fatigue. Am. Rev. Respir. Dis. 1979, 119, 95–97. [Google Scholar] [CrossRef]
- Cè, E.; Rampichini, S.; Limonta, E.; Esposito, F. Fatigue effects on the electromechanical delay components during the relaxation phase after isometric contraction. Acta Physiol. 2014, 211, 82–96. [Google Scholar] [CrossRef]
- Smith, C.M.; Housh, T.J.; Hill, E.C.; Keller, J.L.; Johnson, G.O.; Schmidt, R.J. Effects of fatigue and recovery on electromechanical delay during isokinetic muscle actions. Physiol. Meas. 2017, 38, 1837–1847. [Google Scholar] [CrossRef]
- Cavanagh, P.R.; Komi, P.V. Electromechanical delay in human skeletal muscle under concentric and eccentric contractions. Eur. J. Appl. Physiol. Occup. Physiol. 1979, 42, 159–163. [Google Scholar] [CrossRef]
- Johns, G.; Morin, E.; Hashtrudi-Zaad, K. The role of electromechanical delay in modelling the EMG-force relationship during quasi-dynamic contractions of the upper-limb. In Proceedings of the Annual International Conference of the IEEE Engineering in Medicine and Biology Society, EMBS, Orlando, FL, USA, 16–20 August 2016; Volume 2016, pp. 3634–3637. [Google Scholar]
- Cè, E.; Rampichini, S.; Monti, E.; Venturelli, M.; Limonta, E.; Esposito, F. Changes in the electromechanical delay components during a fatiguing stimulation in human skeletal muscle: An EMG, MMG and force combined approach. Eur. J. Appl. Physiol. 2017, 117, 95–107. [Google Scholar] [CrossRef] [PubMed]
- Cè, E.; Rampichini, S.; Agnello, L.; Limonta, E.; Veicsteinas, A.; Esposito, F. Effects of temperature and fatigue on the electromechanical delay components. Muscle Nerve 2013, 47, 566–576. [Google Scholar] [CrossRef] [PubMed]
- Bračič, M.; Hadžič, V.; Čoh, M.; Derviševič, E. Relationship between time to peak torque of hamstrings and sprint running performance. Isokinet. Exerc. Sci. 2011, 19, 281–286. [Google Scholar] [CrossRef]
- Descarreaux, M.; Mayrand, N.; Raymond, J. Neuromuscular control of the head in an isometric force reproduction task: Comparison of whiplash subjects and healthy controls. Spine J. 2007, 7, 647–653. [Google Scholar] [CrossRef] [PubMed]
- Descarreaux, M.; Lalonde, C.; Normand, M.C. Isometric force parameters and trunk muscle recruitment strategies in a population with low back pain. J. Manip. Physiol. Ther. 2007, 30, 91–97. [Google Scholar] [CrossRef] [PubMed]
- Cerqueira, M.S.; Pereira, R.; de Mesquita, G.N.; Rocha, T.; de Moura Filho, A.G. Rate of force development to evaluate the neuromuscular fatigue and recovery after an intermittent isometric handgrip task with different blood flow restriction conditions. Motriz. Rev. Educ. Fis. 2019, 25, 1–6. [Google Scholar] [CrossRef] [Green Version]
- Taylor, J.L.; Amann, M.; Duchateau, J.; Meeusen, R.; Rice, C.L. Neural Contributions to Muscle Fatigue: From the Brain to the Muscle and Back Again. Med. Sci. Sport. Exerc. 2016, 48, 2294–2306. [Google Scholar] [CrossRef] [Green Version]
- Karabulut, M.; Cramer, J.T.; Abe, T.; Sato, Y.; Bemben, M.G. Neuromuscular fatigue following low-intensity dynamic exercise with externally applied vascular restriction. J. Electromyogr. Kinesiol. 2010, 20, 440–447. [Google Scholar] [CrossRef]
- Zhang, L.Q.; Zev Rymer, W. Reflex and intrinsic changes induced by fatigue of human elbow extensor muscles. J. Neurophysiol. 2001, 86, 1086–1094. [Google Scholar] [CrossRef]
- Cerqueira, M.S.; Pereira, R.; de Mesquita, G.N.; Rocha, T.; de Moura Filho, A.G. Influence of blood flow restriction level on muscle fatigue during an intermittent isometric exercise taken to failure. Muscle Ligaments Tendons J. 2020, 10, 408–415. [Google Scholar] [CrossRef]
- Jacunski, M.; Rafferty, G.F. The effects of hypoxia and fatigue on skeletal muscle electromechanical delay. Exp. Physiol. 2020, 105, 842–851. [Google Scholar] [CrossRef]
- Lutjemeier, B.; Miura, A.; Scheuermann, B.; Koga, S.; Townsend, D.; Barstow, T. Muscle contraction-blood flow interactions during upright knee extension exercise in humans. J. Appl. Physiol. 2005, 98, 1575–1583. [Google Scholar] [CrossRef]
- Belfry, G.R.; Paterson, D.H.; Murias, J.M.; Thomas, S.G. The effects of short recovery duration on VO2 and muscle deoxygenation during intermittent exercise. Eur. J. Appl. Physiol. 2012, 112, 1907–1915. [Google Scholar] [CrossRef]
- Sjogaard, G.; Savard, G.; Juel, C. Muscle blood flow during isometric activity and its relation to muscle fatigue. Eur. J. Appl. Physiol. Occup. Physiol. 1988, 57, 327–335. [Google Scholar] [CrossRef]
- Cerqueira, M.S.; Lira, M.; Mendonça Barboza, J.A.; Burr, J.F.; Wanderley, E.; Lima, T.B.; Maciel, D.G.; De Brito Vieira, W.H. Repetition Failure Occurs Earlier During Low-Load Resistance Exercise with High But Not Low Blood Flow Restriction Pressures: A Systematic Review and Meta-analysis. J. Strength Cond. Res. 2021. [Google Scholar] [CrossRef]
- Bigland-Ritchie, B.; Thomas, C.K.; Rice, C.L.; Howarth, J.V.; Woods, J.J. Muscle temperature, contractile speed, and motoneuron firing rates during human voluntary contractions. J. Appl. Physiol. 1992, 73, 2457–2461. [Google Scholar] [CrossRef]
- Oishi, K.; Nigorikawa, T. Time to peak force and force developing speed during fast maximal and submaximal isometric voluntary contractions. Ann. Physiol. Anthropol. 1988, 7, 5–13. [Google Scholar] [CrossRef] [Green Version]
- Matsudo, S.; Araújo, T.; Matsudo, V.; Andrade, D.; Andrade, E.; Oliveira, C.; Braggion, G. Questionário Internacional de Atividade Física (IPAQ): Estudo de validade e reprodutibilidade no Brasil. Rev. Bras. Ativ. Física Saúde 2001, 6, 5–12. [Google Scholar]
- Oldfield, R.C. The assessment and analysis of handedness: The Edinburgh inventory. Neuropsychologia 1971, 9, 97–113. [Google Scholar] [CrossRef]
- Bezerra de Morais, A.T.; Cerqueira, M.S.; Moreira Sales, R.; Rocha, T.; Galvão de Moura Filho, A. Upper limbs total occlusion pressure assessment: Doppler ultrasound reproducibility and determination of predictive variables. Clin. Physiol. Funct. Imaging 2017, 37, 437–441. [Google Scholar] [CrossRef] [PubMed]
- Hermens, H.J.; Freriks, B.; Disselhorst-Klug, C.; Rau, G. Development of recommendations for SEMG sensors and sensor placement procedures. J. Electromyogr. Kinesiol. 2000, 10, 361–374. [Google Scholar] [CrossRef]
- Aagaard, P.; Simonsen, E.B.; Andersen, J.L.; Magnusson, P.; Dyhre-Poulsen, P. Increased rate of force development and neural drive of human skeletal muscle following resistance training. J. Appl. Physiol. 2002, 93, 1318–1326. [Google Scholar] [CrossRef] [PubMed]
- Schettino, L.; Luz, C.P.N.; De Oliveira, L.E.G.; De Assun????o, P.L.; Da Silva Coqueiro, R.; Fernandes, M.H.; Brown, L.E.; Machado, M.; Pereira, R. Comparison of explosive force between young and elderly women: Evidence of an earlier decline from explosive force. Age 2014, 36, 893–898. [Google Scholar] [CrossRef] [Green Version]
- Barnett, B.E.; Dankel, S.J.; Counts, B.R.; Nooe, A.L.; Abe, T.; Loenneke, J.P. Blood flow occlusion pressure at rest and immediately after a bout of low load exercise. Clin. Physiol. Funct. Imaging 2016, 36, 436–440. [Google Scholar] [CrossRef]


| Variable | Mean ± SD |
|---|---|
| Age (Years old) | 21.87 ± 2.13 |
| Height (m) | 1.76 ± 0.06 |
| Body weight (kg) | 77.07 ± 9.91 |
| BMI (kg/cm2) | 24.67 ± 2.13 |
| SBP (mmHg) | 120.45 ± 11.27 |
| DBP (mmHg) | 76.13 ± 6.43 |
| TOP (mmHg) | 125.67 ± 10.33 |
| POP (mmHg) | 62.83 ± 5.16 |
Publisher’s Note: MDPI stays neutral with regard to jurisdictional claims in published maps and institutional affiliations. |
© 2022 by the authors. Licensee MDPI, Basel, Switzerland. This article is an open access article distributed under the terms and conditions of the Creative Commons Attribution (CC BY) license (https://creativecommons.org/licenses/by/4.0/).
Share and Cite
Cerqueira, M.S.; Lira, M.; da Silva, R.S.; Machado, M.; Pereira, R. Effects of Blood Flow Restricted Exercise on Electromechanical Delay and Time to Peak Force after Task Failure: A Randomized Crossover Trial. Muscles 2022, 1, 133-142. https://doi.org/10.3390/muscles1030014
Cerqueira MS, Lira M, da Silva RS, Machado M, Pereira R. Effects of Blood Flow Restricted Exercise on Electromechanical Delay and Time to Peak Force after Task Failure: A Randomized Crossover Trial. Muscles. 2022; 1(3):133-142. https://doi.org/10.3390/muscles1030014
Chicago/Turabian StyleCerqueira, Mikhail Santos, Maria Lira, Raiff Simplicio da Silva, Marco Machado, and Rafael Pereira. 2022. "Effects of Blood Flow Restricted Exercise on Electromechanical Delay and Time to Peak Force after Task Failure: A Randomized Crossover Trial" Muscles 1, no. 3: 133-142. https://doi.org/10.3390/muscles1030014