Article

Rosaceae Nut-Shells as Sustainable Aggregate for Potential Use in Non-Structural Lightweight Concrete

by
Veronica D’Eusanio
1,*,
Lucia Bertacchini
2,
Andrea Marchetti
1,3,4,
Mattia Mariani
1,
Stefano Pastorelli
2,
Michele Silvestri
2 and
Lorenzo Tassi
1,3,4
1
Department of Chemical and Geological Sciences, University of Modena and Reggio Emilia, 41125 Modena, Italy
2
Litokol S.p.A., 42048 Rubiera, Italy
3
Consorzio Interuniversitario Nazionale per la Scienza e Tecnologia dei Materiali (INSTM), 50121 Firenze, Italy
4
Interdepartmental Research Center BIOGEST-SITEIA, University of Modena and Reggio Emilia, 42124 Reggio Emilia, Italy
*
Author to whom correspondence should be addressed.
Waste 2023, 1(2), 549-568; https://doi.org/10.3390/waste1020033
Submission received: 16 March 2023 / Revised: 23 April 2023 / Accepted: 25 May 2023 / Published: 6 June 2023
(This article belongs to the Special Issue Agri-Food Wastes and Biomass Valorization)

Abstract

:
Apricot (AS), peach (PS), and plum shells (PlS) were examined as sustainable aggregates for non-structural lightweight concrete. The extraction of natural resources has a significant environmental impact and is not in line with the Sustainable Development Goals (SDGs) of Agenda 2030. Recycling agri-food waste, such as fruit shells, fully respects circular economy principles and SDGs. The chemical and physical properties of the shells were investigated using scanning electron microscopy (SEM) for microstructure analysis and TG-MS-EGA for thermal stress behavior. Two binding mixtures were used to prepare the concrete samples, one containing lime only (mixture “a”) and one containing both lime and cement (mixture “b”). Lime is a more sustainable building material but it compromises mechanical strength and durability. The performance of lightweight concrete was determined based on the type of aggregate used. PS had a high-water absorption capacity due to numerous micropores, resulting in lower density (1000–1200 kg/m3), compressive strength (1–4 MPa), and thermal conductivity (0.15–0.20 W/mK) of PS concrete. AS concrete showed the opposite trend (1120–1260 kg/m3; 2.8–7.0 MPa; 0.2–0.4 W/mK) due to AS microporosity-free and denser structure. PlS has intermediate characteristics in terms of porosity, density, and water absorption, resulting in concrete with intermediate characteristics (1050–1240 kg/m3; 1.9–5.2 MPa; 0.15–0.3 W/mK).

1. Introduction

The climate emergency confronts us with the need to minimize the exploitation of our planet’s non-renewable resources. The extraction of raw materials has a dramatic impact on the environment, degrading landscapes, polluting soils and waters, irreparably damaging biodiversity, and inefficiently consuming a huge amount of energy [1]. Furthermore, the extraction of natural resources has accelerated exponentially since the 21st century and has grown significantly globally [2]. Indeed, global population growth, unbridled industrialization, and increased consumption have led to an increase in their demand [3]. The indiscriminate exploitation of non-renewable raw materials leads to their depletion: their cost is expected to increase significantly, and many of them may no longer be available in the near future [4,5]. Instead, renewable materials can be produced.
Ah indefinitely with strong environmental benefits, especially if they are waste by-products from other supply chains. This is the fundamental principle of the circular economy: someone’s waste becomes a valuable resource for someone else. The transition to a circular system provides the opportunity to address this problem by reducing the use of raw materials, protecting material resources, and reducing the carbon footprint [6,7]. It is also expected to bring economic benefits such as an increase in gross domestic product, net savings in raw materials, growth in employment, and reduced volatility in material and supply prices [8,9].
The building materials sector is a major contributor to environmental deterioration as it is one of the largest exploiters of resources, half of which are non-renewable [10,11]. Thus, global government policies are driving the need to use low-energy and renewable building materials for construction, with the aim of combating climate change and minimizing its effects [12]. The UN Agenda 2030 sets 17 Sustainable Development Goals (SDGs) to end poverty, protect the planet, and improve the lives and prospects of everyone and everywhere [13]. The construction sector is closely associated with several SDGs including clean water and sanitation (SDG 6), affordable clean energy (SDG 7), industry, innovation, and infrastructure (SDG 9), and sustainable cities and communities (SDG 11). In addition, also SGD 12 (ensuring sustainable consumption and production patterns) provides interesting insights. This concerns the substantial reduction of waste through prevention, reduction, recycling, and reuse, which are core principles of the circular economy. In fact, the use of waste or by-products as a substitute for fossil raw materials represents an important opportunity, as it allows for plugging the problems related to waste disposal while reducing the exploitation of the resources of our planet. The construction sector can only be considered truly sustainable when it starts using renewable materials or materials recycled from construction waste and demolition residues [14]. The conservation of natural resources must be maximized and the environmental impact during the entire life cycle of the building project must be reduced. The development of environmentally friendly building materials is an inevitable path to sustainable construction and the SDGs of Agenda 2030.
Cement concrete is undoubtedly the most widely used building material [14,15], with a worldwide production of more than 10 billion tons. The enormous demand for concrete has led to the exploitation of a massive quantity of aggregates, causing their depletion or exhaustion in natural basins, as well as significant environmental issues [14,15]. The utilization of recycled or bio-based materials as a substitute for natural aggregates has been identified as a highly effective strategy to enhance sustainability in the construction industry. Several studies have explored the potential of industrial byproducts, agri-food wastes, or demolition wastes as lightweight aggregates (LWAs). LWAs have a lower average density and higher porosity, providing concrete with lower density and thermal and acoustic insulation properties. Lightweight concrete has a dry density of up to 2000 kg/m3 and a thermal conductivity usually lower than 1 W/(m·°C). Therefore, it is used when low weight and insulating properties are relevant. The thermal conductivity of concrete refers to its ability to transfer heat. High thermal conductivity can lead to unwanted energy loss, which can increase energy costs and reduce the comfort levels of indoor spaces. In contrast, low thermal conductivity in concrete can promote energy efficiency and thermal comfort. One way to improve the thermal conductivity of concrete is by adding lightweight aggregates, which typically have good insulation properties. For example, Real et al. [16] reported that the use of lightweight concrete in buildings can reduce heating energy by 15% compared to normal-weight concrete.
Although lime concrete is an old material used in civil engineering [17,18,19], only a few studies have investigated its potential as an alternative to Portland cement concrete for structural components [20,21]. Lime has some environmental advantages over concrete-based materials: it requires less energy for its production, since limestone, the basic raw material, can be burned at lower temperatures (900–1000 °C), whereas silicate rocks for concrete require at least 1300 °C. Furthermore, part of the CO2 generated during the production process is reabsorbed by hardened lime [22]. Therefore, the main aim of this study was to develop lime-based non-structural lightweight concrete using waste materials from the agri-food chain as coarse aggregates. In particular, Rosaceae fruit shells are a widely available waste, as a significant part of the harvested fruit is processed, resulting in a huge amount of waste kernels [23].
Peach (Prunus persica L.), apricot (Prunus armeniaca L.), and plum (Prunus domestica L.), belonging to the same Prunus family, are widely cultivated fruits [24] above all for their relevance to human health [25,26,27,28,29] as an important source of phenolic compounds, cyanogenic glucosides, vitamins, mineral salts, and phytoestrogens. According to the “Food and Agriculture Organization (FAO)”, in 2020, global peach production was approximately 24 million tons, apricot one 3.7 million tons, and plum one 12 million tons. Their pulp is still the only part that is most appreciated and used by agro-industries, whereas pits are considered low-value agro-industrial residues. In addition to being directly consumed as fresh fruit, most Rosaceae fruits are processed into juices, canned fruits, jams, and sweet snacks. All these productive sectors give rise to a large quantity of kernels as waste, estimated at around 10% of the total mass [30]. Thanks to their high calorific value, the current alternative to landfilling fruit shells is incineration in biomass heating systems. However, this seasonal activity requires temporary kernel storage in large open-air stacks. This leads to some issues such as space availability, environmental hygiene problems, and the development of odorous exhalations due to uncontrolled fermentation of pulp residues and decomposition of organic material [31]. A second and more important factor concerns the serious environmental effects caused by the incineration of these materials. It is estimated that the combustion of agricultural residues, such as wood, leaves, trees, and grass, generates approximately 40% of CO2 emissions, 32% of CO emissions, 20% of particulate matter, and 50% of polycyclic aromatic hydrocarbons (HAPs) [32]. Fruit shells exhibit several characteristics that make them an interesting alternative to common coarse aggregates. For example, their degradation under natural conditions is difficult and slow [33,34], unlike other food waste by-products. Moreover, it is a widely available and low-cost waste material, and its reuse and valorization are perfectly aligned with Agenda 2030 for Sustainable Development [13] and, in particular, with SGD 12.
Several studies have reported the use of agricultural waste materials, such as oil palm shells, palm oil clinkers, wood, mussel shells, date seeds, and coconut shells [35,36,37,38], for the production of environmentally friendly concrete. Some studies have used fruit shells to prepare cement-based concrete [39,40,41], but there is little evidence of lime-based materials. The effects induced on the physical and mechanical properties of lime-based concrete of peach, apricot, and plum shells were investigated, considering density, compressive strength, and thermal conductivity. In this preliminary study, the goal was to evaluate the potential of these materials as LWAs and identify any differences between the different shell types. The compositional and morphological characteristics of the aggregates were evaluated and correlated with the performance of lightweight concrete. Scanning electron microscopy (SEM) was used for the morphological study of the LWAs, and TGA-MS-EGA was used to obtain compositional information and study their behavior under thermal stress.

2. Materials and Methods

2.1. Raw Materials Properties and Specimens Preparation

2.1.1. Binder Mixture

The main binder used was hydrated lime (Litokol S.p.A., Rubiera, Italy). To improve the mechanical properties, a few sets of specimens were prepared with the addition of Type I 52.5 grade Portland cement (Litokol S.p.A., Rubiera, Italy). The physical and chemical properties of the binders are listed in Table 1.

2.1.2. Coarse and Fine Aggregates

Crushed shells were used as alternative coarse aggregates (Figure 1). Peaches, apricots, and plums were obtained from a local orchard in Modena, Italy. The pulp was separated from the pits, cleaned before use, and the residual dried pulp and dust on their surfaces were removed. The pits were preliminarily air dried for 30 days to remove residual moisture. Preliminary coarse grinding allowed the separation of the internal kernel from the external shell. The dried pits were crushed with a crushing machine and sieved with 4.5 and 9.5 mm sieves. Natural alluvial silica sand was used as the fine aggregate (Litokol S.p.A., Rubiera, Italy). The physical properties of the aggregates are listed in Table 2, and the proximate chemical compositions of the fruit shells are listed in Table 3.
The methods recommended by the Association of Official Analytical Chemists [45] were used to determine the levels of moisture, ash, crude protein, and residual oil. Moisture content was determined by drying the samples at 105 °C to a constant weight. The ash content was determined using a laboratory furnace at 550 °C and the temperature was gradually increased. Nitrogen content was determined using the Dumas method and converted to protein content by multiplying by a factor of 6.25. The residual fat fraction was recovered using the Soxhlet method, exhaustively extracting 10 g of each sample using petroleum ether (boiling point range 40–60 °C) as the extractant solvent. Each measurement was performed in triplicate, and the results were averaged.
Finally, we emphasize that the chemical composition and physical properties of vegetable matrices are significantly influenced by certain factors, including the geographical origin, degree of ripeness, and cultivar to which they belong [46].

2.1.3. Lime-Concrete Design and Specimen Preparation

Normal tap water was used in this study. The mix proportions of all specimens are listed in Table 4. For each shell, the mix proportion of the related concrete was kept constant (PSC = Peach Shell Concrete; ASC = Apricot Shell Concrete; PlSC = Plum Shell Concrete). Specimens were removed from the mold after 24 h. They were stored in a laboratory room with a relative humidity of 95 ± 5% and a temperature of 20 ± 2 °C until the test age. Binder mixture a (PSC_a, ASC_a, PlSC_a) only includes lime, while mixture b (PSC_b, ASC_b, PlSC_b) involves the addition of cement. Three sets of specimens were prepared: one for the compressive strength test, one for the demolded, air-dry, and oven-dry density evaluation, and one for the thermal conductivity test. Each set contained three cubic specimens (100 × 100 × 100 mm3), and the average values were obtained for each test result.
The specimens were prepared as follows: river sand, lime, and cement were poured into a blender and dry-mixed for 1 min. Water was added and the mixture was mixed for 3 min. The lightweight aggregates were finally added to and mixed for 5 min. After mixing, fresh mixtures were then poured into the mold and compacted. The specimens were placed in the laboratory room and were removed from the molds after approximately 24 h.

2.2. Experimental Methods

2.2.1. Morphological Analysis of the Aggregates

The field emission scanning electron microscope (SEM) instrument (Nova NanoSEM 450, FEI, Hillsboro, OR, USA) was used to evaluate the microscopic morphology of coarse lightweight aggregates.

2.2.2. TGA-MSEGA

A Seiko SSC 5200 thermal analyzer (Seiko Instruments Inc., Chiba, Japan) was used to perform the thermogravimetric analysis (TGA) in an inert atmosphere. A coupled quadrupole mass spectrometer (ESS, GeneSys Quadstar 422) was used to analyze the gases released during the thermal reactions (MS-EGA) (ESS Ltd., Cheshire, UK). Sampling was performed using an inert and fused silicon capillary system, which was heated to prevent condensation. The intensity of the signal of selected target gases was collected in multiple ion detection mode (MID); a secondary electron multiplier operating at 900 V was collected in multiple ion detection mode (MID), the intensity of the signal of selected target gases. The signal intensities of m/z ratios of 18 for H2O, 44 for CO2, 60 for C2H4O2 (acetic acid), 94 for C6H6O (phenol), 39 for C3H3+ (furfural fragment), 96 for C5H4O2 (furfural), and 151 for C8H8O3 (vanillin) were measured, where m/z is the ratio between the mass number and charge of the ion. The heating conditions were 20 °C/min in the thermal range of 25–1000 °C using ultrapure He at a flow rate of 100 μL/min as the purging gas.

2.2.3. Demolded, Air-Dry, and Oven-Dry Densities

Demodeld, air-dry, and oven-dry densities were determined following ASTM C567 [47]. The demolded mass was measured after demolding (after 24 h of curing), and the air-dry mass was measured after 28 days of curing. The test method for oven-dry density is more complex. The specimens were immersed in water (at about 20 °C) for 48 h, then the surface water was removed, and the saturated surface-dry mass was measured. Then, it was suspended in water with a wire, and the apparent mass of the suspended-immersed specimens was determined. The samples were then oven-dried at 110 °C for 72 h. The oven-dry density was calculated from Equation (1):
O m = D × 997 F G
where Om is the measured oven-dry density (kg/m3); D is the specimen mass (kg); F is the mass of saturated surface-dry specimen (kg); G is the apparent mass of suspended-immersed specimen (kg).

2.2.4. Mechanical Test

The compressive strength test was performed after 28 and 56 days using a Technotest compression test machine (Technotest, Modena, Italy). The average value of at least three specimens was used as the test result. It was performed in conformity with the European standard for structural concrete (EN 12390-3:2009), although our concrete had no structural purpose. Lime mortar (EN 1015-11:1999) would be more suitable for the intended use, but the presence of coarse aggregates prevents its application.

2.2.5. Thermal Conductivity of Lime-Concrete Specimens

A KD2 Pro thermal properties analyzer (Decagon Inc., Pullman, WA 99163, USA) was used for thermal conductivity measurements. It is a portable device fully compliant with ASTM D5334-08 and is used to measure the thermal properties of materials based on probe/sensor methods (transient line heat source), as confirmed by Decagon Devices Inc. Operator Manual version 11. It consists of a portable controller and sensors probe to be inserted into the medium to be measured. The measurement consists of heating the probe for a certain time and monitoring the temperature during heating and cooling. The influence of the ambient temperature on the samples must be minimized to obtain more accurate values. The measurement range of thermal conductivity of KD2 Pro is 0.02 to 2.00 W/(mK). In this study, three cubic specimens for each sample (100 × 100 × 100 mm3), at 28 days of curing were selected to measure thermal conductivity at dry conditions. The samples were oven-dried for 24 h at 100 °C prior to testing.

3. Results and Discussion

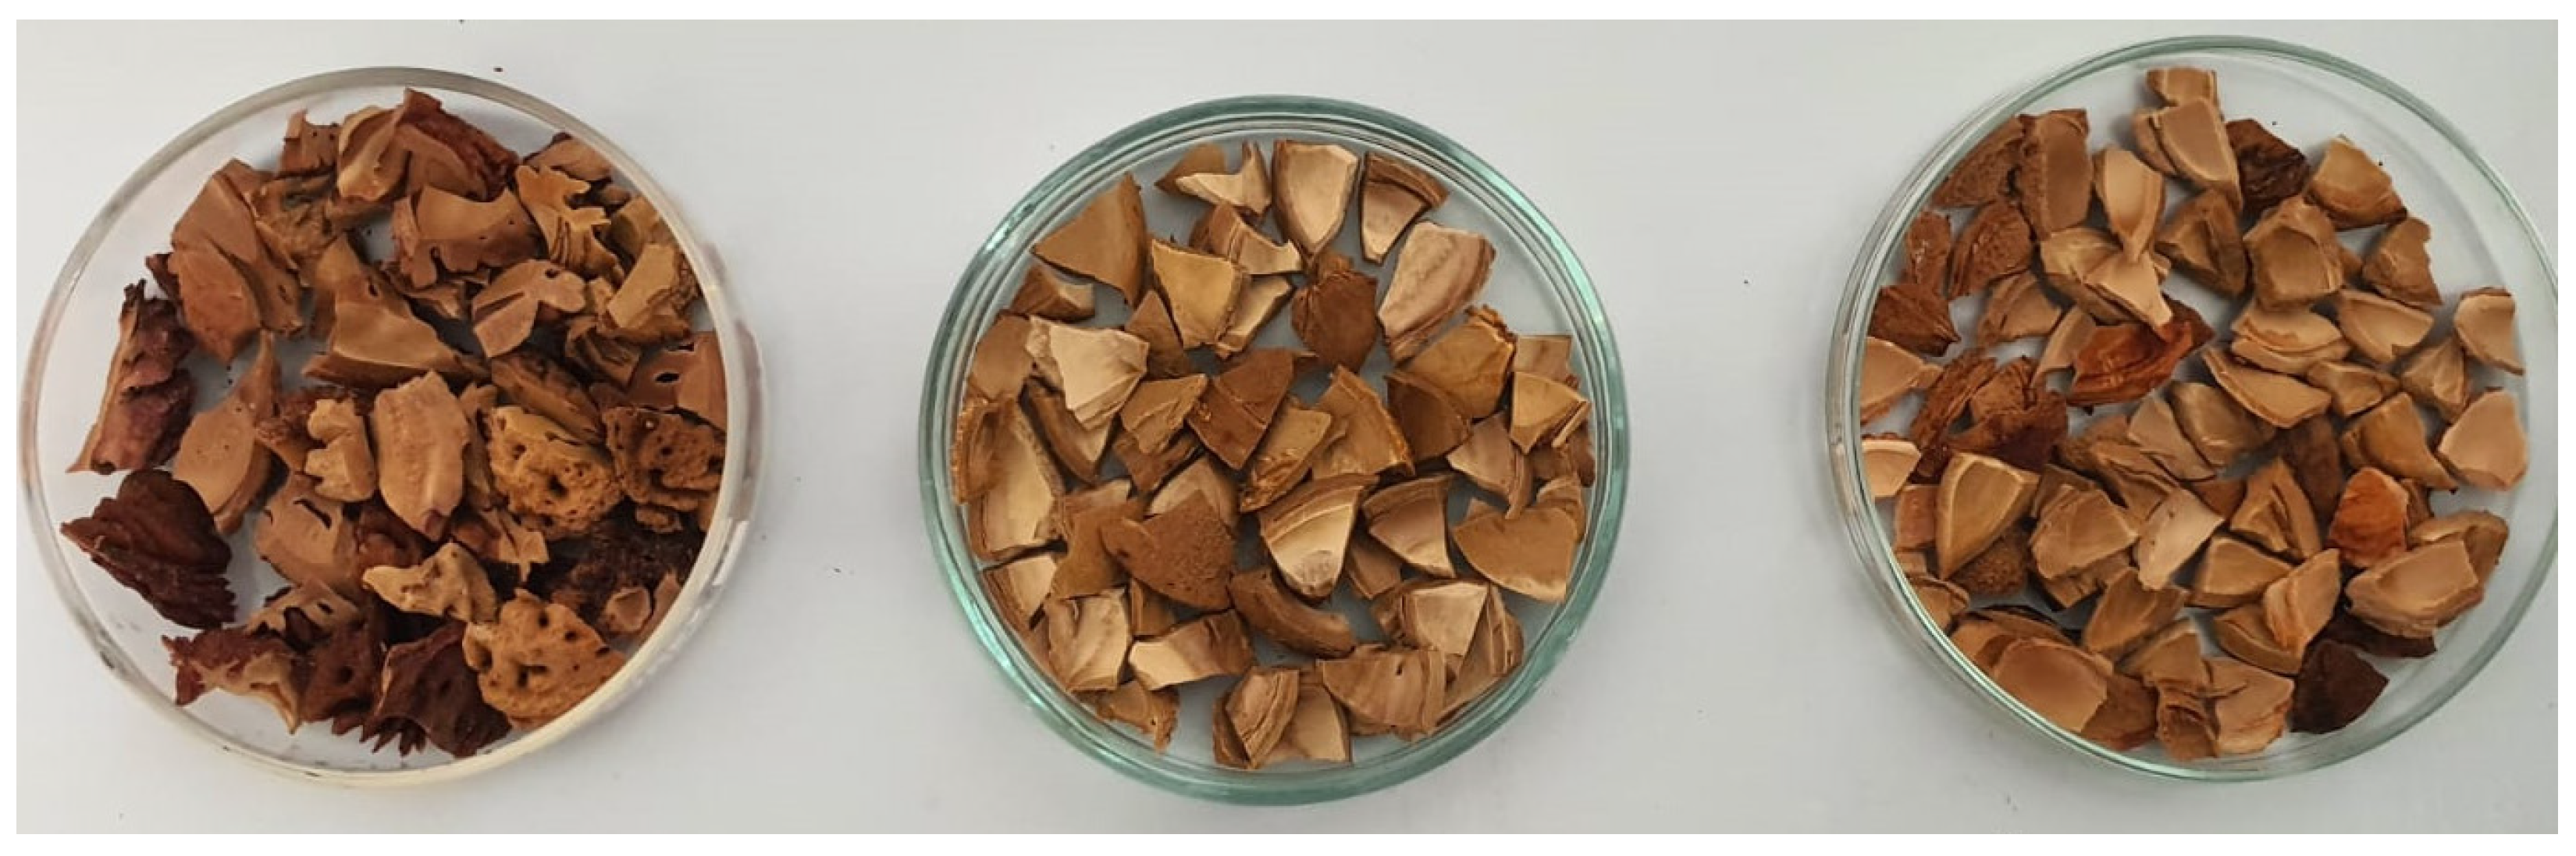
3.1. Lightweight Aggregates

LWAs, their nature, and compositional characteristics critically define the physical and chemical properties of concrete [48,49,50]. Depending on the type of aggregate used, the uses and functions of the final product change drastically [51]. Therefore, defining the compositional characteristics of our fruit shells is fundamental to understanding their potential as LWAs.
Bulk density is one of the most important characteristics [17] because it significantly affects the final density of concrete, which, in turn, determines its mechanical and insulation properties. This depends on the size and shape of the aggregates, the moisture content, and the porosity. PS had the lowest bulk density, whereas AS had the highest density. The SEM analysis (Section 3.2) highlights the marked morphological differences, which fully explains these density trends.
The water absorption of lightweight aggregates is generally significantly higher than that of conventional coarse aggregates. This is certainly due to the greater porosity but also to the different chemical compositions. In particular, fruit shells, lignocellulosic biomass, are composed mainly of the three main natural polymers, cellulose, lignin, and hemicellulose [52,53], and the content of these components in the examined matrices are collected in Table 2. Unlike lignin, which is highly hydrophobic, cellulose has a marked ability to absorb water. The latter acts as the glue that connects cellulose and hemicellulose [54]. In fact, in the cell wall of certain biomasses, especially wood species, lignin functions to cement cellulose fiber [55]. It is a three-dimensional strongly cross-linked macromolecule. Cellulose, on the other hand, differs markedly, as it is a linearly structured homopolymer, and in plants, it plays a fundamental role as a supporting matrix for the cell membrane. Hemicellulose is a heterogeneous, completely amorphous, weak polymer. Hemicellulose is decidedly more soluble and labile [53]. From Table 3, it can be seen that PS showed greater water absorption than AS and PlS. This phenomenon can certainly be attributed to the increased porosity (as will be explained later in Section 3.2). However, it is possible to draw conclusions by analyzing the chemical composition of the shells. In fact, the lignin content of PS was the lowest compared to that of AS and PlS, while that of cellulose and hemicellulose was higher. Considering the greater affinity of the latter towards the water and the hydrophobicity of lignin, the greater water absorption can be easily explained. Water absorption affects some important properties of concrete such as its strength, density, and time-dependent deformation [17,48].

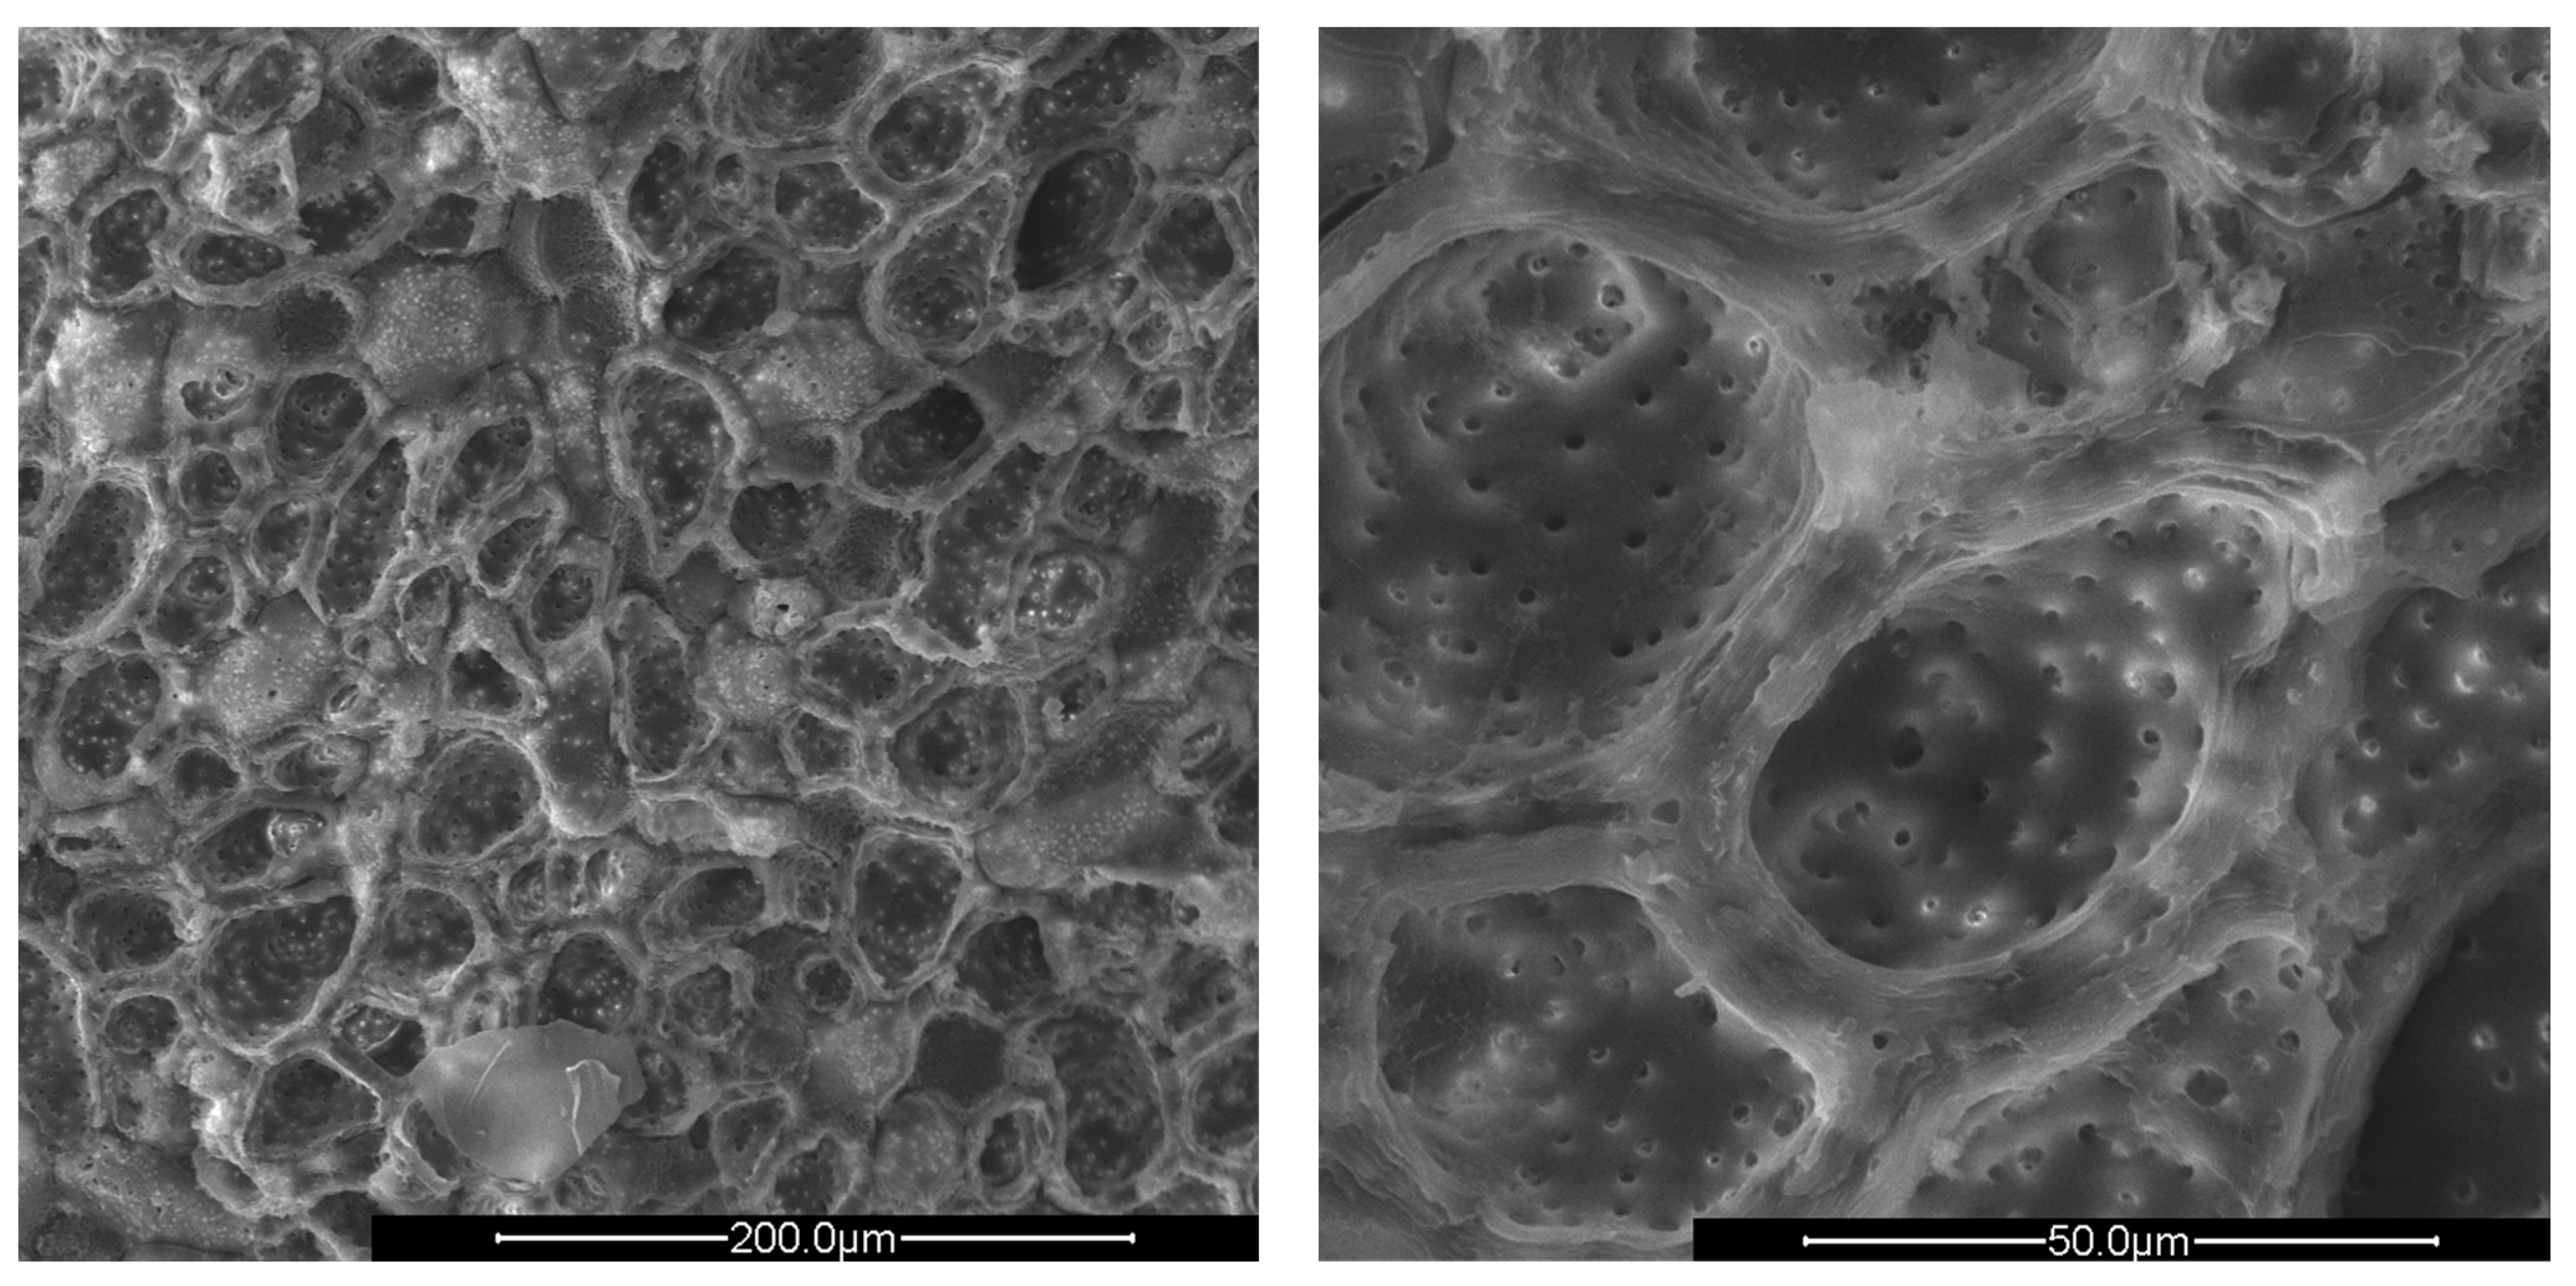
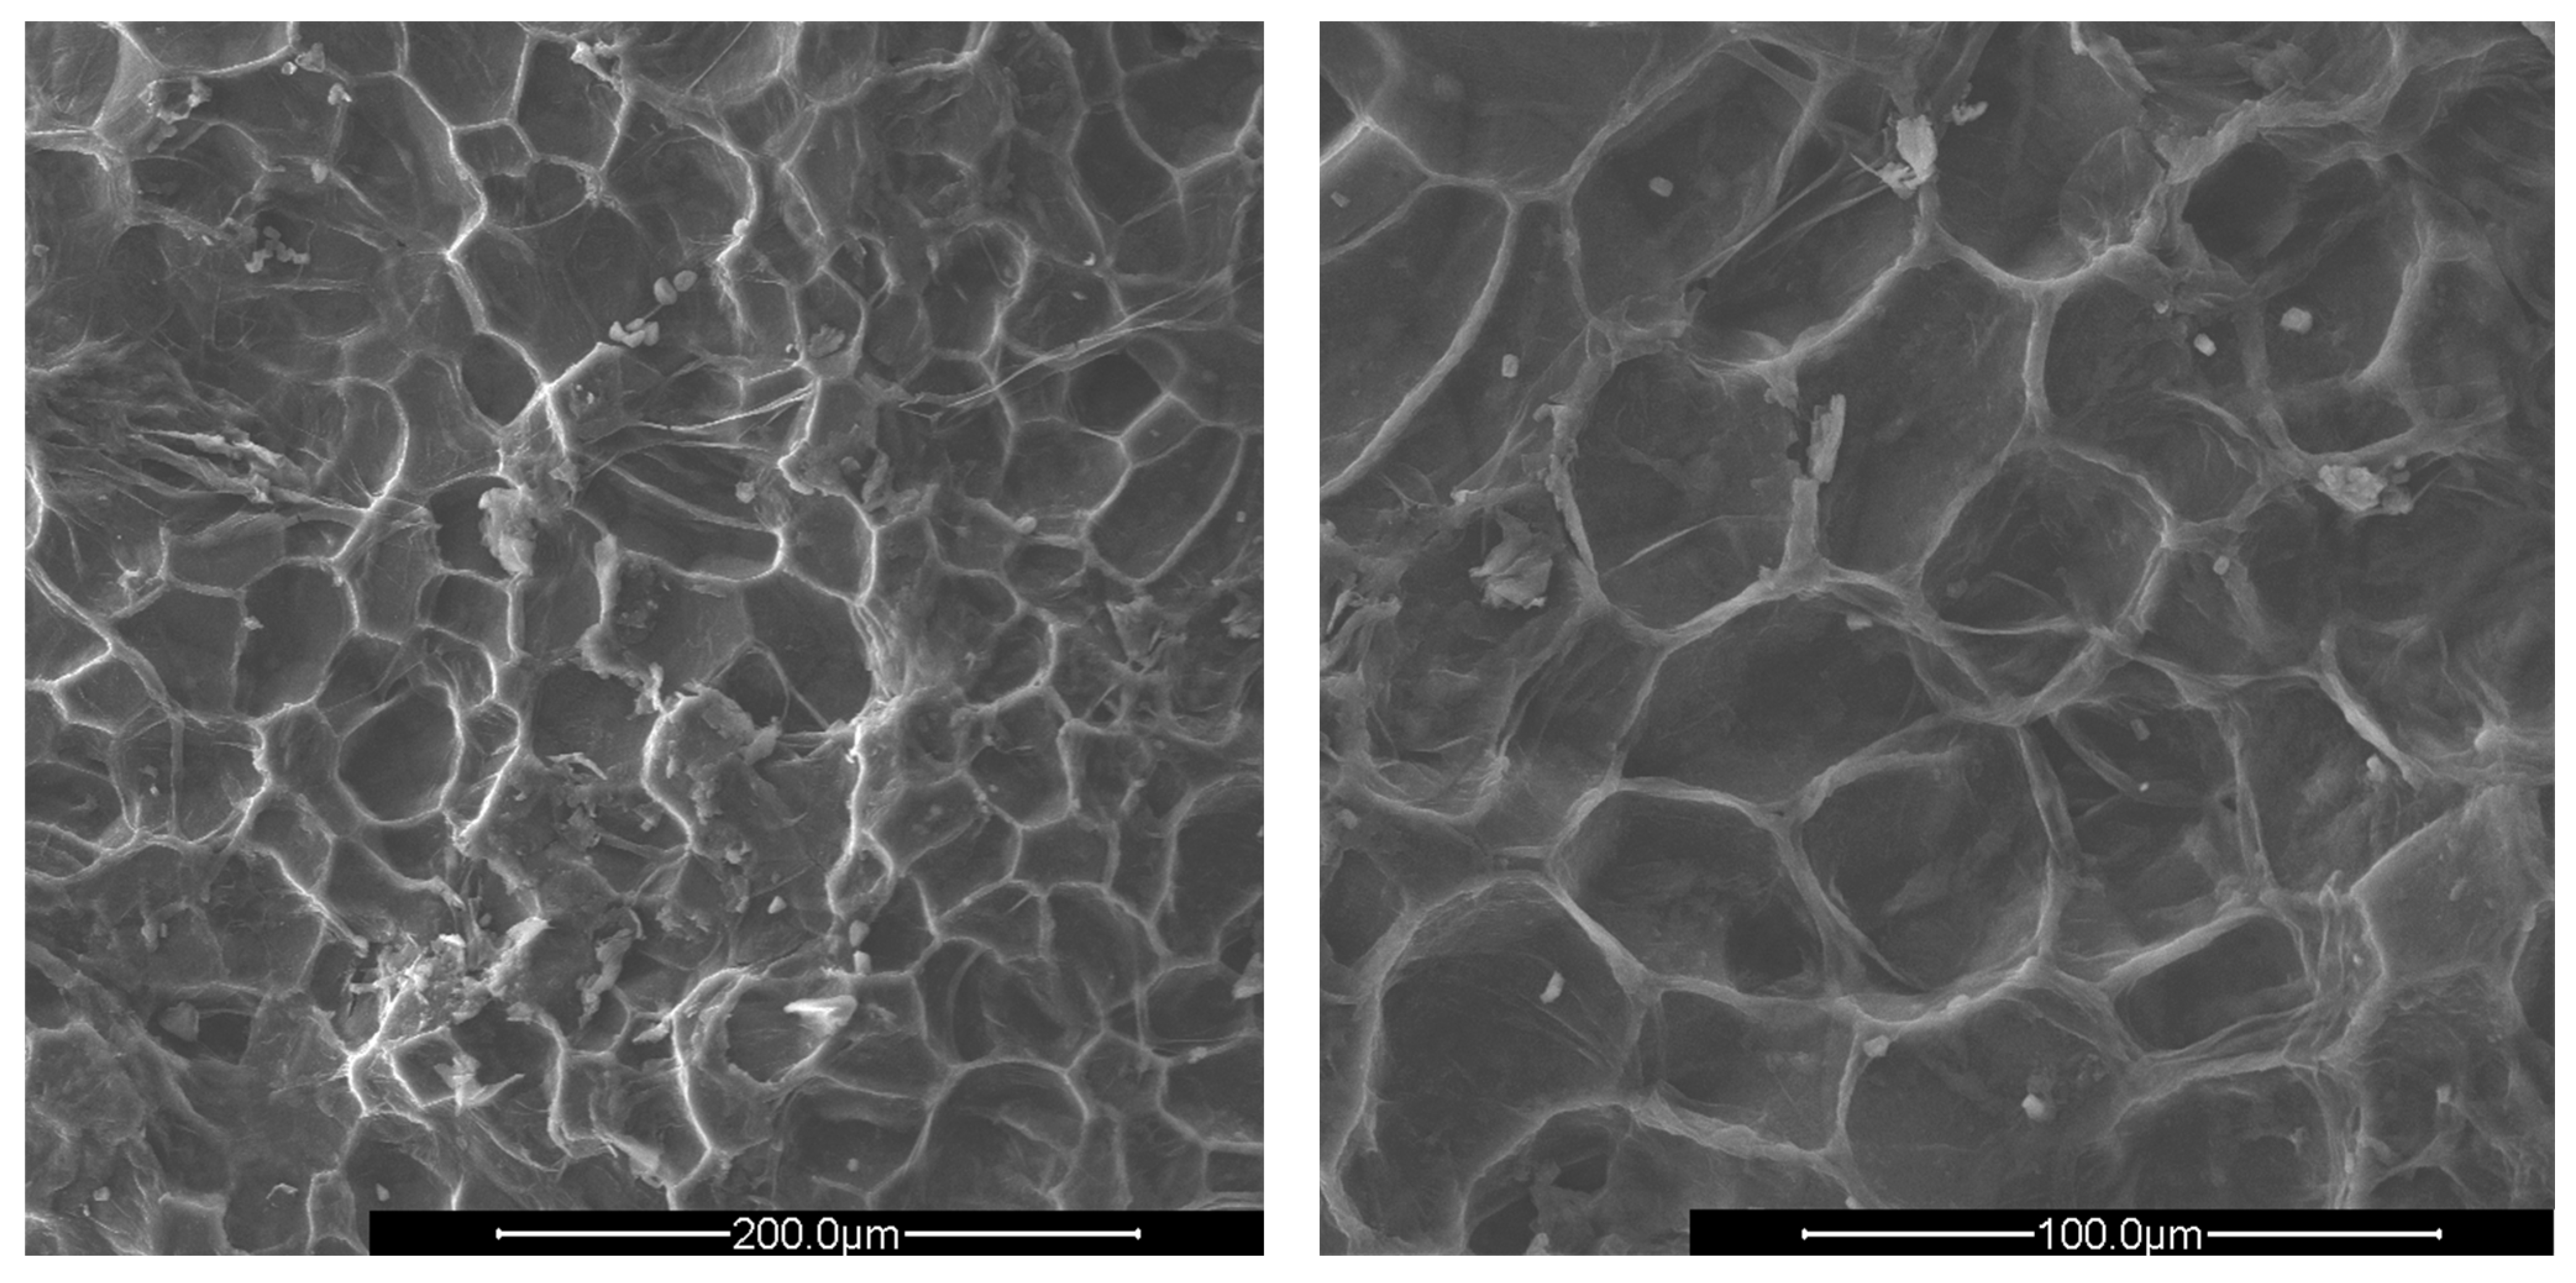
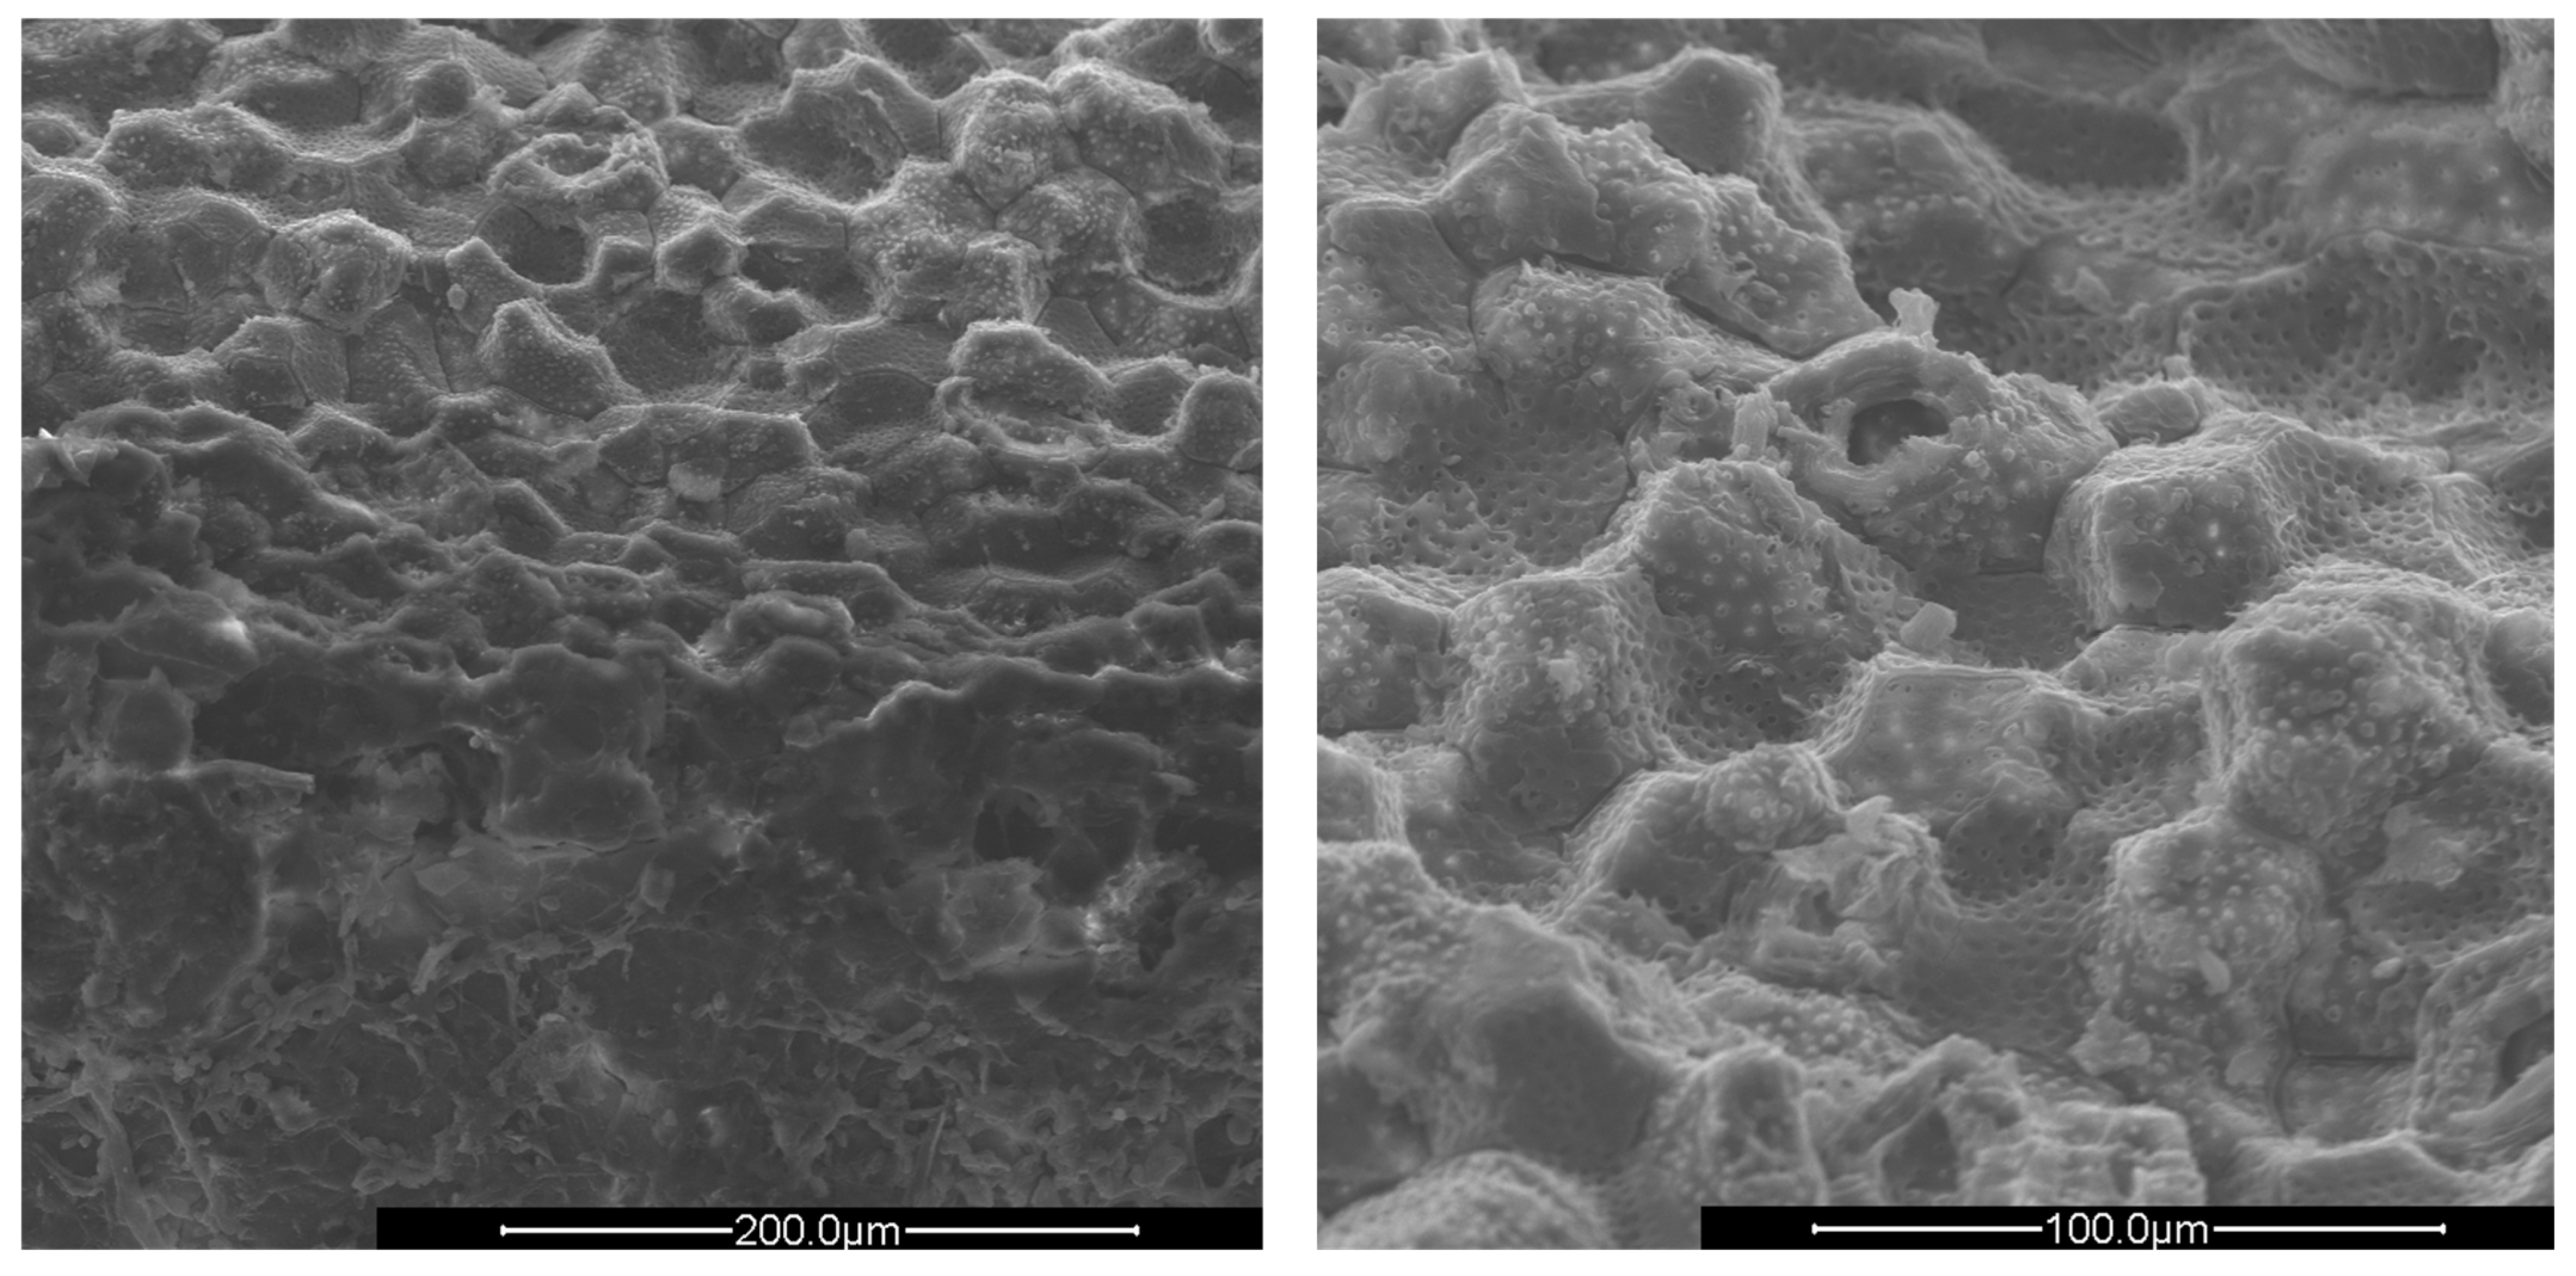
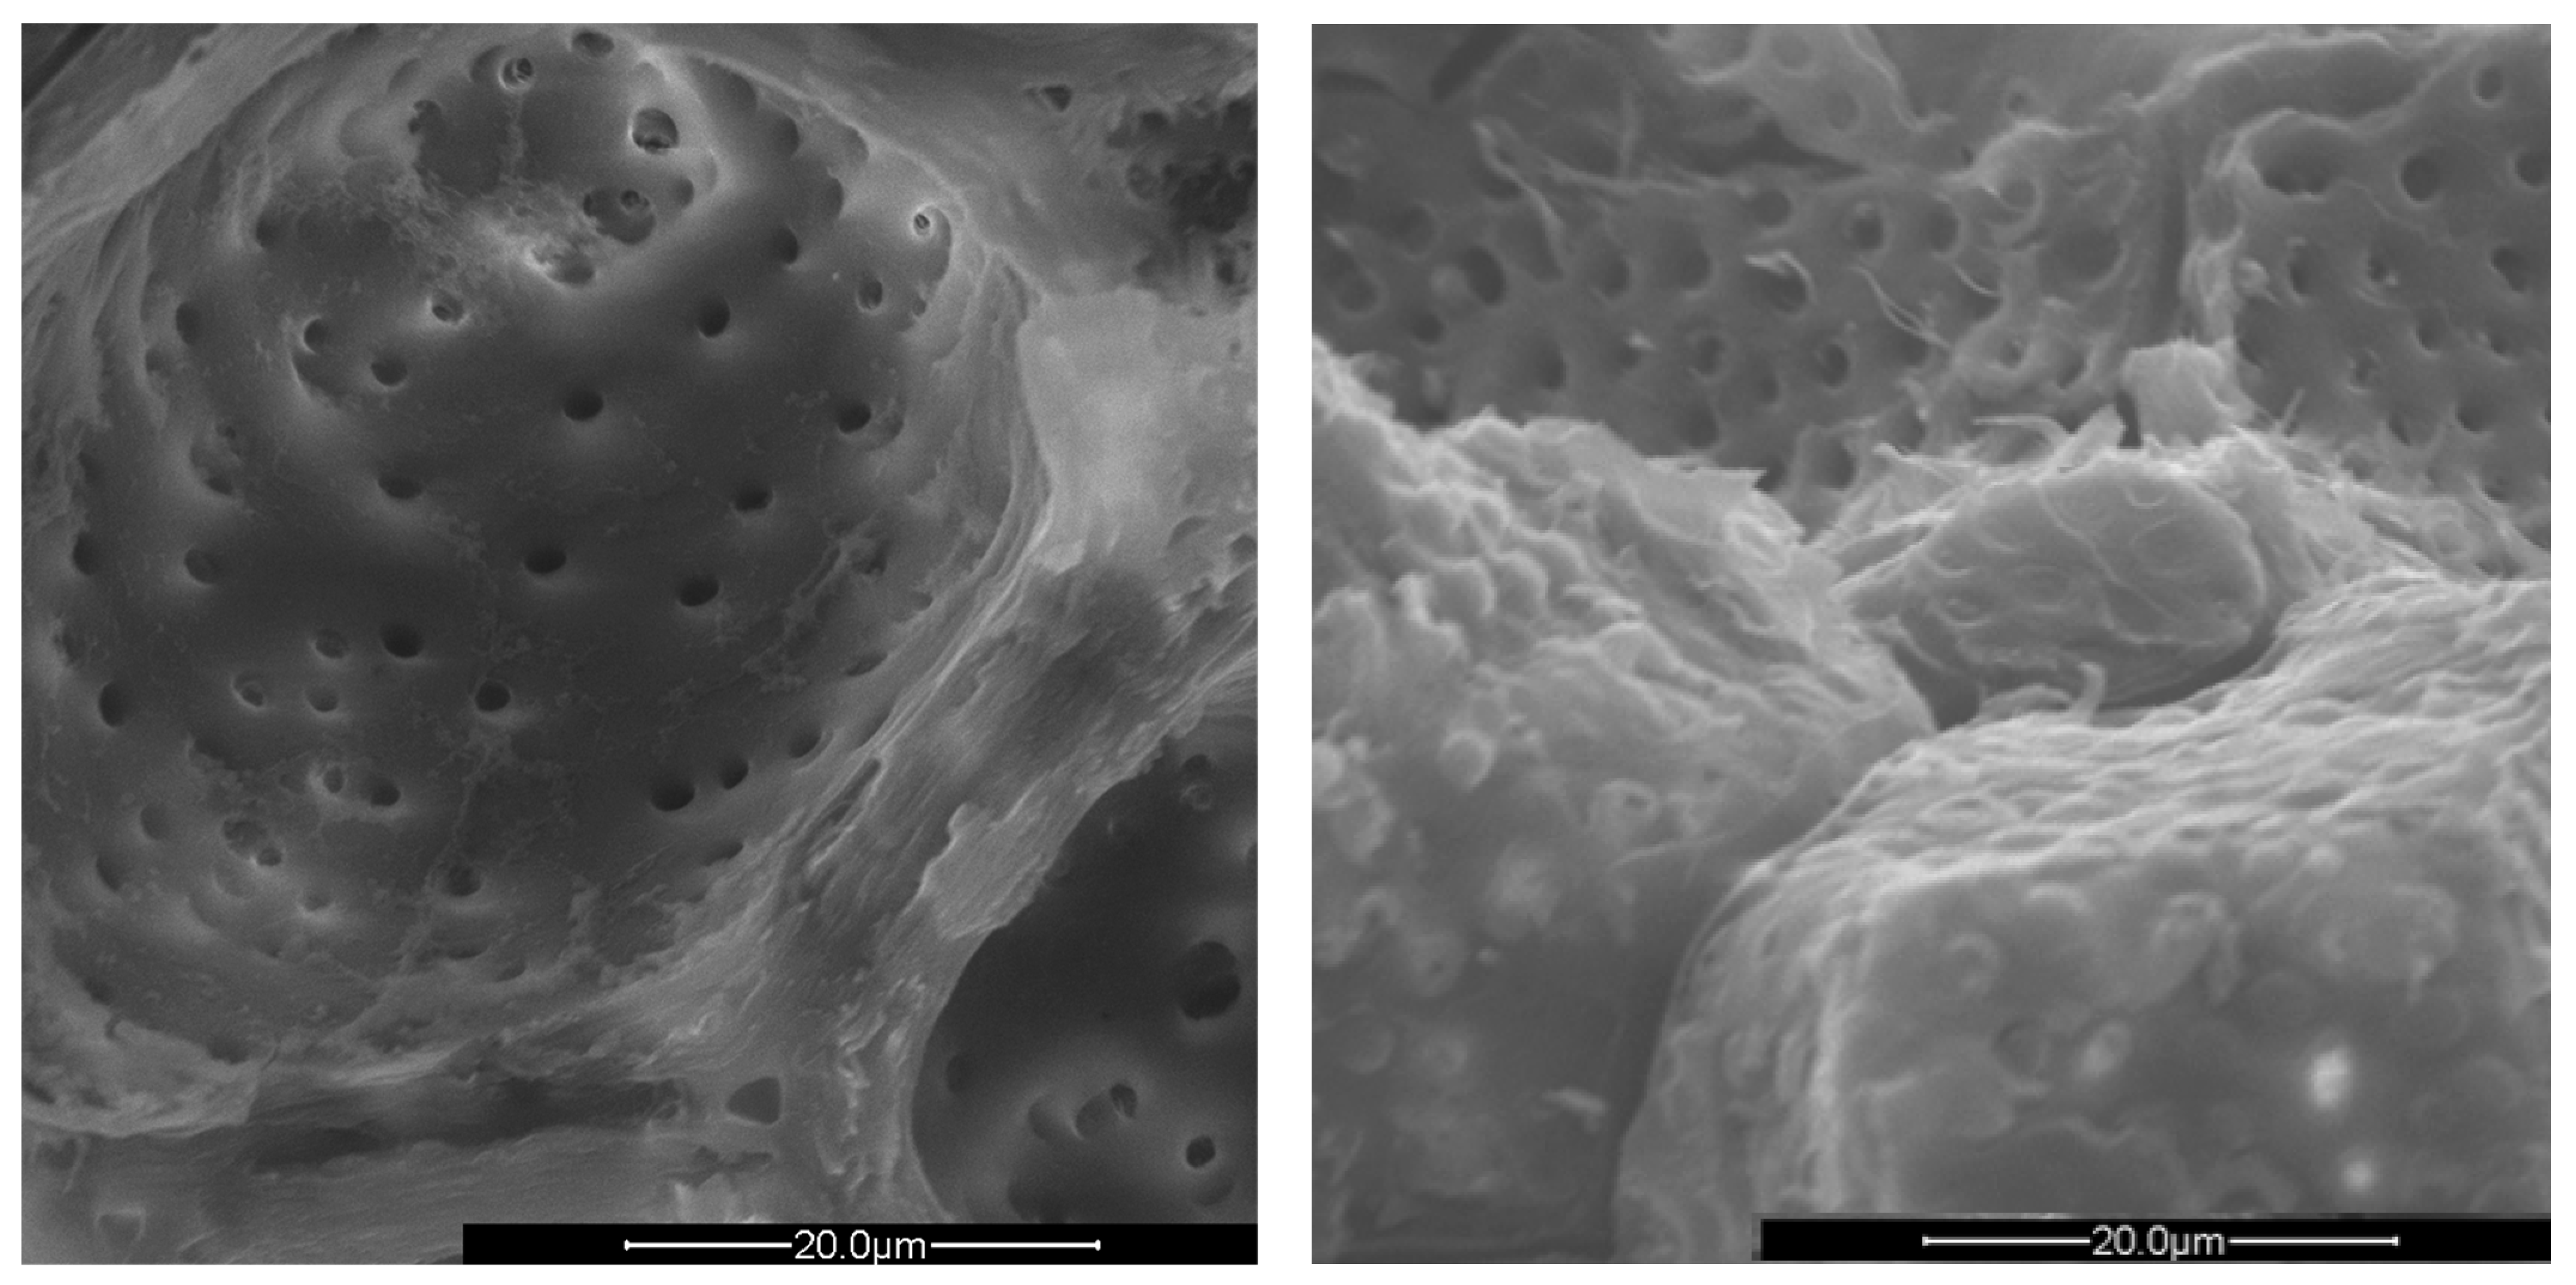
3.2. Morphological Analysis of the Aggregates

The surfaces of peach shells (PS), apricot shells (AS), and plum shells (PlS) are shown in Figure 2, Figure 3 and Figure 4, respectively. We reported only images relating to the external surface of the shells, in which we identified the most significant differences between PS, AS, and PlS. The internal one, in fact, was extremely smooth and compact for all three types of shells. Therefore, it seemed more important to pay attention only to the outer part of the shells, since the outer surface layers probably contribute more to the properties of the aggregates and, consequently, to the behavior of the specimens.
The surfaces of all shells appear rough, irregular, and have many cavities. The PS and AS cavities are ovoidal shaped, where the grater diameter is approximately 50 μm and the smaller one is about half, 25 μm. The PlS cavities, on the other hand, are much more irregular and lack a specific shape. The most evident observation concerns the presence of microporosity inside the cavities, which are only present in PS and PlS. The size of the microporosities was approximately 2.0 μm, which can be better viewed in Figure 5.
The PlS micropores were denser, although some were not completely empty. It is likely that a small fraction of the fruit pulp remained trapped inside the micropores, which made it difficult to remove by simple mechanical separation. The SEM observations can be correlated with the data shown in Table 2 and Table 3. The greater AS bulk density was justified by the absence of porosity and the consequent greater compactness. The PlS bulk density was higher than that of PS, which could be due to the more superficial and shallower porosities. The water absorption (24 h, %) data were also in line. PS has the highest value, indicating greater trapping of water inside the pores, AS has the lowest value, and PlS has an intermediate value.

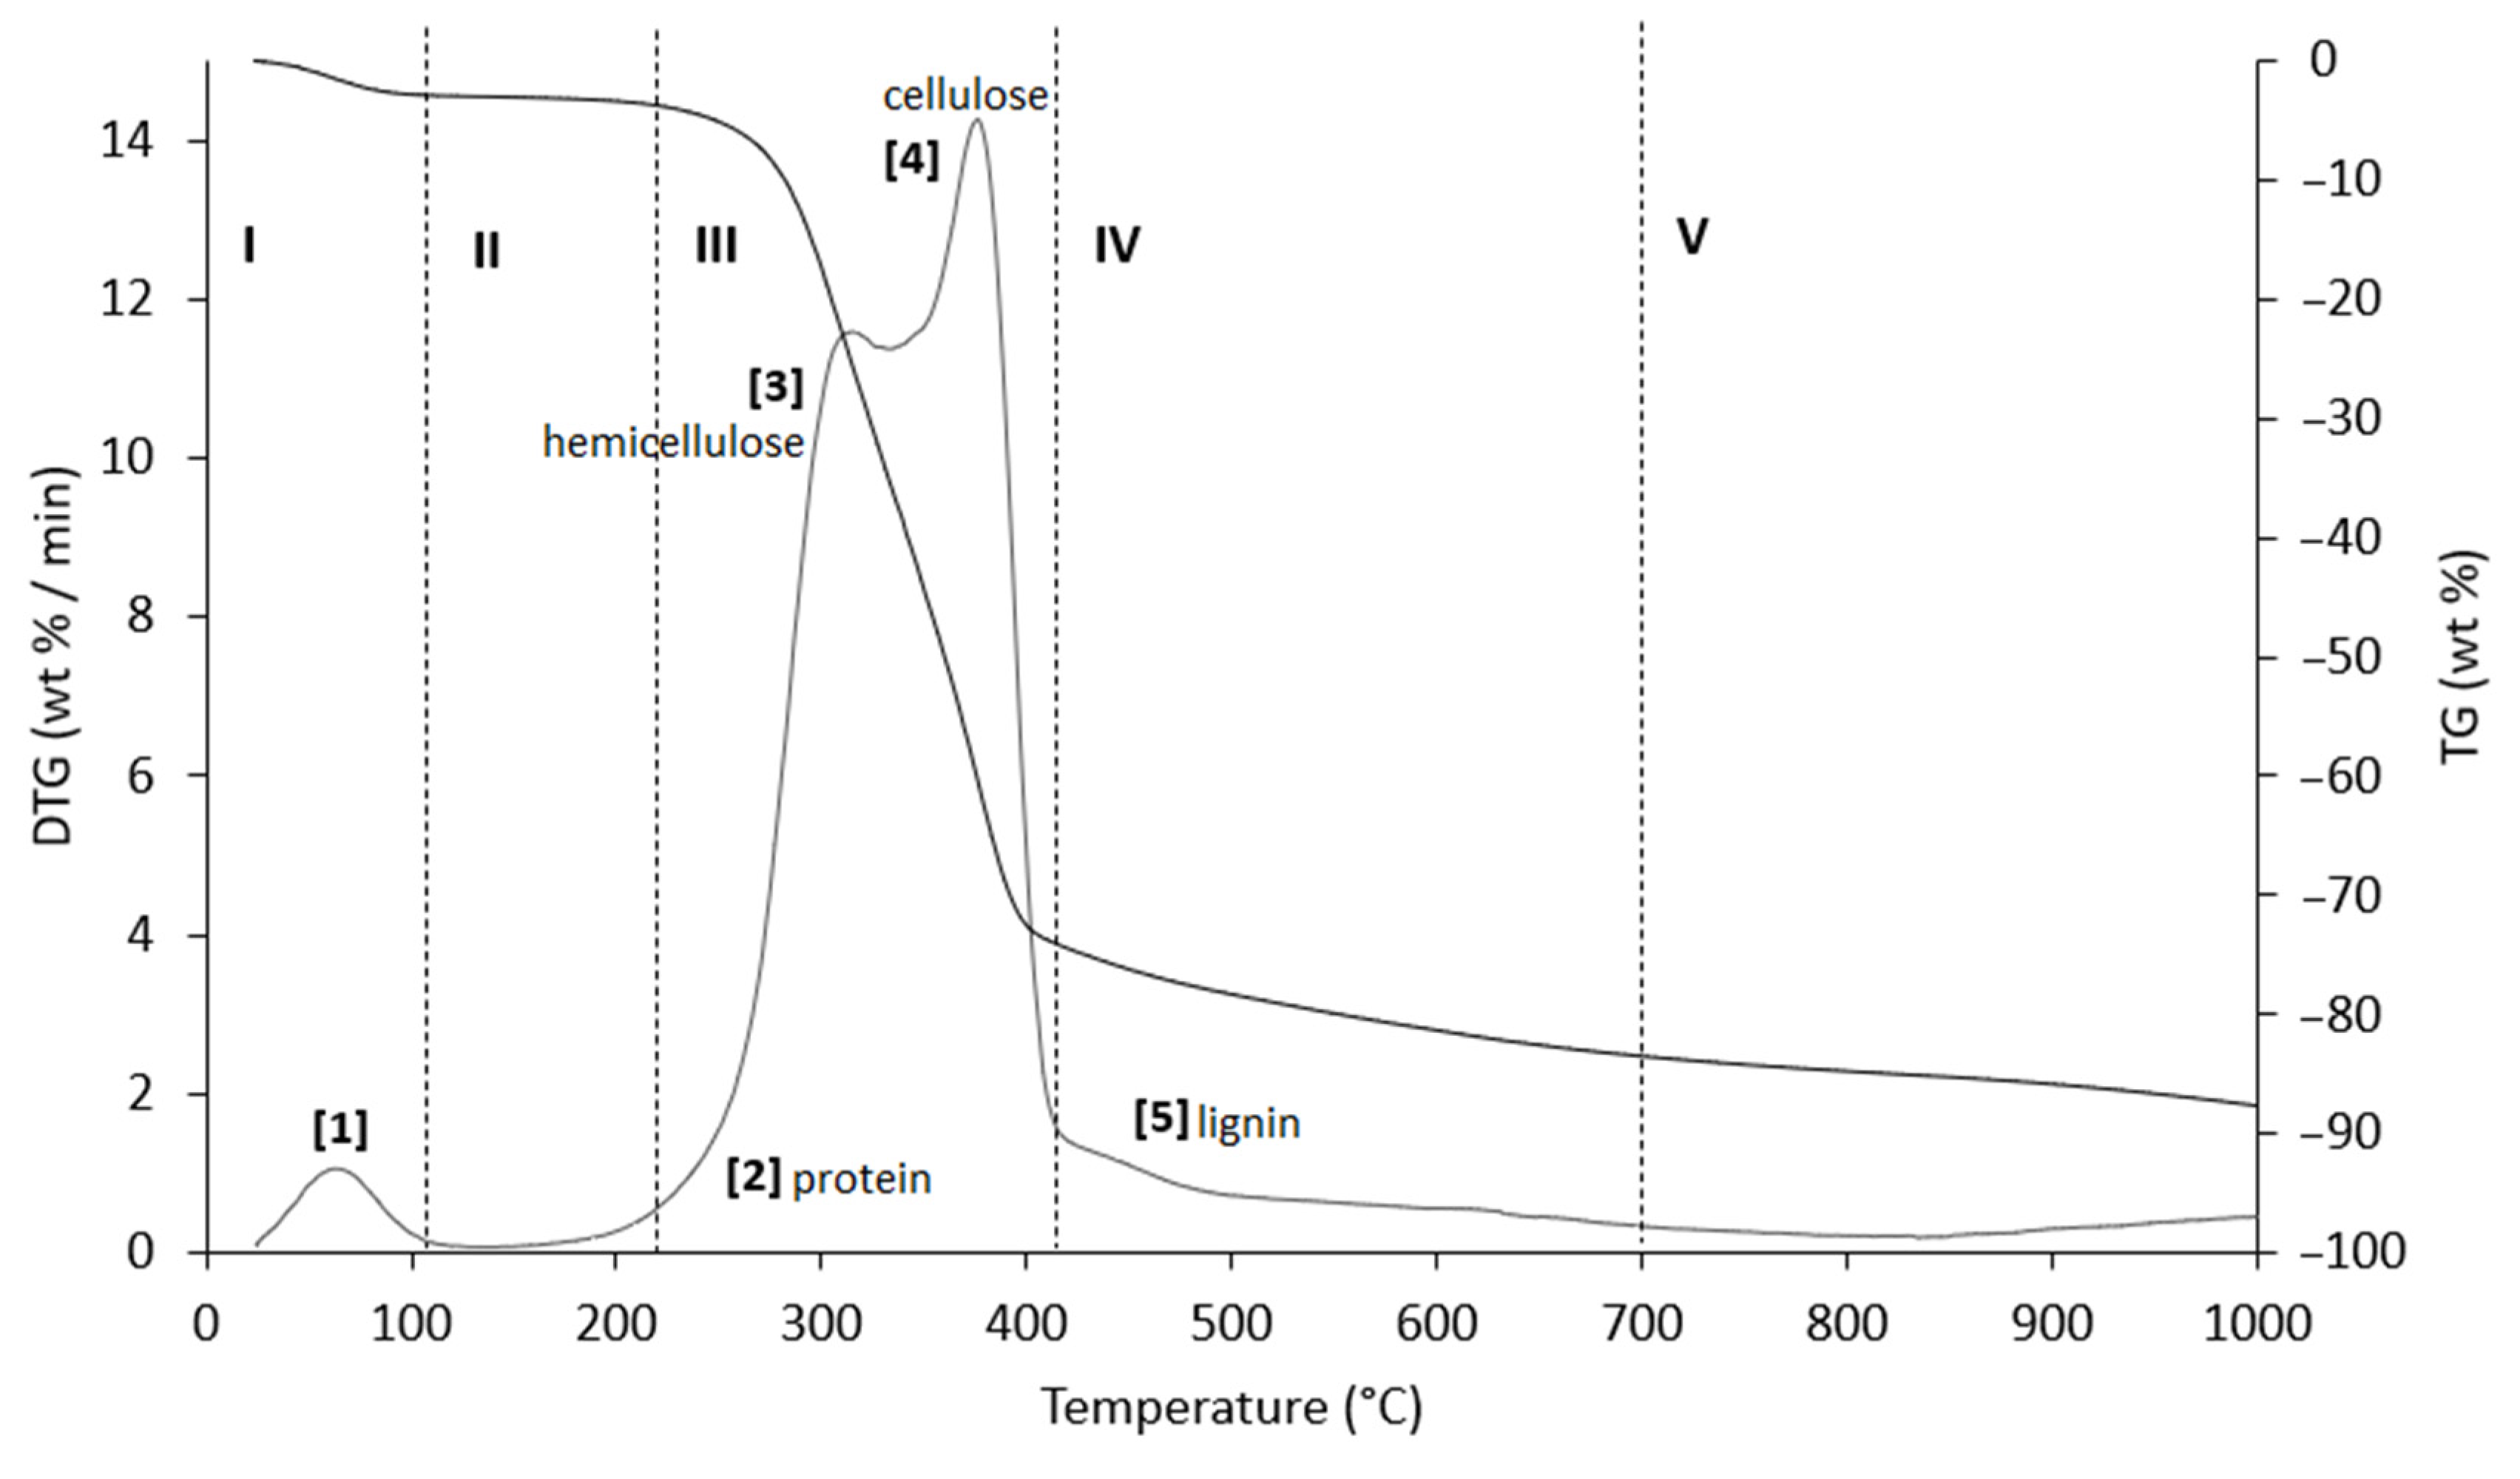
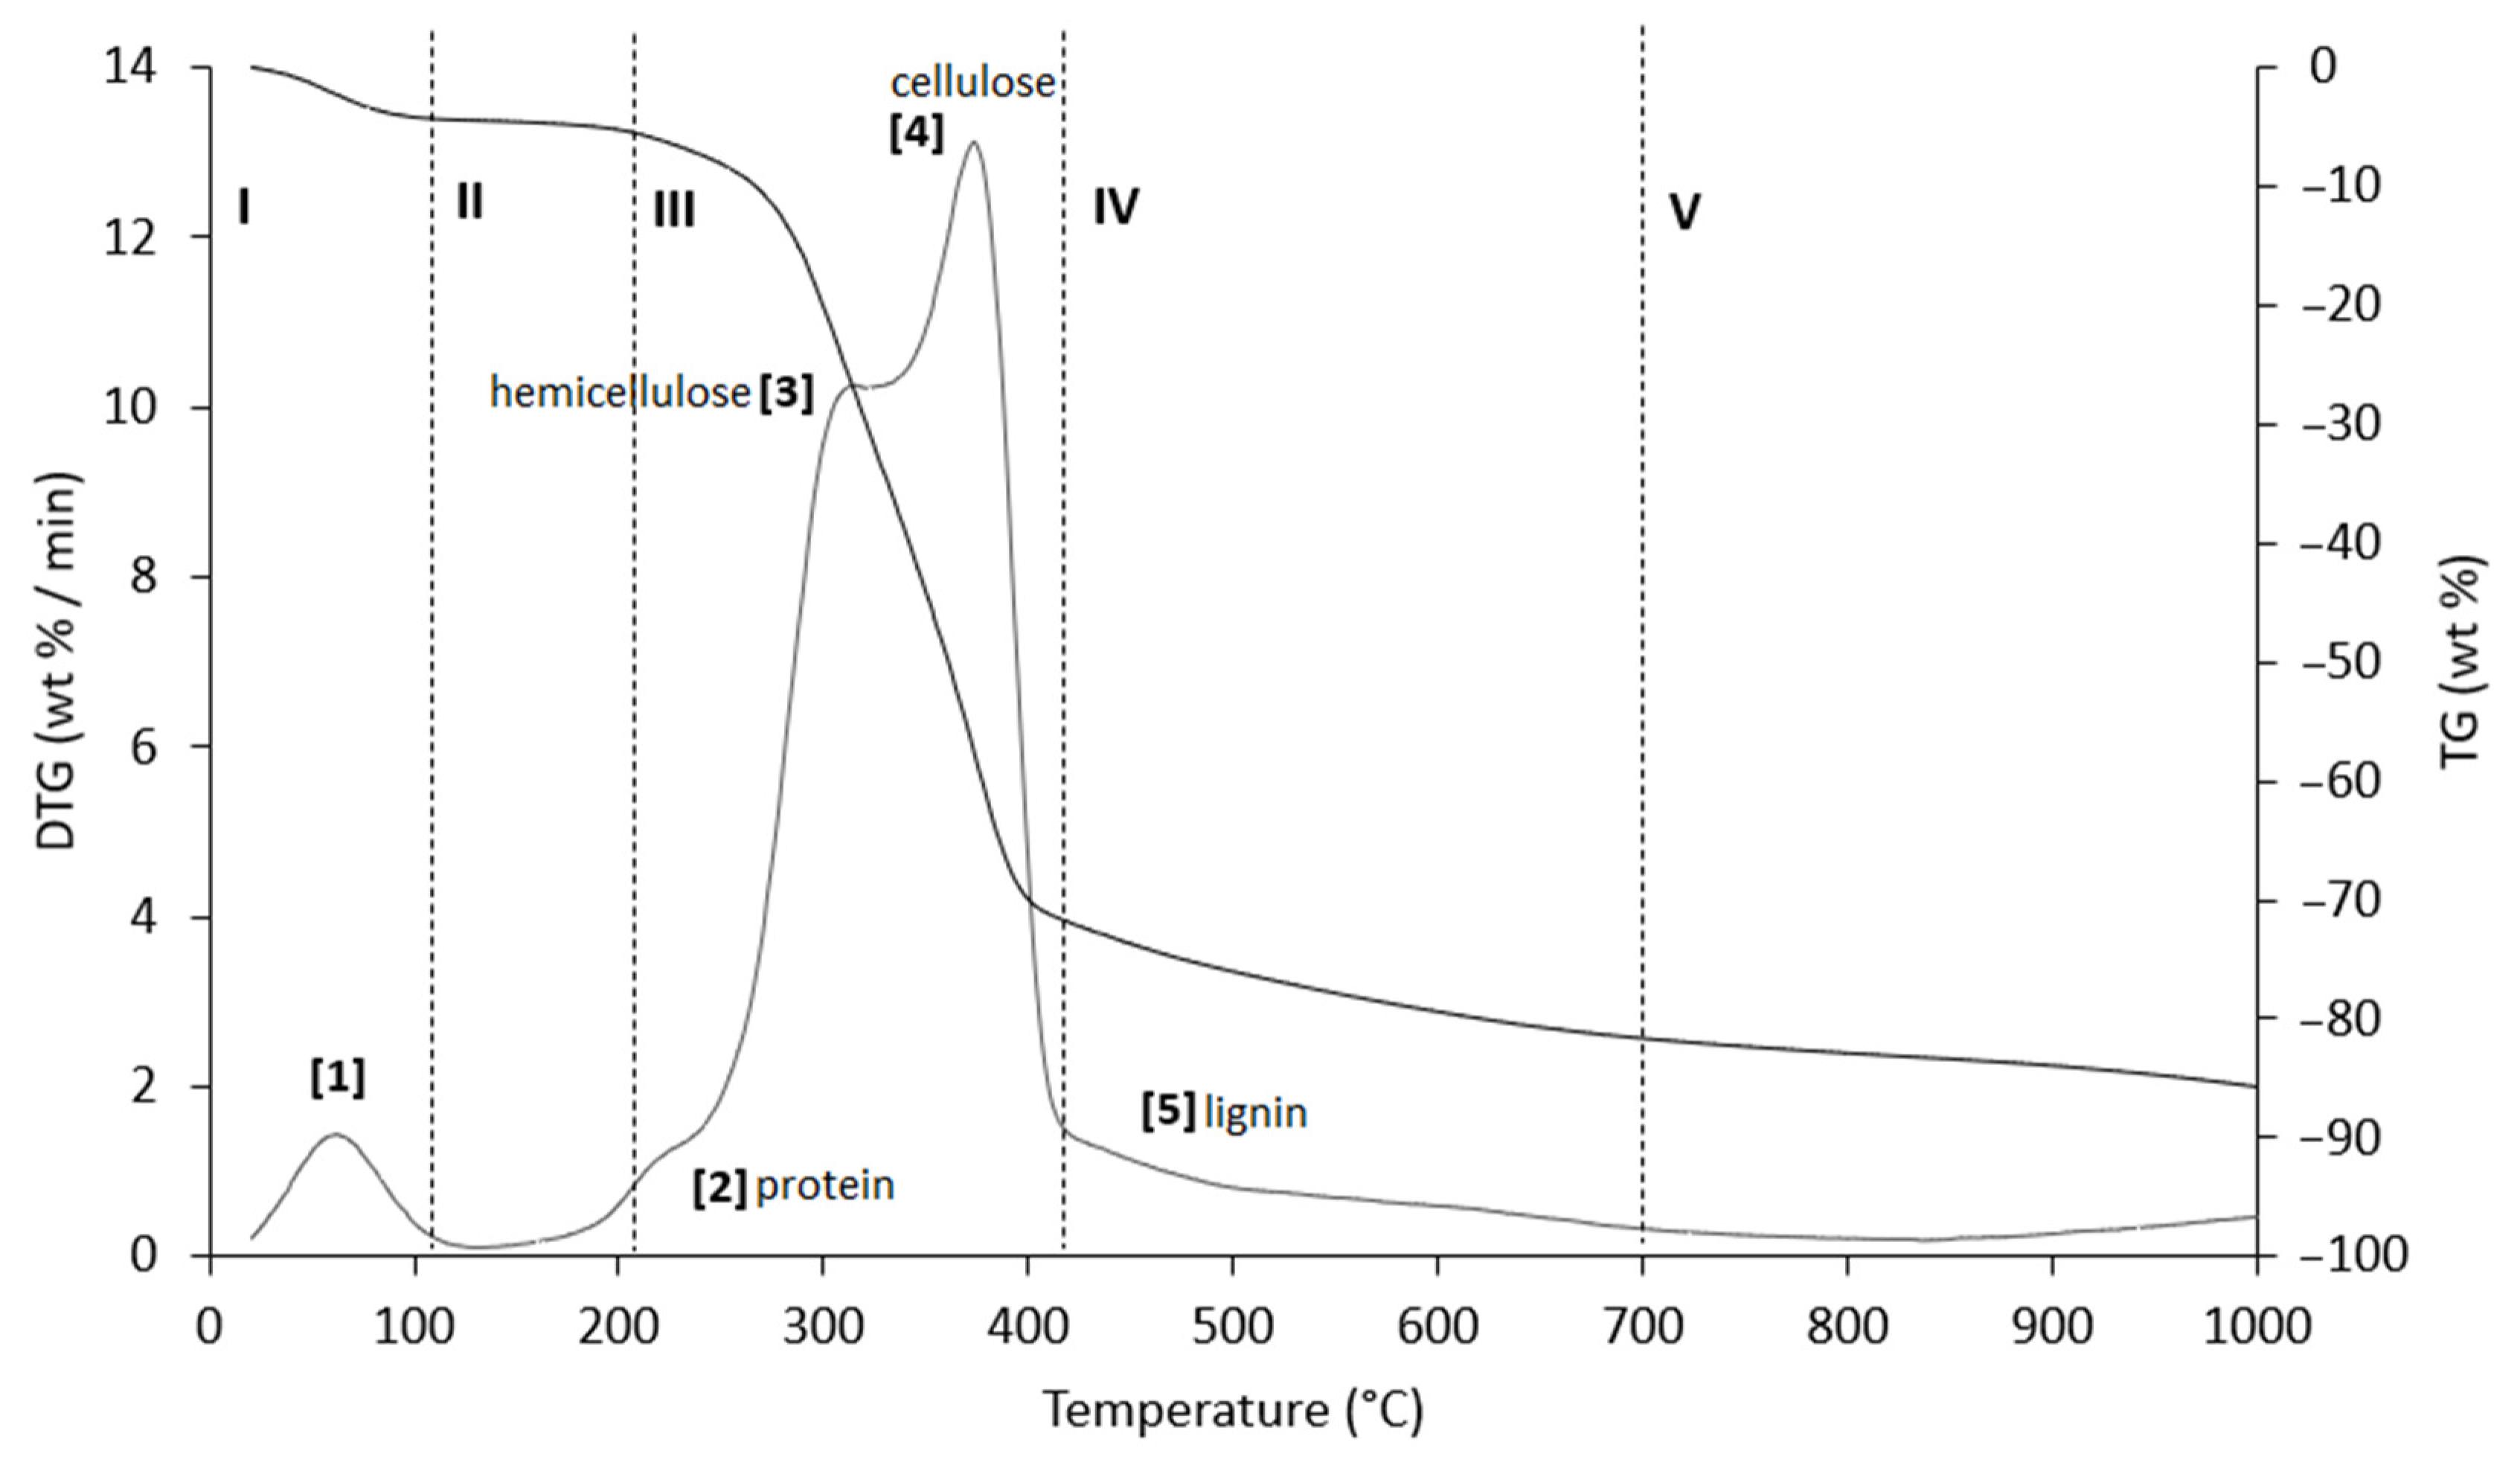
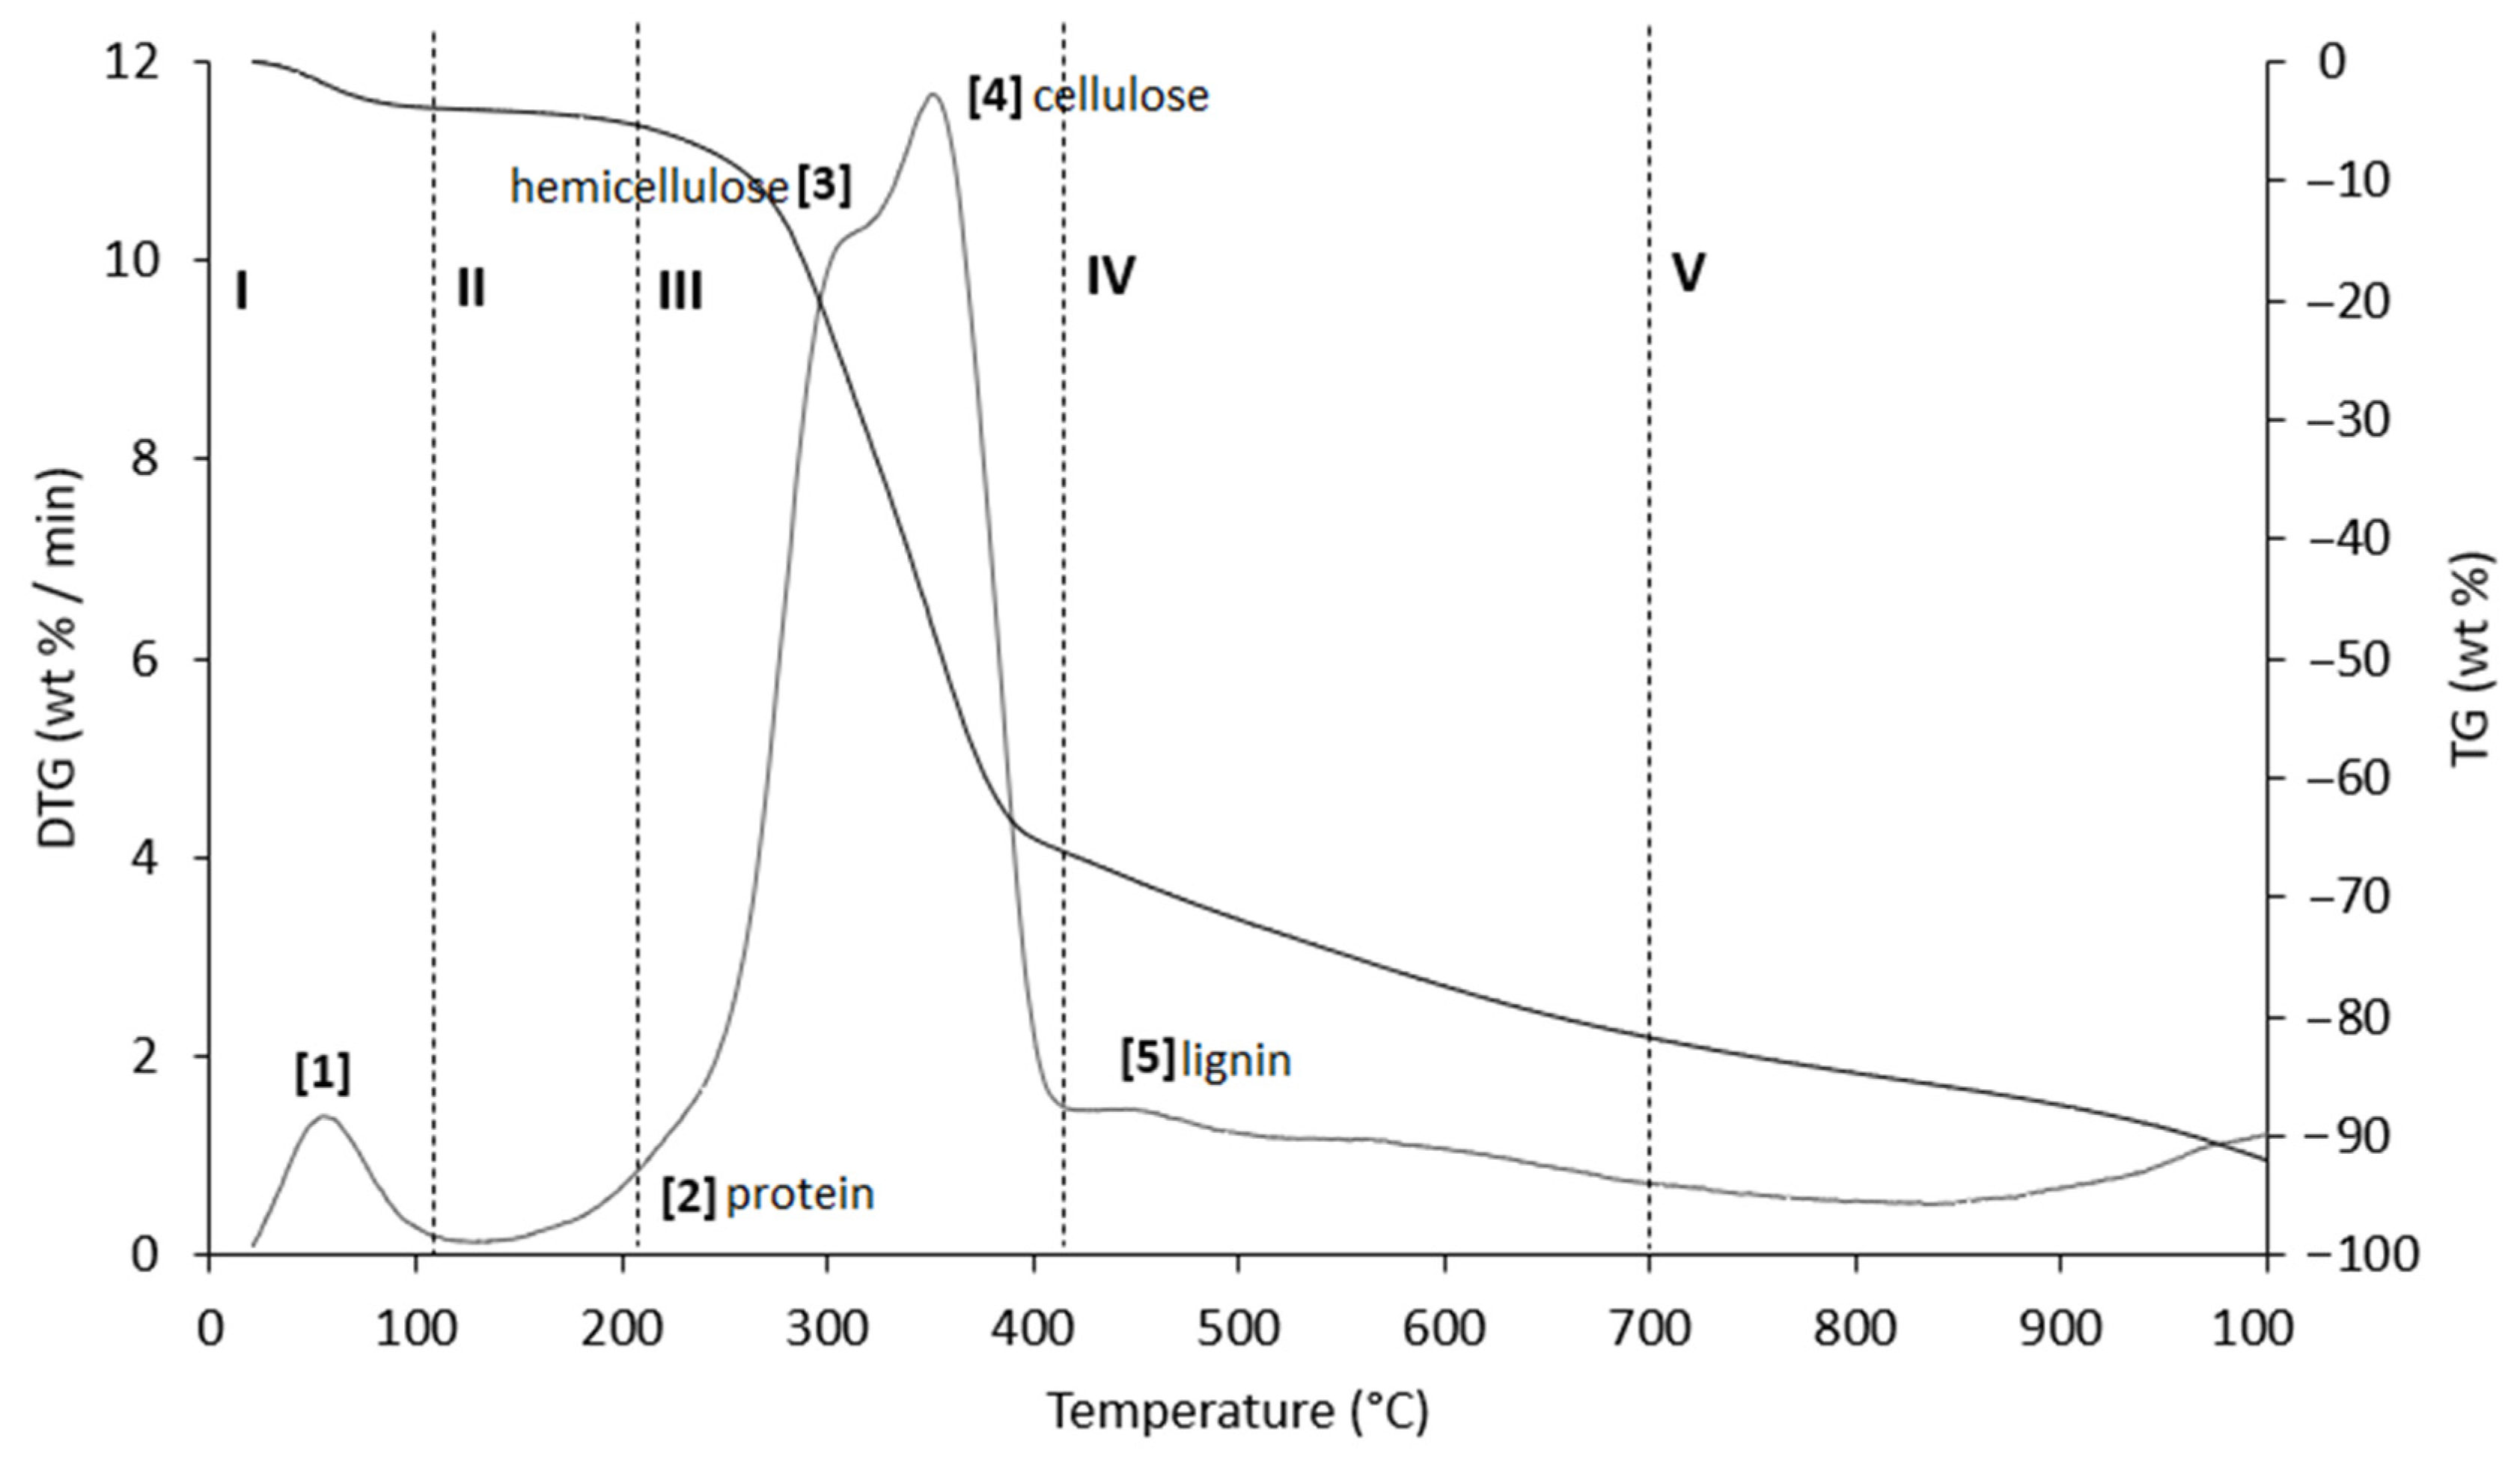
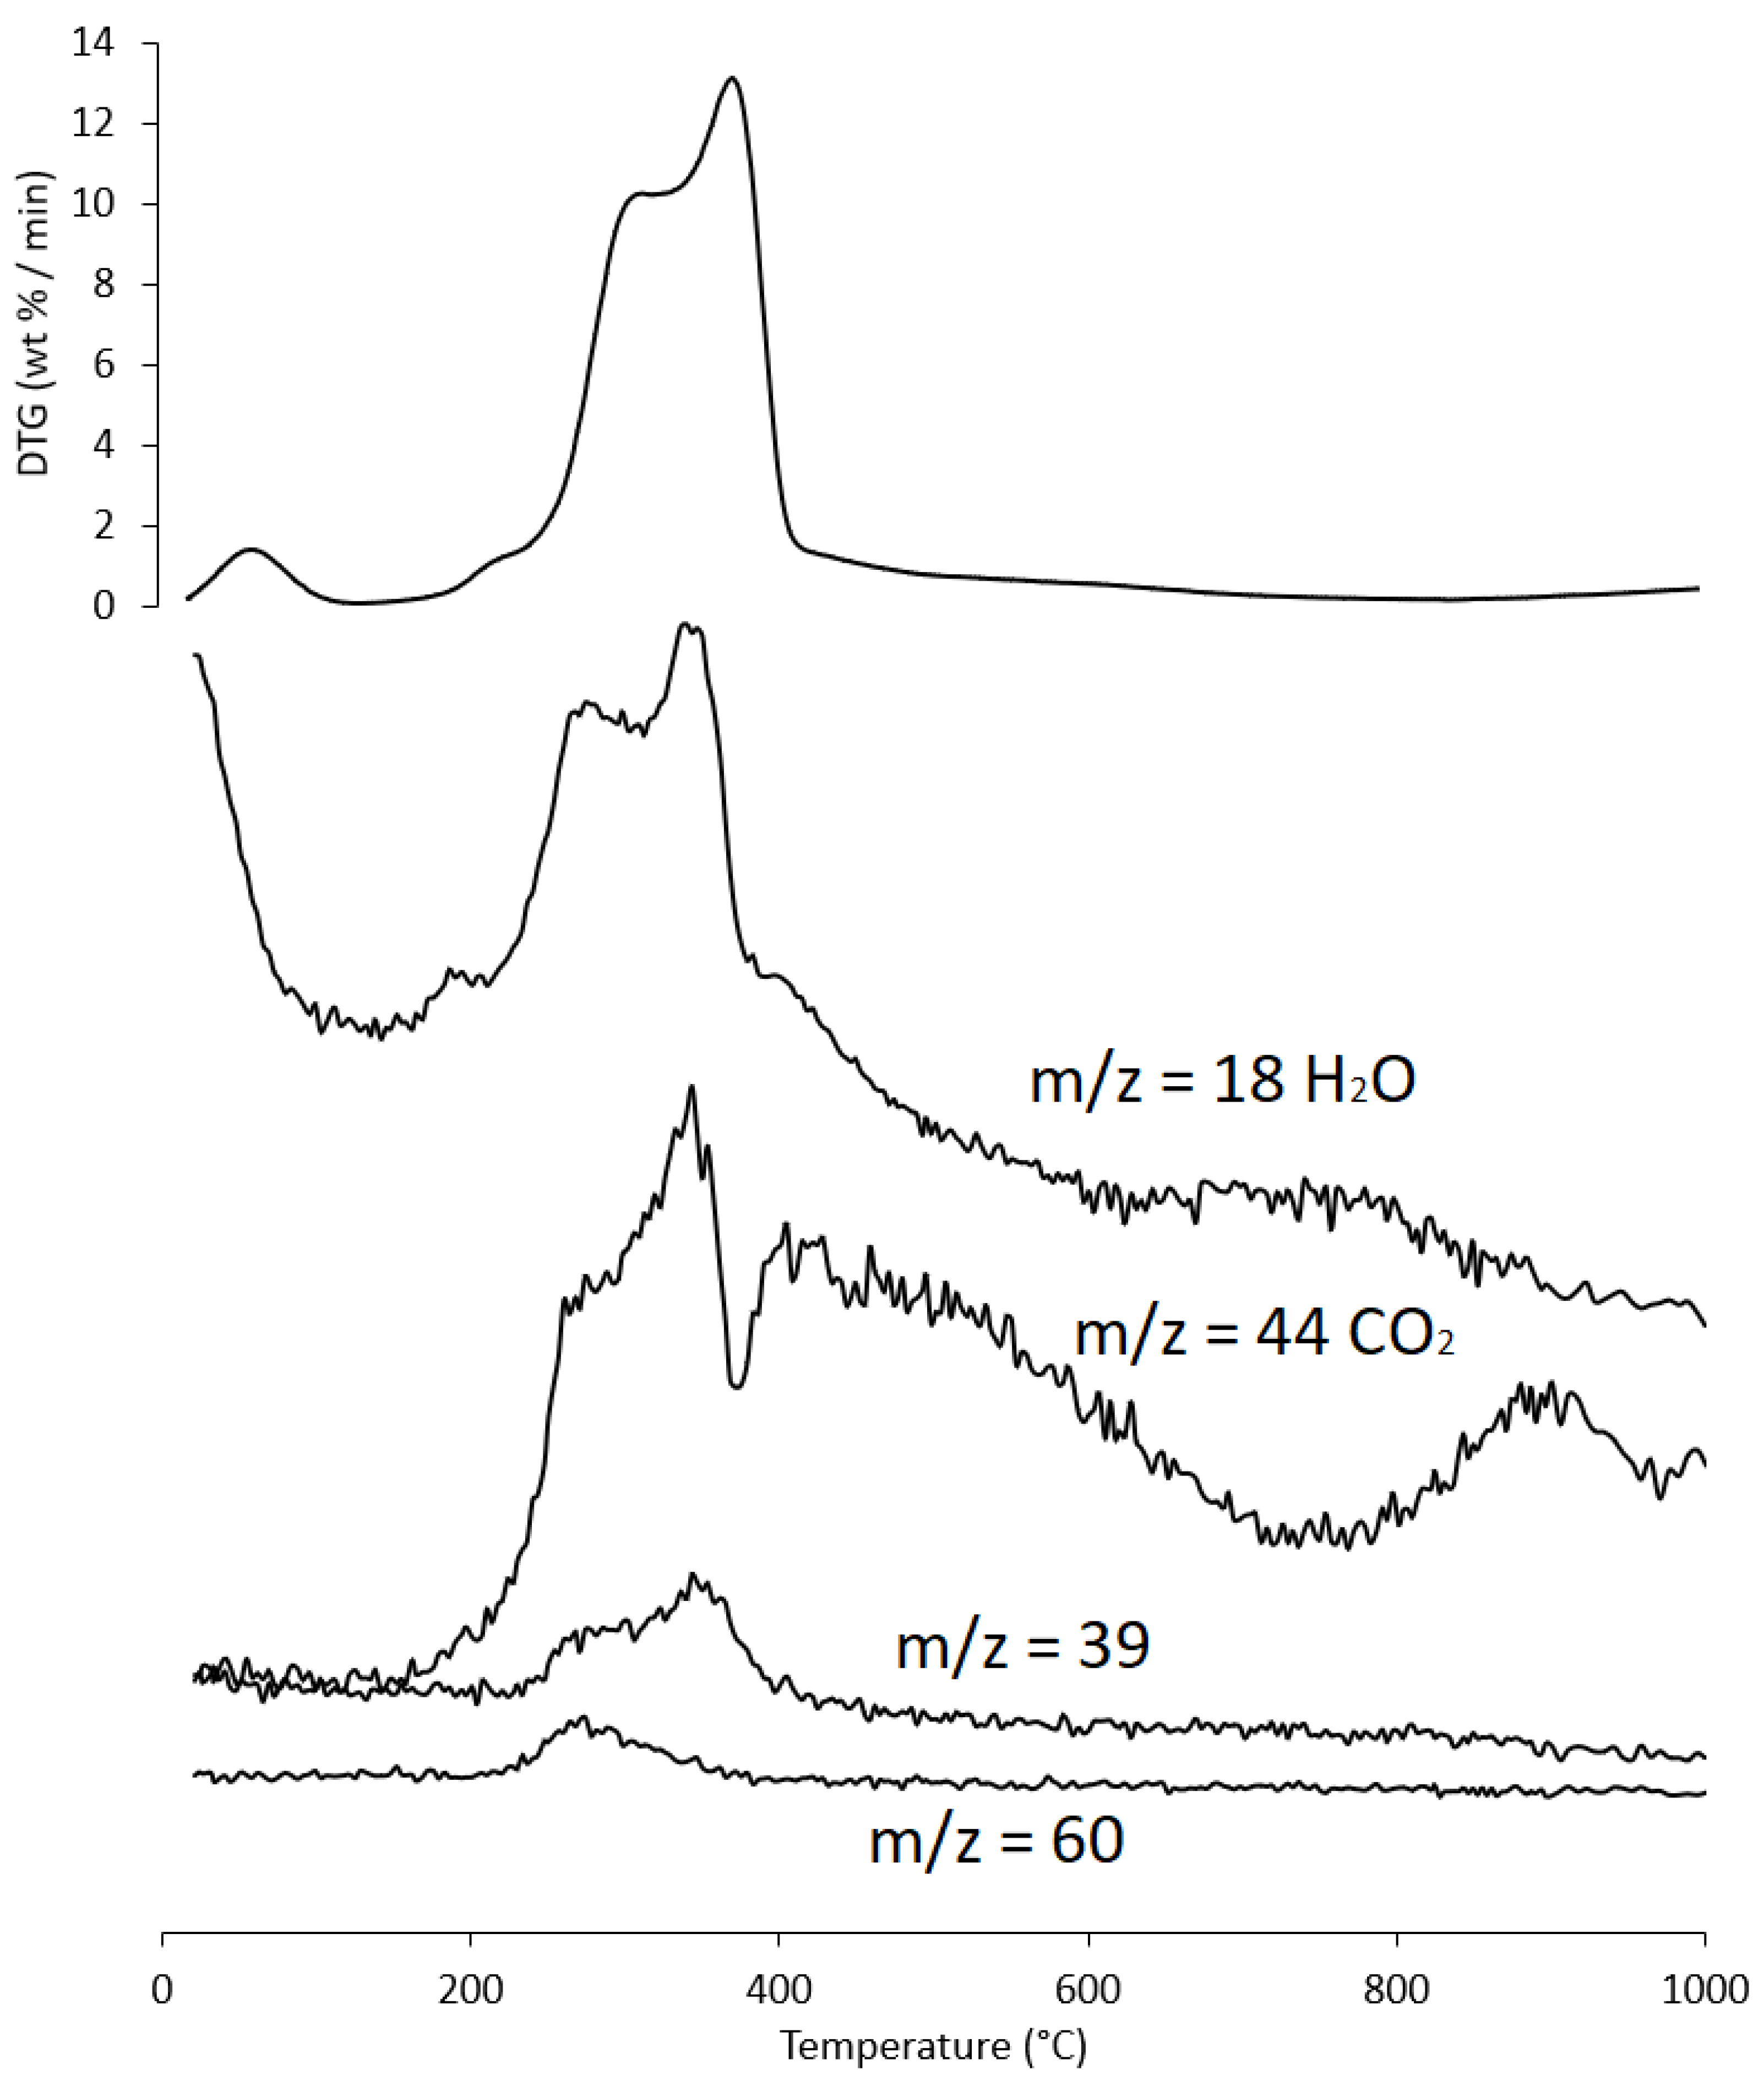
3.3. TG-MS-EGA Analysis

Fruit shells are primarily composed of lignocellulosic material. TG-MS-EGA analysis allows us to obtain information about the different degradation processes involving all constituents, which occur in defined thermal ranges identifiable in the thermogram. Materials with complex compositions give rise to different degradative reactions that can occur simultaneously, and the thermogram profile is the sum of the various contributions. In these cases, deconvolution and interpretation of the signals are not particularly easy, especially if different processes lead to the formation of the same reaction products, such as H2O and CO2. For effective interpretation of thermograms, the entire temperature range is usually divided into thermal regions of different sizes and characteristics, as shown in Table 5. Furthermore, Table 5 shows some thermal windows or subdomains of the regions where particular deformations of the TG/DTG profiles are observed, corresponding to specific behaviors due to some degradation processes of the studied samples.
Table 3 shows that ~90% of AS, PS, and PlS consisted of cellulose, hemicellulose, and lignin. Therefore, the TG-MS-EGA analysis showed the thermal steps leading to the degradation of these three fractions. For this reason, the evolution of some analytes characteristic of the degradation of hemicellulose and cellulose (i.e., acetic acid, m/z = 60; furfural, m/z = 96 and 39 for its fragment C3H3+) and lignin (i.e., phenol, m/z = 98; and vanillin m/z = 151), was evaluated [56]. This analysis allows for better differentiation of the thermal processes and better identification of the process temperature range that involves every component of the matrix. Unfortunately, no significant results have been obtained regarding the evolution of the emitted gases phenol and vanillin, which will not be reported below.
The result of the TG, together with its first derivative (DTG), runs in inert atmosphere (He) as shown in Figure 6, Figure 7 and Figure 8, and the related quantitative considerations are summarized in Table 5. For each thermogram, a summary table is provided (Table 6, Table 7 and Table 8), that collects the representative values of the TG/DTG profile.
The thermograms are divided into five regions (I, II, III, IV, and V), each representing the behavior of the samples following specific processes. Before examining the TG/DTG curves relating to the three nut-shell samples, it must be emphasized that the separation limits of the various regions are not rigidly identified with values of T/°C in an absolute way. Conversely, these are limits with a mobile index because the material fractions that undergo thermally activated processes can produce experimental evidence typical of the sample rather than of the type of matrix. Therefore, any attempt to generalize the thermal intervals of each region could lead to a speculative investigation, which is incompatible with the inspiring criteria of this study.
Region I, which covers a temperature range up to ~120 °C, is attributed to the removal of moisture and particularly volatile organic compounds (VOCs). The mass loss in this thermal step was greater for PS (Δm% = −4.2%), followed by PlS (Δm% = −3.8%) and AS (Δm% = −2.8%). Within this region, other thermally activated processes occur without mass loss, such as protein denaturation by unfolding [57,58].
Region II, which covers the temperature range from ~120 °C to ~215 °C, concerns the mass loss related to bound water, i.e., water typically retained by the inorganic fraction, such as the crystallization of mineral salt water. In this region, semi-volatile compounds with medium-low vapor pressure (SVOCs), which are present in the initial matrix or formed during the heating phase, are completely removed. The removal of structural water begins at 160 °C, following condensation reactions of the -OH groups mainly present in simple non-cellulosic carbohydrates [59]. The formation and removal of the reaction water passes through the entire thermogram up to and including region IV. Therefore, near the upper-temperature limit (~180 °C), free amino acids begin to undergo thermal degradation [60], while proteins persist up to ~200–220 °C. Thus, the processes occurring in this region suggest that the chemical structure of the biomass begins to destabilize, partly depolymerize, and plasticize.
Region III, in the temperature range from ~215 °C to ~423 °C, is the main pyrolysis window, where structural decay reactions of proteins (~240 °C), hemicellulose (~300 °C) [61,62], and cellulose (~370 °C) [57,61,63] take place. This was confirmed by the emission of acetic acid and furfural in this thermal window, as shown in Figure 9. These analytes are formed by the thermal degradation of cellulose and hemicellulose, as reported in several studies [56,64,65].
Region IV begins at ~413 °C and extends up to ~695 °C. In this thermal window, the gradual mass decrease is mainly due to the slow pyrolysis of the lignin fraction [66], which is associated with the sample vitrification and volatilization of carbon microparticles. The additional small mass loss can be attributed to the thermal decomposition of carbonaceous matter (biochar), which is mostly related to the hemicellulose fraction [67], although lignin components can also degrade [68].
In region V, above ~700 °C, up to the final temperature (1000 °C), the last residues of biomass degradation can be observed. This is the typical carbon pyrolysis window with the thermal decomposition of low volatile matter such as carbon fragments C20–C40 in the presence of mineral ash. This thermal process was confirmed by the evolution profile of CO2 (Figure 9), where an increase in the signal occurred between 800 °C and 1000 °C. The TG/DTG profiles of PS, AS, and PlS are typical of lignocellulosic raw materials, highlighting the contents of hemicellulose, cellulose, and lignin. This observation was confirmed by the proximate composition analysis (Section 2.1.2, Table 3).
As an example, the evolution of gases is reported below (Figure 9) for only one sample (PS), as the results were almost similar for the three matrices.

3.4. Density and Compressive Strength of the Lime-Based Concrete

Lightweight concrete can be classified according to its density, which normally ranges from 320 to 1920 kg/m3 according to the ACI Committee 213 Guide for Structural Lightweight Aggregate Concrete [69]. The classification of concrete according to density provides three groups of materials: (i) low-density concretes (300–800 kg/m3); (ii) moderate-strength concretes (800–1350 kg/m3); (iii) structural concretes (1350–1920 kg/m3) [70]. These three classes are also associated with specific strength range: 0.7–2.0 MPa, 7–14 MPa, and 17–63 MPa, respectively [70]. Density is one of the most important variables in concrete design, as compressive strength depends on it [71]. The reduction of concrete density implies the increment of its porosity, which is achieved by the direct replacement of normal-weight aggregates with LWAs.
The density data obtained are collected in Table 9.
All the samples are in the density range relating to moderate-strength lightweight concretes. As expected, the PSC has lower density values, as PS has a lower bulk density and specific gravity than AS and PlS. As observed by the SEM analysis, PS has a high porosity, AS low, and PlS intermediate between the two. The porosity of an aggregate significantly defines concrete density, as it affects both the porosity of the concrete itself and allows it to trap more air inside. Furthermore, some studies reported that the aggregate shape affects concrete density. In fact, the flaky shape easily traps air inside the concrete, increasing its porosity and consequently reducing its density. This phenomenon has been observed in concrete containing seashells [72], peach shells [38], and recycled polyolefin waste [73]. In particular, irregular shapes hinder the complete compaction of concrete, thus contributing to higher air content. In addition to this, there is also trapped air due to the high porosity of LWAs. Furthermore, in these studies, it is reported that the organic matter content is also able to increase the air inclusion in the concrete. Moreover, the extremely irregular shape of the aggregates leads to a difficult compaction of concrete, which leads inevitably to an increase in the occluded air [35]. This decrease in density, however, involves the reduction of the compressive strength [74], as explained below.
It is also important to underline that the use of lime as a binder allows it to obtain lower density values when compared with specimens prepared with similar lightweight aggregates [36,37,38,39], because of its lower specific gravity and bulk density. This is confirmed by the higher density values observed in concrete-containing specimens (Table 5).
The results of the compressive strength tests at 28 and 56 days for the concrete specimens are shown in Table 10.
The compressive strength of the specimens prepared with the cement-free mixture is less than 3 MPa. This value is too low to allow the material to fall into the category of moderate-strength concretes. At the same time, the density value of these specimens is too high for them to be considered “low-densities concretes”. However, not falling into a specific category does not preclude possible applications. For example, non-structural mortar beds for wooden floors have larger density allowances (1400–1600 kg/m3) and low strength requirements [17]. Compressive strength between 1 and 2 MPa is recommended in this case. This is a clear example of how depending on the specific application to be assigned to a material, specific ranges of density, and compressive strength are required. Specimens prepared with the cement-containing mixture “b” fall perfectly into the category “moderate strength concrete”, as they have a density between 800 and 1350 kg/m3 and a compressive strength exceeding 3.4 MPa. The addition of cement, even if in a small percentage, entails a significant improvement in mechanical properties and little compromises the density value, slightly greater than lime-based concrete. Moderate strength lightweight concrete is a versatile material that can be used for various purposes in construction. One of its most useful applications is as a non-structural filler for thermal and acoustic insulation. Non-structural infills are materials that do not bear any significant weight or load in a building but provide important functions such as insulation. One benefit of lightweight moderate-strength concrete is its relative ease of installation and transport, owing to its relatively low weight. This can be particularly advantageous in situations where access to the construction site is limited or there are restrictions on the use of heavy machinery.
Several studies in the literature demonstrated that the compressive strength of concrete is mainly affected by the properties and volume content of aggregate [75,76]. LWAs are also relatively weak if compared with normal-weight coarse aggregates, and their strength is an additional limiting factor affecting concrete strength [77]. As previously mentioned, the most important characteristic of LWAs is its internal porosity, which results in a lower density and higher water absorption. These factors adversely affect the compressive strength and making concrete less compact and porous. In particular, the greater water absorption by aggregates leads to greater porosity of concrete [78]. This results in lower density and lower compressive strength. PS showed increased water absorption, as explained in Section 3.1, due to the increased cellulose content and higher porosity. AS, on the other hand, having greater lignin content, a hydrophobic polymer, and free of surface porosity showed lower water absorption. These observations are in line with the values given in Table 6: PSC specimens have a lower strength, given the greater porosity of the aggregates. On the contrary, those ASC show the highest values, while PlSC intermediate ones.

3.5. Thermal Insulating Properties

Thermal conductivity is a fundamental parameter in the design and application of thermal-insulating lightweight concrete. These materials are becoming important in the context of the climate crisis. The development of energy efficiency strategies is increasingly being studied since the design of energy-efficient buildings is crucial for the realization of a sustainable future [79]. Room air conditioning, ventilation, and occupant comfort account for 29 of CO2 emissions from the building sector. By increasing the energy efficiency of buildings, also using thermal insulation materials, it is possible to reduce consumption and reduce the environmental impact and CO2 emissions significantly [80,81].
Several factors affect the thermal properties of concrete: type and content of aggregates, air voids content, pore size distribution and geometry, moisture content, w/b ratio, and types of admixtures [82]. In particular, the thermal conductivity of conventional building materials is inversely proportional to the porosity ratio. This trend is due to the relatively low thermal conduction of air (0.025 W/mK at room temperature and free of convection) and the interfaces promoted by the pores. Microstructural characteristics are thus critical factors for the consequent thermal conductivity of concrete.
The results are collected in Table 11.
PSC has a lower thermal conductivity, due to the highly porous structure of the lightweight aggregate and the consequent high porosity of the concrete. Generally, low-compaction concrete has better thermal insulation properties because more air bubbles are carried into the concrete during the mixing. Consequently, the thermal insulation properties improve with increasing porosity of both the lightweight aggregate and the related concrete. For the same reason, there is a significative correlation between concrete density and its thermal conductivity. Lightweight aggregates change density by forming voids, incorporating more air inside the concrete. AS, being practically porosity-free, is an aggregate that does not involve a significant inclusion of air, and therefore, does not provide a significant decrease in thermal conductivity. The addition of cement (mixture b) results in better compactness of the samples and a consequent worsening of the thermal insulation properties. This trend is in agreement with the observation reported in the literature, which suggests that the thermal conductivity of concrete decreases as its density decreases [83].
Moderate-strength lightweight concrete is known to have a thermal conductivity ranging from 0.2 to 0.6 W/mK [84]. The values in Table 8 indicate that all the concretes obtained fall within this range. Notably, some of these materials, specifically those produced using mixture “a” consisting of PS and PlS, exhibit even lower thermal conductivities, indicating enhanced thermal insulation properties. In general, all the materials obtained, having reduced thermal conductivity, have a marked potential for application as non-structural fillers to improve energy savings in buildings, thus improving environmental sustainability.

4. Conclusions

The potential of peach, plum, and apricot shells as lightweight aggregates was evaluated. The TG/DTA profile is typical of lignocellulosic material, confirming the proximal analysis. The use of lime as the main binder allowed it to obtain more eco-friendly building materials, both because it is more ecological than cement, and because it gives particularly favorable thermal insulation properties due to its greater porosity. PS, AS and PlS prepared several specimens of non-structural lightweight concrete. The specimens containing only lime as binder had an oven-dry density between 1000 and 1200 kg/m3, a low 28-day compressive strength (<3 MPa), and low thermal conductivity values. PSC had lower conductivity and density values, and this is mainly due to the high porosity of PS highlighted by SEM analysis. ASC instead showed the highest values and is practically free of porosity. PlSC showed intermediate characteristics, which reflects the reduced porosity content of PlS. In addition, PS showed greater water absorption, probably due to the higher content of cellulose. This parameter greatly affects the chemical–physical characteristics of concrete, leading to a worsening of compactness, the reduction of density, the formation of greater voids, and consequently the lowering of thermal conductivity. The addition of cement greatly improves the mechanical properties but negatively affects thermal conductivity.
This study showed that there is a feasibility of application of these agro-industrial wastes, which can, therefore, be reused and valorized, reducing dependence on natural raw materials.

Author Contributions

Conceptualization, V.D. and A.M.; methodology, V.D. and M.M.; software, V.D., S.P. and M.S.; validation, L.T., S.P., V.D. and A.M.; formal analysis, V.D.; investigation, V.D., L.B. and M.M.; resources, L.T. and S.P.; data curation, V.D., M.M. and M.S.; writing—original draft preparation, V.D. and L.B.; writing—review and editing, A.M. and L.T.; visualization, V.D.; supervision, L.T. and S.P.; project administration, V.D.; funding acquisition, V.D. and L.T. All authors have read and agreed to the published version of the manuscript.

Funding

This research received no external funding.

Institutional Review Board Statement

Not applicable.

Informed Consent Statement

Not applicable.

Data Availability Statement

Not applicable.

Conflicts of Interest

The authors declare no conflict of interest.

References

  1. Dulias, R. The Impact of Mining on the Landscape: A Study of the Upper Silesian Coal Basin in Poland, 1st ed.; Springer International Publishing: Cham, Switzerland, 2016. [Google Scholar]
  2. Arendt, R.; Bach, V.; Finkbeiner, M. The Global Environmental Costs of Mining and Processing Abiotic Raw Materials and Their Geographic Distribution. J. Clean. Prod. 2022, 361, 132232. [Google Scholar] [CrossRef]
  3. Krausmann, F.; Lauk, C.; Haas, W.; Wiedenhofer, D. From Resource Extraction to Outflows of Wastes and Emissions: The Socioeconomic Metabolism of the Global Economy, 1900–2015. Glob. Environ. Change 2018, 52, 131–140. [Google Scholar] [CrossRef]
  4. Benton, D.; Hazell, J. Resource Resilient UK: A Report from the Circular Economy Task Force; Green Alliance: London, UK, 2013; Available online: https://green-alliance.org.uk/wp-content/uploads/2021/11/Resource-resilient-UK.pdf (accessed on 25 November 2022).
  5. Ecorys Mapping Resurce Prices: The Past and the Future; Ecorys: Rotterdam, The Netherlands, 2012.
  6. MacArthur Foundation; McKinsey & Company. Towards the Circular Economy: Accelerating the Scale-Up Across Global Supply Chains. Available online: http://www3.weforum.org/docs/WEF_ENV_TowardsCircularEconomy_Report_2014.pdf (accessed on 25 November 2022).
  7. Pratt, K.; Lenaghan, M. The Carbon Impacts of the Circular Economy Summary Report; Zero Waste Scotland: Stirling, UK, 2015. [Google Scholar]
  8. EEA (European Environment Agency). Circular Economy in Europe Developing the Knowledge Base; Eur. Environ. Agency: Copenhagen, Denmark, 2016. [Google Scholar]
  9. Morgan, J.; Mitchell, P. Employment and the Circular Economy: Job Creation in a More Resource Efficient Britain; Green Alliance: London, UK, 2015; Available online: http://www.green-alliance.org.uk/resources/Employment (accessed on 26 November 2022).
  10. Spence, R.; Mulligan, H. Sustainable Development and the Construction Industry. Habitat Int. 1995, 19, 279–292. [Google Scholar] [CrossRef]
  11. Curwell, S.; Cooper, I. The Implications of Urban Sustainability. Build. Res. Inf. 1998, 26, 17–28. [Google Scholar] [CrossRef]
  12. Wieser, A.A.; Scherz, M.; Maier, S.; Passer, A.; Kreiner, H. Implementation of Sustainable Development Goals in Construction Industry—A Systemic Consideration of Synergies and Trade-Offs. IOP Conf. Ser. Earth Environ. Sci. 2019, 323, 012177. [Google Scholar] [CrossRef]
  13. UN General Assembly. Transforming Our World: The 2030 Agenda for Sustainable Development; A/RES/70/1; United Nations: New York, NY, USA, 2015. [Google Scholar]
  14. Peris Mora, E. Life Cycle, Sustainability and the Transcendent Quality of Building Materials. Build. Environ. 2007, 42, 1329–1334. [Google Scholar] [CrossRef]
  15. Mehta, K.P. Reducing the Environmental Impact of Concrete. Concr. Int. 2001, 23, 61–66. [Google Scholar]
  16. Real, S.; Gomes, M.G.; Moret Rodrigues, A.; Bogas, J.A. Contribution of Structural Lightweight Aggregate Concrete to the Reduction of Thermal Bridging Effect in Buildings. Constr. Build. Mater. 2016, 121, 460–470. [Google Scholar] [CrossRef]
  17. Sala, E.; Zanotti, C.; Passoni, C.; Marini, A. Lightweight Natural Lime Composites for Rehabilitation of Historical Heritage. Constr. Build. Mater. 2016, 125, 81–93. [Google Scholar] [CrossRef]
  18. Carran, D.; Hughes, J.; Leslie, A.; Kennedy, C. A Short History of the Use of Lime as a Building Material Beyond Europe and North America. Int. J. Archit. Herit. 2012, 6, 117–146. [Google Scholar] [CrossRef]
  19. Elert, K.; Rodriguez-Navarro, C.; Pardo, E.S.; Hansen, E.; Cazalla, O. Lime Mortars for the Conservation of Historic Buildings. Stud. Conserv. 2002, 47, 62–75. [Google Scholar] [CrossRef]
  20. Boynton, R.S. Chemistry and Technology of Lime and Limestone, 2nd ed.; John Wiley & Sons, Inc.: New York, NY, USA, 1980. [Google Scholar]
  21. Saberian, M.; Jahandari, S.; Li, J.; Zivari, F. Effect of Curing, Capillary Action, and Groundwater Level Increment on Geotechnical Properties of Lime Concrete: Experimental and Prediction Studies. J. Rock Mech. Geotech. Eng. 2017, 9, 638–647. [Google Scholar] [CrossRef]
  22. Bevan, R.; Woolley, T. Hemp Lime Construction; IHS/BRE Press: Bracknell, Berkshire, UK, 2008. [Google Scholar]
  23. Pelentir, N.; Block, J.M.; Monteiro Fritz, A.R.; Reginatto, V.; Amante, E.R. Production and Chemical Characterization of Peach (Prunus Persica) Kernel Flour: Characterization of Peach Kernel Flour. J. Food Process Eng. 2011, 34, 1253–1265. [Google Scholar] [CrossRef]
  24. Rodriguez, C.E.; Bustamante, C.A.; Budde, C.O.; Müller, G.L.; Drincovich, M.F.; Lara, M.V. Peach Fruit Development: A Comparative Proteomic Study Between Endocarp and Mesocarp at Very Early Stages Underpins the Main Differential Biochemical Processes Between These Tissues. Front. Plant Sci. 2019, 10, 715. [Google Scholar] [CrossRef] [PubMed] [Green Version]
  25. Noratto, G.; Porter, W.; Byrne, D.; Cisneros-Zevallos, L. Identifying Peach and Plum Polyphenols with Chemopreventive Potential against Estrogen-Independent Breast Cancer Cells. J. Agric. Food Chem. 2009, 57, 5219–5226. [Google Scholar] [CrossRef] [PubMed]
  26. Vizzotto, M.; Cisneros-Zevallos, L.; Byrne, D.H.; Ramming, D.W.; Okie, W.R. Large Variation Found in the Phytochemical and Antioxidant Activity of Peach and Plum Germplasm. J. Am. Soc. Hortic. Sci. 2007, 132, 334–340. [Google Scholar] [CrossRef] [Green Version]
  27. Chun, O.K.; Kim, D.-O.; Moon, H.Y.; Kang, H.G.; Lee, C.Y. Contribution of Individual Polyphenolics to Total Antioxidant Capacity of Plums. J. Agric. Food Chem. 2003, 51, 7240–7245. [Google Scholar] [CrossRef]
  28. Gil, M.I.; Tomás-Barberán, F.A.; Hess-Pierce, B.; Kader, A.A. Antioxidant Capacities, Phenolic Compounds, Carotenoids, and Vitamin C Contents of Nectarine, Peach, and Plum Cultivars from California. J. Agric. Food Chem. 2002, 50, 4976–4982. [Google Scholar] [CrossRef] [PubMed]
  29. Radi, M.; Mahrouz, M.; Jaouad, A.; Tacchini, M.; Aubert, S.; Hugues, M.; Amiot, M.J. Phenolic Composition, Browning Susceptibility, and Carotenoid Content of Several Apricot Cultivars at Maturity. HortScience 1997, 32, 1087–1091. [Google Scholar] [CrossRef] [Green Version]
  30. Plazzotta, S.; Ibarz, R.; Manzocco, L.; Martín-Belloso, O. Optimizing the Antioxidant Biocompound Recovery from Peach Waste Extraction Assisted by Ultrasounds or Microwaves. Ultrason. Sonochem. 2020, 63, 104954. [Google Scholar] [CrossRef] [PubMed]
  31. Wechsler, A.; Molina, J.; Cayumil, R.; Núñez Decap, M.; Ballerini-Arroyo, A. Some Properties of Composite Panels Manufactured from Peach (Prunus Persica) Pits and Polypropylene. Compos. Part B Eng. 2019, 175, 107152. [Google Scholar] [CrossRef]
  32. Kambis, A.D.; Levine, J.S. Biomass Burning and the Production of Carbon Dioxide: Numerical Study. In Biomass Burning and Global Change Volume 1: Remote Sensing, Modeling and Inventory Development, and Biomass Burning in Africa; MIT Press: Cambridge, MA, USA, 1996. [Google Scholar]
  33. Duc, P.A.; Dharanipriya, P.; Velmurugan, B.K.; Shanmugavadivu, M. Groundnut Shell -a Beneficial Bio-Waste. Biocatal. Agric. Biotechnol. 2019, 20, 101206. [Google Scholar] [CrossRef]
  34. Zheng, W.; Phoungthong, K.; Lü, F.; Shao, L.-M.; He, P.-J. Evaluation of a Classification Method for Biodegradable Solid Wastes Using Anaerobic Degradation Parameters. Waste Manag. 2013, 33, 2632–2640. [Google Scholar] [CrossRef] [PubMed] [Green Version]
  35. Traore, Y.B.; Messan, A.; Hannawi, K.; Gerard, J.; Prince, W.; Tsobnang, F. Effect of Oil Palm Shell Treatment on the Physical and Mechanical Properties of Lightweight Concrete. Constr. Build. Mater. 2018, 161, 452–460. [Google Scholar] [CrossRef]
  36. Wu, F.; Liu, C.; Zhang, L.; Lu, Y.; Ma, Y. Comparative Study of Carbonized Peach Shell and Carbonized Apricot Shell to Improve the Performance of Lightweight Concrete. Constr. Build. Mater. 2018, 188, 758–771. [Google Scholar] [CrossRef]
  37. Adefemi, A.; Nensok, M.; Kaase, E.T.; Wuna, I.A. Exploratory Study of Date Seed as Coarse Aggregate in Concrete Production. Civ. Environ. Res. 2013, 3, 85–92. [Google Scholar]
  38. Wu, F.; Liu, C.; Sun, W.; Ma, Y.; Zhang, L. Effect of Peach Shell as Lightweight Aggregate on Mechanics and Creep Properties of Concrete. Eur. J. Environ. Civ. Eng. 2020, 24, 2534–2552. [Google Scholar] [CrossRef]
  39. Wu, F.; Liu, C.; Sun, W.; Zhang, L. Mechanical Properties of Bio-Based Concrete Containing Blended Peach Shell and Apricot Shell Waste. Mater. Tehnol. 2018, 52, 645–651. [Google Scholar] [CrossRef]
  40. Wu, F.; Liu, C.; Sun, W.; Zhang, L.; Ma, Y. Mechanical and Creep Properties of Concrete Containing Apricot Shell Lightweight Aggregate. KSCE J. Civ. Eng. 2019, 23, 2948–2957. [Google Scholar] [CrossRef]
  41. Ahmad, J.; Zaid, O.; Aslam, F.; Shahzaib, M.; Ullah, R.; Alabduljabbar, H.; Khedher, K.M. A Study on the Mechanical Characteristics of Glass and Nylon Fiber Reinforced Peach Shell Lightweight Concrete. Materials 2021, 14, 4488. [Google Scholar] [CrossRef]
  42. Blasi, C.D.; Galgano, A.; Branca, C. Exothermic Events of Nut Shell and Fruit Stone Pyrolysis. ACS Sustain. Chem. Eng. 2019, 7, 9035–9049. [Google Scholar] [CrossRef]
  43. Wei, L.; Xu, S.; Zhang, L.; Zhang, H.; Liu, C.; Zhu, H.; Liu, S. Characteristics of Fast Pyrolysis of Biomass in a Free Fall Reactor. Fuel Process. Technol. 2006, 87, 863–871. [Google Scholar] [CrossRef]
  44. Cagnon, B.; Py, X.; Guillot, A.; Stoeckli, F.; Chambat, G. Contributions of Hemicellulose, Cellulose and Lignin to the Mass and the Porous Properties of Chars and Steam Activated Carbons from Various Lignocellulosic Precursors. Bioresour. Technol. 2009, 100, 292–298. [Google Scholar] [CrossRef] [Green Version]
  45. Associataion of Official Analytical Chemist. AOAC Official Methods of Analysis of the Association of Official’s Analytical Chemists, 14th ed.; Associataion of Official Analytical Chemist: Washington, DC, USA, 1990; pp. 223–225, 992–995. [Google Scholar]
  46. Maletti, L.; D’Eusanio, V.; Durante, C.; Marchetti, A.; Tassi, L. VOCs Analysis of Three Different Cultivars of Watermelon (Citrullus lanatus L.) Whole Dietary Fiber. Molecules 2022, 27, 8747. [Google Scholar] [CrossRef] [PubMed]
  47. ASTM C567; Standard Test Method for Determining Density of Structural Lightweight Concrete. ASTM International: West Conshohocken, PA, USA, 2020. [CrossRef]
  48. European Committee for Concrete (CEB); International Federation for Prestressing (FIP). Manual of Design and Technology, Lightweight Aggregate Concrete; Construction Press: Lancaster, UK, 1977. [Google Scholar]
  49. Palomar, I.; Barluenga, G.; Puentes, J. Lime–Cement Mortars for Coating with Improved Thermal and Acoustic Performance. Constr. Build. Mater. 2015, 75, 306–314. [Google Scholar] [CrossRef]
  50. Silva, L.M.; Ribeiro, R.A.; Labrincha, J.A.; Ferreira, V.M. Role of Lightweight Fillers on the Properties of a Mixed-Binder Mortar. Cem. Concr. Compos. 2010, 32, 19–24. [Google Scholar] [CrossRef]
  51. Lo, T.Y.; Tang, W.C.; Cui, H.Z. The Effects of Aggregate Properties on Lightweight Concrete. Build. Environ. 2007, 42, 3025–3029. [Google Scholar] [CrossRef]
  52. Mohamed, A.R.; Mohammadi, M.; Darzi, G.N. Preparation of Carbon Molecular Sieve from Lignocellulosic Biomass: A Review. Renew. Sustain. Energy Rev. 2010, 14, 1591–1599. [Google Scholar] [CrossRef]
  53. Bajpai, P. Wood and Fiber Fundamentals. In Biermann’s Handbook of Pulp and Paper; Elsevier: Amsterdam, The Netherlands, 2018. [Google Scholar]
  54. Watkins, D.; Nuruddin, M.; Hosur, M.; Tcherbi-Narteh, A.; Jeelani, S. Extraction and Characterization of Lignin from Different Biomass Resources. J. Mater. Res. Technol. 2015, 4, 26–32. [Google Scholar] [CrossRef] [Green Version]
  55. Carrott, P.J.M.; Carrott, M.R. Lignin—From Natural Adsorbent to Activated Carbon: A Review. Bioresour. Technol. 2007, 98, 2301–2312. [Google Scholar] [CrossRef]
  56. González Martínez, M.; Anca Couce, A.; Dupont, C.; da Silva Perez, D.; Thiéry, S.; Meyer, X.; Gourdon, C. Torrefaction of Cellulose, Hemicelluloses and Lignin Extracted from Woody and Agricultural Biomass in TGA-GC/MS: Linking Production Profiles of Volatile Species to Biomass Type and Macromolecular Composition. Ind. Crops Prod. 2022, 176, 114350. [Google Scholar] [CrossRef]
  57. Johnson, C.M. Differential Scanning Calorimetry as a Tool for Protein Folding and Stability. Arch. Biochem. Biophys. 2013, 531, 100–109. [Google Scholar] [CrossRef] [PubMed]
  58. Ojeda-Galván, H.J.; Hernández-Arteaga, A.C.; Rodríguez-Aranda, M.C.; Toro-Vazquez, J.F.; Cruz-González, N.; Ortíz-Chávez, S.; Comas-García, M.; Rodríguez, A.G.; Navarro-Contreras, H.R. Application of Raman Spectroscopy for the Determination of Proteins Denaturation and Amino Acids Decomposition Temperature. Spectrochim. Acta. A Mol. Biomol. Spectrosc. 2023, 285, 121941. [Google Scholar] [CrossRef] [PubMed]
  59. Şen, D.; Gökmen, V. Kinetic Modeling of Maillard and Caramelization Reactions in Sucrose-Rich and Low Moisture Foods Applied for Roasted Nuts and Seeds. Food Chem. 2022, 395, 133583. [Google Scholar] [CrossRef] [PubMed]
  60. Weiss, I.M.; Muth, C.; Drumm, R.; Kirchner, H.O.K. Thermal Decomposition of the Amino Acids Glycine, Cysteine, Aspartic Acid, Asparagine, Glutamic Acid, Glutamine, Arginine and Histidine. BMC Biophys. 2018, 11, 2. [Google Scholar] [CrossRef] [Green Version]
  61. Wang, S.; Dai, G.; Yang, H.; Luo, Z. Lignocellulosic Biomass Pyrolysis Mechanism: A State-of-the-Art Review. Prog. Energy Combust. Sci. 2017, 62, 33–86. [Google Scholar] [CrossRef]
  62. Salema, A.A.; Ting, R.M.W.; Shang, Y.K. Pyrolysis of Blend (Oil Palm Biomass and Sawdust) Biomass Using TG-MS. Bioresour. Technol. 2019, 274, 439–446. [Google Scholar] [CrossRef] [PubMed]
  63. Ding, Y.; Huang, B.; Li, K.; Du, W.; Lu, K.; Zhang, Y. Thermal Interaction Analysis of Isolated Hemicellulose and Cellulose by Kinetic Parameters during Biomass Pyrolysis. Energy 2020, 195, 117010. [Google Scholar] [CrossRef]
  64. Shen, D.K.; Gu, S. The Mechanism for Thermal Decomposition of Cellulose and Its Main Products. Bioresour. Technol. 2009, 100, 6496–6504. [Google Scholar] [CrossRef]
  65. Shen, D.K.; Gu, S.; Bridgwater, A.V. Study on the Pyrolytic Behaviour of Xylan-Based Hemicellulose Using TG–FTIR and Py–GC–FTIR. J. Anal. Appl. Pyrolysis 2010, 87, 199–206. [Google Scholar] [CrossRef] [Green Version]
  66. Yang, H.; Yan, R.; Chin, T.; Liang, D.T.; Chen, H.; Zheng, C. Thermogravimetric Analysis−Fourier Transform Infrared Analysis of Palm Oil Waste Pyrolysis. Energy Fuels 2004, 18, 1814–1821. [Google Scholar] [CrossRef]
  67. Zhao, C.; Jiang, E.; Chen, A. Volatile Production from Pyrolysis of Cellulose, Hemicellulose and Lignin. J. Energy Inst. 2017, 90, 902–913. [Google Scholar] [CrossRef]
  68. Yeo, J.Y.; Chin, B.L.F.; Tan, J.K.; Loh, Y.S. Comparative Studies on the Pyrolysis of Cellulose, Hemicellulose, and Lignin Based on Combined Kinetics. J. Energy Inst. 2019, 92, 27–37. [Google Scholar] [CrossRef]
  69. ACI Committee 213. Guide for Structural Lightwieght-Aggregate Concrete. J. Am. Concr. Inst. Proc. 1967, 64, 433–469. [Google Scholar]
  70. Chaipanich, A.; Chindaprasirt, P. The Properties and Durablity of Autoclaved Aerated Concrete Masonry Blocks. In Eco-Efficient Masonry Bricks and Blocks; Elsevier: Amsterdam, The Netherlands, 2015; pp. 215–230. [Google Scholar]
  71. Alengaram, U.J.; Muhit, B.A.A.; Jumaat, M.Z. bin Utilization of Oil Palm Kernel Shell as Lightweight Aggregate in Concrete—A Review. Constr. Build. Mater. 2013, 38, 161–172. [Google Scholar] [CrossRef]
  72. Martínez-García, C.; González-Fonteboa, B.; Martínez-Abella, F.; Carro- López, D. Performance of Mussel Shell as Aggregate in Plain Concrete. Constr. Build. Mater. 2017, 139, 570–583. [Google Scholar] [CrossRef]
  73. Colangelo, F.; Cioffi, R.; Liguori, B.; Iucolano, F. Recycled Polyolefins Waste as Aggregates for Lightweight Concrete. Compos. Part B Eng. 2016, 106, 234–241. [Google Scholar] [CrossRef]
  74. Pacheco Menor, M.C.; Serna Ros, P.; Macías García, A.; Arévalo Caballero, M.J. Granulated Cork with Bark Characterised as Environment-Friendly Lightweight Aggregate for Cement Based Materials. J. Clean. Prod. 2019, 229, 358–373. [Google Scholar] [CrossRef]
  75. Ünal, O.; Uygunoğlu, T.; Yildiz, A. Investigation of Properties of Low-Strength Lightweight Concrete for Thermal Insulation. Build. Environ. 2007, 42, 584–590. [Google Scholar] [CrossRef]
  76. Yang, C.-C.; Huang, R. A Two-Phase Model for Predicting the Compressive Strength of Concrete. Cem. Concr. Res. 1996, 26, 1567–1577. [Google Scholar] [CrossRef]
  77. Elastic Compatibility and the Behavior of Concrete. ACI J. Proc. 1986, 83, 10422. [CrossRef]
  78. Lo, T.Y.; Cui, H.Z.; Tang, W.C.; Leung, W.M. The Effect of Aggregate Absorption on Pore Area at Interfacial Zone of Lightweight Concrete. Constr. Build. Mater. 2008, 22, 623–628. [Google Scholar] [CrossRef]
  79. Raj, B.P.; Meena, C.S.; Agarwal, N.; Saini, L.; Hussain Khahro, S.; Subramaniam, U.; Ghosh, A. A Review on Numerical Approach to Achieve Building Energy Efficiency for Energy, Economy and Environment (3E) Benefit. Energies 2021, 14, 4487. [Google Scholar] [CrossRef]
  80. Kircher, K.; Shi, X.; Patil, S.; Zhang, K.M. Cleanroom Energy Efficiency Strategies: Modeling and Simulation. Energy Build. 2010, 42, 282–289. [Google Scholar] [CrossRef]
  81. Arkar, C.; Vidrih, B.; Medved, S. Efficiency of Free Cooling Using Latent Heat Storage Integrated into the Ventilation System of a Low Energy Building. Int. J. Refrig. 2007, 30, 134–143. [Google Scholar] [CrossRef]
  82. Asadi, I.; Shafigh, P.; Abu Hassan, Z.F.B.; Mahyuddin, N.B. Thermal Conductivity of ConcreteA Review. J. Build. Eng. 2018, 20, 81–93. [Google Scholar] [CrossRef]
  83. Cheboub, T.; Senhadji, Y.; Khelafi, H.; Escadeillas, G. Investigation of the Engineering Properties of Environmentally-Friendly Self-Compacting Lightweight Mortar Containing Olive Kernel Shells as Aggregate. J. Clean. Prod. 2020, 249, 119406. [Google Scholar] [CrossRef]
  84. Samson, G.; Phelipot-Mardelé, A.; Lanos, C. A Review of Thermomechanical Properties of Lightweight Concrete. Mag. Concr. Res. 2017, 69, 201–216. [Google Scholar] [CrossRef]
Figure 1. Crushed peach shells (PS, sx), crushed apricot shells (AS, centre), and crushed plum shells (PlS, sx).
Waste 01 00033 g001
Figure 2. SEM images of crushed peach shells (PS) at different enlargements.
Waste 01 00033 g002
Figure 3. SEM images of crushed apricot shells (AS) at ×500 (left) and ×1000 magnification (right).
Waste 01 00033 g003
Figure 4. SEM images of crushed plum shells (PlS) at ×500 (left) and ×1000 magnification (right).
Waste 01 00033 g004
Figure 5. SEM images of the micropores of PS (left) and PlS (right), 4000× magnification.
Waste 01 00033 g005
Figure 6. TG (black line) and DTG (grey line) curves of AS sample at heating rate of 20 °C/min in He atmosphere. Vertical dashed lines delimit the five thermal regions (I–V) described in the text. For the meaning of the numbers in parentheses, see Table 6.
Waste 01 00033 g006
Figure 7. TG (black line) and DTG (grey line) curves of PlS sample at heating rate of 20 °C/min in He atmosphere. Vertical dashed lines delimit the five thermal regions (I–V) described in the text. For the meaning of the numbers in parentheses, see Table 7.
Waste 01 00033 g007
Figure 8. TG (black line) and DTG (grey line) curves of PS sample at heating rate of 20 °C/min in He atmosphere. Vertical dashed lines delimit the five thermal regions (I–V) described in the text. For the meaning of the numbers in parentheses, see Table 8.
Waste 01 00033 g008
Figure 9. Evolution trend of H2O, CO2, furfural fragment C3H3+ (m/z = 39), and acetic acid (m/z = 60) during the heating of PS sample; for ease of comparison the DTG curve is also shown. Intensity of m/z is in arbitrary units.
Waste 01 00033 g009
Table 1. Physical and chemical properties of the binders.
Hydrated LimeCement 52.5
Chemical analysis (wt %)
SiO2-19.8
CaO75.6863.89
Al2O3-4.43
Fe2O3-3.08
SO3-3.77
MgO-1.02
Na2O-0.09
K2O-0.67
TiO2-0.18
Physical Properties
Bulk density (kg/m3)450770
Specific gravity (g/cm3)2.242.75
Compressive strength 7 days (N/mm2)-30
Compressive strength 28 days (N/mm2)-52.5
Table 2. Properties of coarse and fine aggregates were used in this study.
Physical PropertyCoarse AggregateFine Aggregate
PSASPlSSand
Particle size (mm)4.5–9.54.5–9.54.5–9.51
Specific gravity (kg/dm3)1.281.441.371.5
Bulk density (kg/m3)5566305911560
Water absorption (24 h) (%)15.210.912.61.1
ShapeFlakyFlakyFlakyTout-venant
PS = Peach Shells; AS = Apricot Shells; PlS = Plum Shells.
Table 3. Proximal chemical composition of nutshells from different Rosaceae fruits.
PSASPlS
Moisture content (%)4.2 ± 0.72.8 ± 0.43.8 ± 0.5
Ash (%)0.99 ± 0.21.12 ± 0.61.09 ± 0.6
* Lignin (%)41.751.449.5
* Hemicellulose (%)21.820.820.2
* Cellulose (%)23.822.423.2
C (%)47.7 ± 0.547.0 ± 0.547.3 ± 0.5
H (%)5.73 ± 0.106.13 ± 0.095.73 ± 0.09
N (%)0.19 ± 0.050.17 ± 0.040.36 ± 0.04
O (%) (from difference)45.3945.5845.52
Protein content (%)1.19 ± 0.101.06 ± 0.112.25 ± 0.11
Fat (%)0.09 ± 0.010.12 ± 0.020.11 ± 0.01
* Data taken from the literature [42,43,44]; PS = Peach Shells; AS = Apricot Shells; PlS = Plum Shells.
Table 4. Mix proportions of concrete (kg/m3).
SampleLimeCementSandLightweight Aggregatew/b Ratio *
PSC_a585-6253500.45
ASC_a585-6253500.45
PlSC_a585-6253500.45
PSC_b3901956253500.40
ASC_b3901956253500.40
PlSC_b3901956253500.40
* water-binder ratio.
Table 5. Representative values of TG/DTG profiles of Figure 6, Figure 7 and Figure 8 obtained in inert atmosphere (He).
RegionThermal WindowThermally Activated Processes
I30–120Removal of moisture and VOCs up to ~100 °C
II~120–210Removal of bound water, NH3 from protein denaturation, low-boiling VOCs, and loss of CO and CO2
III~210–260Shoulder related to protein degradation
~260–430Removal of reaction water, high-boiling VOCs and SVOCs, decarboxylation of acids with CO2 loss, degradation of polysaccharides, plasticization, and pseudo-vitrification of the sample
Removal of hydrocarbons, fat degradation, water of constitution, CO and CO2, and volatilization of other metabolites
IV~430–490Removal of reaction water, CO2, and other metabolites
~490–700Weak reactions related to slow volatilization of CO2, carbon residues, and other molecules
Removal of reaction water, CO and CO2, and other metabolites
V~700–1000Volatilization of carbon residues, probably C20–C40 fragments
Residual ashes at 1000 °CInorganic compounds and carbon residues
Table 6. Representative values of TG/DTG profiles of Figure 6 (AS sample), obtained in inert atmosphere (He).
RegionThermal StepToTmTcΔm%
I(1)3070.9120−2.8
II(2)120-261.7−3.4
III(3)261.7310.2332.5−29.2
(4)332.5377.4423.2−39.4
IV(5)423.2-489.3−4.0
489.3-700−5.0
V 700-1000−4.7
To = onset temperature (beginning of thermal step processes); Tm = maximum temperature for the largest mass loss rate; Tc = conclusion temperature (end of thermal step processes).
Table 7. Representative values of TG/DTG profiles of Figure 7 (PlS sample) obtained in inert atmosphere (He).
RegionThermal StepToTmTcΔm%
I(1)3066.7120−3.8
II(2)120220.4261.7−4.8
III(3)261.7314.7332.5−26.4
(4)332.5375.1423.2−36.4
IV(5)423.2-490−3.7
490-700−6.0
V 700-1000−4.0
To = onset temperature (beginning of thermal step processes); Tm = maximum temperature for the largest mass loss rate; Tc = conclusion temperature (end of thermal step processes).
Table 8. Representative values of TG/DTG profiles of Figure 8 (PS sample) obtained in inert atmosphere (He).
RegionThermal StepToTmTcΔm%
I(1)3064.2120−4.2
II(2)120-261.7−5.5
III(3)261.7304.9332.5−28.1
(4)332.5355.1423.2−29.2
IV(5)423.2465489.3−4.4
489.3-700−10.4
V 700-1000−10.2
To = onset temperature (beginning of thermal step processes); Tm = maximum temperature for the largest mass loss rate; Tc = conclusion temperature (end of thermal step processes).
Table 9. Demolded, air-dry, and oven-dry density values of PSC, ASC, and PlSC.
Density (kg/m3) *
SampleDemoulded (24 h)Air-Dry (28 d)Oven-Dry (28 d)
PSC_a1270.7 ± 1.51107.7 ± 1.41031.9 ± 1.4
ASC_a1308.3 ± 0.91148.3 ± 1.01124.0 ± 0.8
PlSC_a1288.4 ± 1.21124.0 ± 1.01053.0 ± 1.1
PSC_b1464.5 ± 0.91295.2 ± 0.81204.8 ± 0.7
ASC_b1513.7 ± 1.11342.6 ± 1.01251.9 ± 1.1
PlSC_b1489.2 ± 1.01315.2 ± 1.21232.3 ± 0.9
* Data are expressed as mean ± SD.
Table 10. Compressive strength at 28-day and 56-day.
Compressive Strength (MPa) *
Sample28-Day56-Day
PSC_a1.38 ± 0.201.99 ± 0.14
ASC_a2.87 ± 0.123.35 ± 0.15
PlSC_a1.95 ± 0.342.12 ± 0.17
PSC_b4.01 ± 0.164.97 ± 0.21
ASC_b6.98 ± 0.317.71 ± 0.13
PlSC_b5.11 ± 0.176.01 ± 0.19
* Data are expressed as mean ± SD.
Table 11. Thermal conductivity.
SampleThermal Conductivity Coefficient (W/mK) *
PSC_a0.15 ± 0.01
ASC_a0.28 ± 0.03
PlSC_a0.19 ± 0.04
PSC_b0.20 ± 0.01
ASC_b0.37 ± 0.05
PlSC_b0.28 ± 0.03
* Data are expressed as mean of three replicates ± SD.
Disclaimer/Publisher’s Note: The statements, opinions and data contained in all publications are solely those of the individual author(s) and contributor(s) and not of MDPI and/or the editor(s). MDPI and/or the editor(s) disclaim responsibility for any injury to people or property resulting from any ideas, methods, instructions or products referred to in the content.

