Article

Decolorization of Melanoidin Using Sono–Fenton and Photo–Fenton Processes

by
Apichon Watcharenwong
1,2,*,
Kawintra Kongka
1,
Anusara Kaeokan
1,
Chanat Chokejaroenrat
3 and
Chainarong Sakulthaew
4
1
School of Environmental Engineering, Institute of Engineering, Suranaree University of Technology, Nakhon Ratchasima 30000, Thailand
2
Center of Excellence in Advanced Electromagnetic Waves Engineering for the Industry, Suranaree University of Technology, Nakhon Ratchasima 30000, Thailand
3
Department of Environmental Technology and Management, Faculty of Environment, Kasetsart University, Bangkok 10900, Thailand
4
Department of Veterinary Technology, Faculty of Veterinary Technology, Kasetsart University, Bangkok 10900, Thailand
*
Author to whom correspondence should be addressed.
Waste 2023, 1(2), 455-467; https://doi.org/10.3390/waste1020027
Submission received: 2 March 2023 / Revised: 4 April 2023 / Accepted: 20 April 2023 / Published: 5 May 2023

Abstract

:
Ethanol production wastewater contains high quantities of dark–brown pigments (melanoidin) that result in low color removal using conventional biological treatments. Advanced oxidation processes (AOPs) are the most documented methods for reducing the color associated with melanoidin. This study examines the degradation of melanoidin using AOPs based on photo–Fenton, sono–Fenton, and sono–photo–Fenton processes. Their effects on decolorization were investigated based on light intensity, ultrasonic frequency, and the iron concentration (Fe2+)–to–H2O2 ratio. This study showed that ultrasonic waves and UV light result in a higher melanoidin decolorization efficiency than Fenton reactions alone. The initial color values were reduced from 5000–5500 ADMI to below 500 ADMI for both processes because the ultrasonic waves and ultraviolet light induced H2O2 breakdown into the 🞄OH radical. Reducing the color of the melanoidin using the photo–Fenton process resulted in a decolorization rate of 0.1126 min−1, which was higher than the rates of both the sono–Fenton and sono–photo–Fenton processes. These results provide proof that the photo–assisted Fenton process is more applicable to treating dye–contaminated water than are other enhancing approaches.

1. Introduction

Thailand’s ethanol industry is essential to supplying the high demand for ethanol. The wastewater produced by the ethanol distillation process contains a dark–brown pigment due to melanoidin (approximately 2%) produced by the reaction between amino acids and sugar [1]. The melanoidin–generated brown color in wastewater affects photosynthesis and is toxic to aquatic life, blocking sunlight penetration and eventually decreasing oxygen dissolution [2,3]. The estimated lethal concentration (LC50) of wastewater from ethanol distillation was found to be 0.5% toxic to aquatic life [4]. LC50 is the concentration of the chemical that killed 50% of test animals during an observation period. In recent decades, melanoidin decolorization using conventional biological treatments, such as activated sludge systems, only partially eliminated color in wastewater [2]. A decolorization result of 26% was reported for distillery effluent through bio flocculation by Synechocystis sp. [5]. In addition, other techniques that were applied for melanoidin removal include coagulation, membrane filtration [6], electrocoagulation [7], and adsorption [8]. In electrocoagulation for decolorizing melanoidin wastewater using aluminum electrodes, decolorization was found to be as high as 98% at pH 4.2. The decolorization performance was dependent on pH where the initial pH of the wastewater was 6.5. Thus, a pH adjustment cost is incurred during this process [9], in addition to the cost of sludge disposal [10]. Moreover, studies on melanoidin adsorption with activated carbon (AC) obtained from bagasse bottom ash (BBA) showed that it could reduce the melanoidin concentration from 100 mg/m3 to 10 mg/m3 [11]. In a study on removing melanoidin from molasses effluents via adsorption, it was found that the adsorption mechanism was physical adsorption, which would occur well in acidic pH conditions [8]. This may be a disadvantage of this process as it requires the neutralization of the wastewater and of by–products such as saturated adsorbents, which must be removed in the next step.
Advanced oxidation processes (AOPs) are the most recognized methods for reducing the color associated with melanoidin because no undesirable by–products are reported [4]. The Fenton process is one of the most popular advanced oxidation processes (AOPs) for color removal because 🞄OH radicals arise from the reaction between ferrous ions (Fe2+) and hydrogen peroxide (H2O2), which has a high oxidation potential [E0 = +2.80 V] [12]. Many studies investigated the use of the Fenton process for the decolorization of several dyes, such as Blue 71 azo dye, CI Acid Yellow 23, and Acid Red 66, and even for the decolorization of wastewater from the baker’s yeast industry [13,14,15,16]. H2O2 was found to play a more critical role in removing color than FeSO4 in decolorization and TOC removal [17]. UV–C irradiation can be intensified by the Fenton process, as it can amplify the production of 🞄OH radicals through the Fenton reaction (Equations (1) and (2)) [18]. The photo–Fenton process was used to decolorize compost leachate [19], for the decolorization of industrial wastewater containing baker’s yeast [20], and for the decolorization of wastewater from a distillery [21]. While UV–C radiation increases 🞄OH radical production in the Fenton reaction, at the same time, using ultrasonic waves can increase 🞄OH radical formation (Equation (3)) [22]. It was found that using ultrasonic waves in combination with the Fenton process can increase the efficiency of decolorization more than using the Fenton process alone, thereby negating the need for chemical addition and reducing contact time with Reactive Blue 181 [23].
H2O2 + hv → 🞄OH + HO
Fe3+ + H2O2 + hv → 🞄OH + Fe2+ + H+
H2O2 + Ultrasonic wave → 2🞄OH
To date, no studies focused on melanoid decolorization using the Fenton process and UV irradiation nor on using ultrasonic waves in combination with the Fenton process for the decolorization of melanoidin. The highlight of this study is its innovative application of various combination processes of the Fenton method to solve the longstanding practical production problem of melanoidin decolorization, which overcomes the lower treatment efficiency of biological treatments and has practical significance. The present study aims to use the Fenton process with ultrasonic waves at varying ultrasonic frequencies and UV–C irradiation to reduce the brown color of melanoidin–contaminated water.

2. Materials and Methods

2.1. Materials and Reagents

In this study, melanoidin wastewater was synthesized using D–glucose (Carlo Erba, France, AR grade), glycine (LOBA Chemie, Boisar, Maharashtra, India, AR grade), and sodium bicarbonate (Uni Lab, Auburn, Australia, AR grade). The solution was mixed with DI water type II, which has conductivity <1 µs/cm, resistivity >1 MΩ.cm, and total organics <50 ppb. The reagents for the Fenton process, photo–Fenton process, and sono–Fenton process used ferrous sulfate heptahydrate (FeSO4·7H2O, LOBA Chemie, Maharashtra, India), and 30% hydrogen peroxide (QRëC™, Gillman, Australia, AR grade). Additionally, the addition of 96% sulfuric acid (RCI Labscan, Bangkok, Thailand, AR grade) or 99% sodium hydroxide (Micropearl) (RCI Labscan, Bangkok, Thailand, AR grade) was used to adjust pH.

2.2. Melanoidin Wastewater Synthesis

Synthetic melanoidin wastewater was prepared from 100 mL of deionized water mixed with D–glucose (4.5 g), glycine (1.88 g), and sodium bicarbonate (0.42 g). Then, the solution was heated in an oven for 7 h at 95 °C. During heating, the Maillard reaction between proteins and sugars occurred, which led to the formation of brown nitrogenous polymers and co–polymers, leading to the formation of the melanoidins responsible for the solution’s dark–brown color [24]. The proposed carbohydrate–based melanoidin structure is shown in Figure 1 [25]. After 7 h, the mixture was removed from the oven and cooled in a desiccator before 100 mL of deionized water was added. The resulting synthetic wastewater had a concentration of 25.5 g/L [8,26]. This experiment studied decolorization based on the Fenton process in combination with ultrasonic waves and UV–C light, using 1000 mL of synthetic melanoidin wastewater with an initial synthetic wastewater concentration of approximately 10,000 mg/L. The synthetic wastewater was diluted to a concentration close to that of actual wastewater from ethanol production.

2.3. Fenton Process Experiment

In the Fenton process experiment, 5 mL of Fe2+ was added to wastewater. Fe2+ concentration was studied at 0.005, 0.0075, 0.01, 0.025, 0.05, and 0.075 mol/L, while H2O2 = 0.375 mol/L and pH 3 were fixed. Then, H2O2 concentration was studied at 0.06, 0.125, 0.25, 0.375, 0.5, and 0.75 mol/L, while Fe2+ = 0.05 mol/L and pH = 3 were controlled. The pH of the wastewater was studied at 3, 4, 5, 6, 7, and 8, while H2O2 = 0.375 mol/L and Fe2+ = 0.01 mol/L were fixed. The solution was then stirred at 150 rpm with a reaction time of 90 min. The effects of the initial pH, initial ferrous sulfate concentration, and initial hydrogen peroxide concentration on decolorization in the Fenton process (Fe2+/H2O2) were investigated. For the sono–Fenton experiment (Ultrasonic/Fe2+/H2O2), ultrasonic waves were combined with the Fenton process for decolorization using frequencies of 20, 28, and 40 kHz with a self–made ultrasonic processor with an electrical power of 100 W. During the experiment, ultrasonic waves were emitted in an alternating pulse mode for 5 min and then stopped for 5 min over a 90 min period. The photo–Fenton (UV/Fe2+/H2O2) experiment used an ultraviolet germicidal lamp (Dako T5, 10 W, GL). The UV–C light intensity was studied at 0 W, 10 W, 30 W, and 60 W for a reaction time of 90 min using a self–made UV–c processor. For the sono–photo–Fenton experiment (Ultrasonic/UV/Fe2+/H2O2), a 60 W light intensity was used with ultrasonic waves at 40 kHz emitted in pulse mode for a reaction time of 90 min. The samples collected were color analyzed using a spectrophotometric model comprising a PG Instruments UV/VIS spectrophotometer and an ADMI model UV/VIS spectrophotometer with a 1.8 nm spectral bandwidth (Spectroquant® Prove 600, Merck KGaA, Darmstadt Germany). Decolorization efficiency was calculated using Equation (4) where C0 and Ce were the initial and final melanoidin concentrations.
Decolorization efficiency = (C0 − Ce)/C0 × 100

3. Results

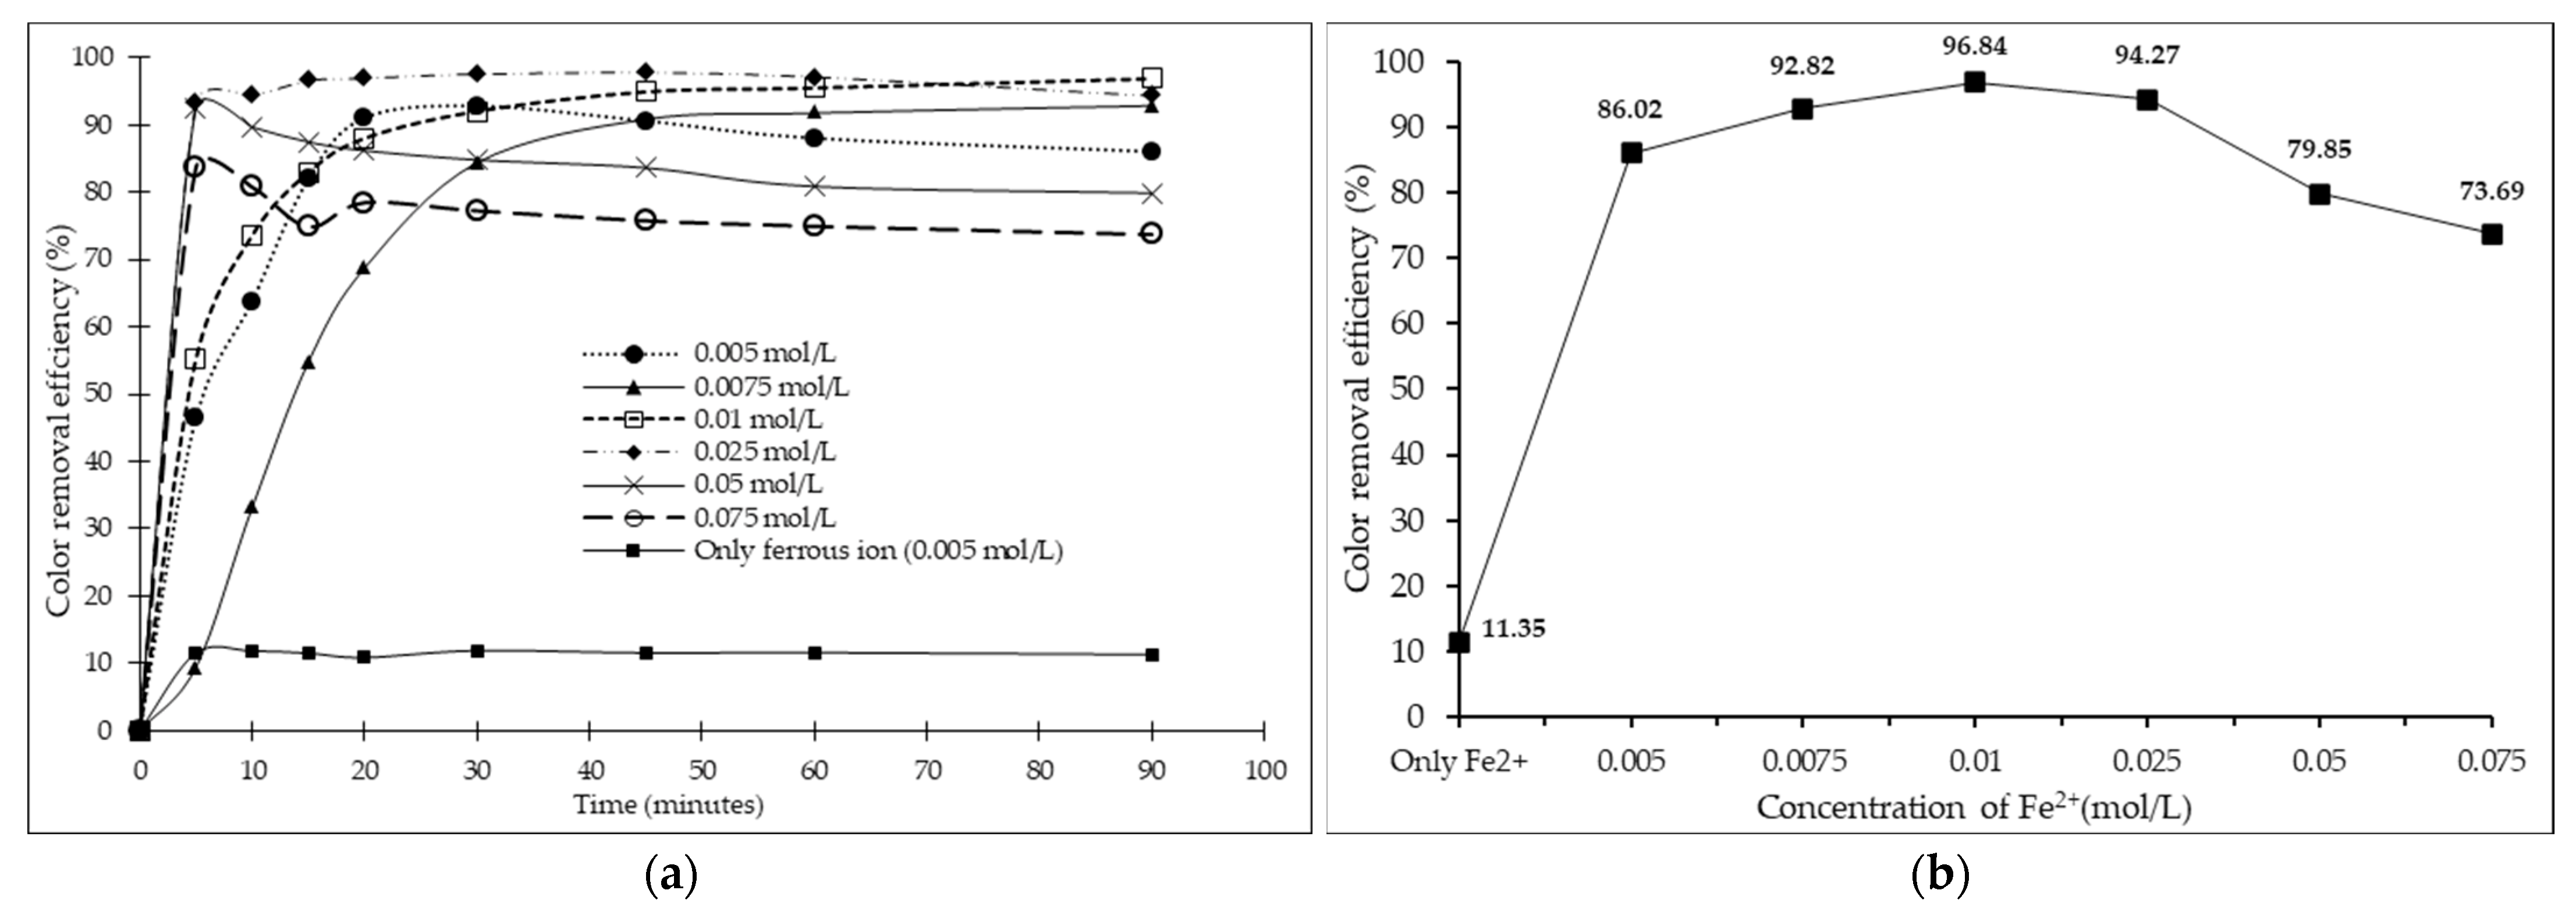
3.1. Effect of Initial Fe2+ Dosage

An optimal ferrous (Fe2+) concentration is essential to the Fenton process. In this experiment, Fe2+ concentrations were studied from 0.005 to 0.075 mol/L while H2O2 = 0.375 mol/L and pH 3 were fixed. Figure 2 shows that color removal efficiency increased with increasing Fe2+ concentration in the range 0.005–0.075 mol/L. A Fe2+ concentration of 0.0075, 0.01, or 0.025 mmol/L produced a color removal efficiency superior to other concentrations of more than 90%, while at higher Fe2+ concentrations, the decolorization capacity decreased because excessive Fe2+ content affects the degradation efficiency of color. With an excessive dosage of Fe2+, the decolorization rate dropped because 🞄OH was reduced by Fe2+ (Equation (5)) [27], which was perhaps due to the reaction leading to Fe2+ and 🞄OH recombination. Thus, the oxidation of pollutants was inhibited at high Fe2+ concentrations [28]. Consequently, Fe2+ higher than 0.025 mol/L was not recommended. A Fe2+ concentration of 0.01 mol/L was, therefore, chosen for the following study.
🞄OH + Fe2+ → Fe3+ + HO

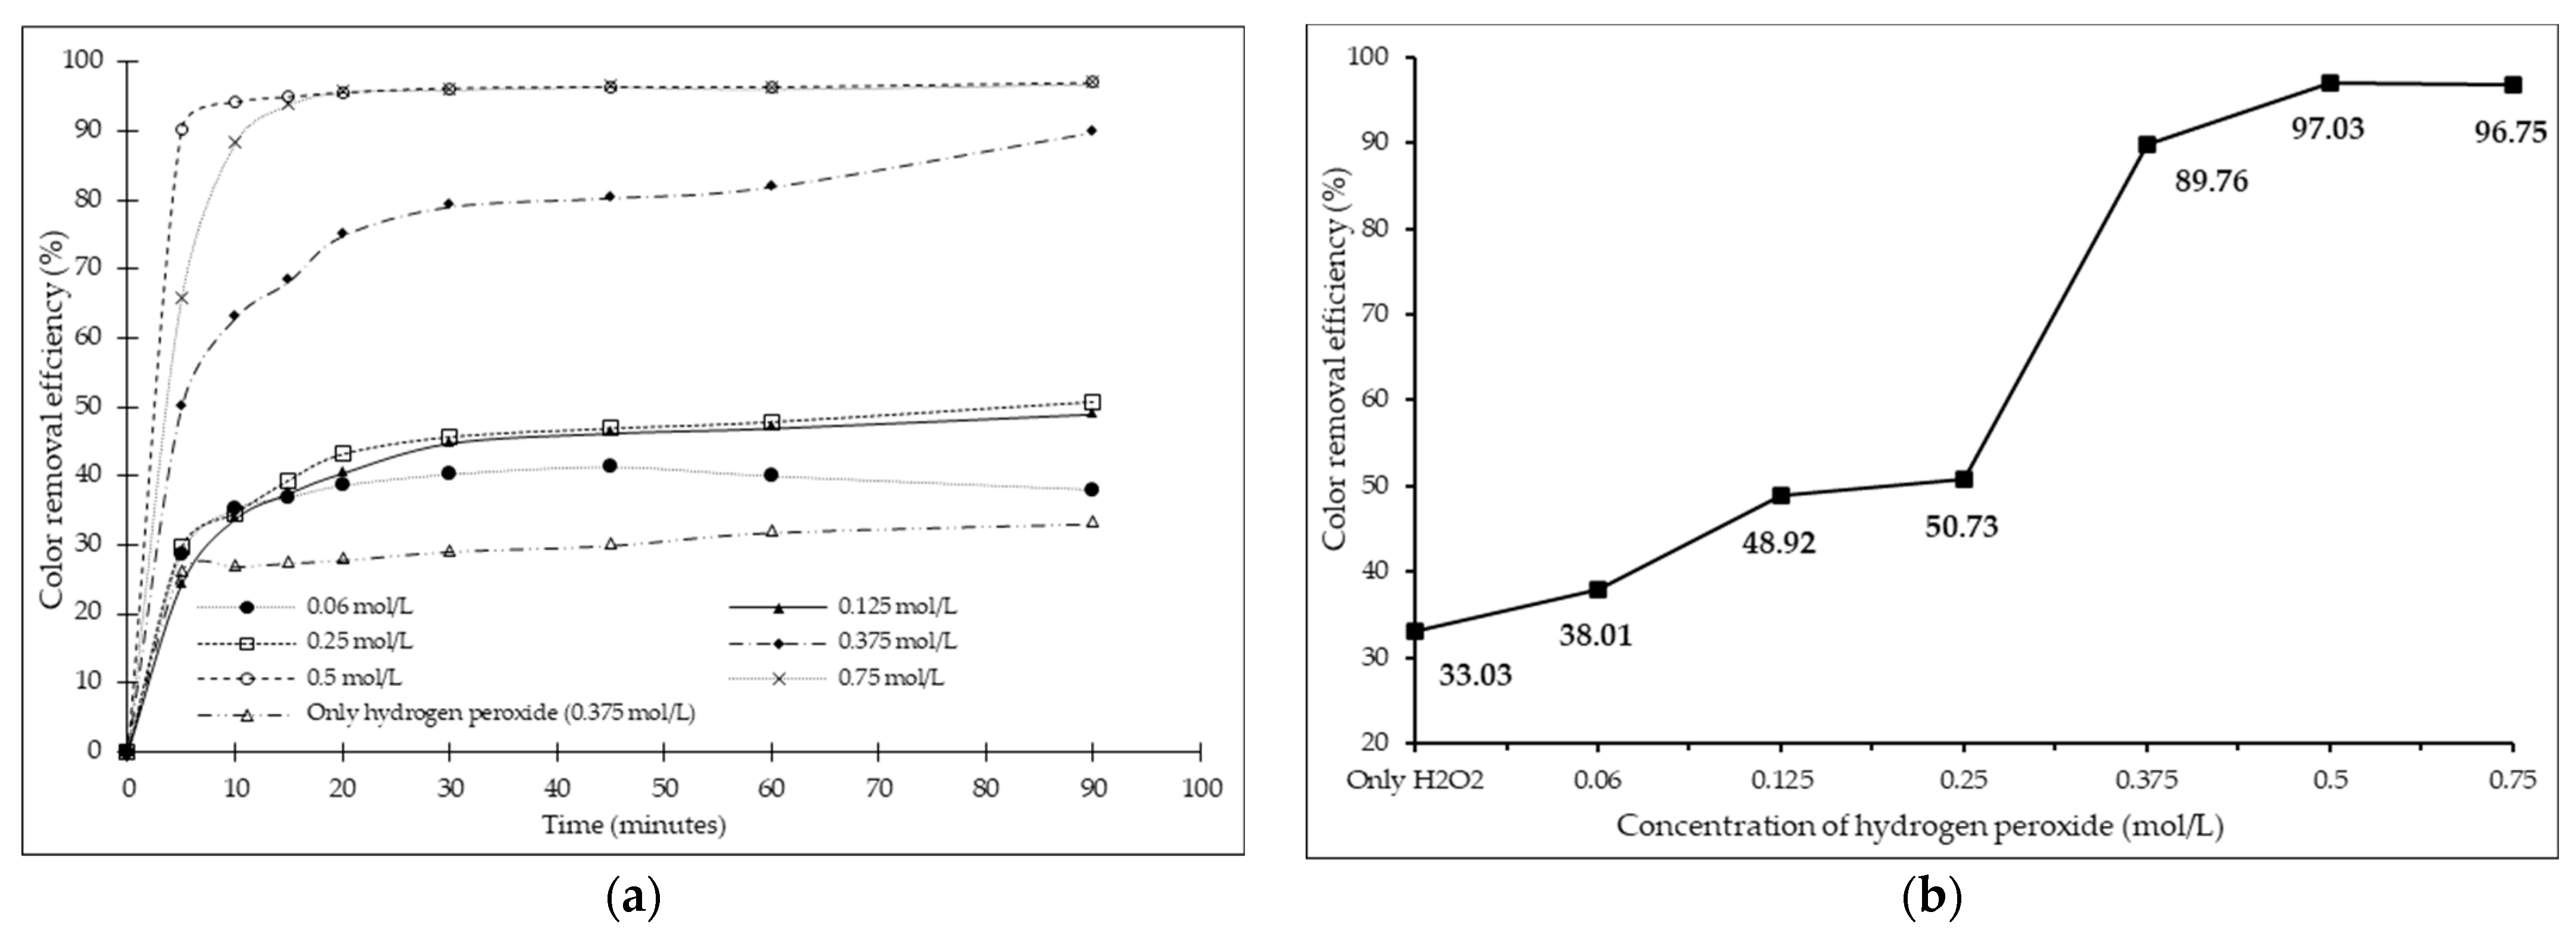
3.2. Effect of Initial H2O2 Concentration

The effect of the H2O2 concentration (in the range 0.060–0.750 mol/L) on the decolorization of melanoidin was studied using a concentration of ferrous of 0.05 mol/L at pH 3 (Figure 3). It was found that the decolorization capacity increased with an increase in the H2O2 concentration, indicating that more available H2O2 initiated the generation of 🞄OH. The color removal efficiency was greater than 80% with a concentration of H2O2 at 0.375, 0.500, or 0.750 mol/L. The hydrogen peroxide reaction with ferrous could produce more 🞄OH radicals (Equation (6)). However, an increase in H2O2 necessarily affects the cost of color removal [29]. Thus, an H2O2 concentration of 0.375 mol/L was chosen for the following study.
Fe2+ + H2O2 → Fe3+ + OH + 🞄OH

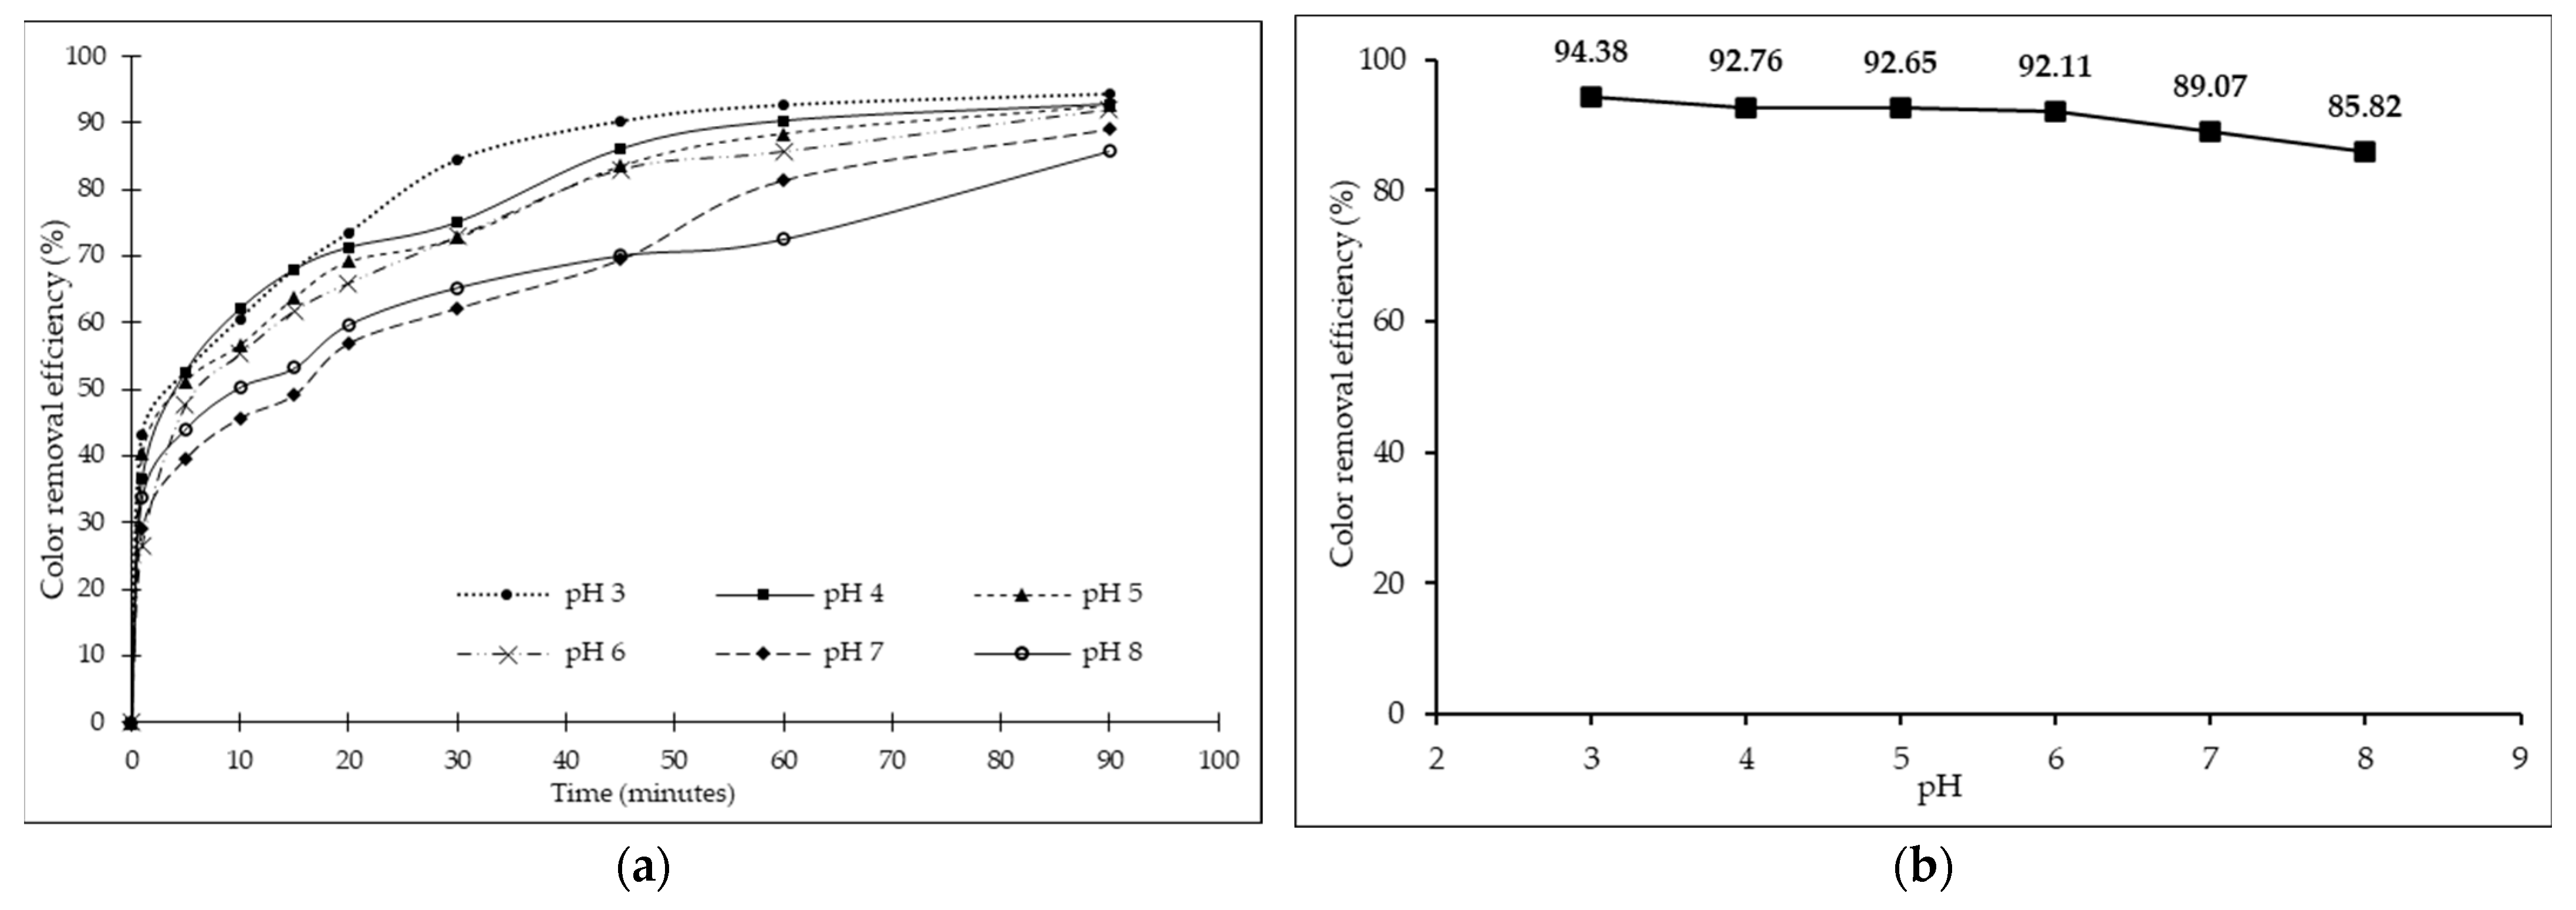
3.3. Effect of Initial pH

Solution pH is a critical controlling parameter influencing melanoidin elimination efficiency in AOP. Because a change in the pH can result in variation in the Fe2+ concentration, it directly impacts the mechanism of melanoidin oxidation. Thus, the production rate of 🞄OH radicals accountable for the oxidation of melanoidin is limited [30]. The effects of pH on the decolorization rate of melanoidin based on evaluation at 6 initial pH values (3, 4, 5, 6, 7, or 8) were investigated (Figure 4). The color removal efficiency was higher than 85% at all pH values. In this experiment, the Fenton oxidation process at pH 3 produced the highest color removal efficiency consistent with the research of Ertugay [14]. Initially, the melanoidin wastewater had a neutral pH that resulted in the decolorization of 518 ADMI after 90 min, accounting for 89%. The experiments with initial pHs of 3, 4, 5, and 6 yielded a slightly better decolorization efficiency. Thus, it was not necessary to adjust the initial pH of the wastewater to pH 3.

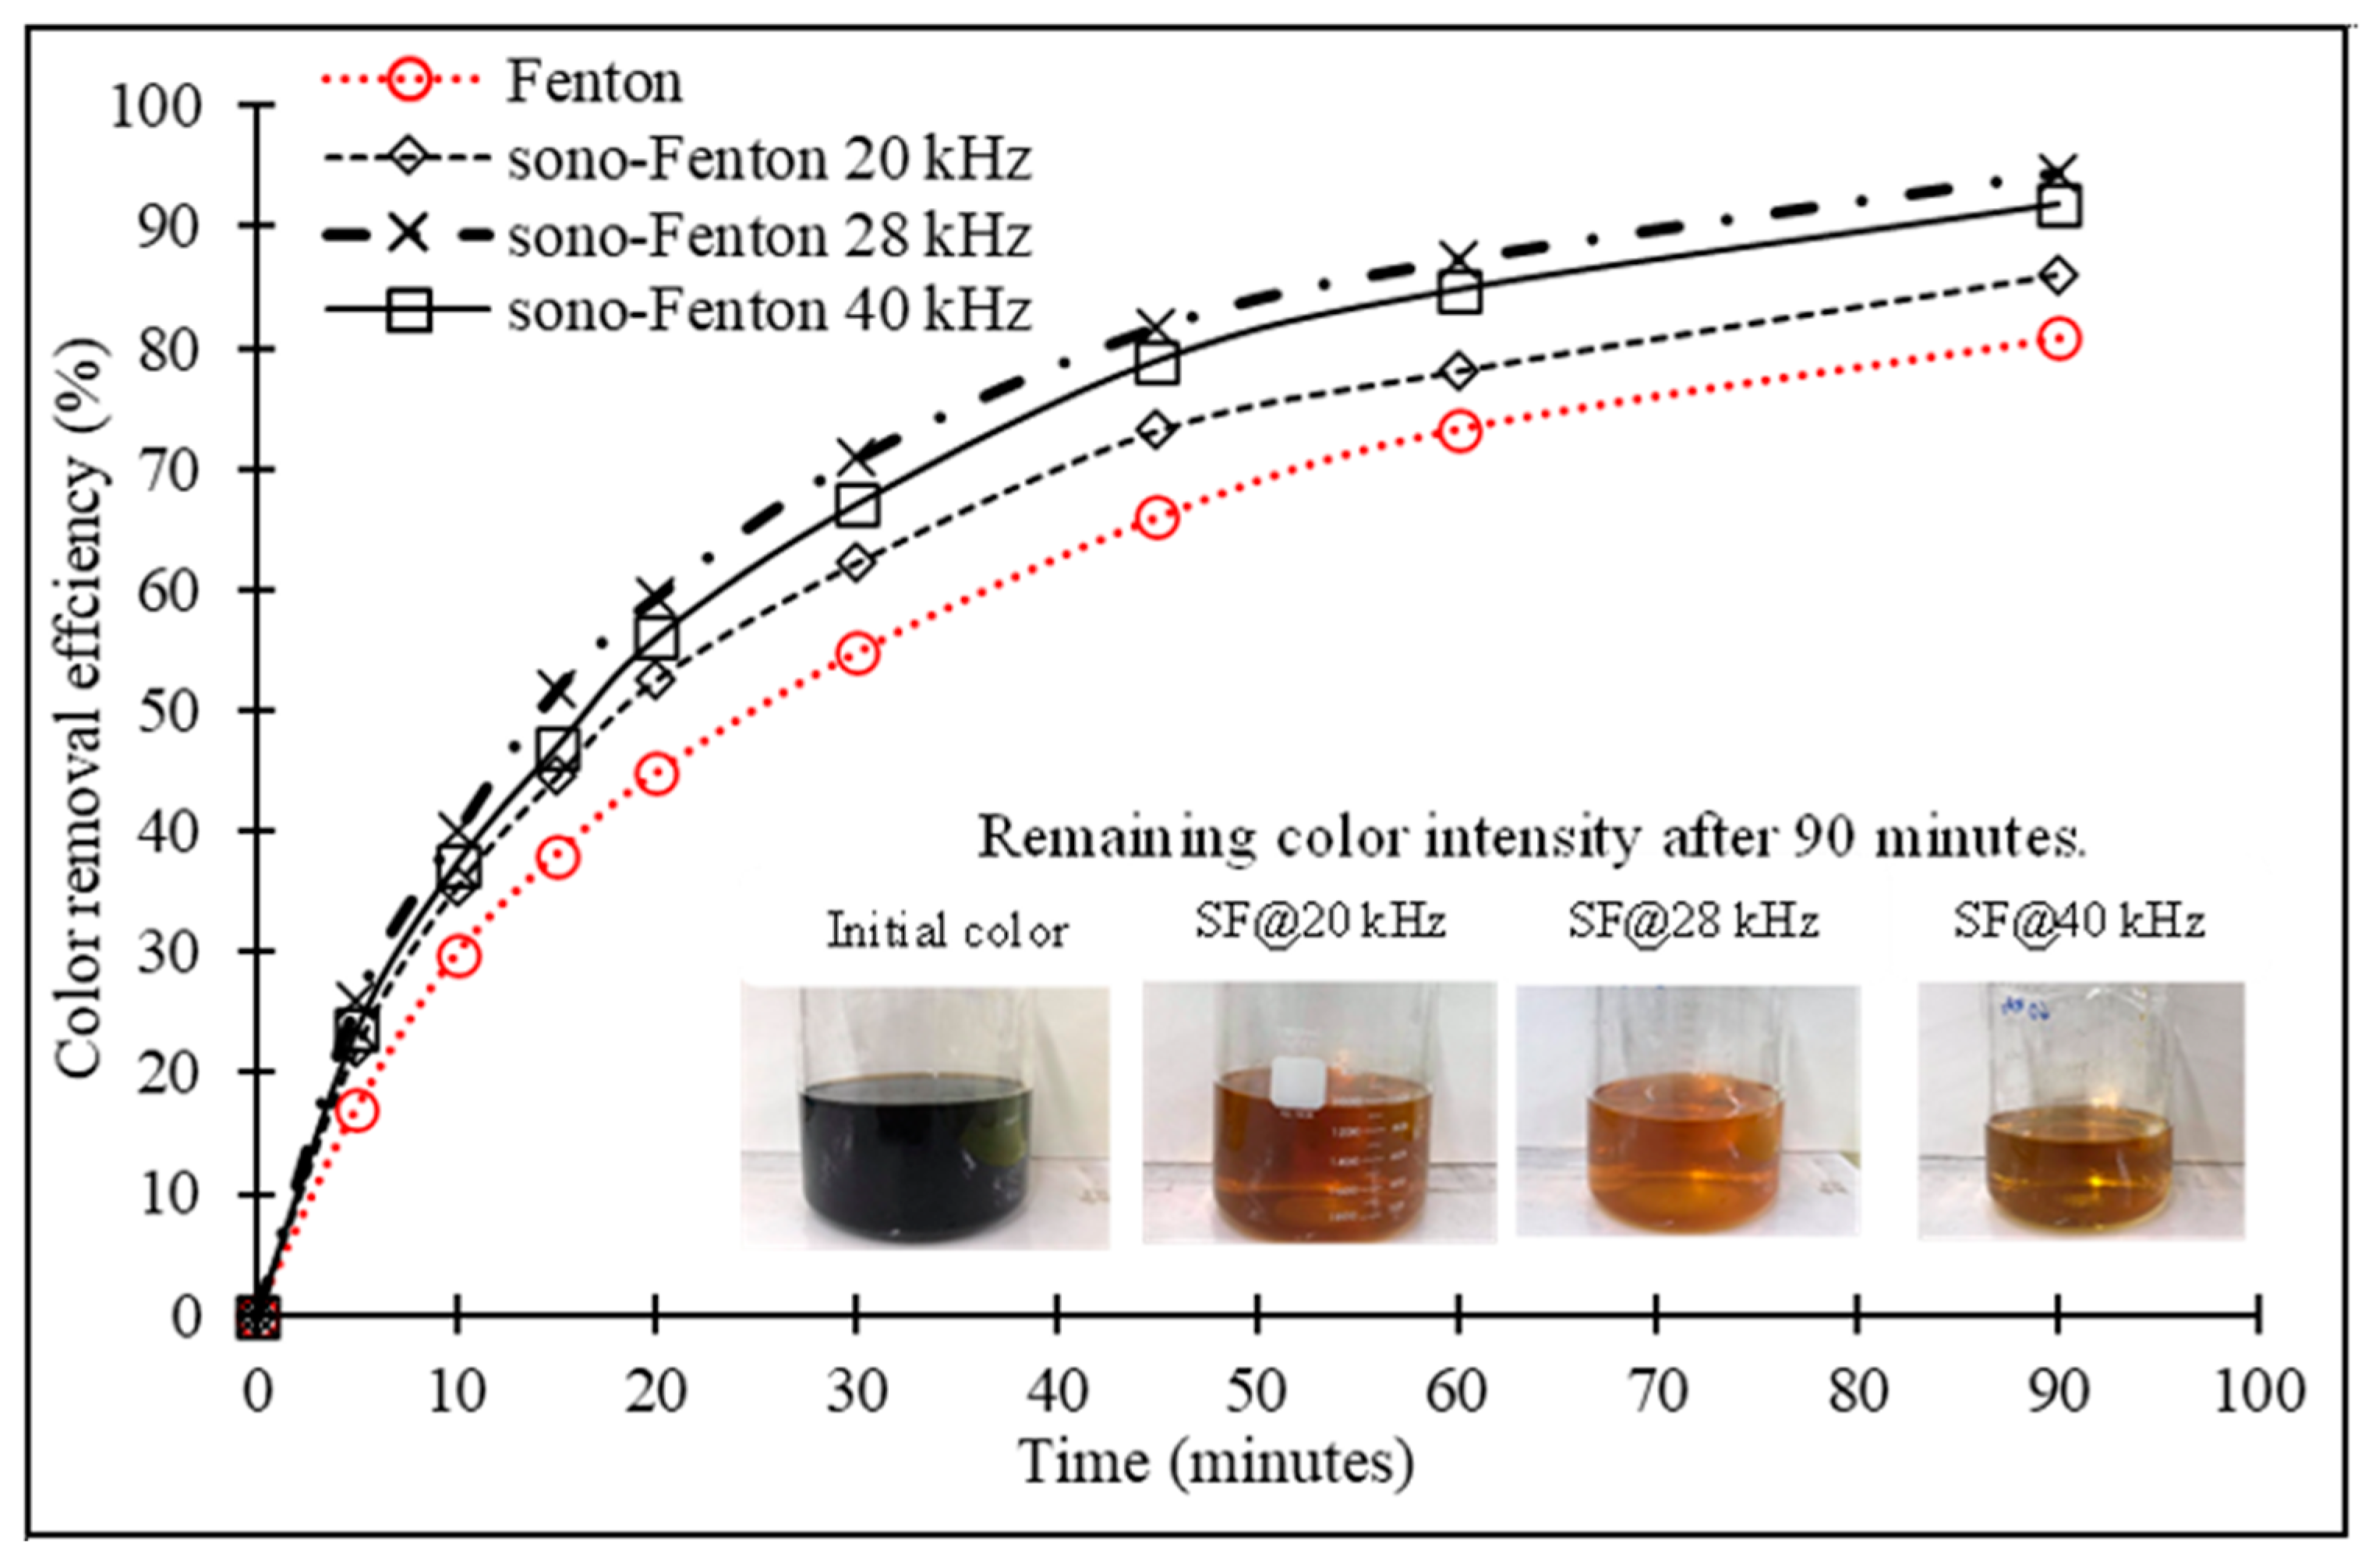
3.4. Optimization for Decolorization of Melanoidin Wastewater Using Sono–Fenton (Fe2+/H2O2/US) Process

These experiments varied the ultrasonic frequencies at 20, 28, or 40 kHz with a power of 100 W. In the experiment, ultrasonic waves were applied every 5 min, alternating in pulse mode until the end of the investigation. The results showed that the color removal efficiency increased by using ultrasonic waves combined with a Fenton reaction (Figure 5). At a frequency of 20 kHz, the melanoidin color was reduced from 4500 ADMI to 627 ADMI with a removal efficiency of 86%; at 28 kHz, the melanoidin color was reduced to 247 ADMI with a removal efficiency of 94%; and at 40 kHz, the melanoidin color was reduced to 366 ADMI with a removal efficiency of 91% (Figure 5). This increase in removal efficiency was due to the acceleration of the H2O2 dissolution to form 🞄OH (Equation (3)) [12]. The 🞄OH radical is generated by the cavitation phenomenon caused by the release of ultrasonic waves into the liquid phases [22]. The frequency of the ultrasonic waves results in the cavitation phenomenon [31]. By increasing the frequency, smaller and evenly distributed bubbles are produced [32,33]. Thus, an increased frequency has a more significant effect on 🞄OH radical formation [34].

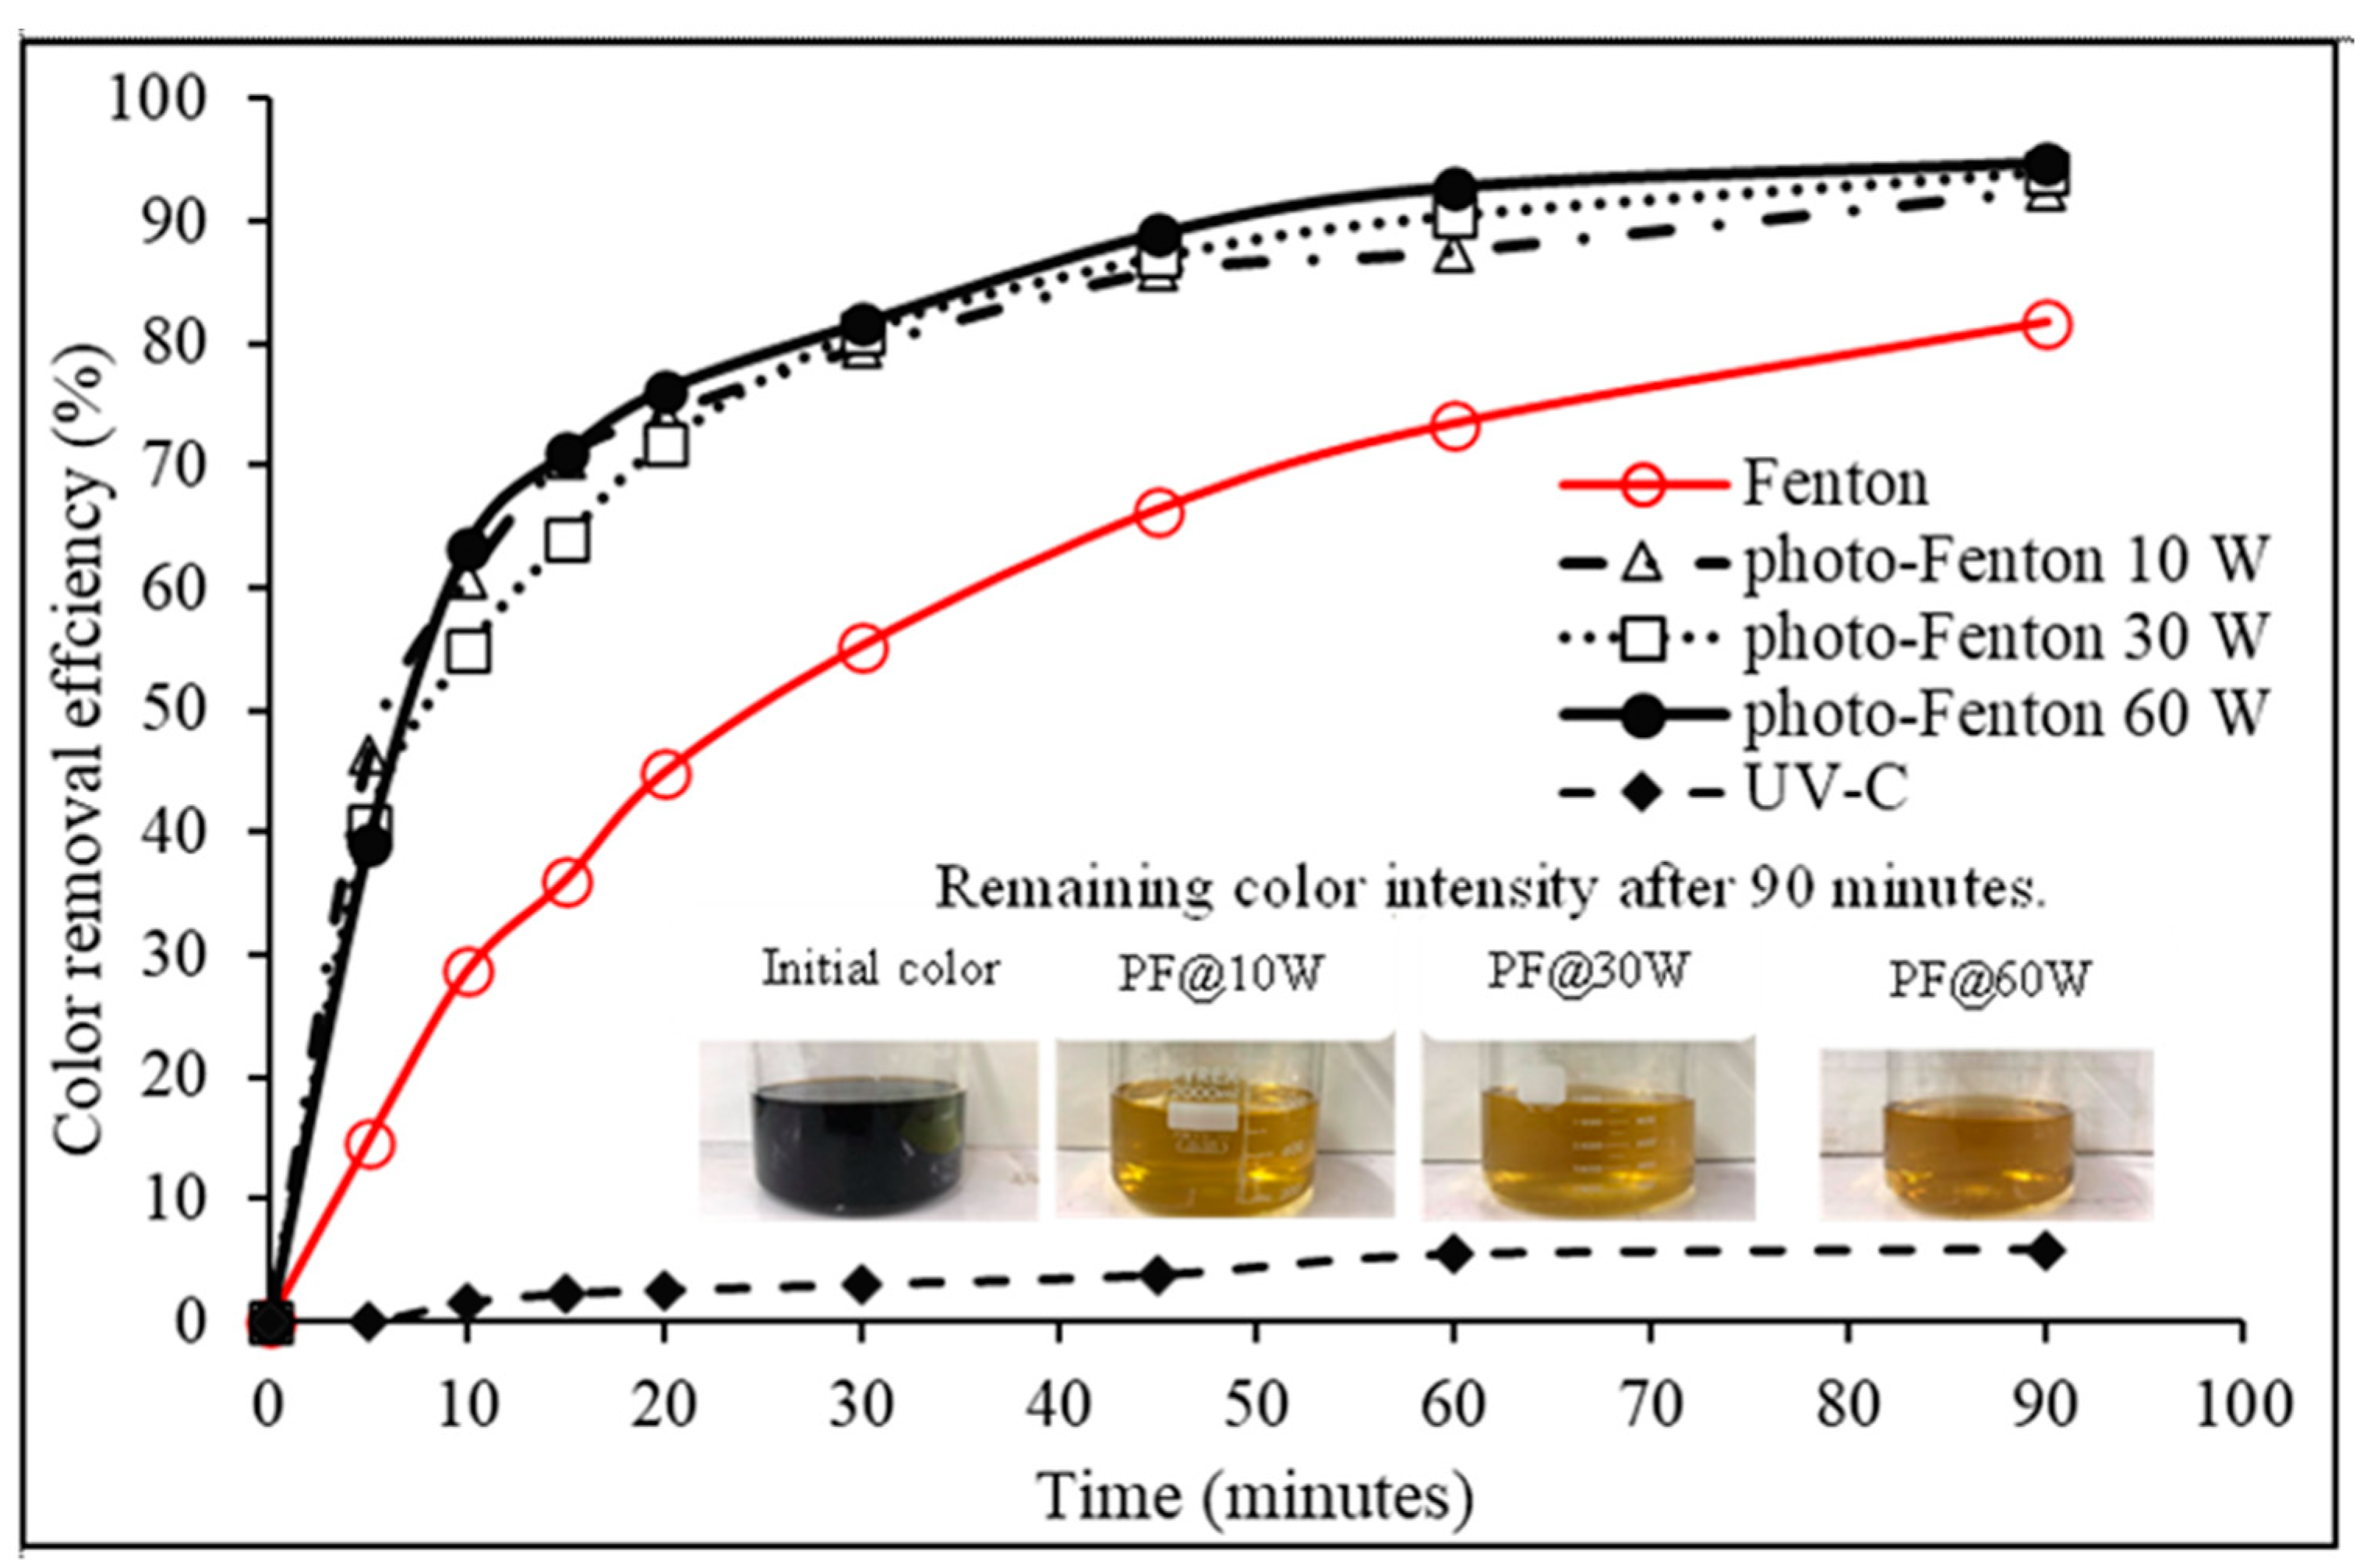
3.5. Optimization for Decolorization of Melanoidin Wastewater Using Photo–Fenton Fe2+/H2O2/UV–C) Process

The decolorization of melanoidin was studied using a photo–Fenton process with a 253.7 nm UV–C lamp (Figure 6). These experimental conditions were selected based on former optimization experiments carried out with melanoidin wastewater. The effect of UV–C for the photo–Fenton (Fe2+/H2O2/UV) process was assessed using UV–C light power at 0 W, 10 W, 30 W, or 60 W for 90 min of irradiation. It was found that the UV–C power enhanced the decolorization rate of melanoidin wastewater. Adding UV–C light intensity up to 60 W for the photo–Fenton process increased the decolorization from 5467.99 ADMI to 285.53 ADMI (95.32%) (Figure 6). The decolorization in the Fe2+/H2O2/UV process was due to the generation of the hydroxyl radical by (i) a Fenton reaction (Equation (6)), (ii) the direct photolysis of H2O2 (Equation (1)), and (iii) the photoreduction of the Fe3+ formed during the irradiation (Equation (2)) [3,35].

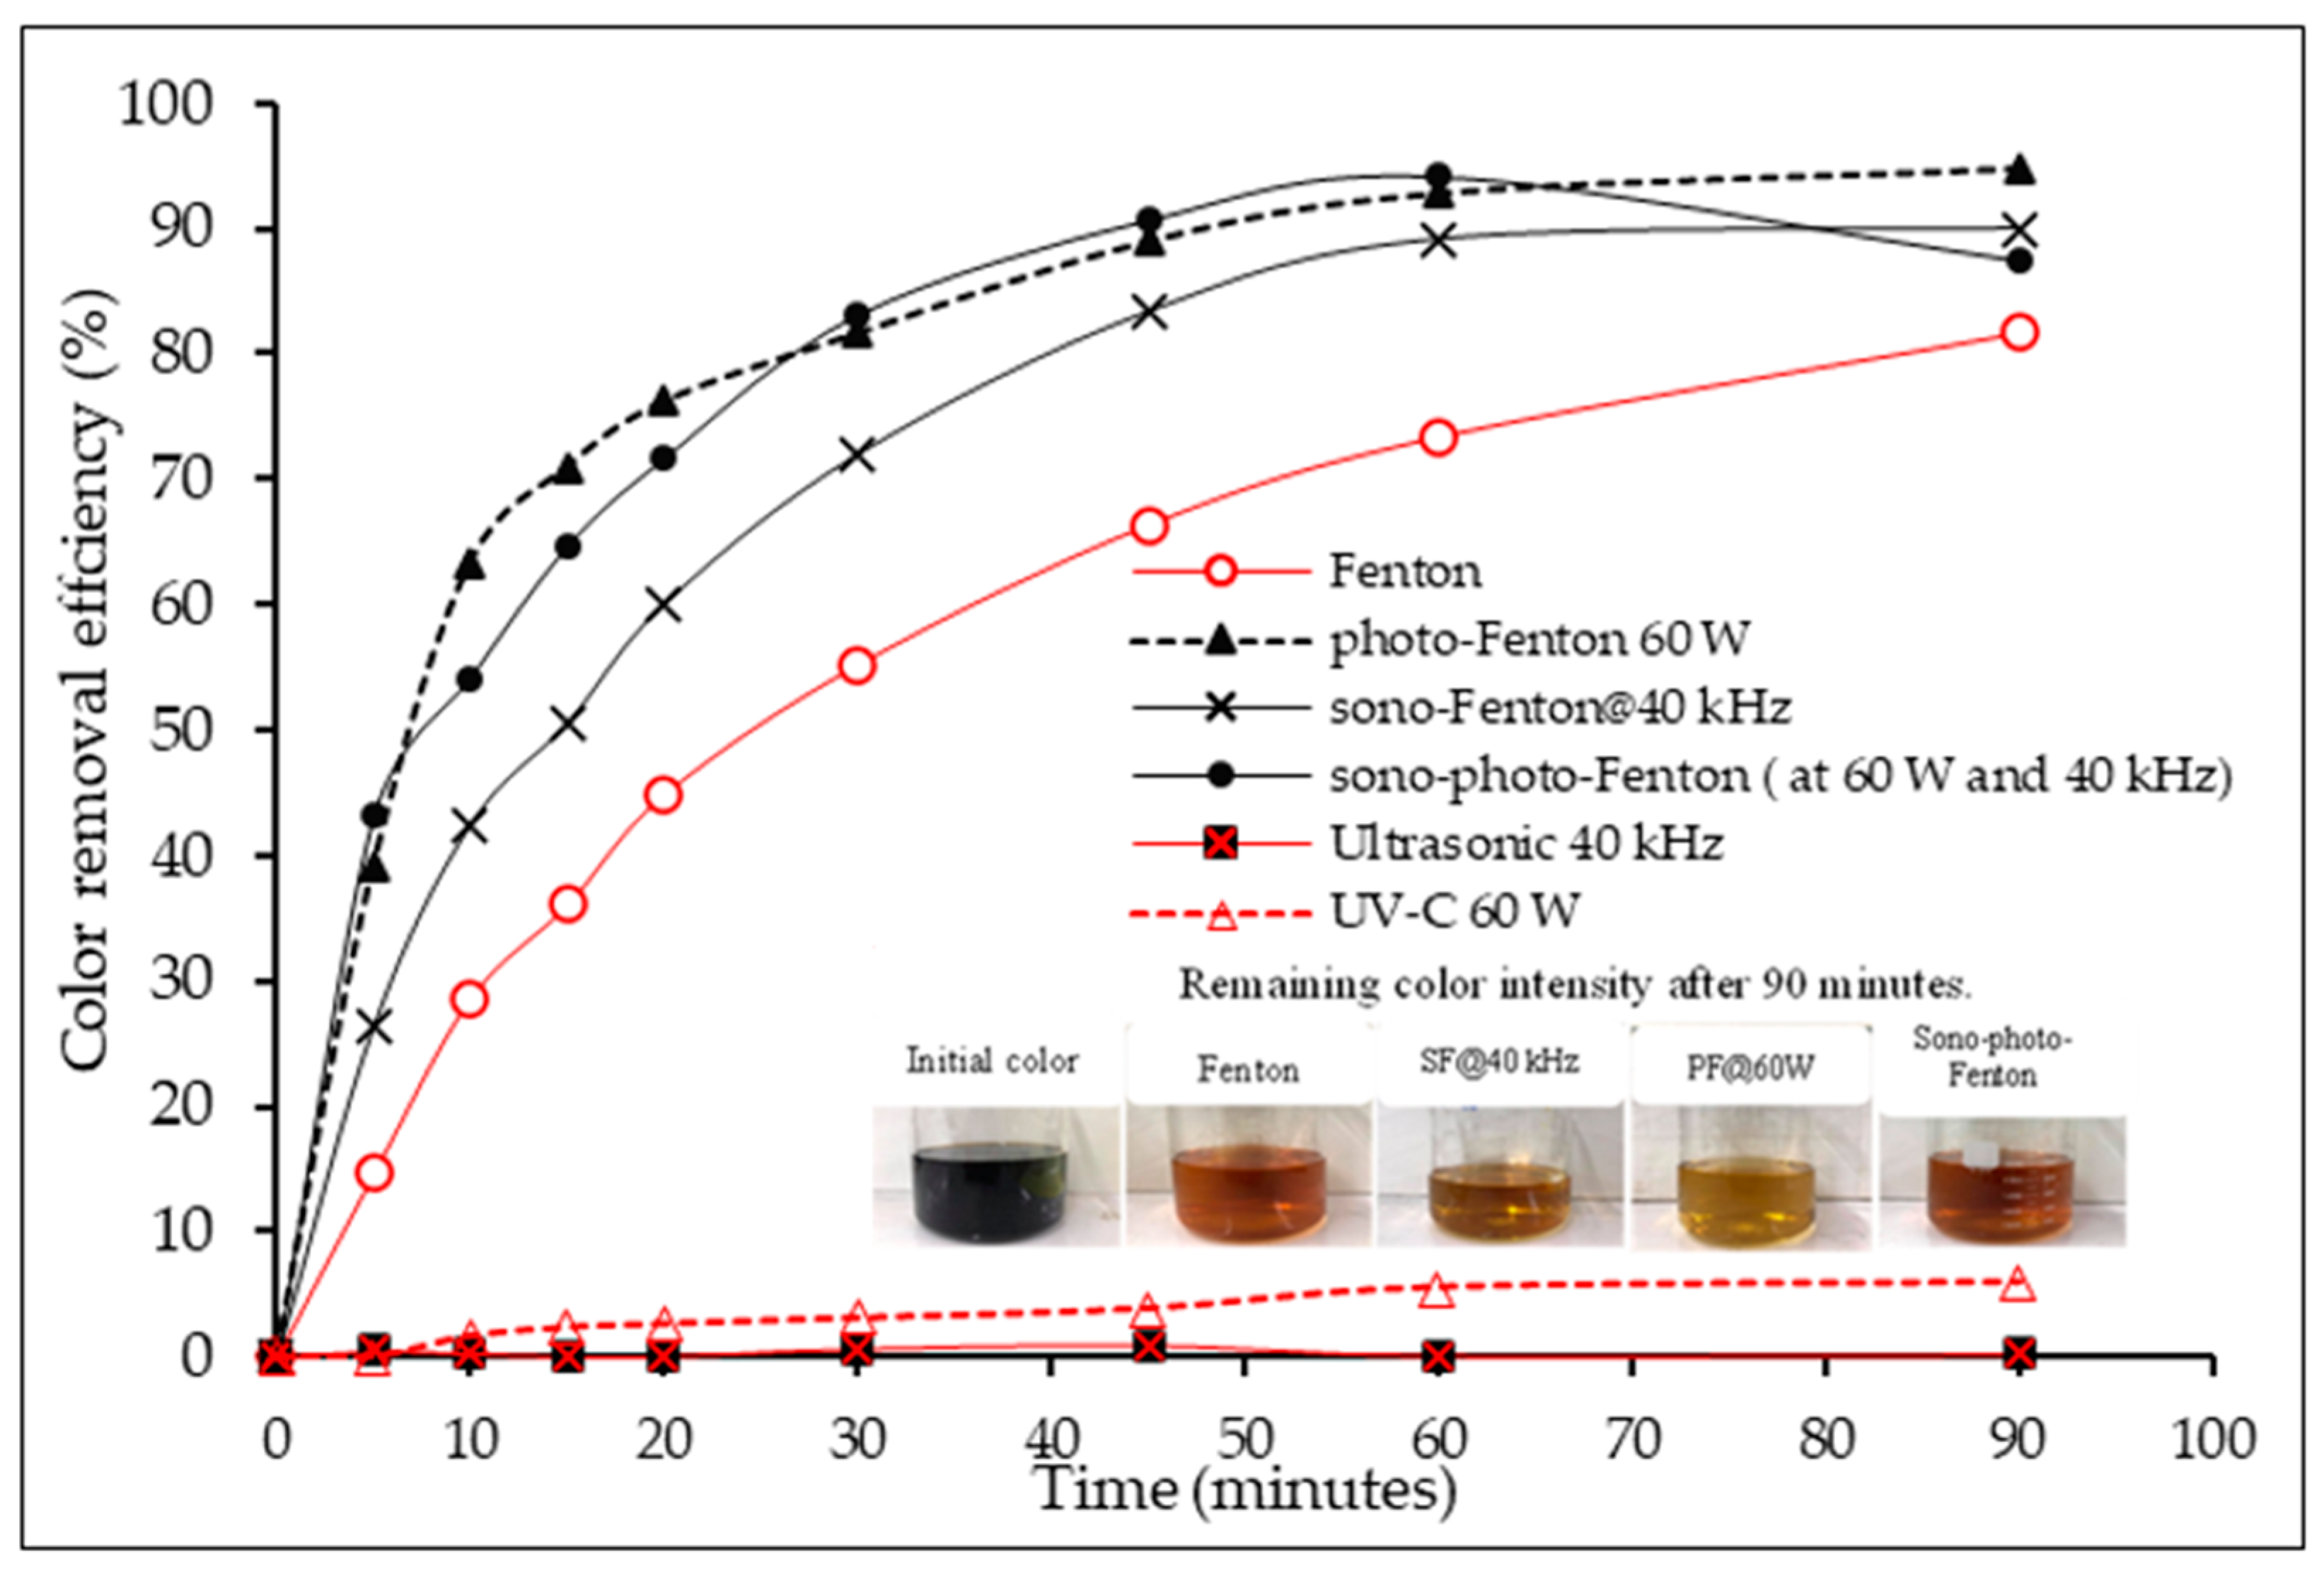
3.6. Optimization for Decolorization of Melanoidin Wastewater Using Sono–Photo–Fenton (Fe2+/H2O2/UV–C/US) Process

The Fenton process combined with ultrasonic waves and UV–C light was studied at a frequency of 40 kHz. In these experiments, ultrasonic waves were applied with pulse mode alternation every 5 min using 60 W UV–C irradiation. The color removal efficiency of the Fenton process was 81%, with the use of ultrasonic waves and UV–C irradiation with the Fenton process increasing the efficiency of color removal by 8.287% and 13.091%, respectively (Figure 7). Ultrasonic waves and UV–C irradiation decreased the color to 286 ADMI and 285 ADMI, respectively (Figure 7). Color removal using the Fenton process in combination with ultrasonic waves and UV–C irradiation was more than 90% effective in decolorization for 60 min. Using ultrasonic waves and UV–C light significantly increased 🞄OH radical formation in the reactions [12]. However, the color removal efficiency decreased after 60 min, which was perhaps because H2O2 disintegrated into the 🞄OH radical via ultrasonic waves (sonolysis) and UV–C (photolysis) [Equations (1) and (3)]. Due to the limitation of available H2O2, further reaction with Fe2+ was unlikely.

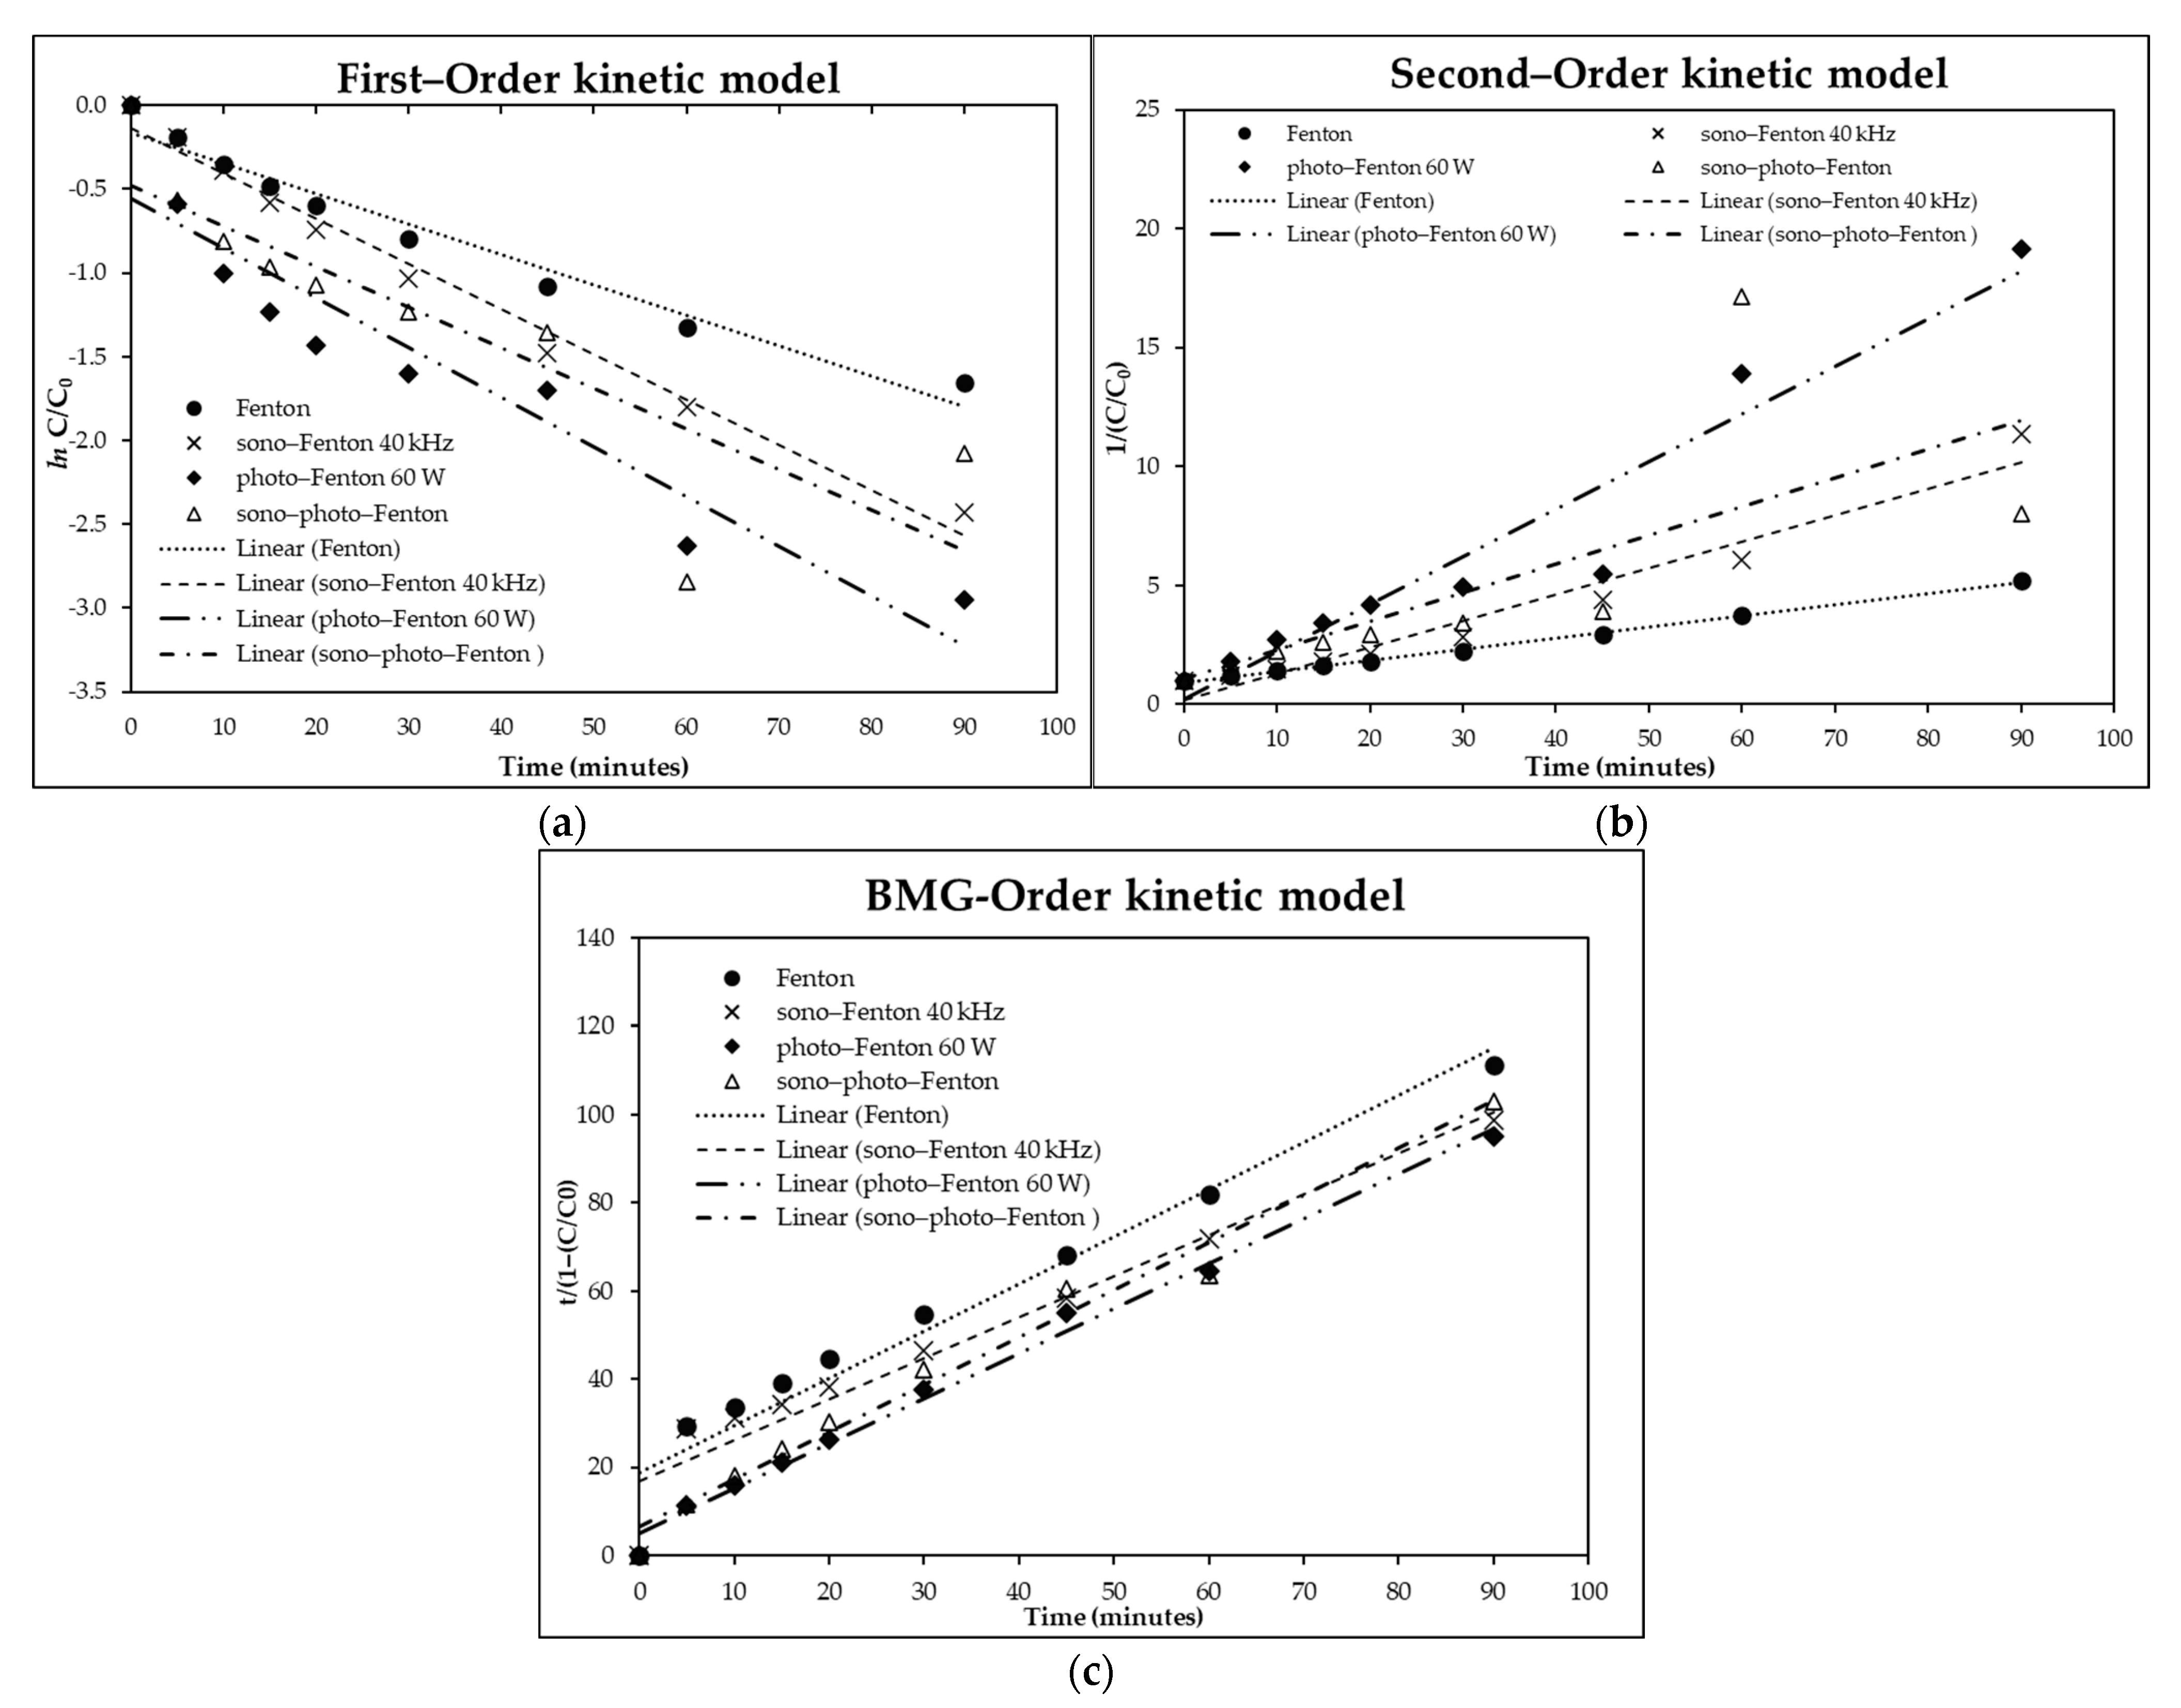
3.7. Kinetic Experiments

Figure 8a shows a plot of the linear equation between ln C/C0 and time, with m being the slope and b being the intercept. The slope in an equation can describe the reaction rate (k) of the process. The Fenton process had an R2 of 0.9659, while the sono–Fenton process had an R2 of 0.9853, which was closer to 1 than the R2 for the photo–Fenton and sono–photo–Fenton processes (0.8967 and 0.7343, respectively) (Figure 8). In Figure 8b, the plot between 1/(C/C0) against time showed that the Fenton process, the sono–Fenton process, and the photo–Fenton process had R2 in the range 0.93 to 0.99, which were closer to 1 than the R2 for the sono–photo–Fenton process (0.4969), indicating a far poorer correlation compared with those of other processes. The plot of t/(1 − (C/C0)) versus time was used for the linearized equation of the BMG kinetic model (Figure 8c) and indicated that the Fenton, sono–Fenton, photo–Fenton, and sono–photo–Fenton processes had R2 greater than 0.95 (0.9889, 0.9798, 0.9839, and 0.9643, respectively) and closer to 1 than those of the other models (the first- and second-order kinetic models). This is because decolorization via the Fenton process takes place through a two–stage operation, with the first stage occurring rapidly due to the oxidation of the 🞄OH radical and the second stage due to oxidation from other radicals occurring from the accumulation of Fe3+ and H2O2, which have a lower oxidative capacity and thus react more slowly [36]. According to past research, this behavior was observed in decolorization via Fenton process reactions in a two–stage pattern [37,38]. The BMG kinetic model can, therefore, better explain the decolorization than first- and second-order kinetic models, since it explains the initial reduction by Equation (14) and considers the rapid decolorization and second–stage decolorization of Equation (15), describing the decolorization that occurs over time.
As seen in Table 1, the correlation coefficient values for the BMG model were mostly higher than those of the first –order and second–order models. Thus, the BMG kinetic model was the best model for describing the decolorization of melanoidin using the Fenton, sono-Fenton, photo–Fenton, and sono–photo–Fenton oxidation processes. The decolorization rates of the four methods were in the order photo–Fenton >sono–photo–Fenton >sono–Fenton >Fenton with decolorization rates of 0.1126, 0.0914, 0.0415, and 0.0374 min−1, respectively. It was clear that UV–C light played an important role in the decolorization of melanoidin. The 🞄OH radical for chemical oxidation was generated from the UV–C irradiation of H2O2, while the iron (Fe2+) reaction with H2O2 induced the generation of a hydroxyl intermediate [3,35]. Decolorization occurred during the 🞄OH radical oxidation of melanoidin.
In the current research, first–order, second–order, and Behnajady–Modirshahla–Ghanbery (BMG) reaction kinetics were used to examine the decolorization kinetics of melanoidin using the Fenton, sono–Fenton, photo–Fenton, and sono–photo–Fenton oxidation processes. The individual terms are presented in the equations below:
First–order kinetic model [3,35]:
dc/dt = k1C1
1/Ct = kt
Second–order kinetic model [3,35]:
dc/dt = −k2C2t
ln (C0/Ct) = kt
BMG kinetic models
The BMG kinetic model can be stated as follows [1,3]:
Ct/C0 = 1 − (t/(m + b))
t/(1 − (Ct/C0)) = m + bt
where C0 and Ct are the initial and final melanoidin concentrations (mg/L); k is the rate constant of the first–order model (min−1); t is the reaction time (min); and b and m are two characteristic constants concerning the reaction kinetics and oxidation capacities.
A straight line with an intercept of m and a slope of b was obtained by plotting t/(1 − (Ct/C0)) versus t. The terms m and b can be defined by taking the derivation of Equation (11):
d(Ct/C0)/dt = −(m/(m + bt)2)
When t is very short or moves toward zero, Equation (13) can be written as
d(Ct/C0)/dt = −(1/m)
A higher 1/m value indicates a faster initial decolorization rate. When t is large and approaching infinity, Equation (14) can be written as
1/b = 1 − (C→∞/C0)
The 1/b value indicates the theoretical maximum decolorization fraction equal to the maximum oxidation capacity of the Fenton or photo–Fenton process at the end of the reaction.

4. Discussion

This study investigated the decolorization of melanoidin wastewater using Fenton, sono–Fenton, photo–Fenton, and sono–photo–Fenton processes. The sono–Fenton process at 28 kHz produced the highest color removal efficiency of 93%. The sono–Fenton process clearly produced slightly higher melanoidin decolorization than did the Fenton process. The photo–Fenton process using a UV–C light intensity up to 60 W increased the decolorization from 5467.99 ADMI to 285.53 ADMI (95.32%). The power of the UV–C light and the ultrasonic wave enhanced the decolorization rate of melanoidin wastewater due to the ultrasonic wave and the UV–C light stimulating the generation of 🞄OH from the Fenton reaction. The decolorization of melanoidin wastewater using the sono–photo–Fenton process had an efficiency of more than 90% during the 60 min of the experiment. The kinetic study showed that the correlation coefficient values for the BMG model were mostly higher than those for the first-order and second-order models. The decolorization rates of the four processes were in the order photo–Fenton > sono–photo–Fenton > sono–Fenton > Fenton with decolorization rates of 0.1126, 0.0914, 0.0415, and 0.0374 min−1, respectively. Notably, this research may not only be applied to wastewater treatment in the ethanol production industry but can also be extended to other wastewater treatment applications such as the treatment of palm oil mill effluent, which has similar wastewater characteristics, being dark brown and possessing a high concentration of organic matter [39]. The photo–Fenton processes can also be applied in the decolorization of wheat straw black liquor, which is not easily biodegradable [40].

Author Contributions

Conceptualization, A.W. and C.C.; data curation, K.K.; formal analysis, K.K.; funding acquisition, A.W.; investigation, K.K.; methodology, K.K. and A.K.; project administration, A.W.; resources, A.W.; supervision, A.W.; validation, A.W., C.S. and C.C.; visualization, K.K.; writing—original draft, K.K., C.C., C.S. and A.W.; writing—review and editing, A.K., C.S., C.C. and A.W. All authors have read and agreed to the published version of the manuscript.

Funding

This research was supported by a graduate scholarship at the Suranaree University of Technology, Thailand, contract number 9/2561.

Data Availability Statement

The authors confirm that the data supporting the findings of this study are available within the article.

Acknowledgments

We graciously thank Thanaset Thosdeekoraphat for providing an ultrasonic processor.

Conflicts of Interest

The authors declare no conflict of interest.

References

  1. Tsioptsias, C.; Petridis, D.; Athanasakis, N.; Lemonidis, I.; Deligiannis, A.; Samaras, P. Post-treatment of molasses wastewater by electrocoagulation and process optimization through response surface analysis. J. Environ. Manag. 2015, 164, 104–113. [Google Scholar] [CrossRef] [PubMed]
  2. Chandra, R.; Bharagava, R.N.; Rai, V. Melanoidins as major colourant in sugarcane molasses based distillery effluent and its degradation. Bioresour. Technol. 2008, 99, 4648–4660. [Google Scholar] [CrossRef]
  3. Tokumura, M.; Ohta, A.; Znad, H.T.; Kawase, Y. UV light assisted decolorization of dark brown colored coffee effluent by photo–Fenton reaction. Water Res. 2006, 40, 3775–3784. [Google Scholar] [CrossRef] [PubMed]
  4. Pant, D.; Adholeya, A. Biological approaches for treatment of distillery wastewater: A review. Bioresour. Technol. 2007, 98, 2321–2334. [Google Scholar] [CrossRef] [PubMed]
  5. Patel, A.; Pawar, R.; Mishra, S.; Tewari, A. Exploitation of marine cyanobacteria for removal of colour from distillery effluent. Indian J. Environ. Prot. 2001, 21, 1118–1121. [Google Scholar]
  6. Alavijeh, H.N.; Sadeghi, M.; Kashani, M.R.K.; Moheb, A. Efficient Chemical Coagulation-Electrocoagulation-Membrane Filtration Integrated Systems for Baker’s Yeast Wastewater Treatment: Experimental and Economic Evaluation. Clean. Chem. Eng. 2022, 3, 100032. [Google Scholar] [CrossRef]
  7. Kobya, M.; Delipinar, S. Treatment of the baker’s yeast wastewater by electrocoagulation. J. Hazard. Mater. 2008, 154, 1133–1140. [Google Scholar] [CrossRef] [PubMed]
  8. Liakos, T.I.; Lazaridis, N.K. Melanoidin removal from molasses effluents by adsorption. J. Water Process. Eng. 2016, 10, 156–164. [Google Scholar] [CrossRef]
  9. Kobya, M.; Gengec, E. Decolourization of melanoidins by a electrocoagulation process using aluminium electrodes. Environ. Technol. 2012, 33, 2429–2438. [Google Scholar] [CrossRef]
  10. Crini, G.; Lichtfouse, E. Advantages and disadvantages of techniques used for wastewater treatment. Environ. Chem. Lett. 2018, 17, 145–155. [Google Scholar] [CrossRef]
  11. Simaratanamongkol, A.; Thiravetyan, P. Decolorization of melanoidin by activated carbon obtained from bagasse bottom ash. J. Food Eng. 2010, 96, 14–17. [Google Scholar] [CrossRef]
  12. Brillas, E.; Sirés, I.; Oturan, M.A. Electro–Fenton Process and Related Electrochemical Technologies Based on Fenton’s Reaction Chemistry. Chem. Rev. 2009, 109, 6570–6631. [Google Scholar] [CrossRef]
  13. Behnajady, M.; Modirshahla, N.; Ghanbary, F. A kinetic model for the decolorization of C.I. Acid Yellow 23 by Fenton process. J. Hazard. Mater. 2007, 148, 98–102. [Google Scholar] [CrossRef]
  14. Ertugay, N.; Acar, F.N. Acar, Removal of COD and color from Direct Blue 71 azo dye wastewater by Fenton’s oxidation: Kinetic study. Arab. J. Chem. 2017, 10, S1158–S1163. [Google Scholar] [CrossRef]
  15. Pala, A.; Erden, G. Decolorization of a baker’s yeast industry effluent by Fenton oxidation. J. Hazard. Mater. 2005, 127, 141–148. [Google Scholar] [CrossRef] [PubMed]
  16. Tunç, S.; Gürkan, T.; Duman, O. On-line spectrophotometric method for the determination of optimum operation parameters on the decolorization of Acid Red 66 and Direct Blue 71 from aqueous solution by Fenton process. Chem. Eng. J. 2012, 181–182, 431–442. [Google Scholar] [CrossRef]
  17. Toor, U.A.; Duong, T.T.; Ko, S.-Y.; Hussain, F.; Oh, S.-E. Optimization of Fenton process for removing TOC and color from swine wastewater using response surface method (RSM). J. Environ. Manag. 2021, 279, 111625. [Google Scholar] [CrossRef]
  18. Ravichandran, L.; Selvam, K.; Swaminathan, M. Photo–Fenton defluoridation of pentafluorobenzoic acid with UV–C light. J. Photochem. Photobiol. A Chem. 2007, 188, 392–398. [Google Scholar] [CrossRef]
  19. Mahdad, F.; Younesi, H.; Bahramifar, N.; Hadavifar, M. Optimization of Fenton and photo–Fenton–based advanced oxidation processes for post–treatment of composting leachate of municipal solid waste by an activated sludge process. KSCE J. Civ. Eng. 2015, 20, 2177–2188. [Google Scholar] [CrossRef]
  20. Catalkaya, E.C.; Sengul, F. Application of Box–Wilson experimental design method for the photodegradation of bakery’s yeast industry with UV/H2O2 and UV/H2O2/Fe(II) process. J. Hazard. Mater. 2006, 128, 201–207. [Google Scholar] [CrossRef]
  21. Asaithambi, P.; Saravanathamizhan, R.; Matheswaran, M. Comparison of treatment and energy efficiency of advanced oxidation processes for the distillery wastewater. Int. J. Environ. Sci. Technol. 2014, 12, 2213–2220. [Google Scholar] [CrossRef]
  22. Ammar, H.B. Sono–Fenton process for metronidazole degradation in aqueous solution: Effect of acoustic cavitation and peroxydisulfate anion. Ultrason. Sonochem. 2016, 33, 164–169. [Google Scholar] [CrossRef]
  23. Basturk, E.; Karatas, M. Advanced oxidation of Reactive Blue 181 solution: A comparison between Fenton and Sono–Fenton process. Ultrason. Sonochem. 2014, 21, 1881–1885. [Google Scholar] [CrossRef]
  24. Echavarría, A.P.; Pagán, J.; Ibarz, A. Melanoidins Formed by Maillard Reaction in Food and Their Biological Activity. Food Eng. Rev. 2012, 4, 203–223. [Google Scholar] [CrossRef]
  25. Wang, H.-Y.; Qian, H.; Yao, W.-R. Melanoidins produced by the Maillard reaction: Structure and biological activity. Food Chem. 2011, 128, 573–584. [Google Scholar] [CrossRef]
  26. Kotsiopoulou, N.G.; Liakos, T.I.; Lazaridis, N.K. Melanoidin chromophores and betaine osmoprotectant separation from aqueous solutions. J. Mol. Liq. 2016, 216, 496–502. [Google Scholar] [CrossRef]
  27. Lucas, M.S.; Peres, J.A. Decolorization of the azo dye Reactive Black 5 by Fenton and photo-Fenton oxidation. Dye. Pigment. 2006, 71, 236–244. [Google Scholar] [CrossRef]
  28. Li, R.; Yang, C.; Chen, H.; Zeng, G.; Yu, G.; Guo, J. Removal of triazophos pesticide from wastewater with Fenton reagent. J. Hazard. Mater. 2009, 167, 1028–1032. [Google Scholar] [CrossRef]
  29. Raji, M.; Mirbagheri, S.A.; Ye, F.; Dutta, J. Nano zero-valent iron on activated carbon cloth support as Fenton-like catalyst for efficient color and COD removal from melanoidin wastewater. Chemosphere 2021, 263, 127945. [Google Scholar] [CrossRef]
  30. Bouasla, C.; Samar, M.E.-H.; Ismail, F. Degradation of methyl violet 6B dye by the Fenton process. Desalination 2010, 254, 35–41. [Google Scholar] [CrossRef]
  31. Pokhrel, N.; Vabbina, P.K.; Pala, N. Sonochemistry: Science and Engineering. Ultrason. Sonochem. 2016, 29, 104–128. [Google Scholar] [CrossRef] [PubMed]
  32. Merouani, S.; Hamdaoui, O.; Rezgui, Y.; Guemini, M. Effects of ultrasound frequency and acoustic amplitude on the size of sonochemically active bubbles—Theoretical study. Ultrason. Sonochem. 2013, 20, 815–819. [Google Scholar] [CrossRef] [PubMed]
  33. Brotchie, A.; Grieser, F.; Ashokkumar, M. Effect of Power and Frequency on Bubble–Size Distributions in Acoustic Cavitation. Phys. Rev. Lett. 2009, 102, 084302. [Google Scholar] [CrossRef] [PubMed]
  34. Mason, T.J.; Cobley, A.J.; Graves, J.E.; Morgan, D. New evidence for the inverse dependence of mechanical and chemical effects on the frequency of ultrasound. Ultrason. Sonochem. 2011, 18, 226–230. [Google Scholar] [CrossRef]
  35. Thanapimmetha, A.; Srinophakun, P.; Amat, S.; Saisriyoot, M. Decolorization of molasses–based distillery wastewater by means of pulse electro–Fenton process. J. Environ. Chem. Eng. 2017, 5, 2305–2312. [Google Scholar] [CrossRef]
  36. Barreto, F.; Santana, C.S.; Aguiar, A. Behavior of dihydroxybenzenes and gallic acid on the Fenton–based decolorization of dyes. Desalin. Water Treat. 2016, 57, 431–439. [Google Scholar] [CrossRef]
  37. Malik, P.; Saha, S. Oxidation of direct dyes with hydrogen peroxide using ferrous ion as catalyst. Sep. Purif. Technol. 2003, 31, 241–250. [Google Scholar] [CrossRef]
  38. Sidney Santana, C.; Nicodemos Ramos, M.D.; Vieira Velloso, C.C.; Aguiar, A. Kinetic Evaluation of Dye Decolorization by Fenton Processes in the Presence of 3-Hydroxyanthranilic Acid. Int. J. Environ. Res. Public Health 2019, 16, 1602. [Google Scholar] [CrossRef]
  39. Sani, S.; Dashti, A.F.; Adnan, R. Applications of Fenton oxidation processes for decontamination of palm oil mill effluent: A review. Arab. J. Chem. 2020, 13, 7302–7323. [Google Scholar] [CrossRef]
  40. Torrades, F.; Saiz, S.; Garcia–Hortal, J.A.; García–Montaño, J. Degradation of Wheat Straw Black Liquor by Fenton and Photo–Fenton Processes. Environ. Eng. Sci. 2008, 25, 92–98. [Google Scholar] [CrossRef]
Figure 1. Proposed carbohydrate–based melanoidin structure R: H, Glc, (Glc)n [25].
Waste 01 00027 g001
Figure 2. Effect of initial Fe2+ concentration on decolorization of melanoidin wastewater (initial melanoidin = 10,000 mg/L, H2O2 = 0.375 mol/L, pH = 3, reaction time = 90 min). (a) Color removal efficiency vs. reaction time where ● is Fe2+ = 0.005 mol/L, ▲ is Fe2+ = 0.0075 mol/L, □ is Fe2+ = 0.01 mol/L, ♦ is Fe2+ = 0.025 mol/L, ✕ is Fe2+ = 0.05 mol/L, ○ is Fe2+ = 0.075 mol/L, and ⯀ is only Fe2+ (0.005 mol/L). (b) Color removal efficiency vs. initial Fe2+ dosage at 90 min.
Waste 01 00027 g002
Figure 3. Effect of initial H2O2 concentration on decolorization of melanoidin wastewater (initial melanoidin = 10,000 mg/L, Fe2+ = 0.05 mol/L, pH = 3, reaction time = 90 min). (a) Color removal efficiency vs. reaction time where ● is H2O2 = 0.06 mol/L, ▲ is H2O2 = 0.125 mol/L, □ is H2O2 = 0.25 mol/L, ♦ is H2O2 = 0.375 mol/L, ○ is H2O2 = 0.5 mol/L, ✕ is H2O2 = 0.75 mol/L, and ∆ is only H2O2 (0.375 mol/L). (b) Color removal efficiency vs. initial H2O2 concentration at 90 min.
Waste 01 00027 g003
Figure 4. Effect of solution pH on decolorization of melanoidin wastewater (initial melanoidin = 10,000 mg/L, H2O2 = 0.375 mol/L, Fe2+ = 0.01 mol/L, reaction time = 90 min). (a) Color removal efficiency vs. reaction time where ● is pH 3, ⯀ is pH 4, ▲ is pH 5, ✕ is pH 6, ♦ is pH 7, and ○ is pH 8. (b) Color removal efficiency vs. initial pH at 90 min.
Waste 01 00027 g004
Figure 5. Effect of ultrasonic waves combined with Fenton process on decolorization of melanoidin wastewater (initial melanoidin = 10,000 mg/L, Fe2+ = 0.005 mol/L, H2O2 = 0.1875 mol/L, pH = 7, reaction time = 90 min) (where SF is sono–Fenton process).
Waste 01 00027 g005
Figure 6. Effect of UV–C combination with Fenton process on decolorization of melanoidin wastewater (initial melanoidin = 10,000 mg/L, Fe2+ = 0.005 mol/L, H2O2 = 0.1875 mol/L, pH = 7, reaction time = 90 min) (where PF is photo–Fenton process).
Waste 01 00027 g006
Figure 7. Effect of ultrasonic waves and UV–C in combination with Fenton process (initial melanoidin = 10,000 mg/L, Fe2+ = 0.005 mol/L, H2O2 = 0.1875 mol/L, pH = 7, reaction time = 90 min) (where SF@40 kHz is sono–Fenton process at 40 kHz and PF@60 W is photo–Fenton process at 60 W).
Waste 01 00027 g007
Figure 8. Plot of kinetic model for Fenton process and sono–Fenton process at 40 kHz, for photo–Fenton process at 60 W, and for sono–photo–Fenton process. (a) First –order kinetic model; (b) second–order kinetic model; (c) BMG kinetic model.
Waste 01 00027 g008
Table 1. Kinetic values for Fenton, sono–Fenton, photo–Fenton, and sono–photo–Fenton decolorization of melanoidin wastewater.
ProcessFirst-OrderSecond-OrderBMG
k1 1 (min−1)R2k1 1 (min−1)R2m 2b 3R21/m 41/b 5
Fenton0.01820.96590.04700.997426.76501.34340.98890.03740.7444
SF @ 40 kHz.0.02700.98530.11080.954424.10701.16080.97980.04150.8615
PF @ 60 W0.02960.89670.19980.93138.88211.38160.98390.11260.7238
SPF @ 40 kHz and 60 W0.02420.73430.12060.496910.93501.43900.96430.09140.6949
1 k1 is rate constant of the first– and second–order models (slope). 2 m is constant in the linear equation related to the reaction rate (y–intercept). 3 b is constant in the linear equation related to the oxidative capacity (slope). 4 1/m is reaction rate when t is short or moves toward zero. 5 1/b is maximum oxidation capacity when t is large and approaching infinity.
Disclaimer/Publisher’s Note: The statements, opinions and data contained in all publications are solely those of the individual author(s) and contributor(s) and not of MDPI and/or the editor(s). MDPI and/or the editor(s) disclaim responsibility for any injury to people or property resulting from any ideas, methods, instructions or products referred to in the content.

