
Facts and Figures on Aspects of Waste Management in Middle East and North Africa Region
Abstract
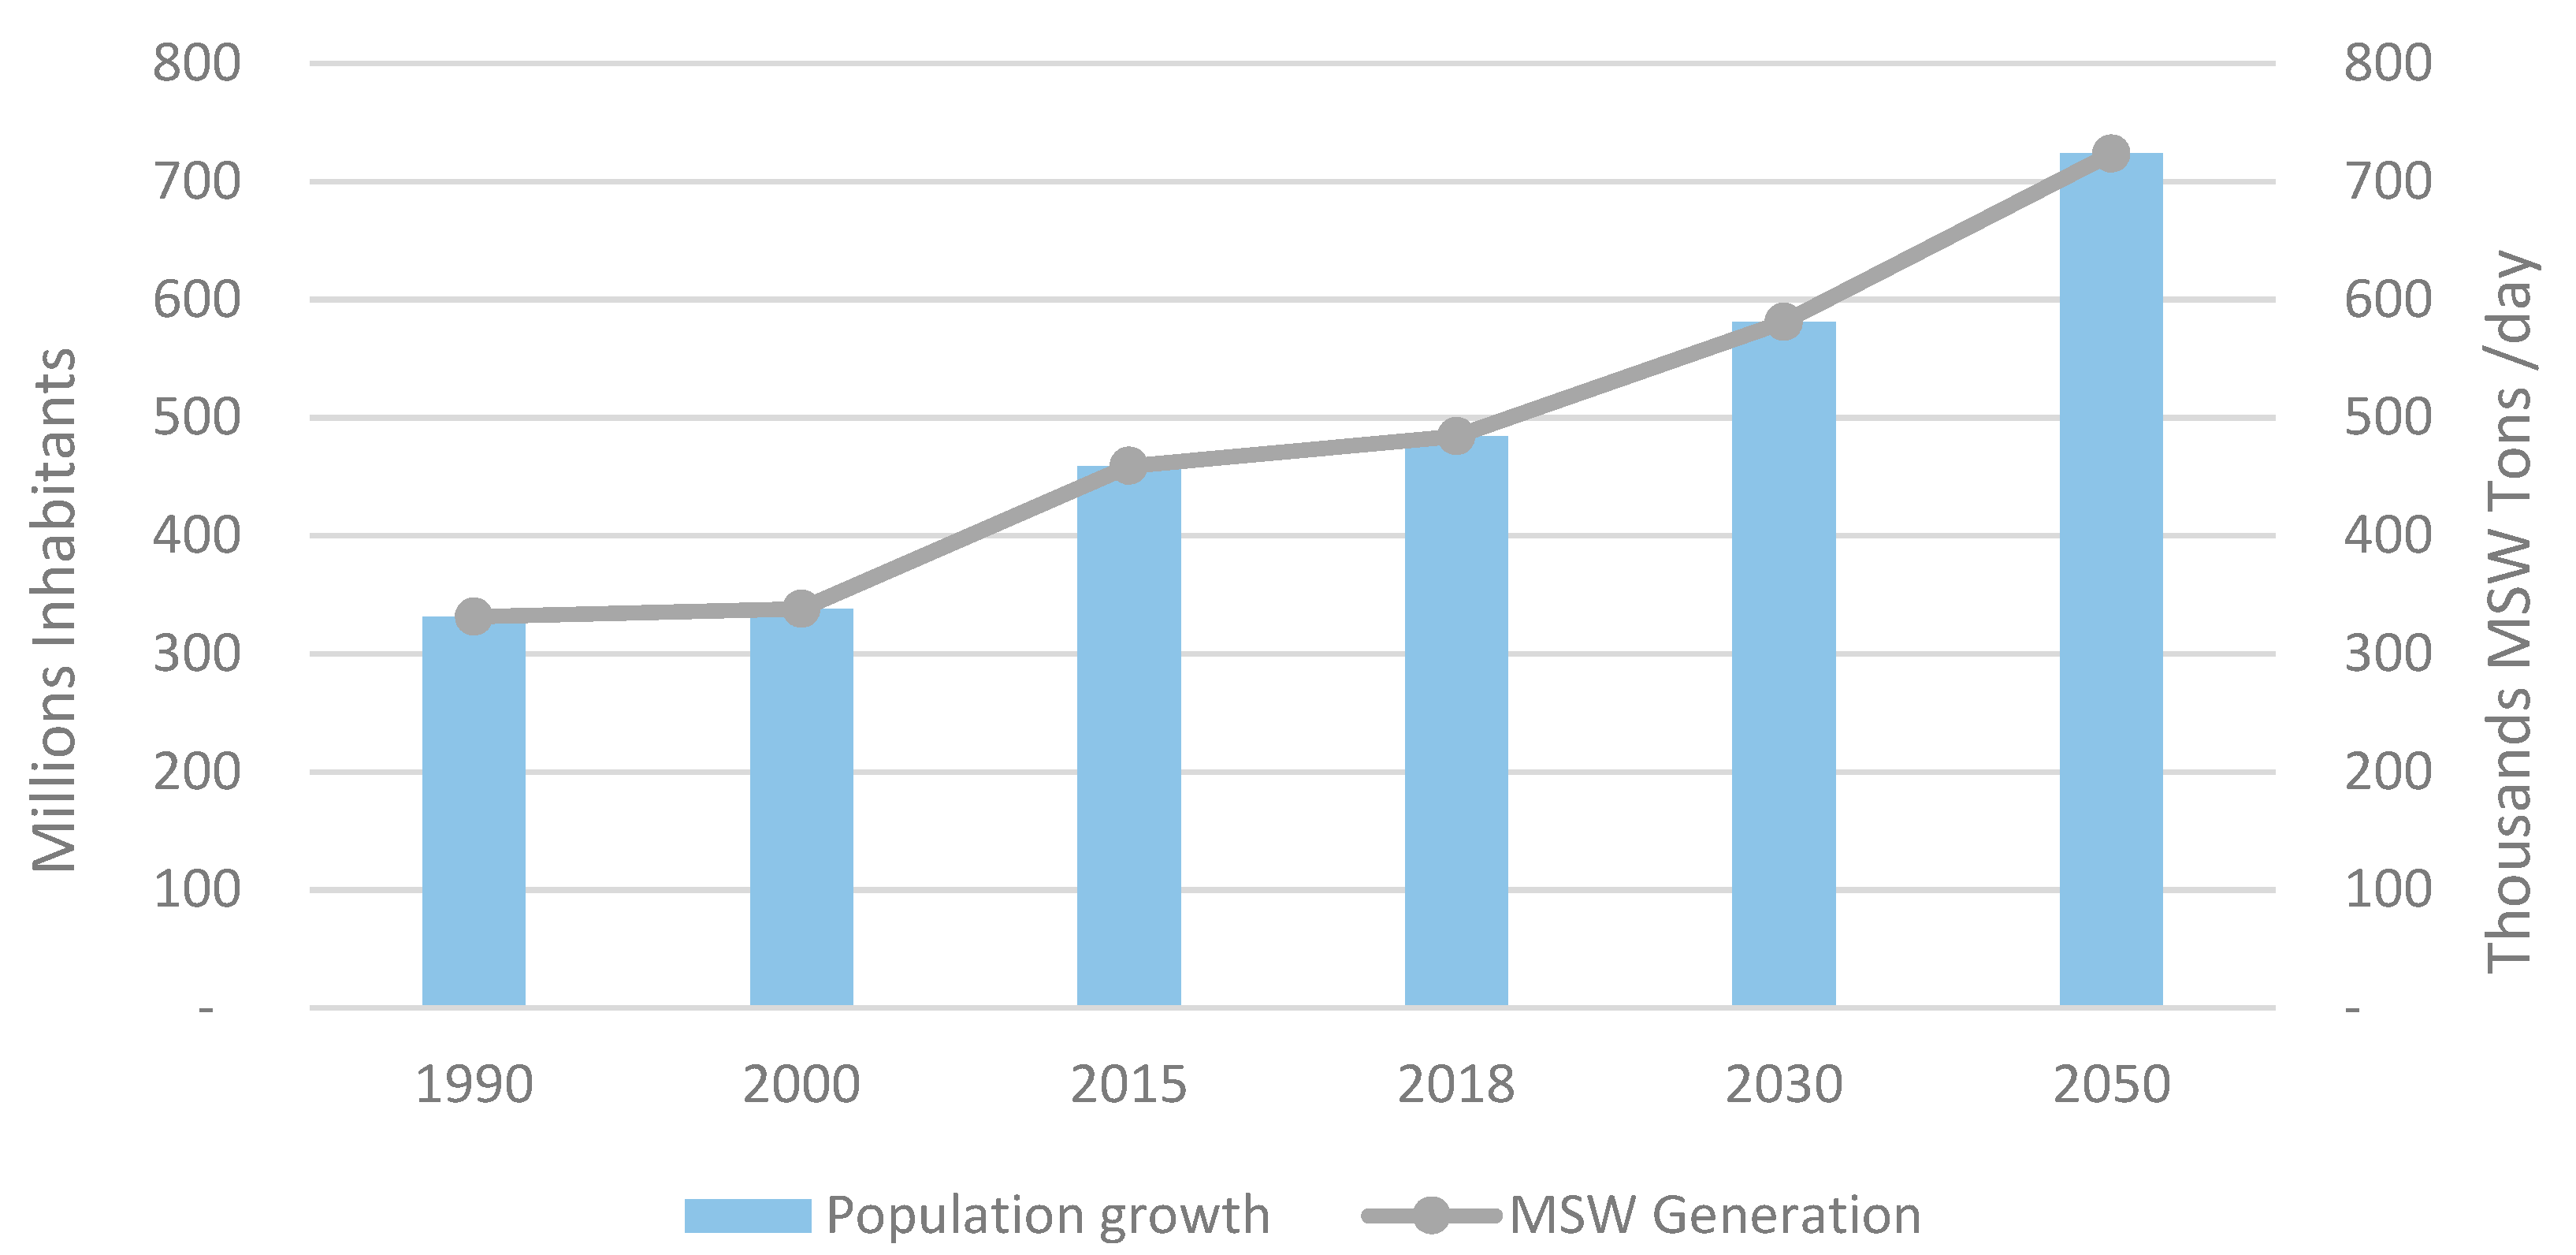
:1. Introduction
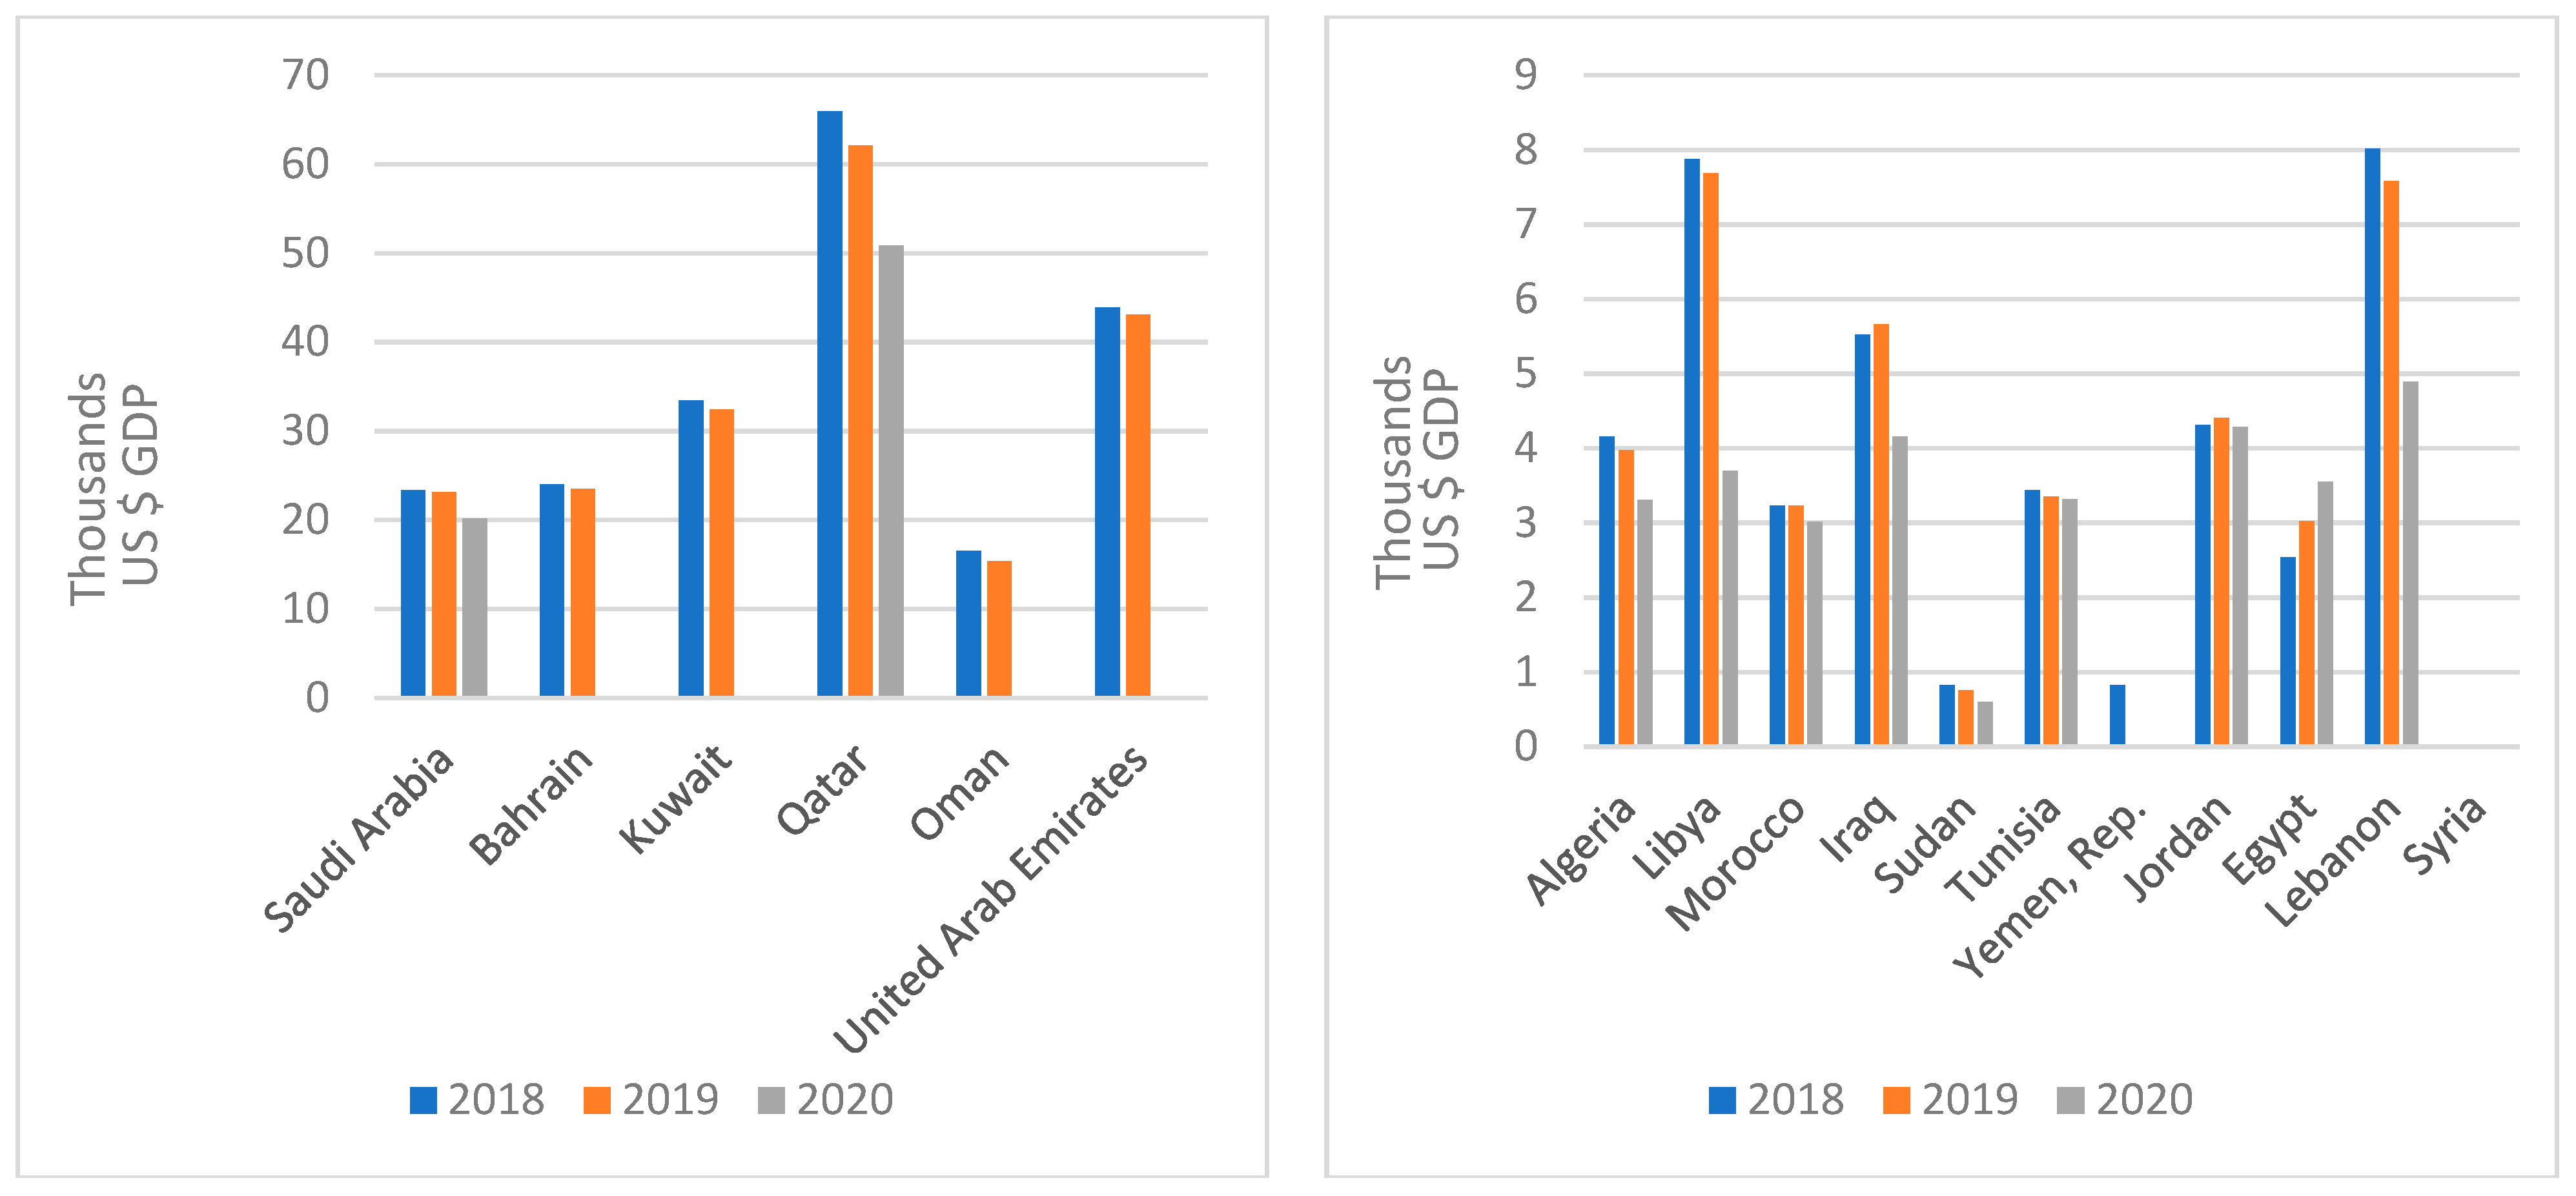
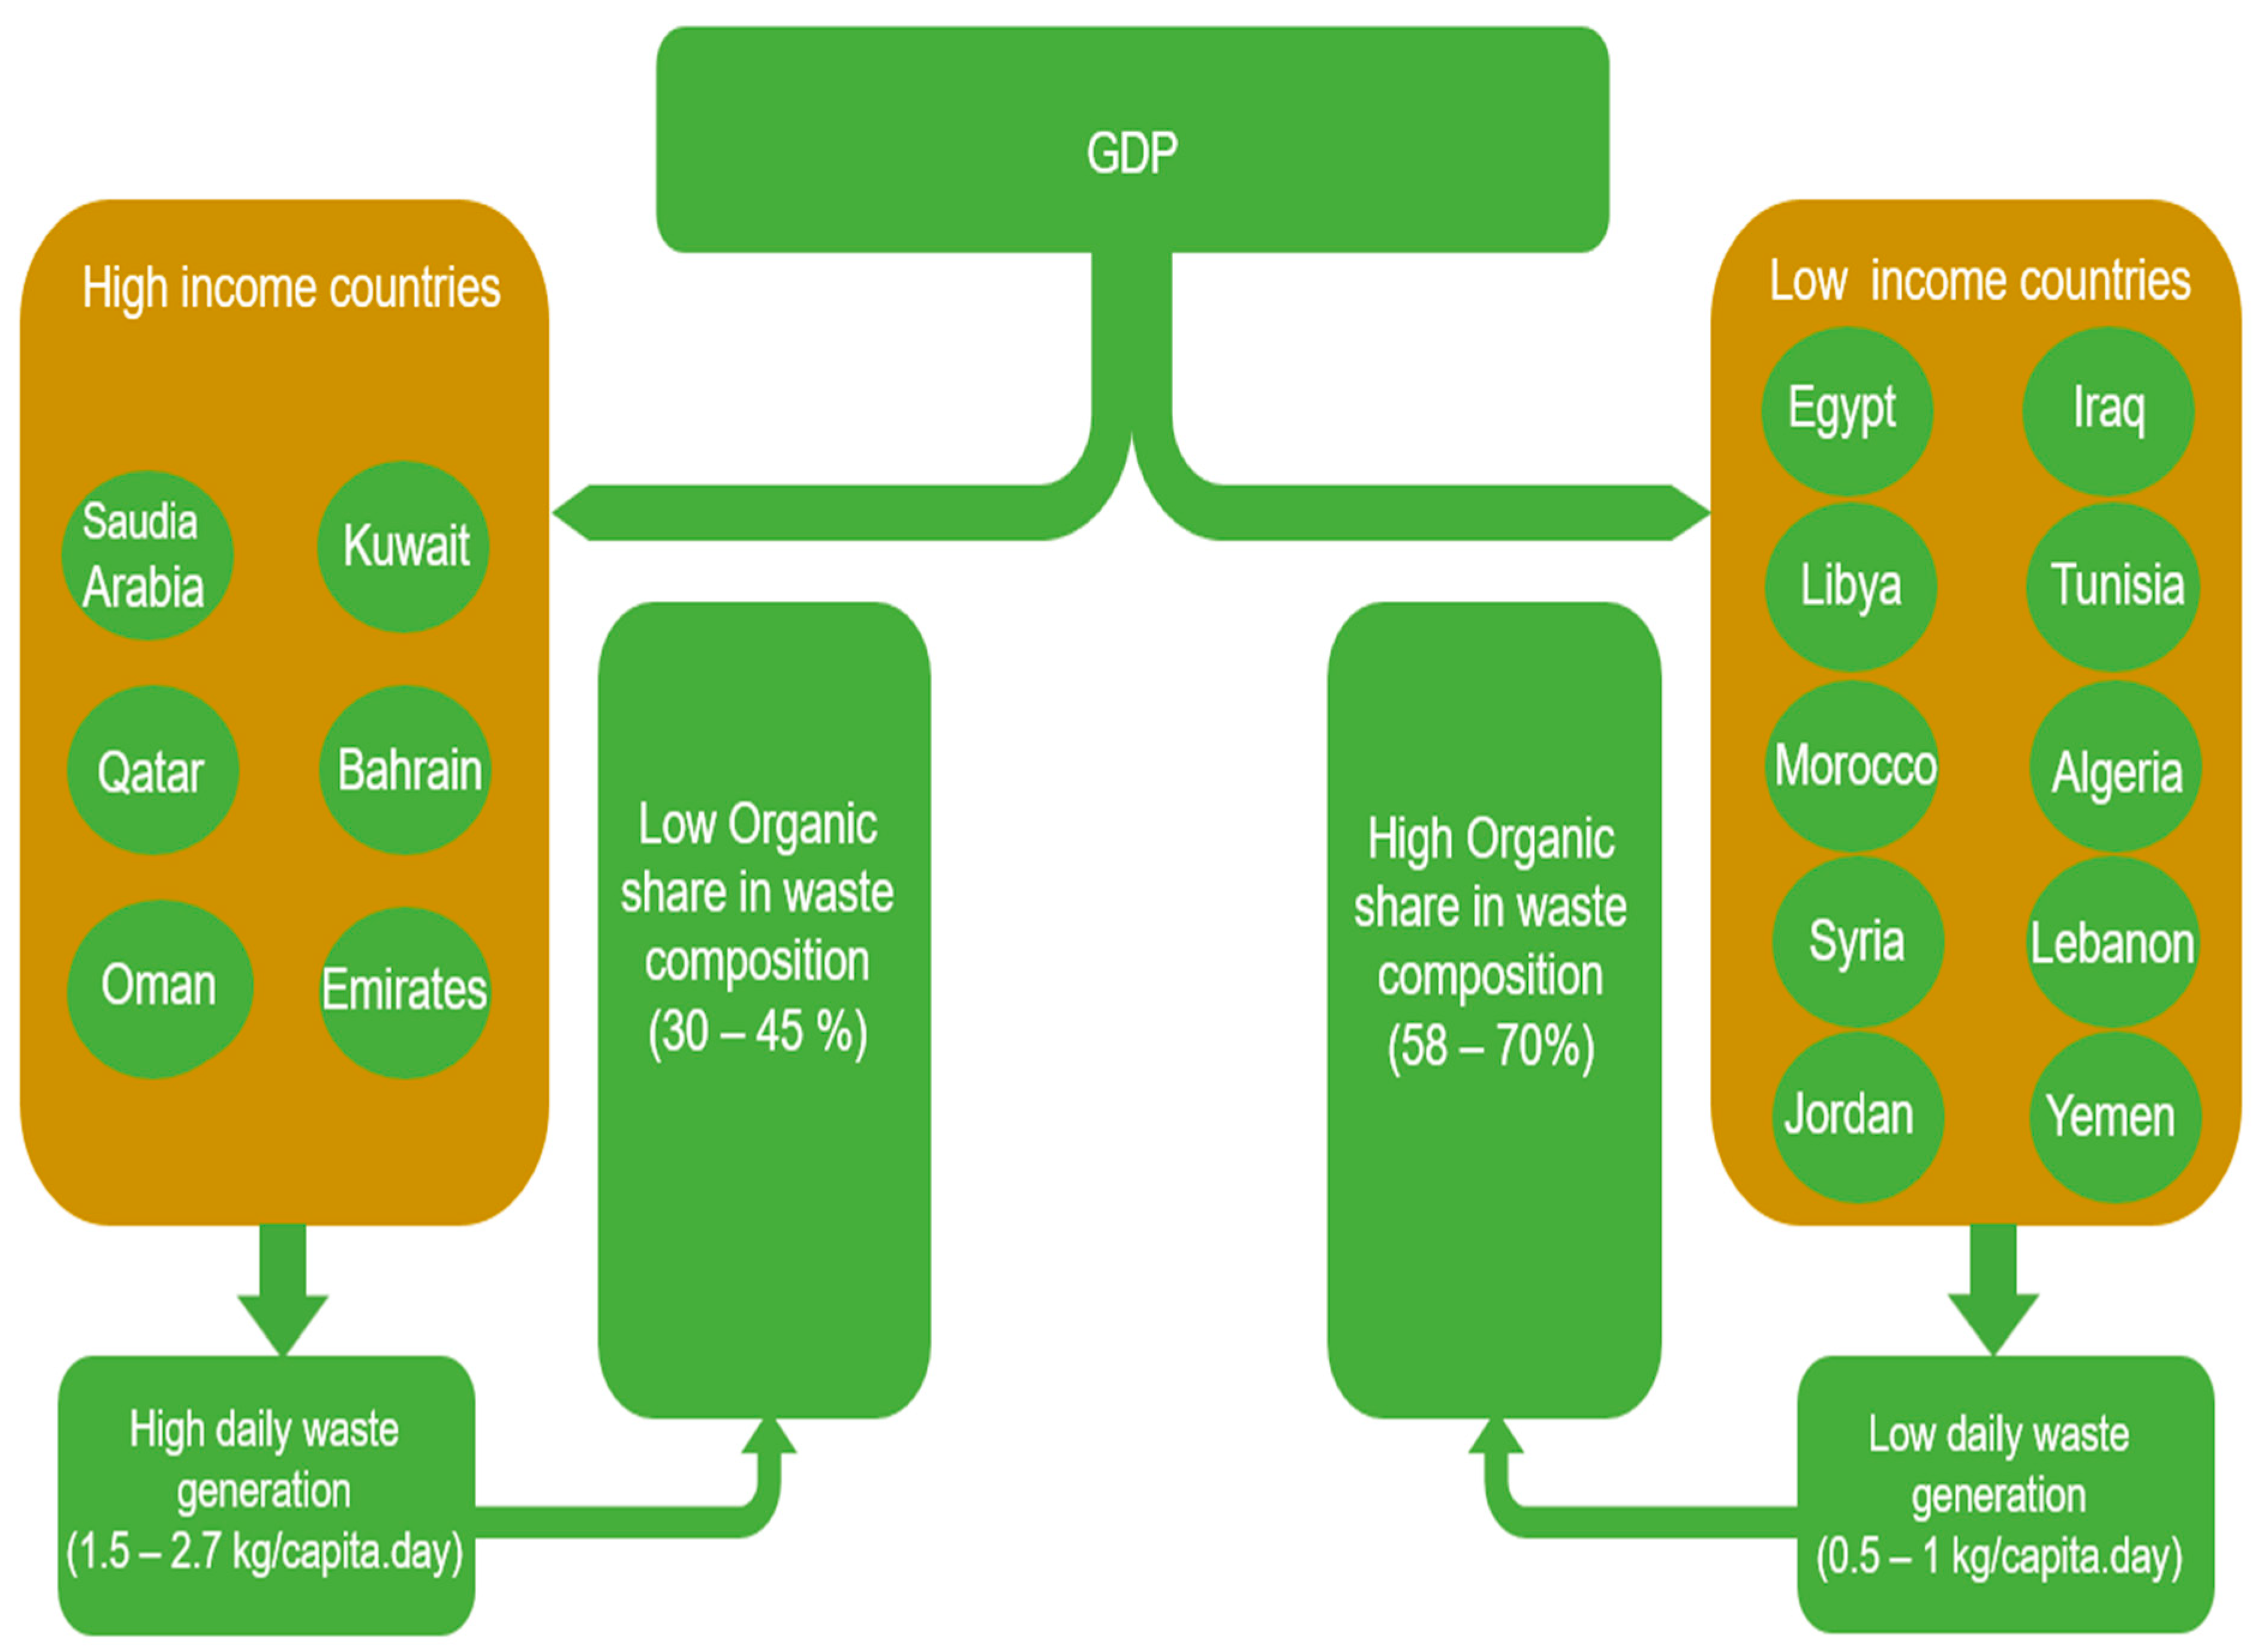
2. Gross Domestic Product
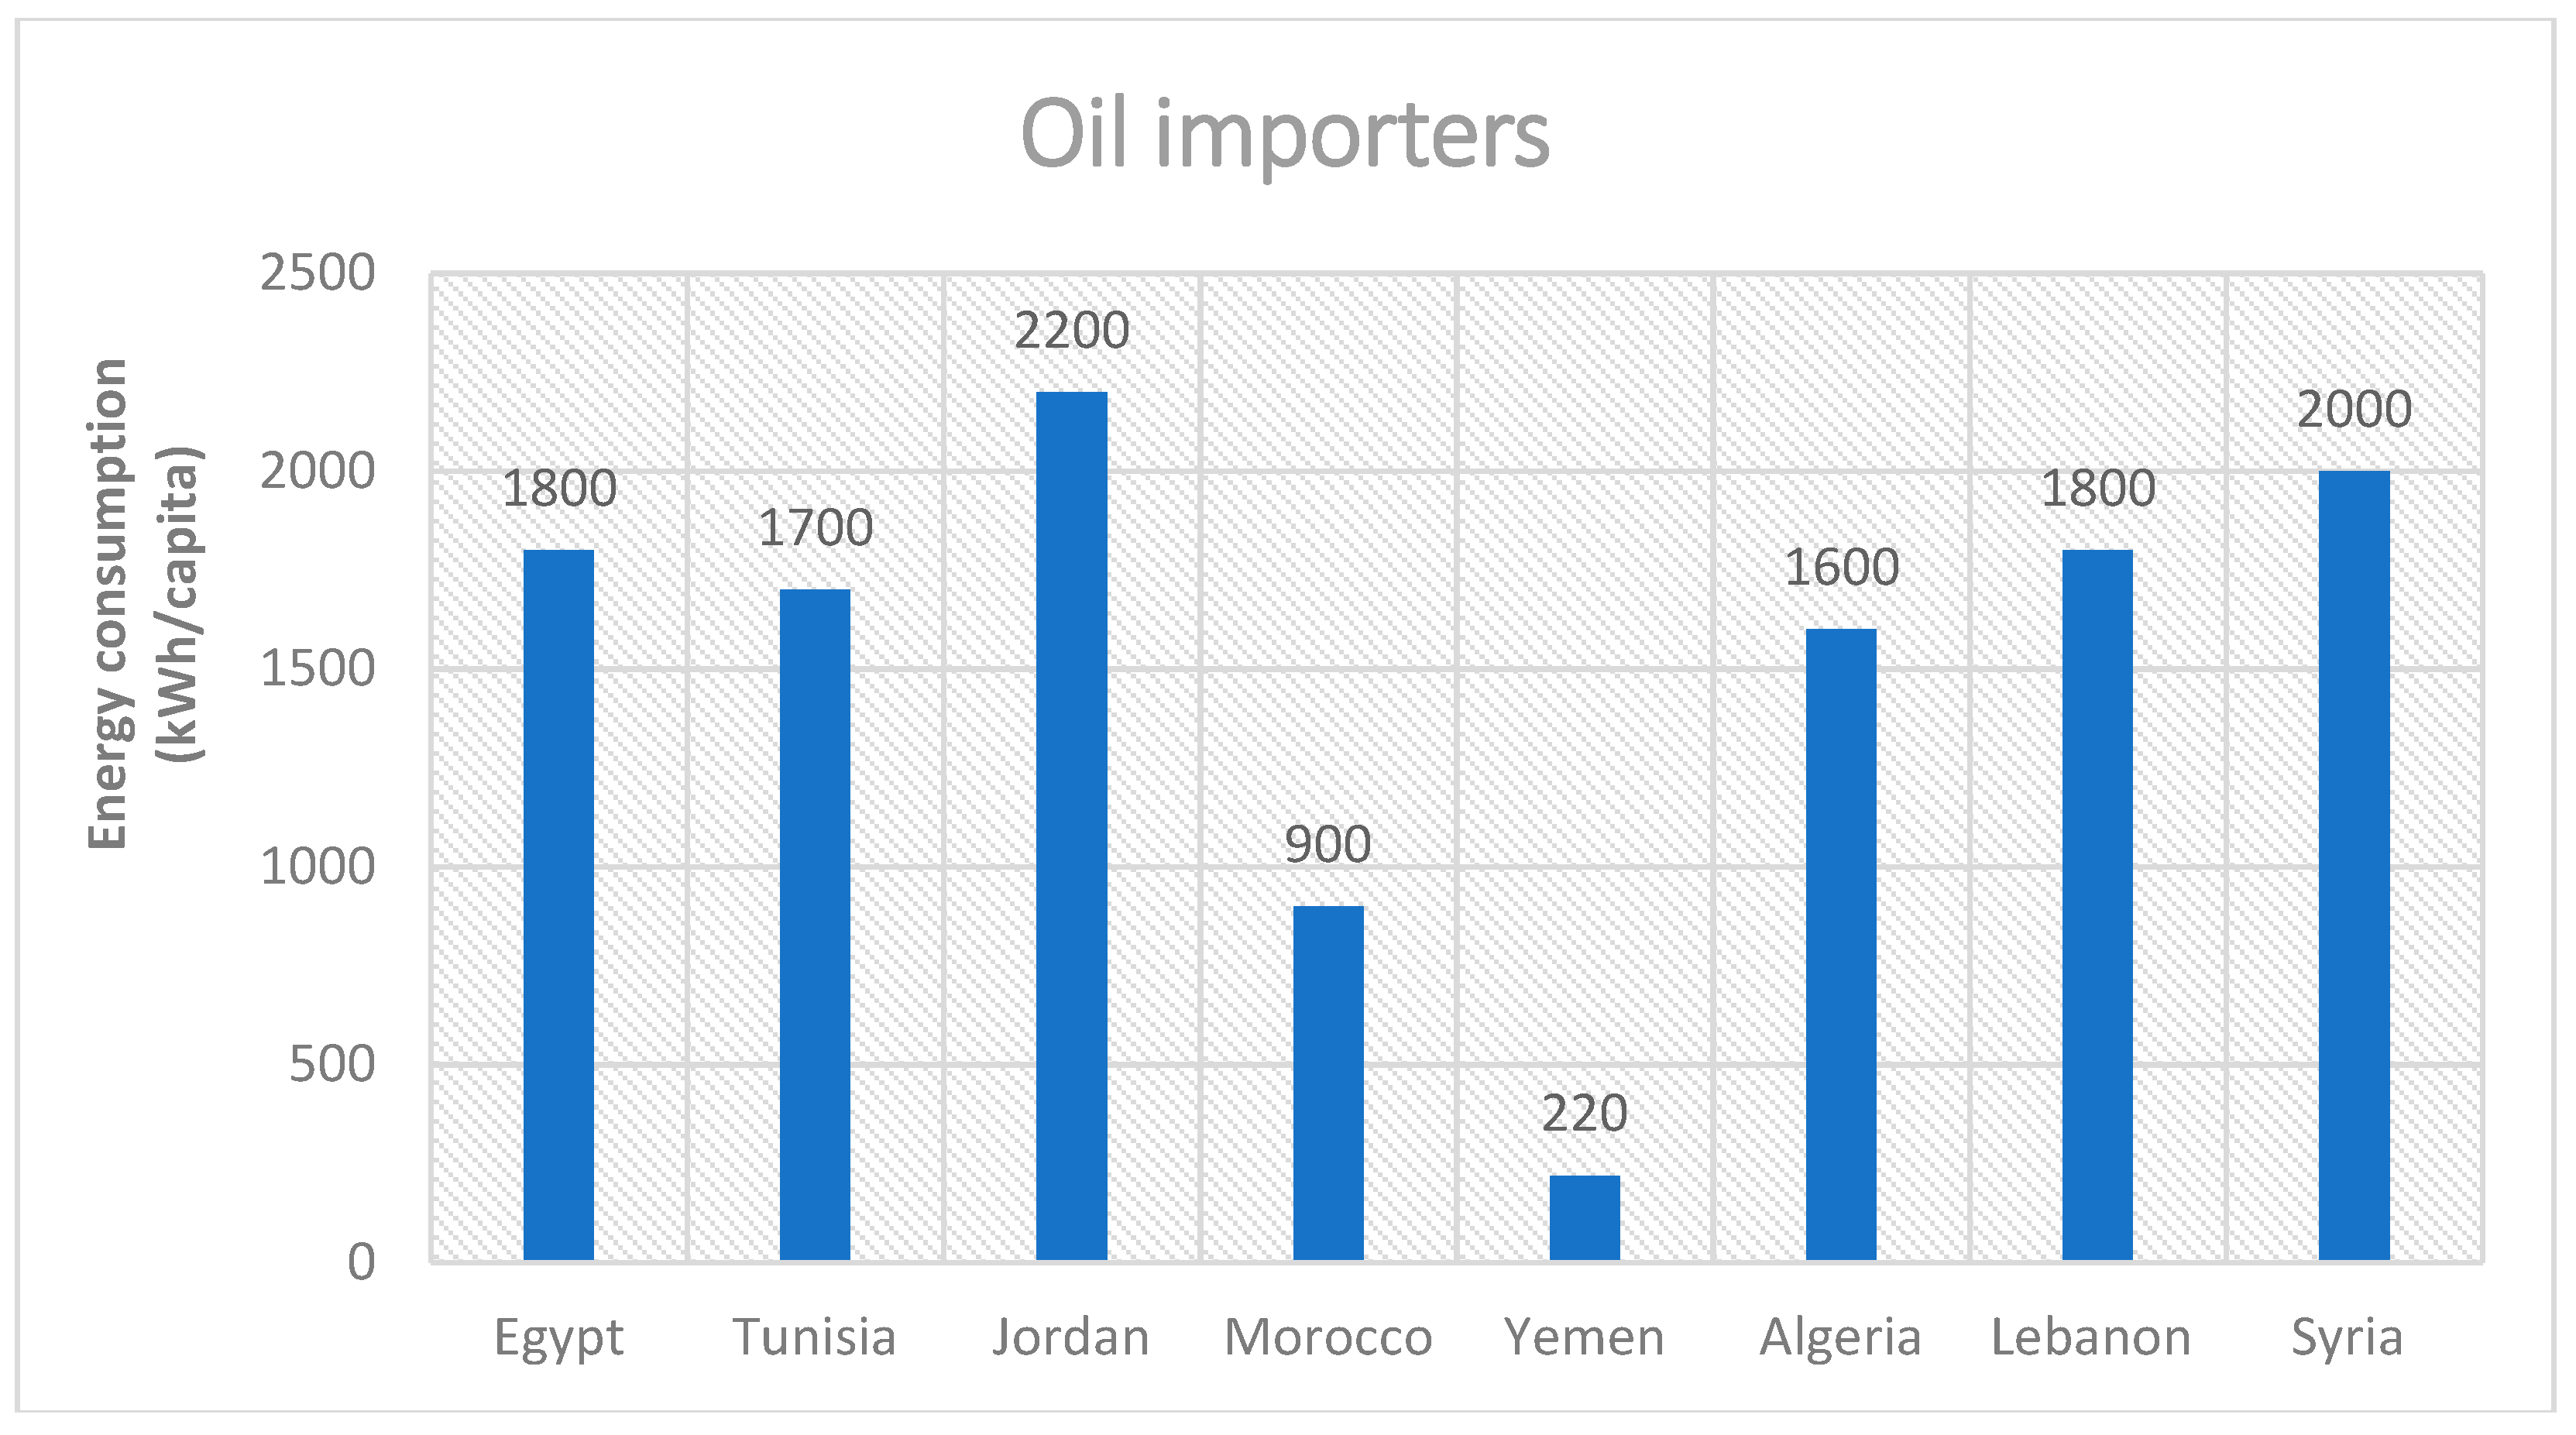
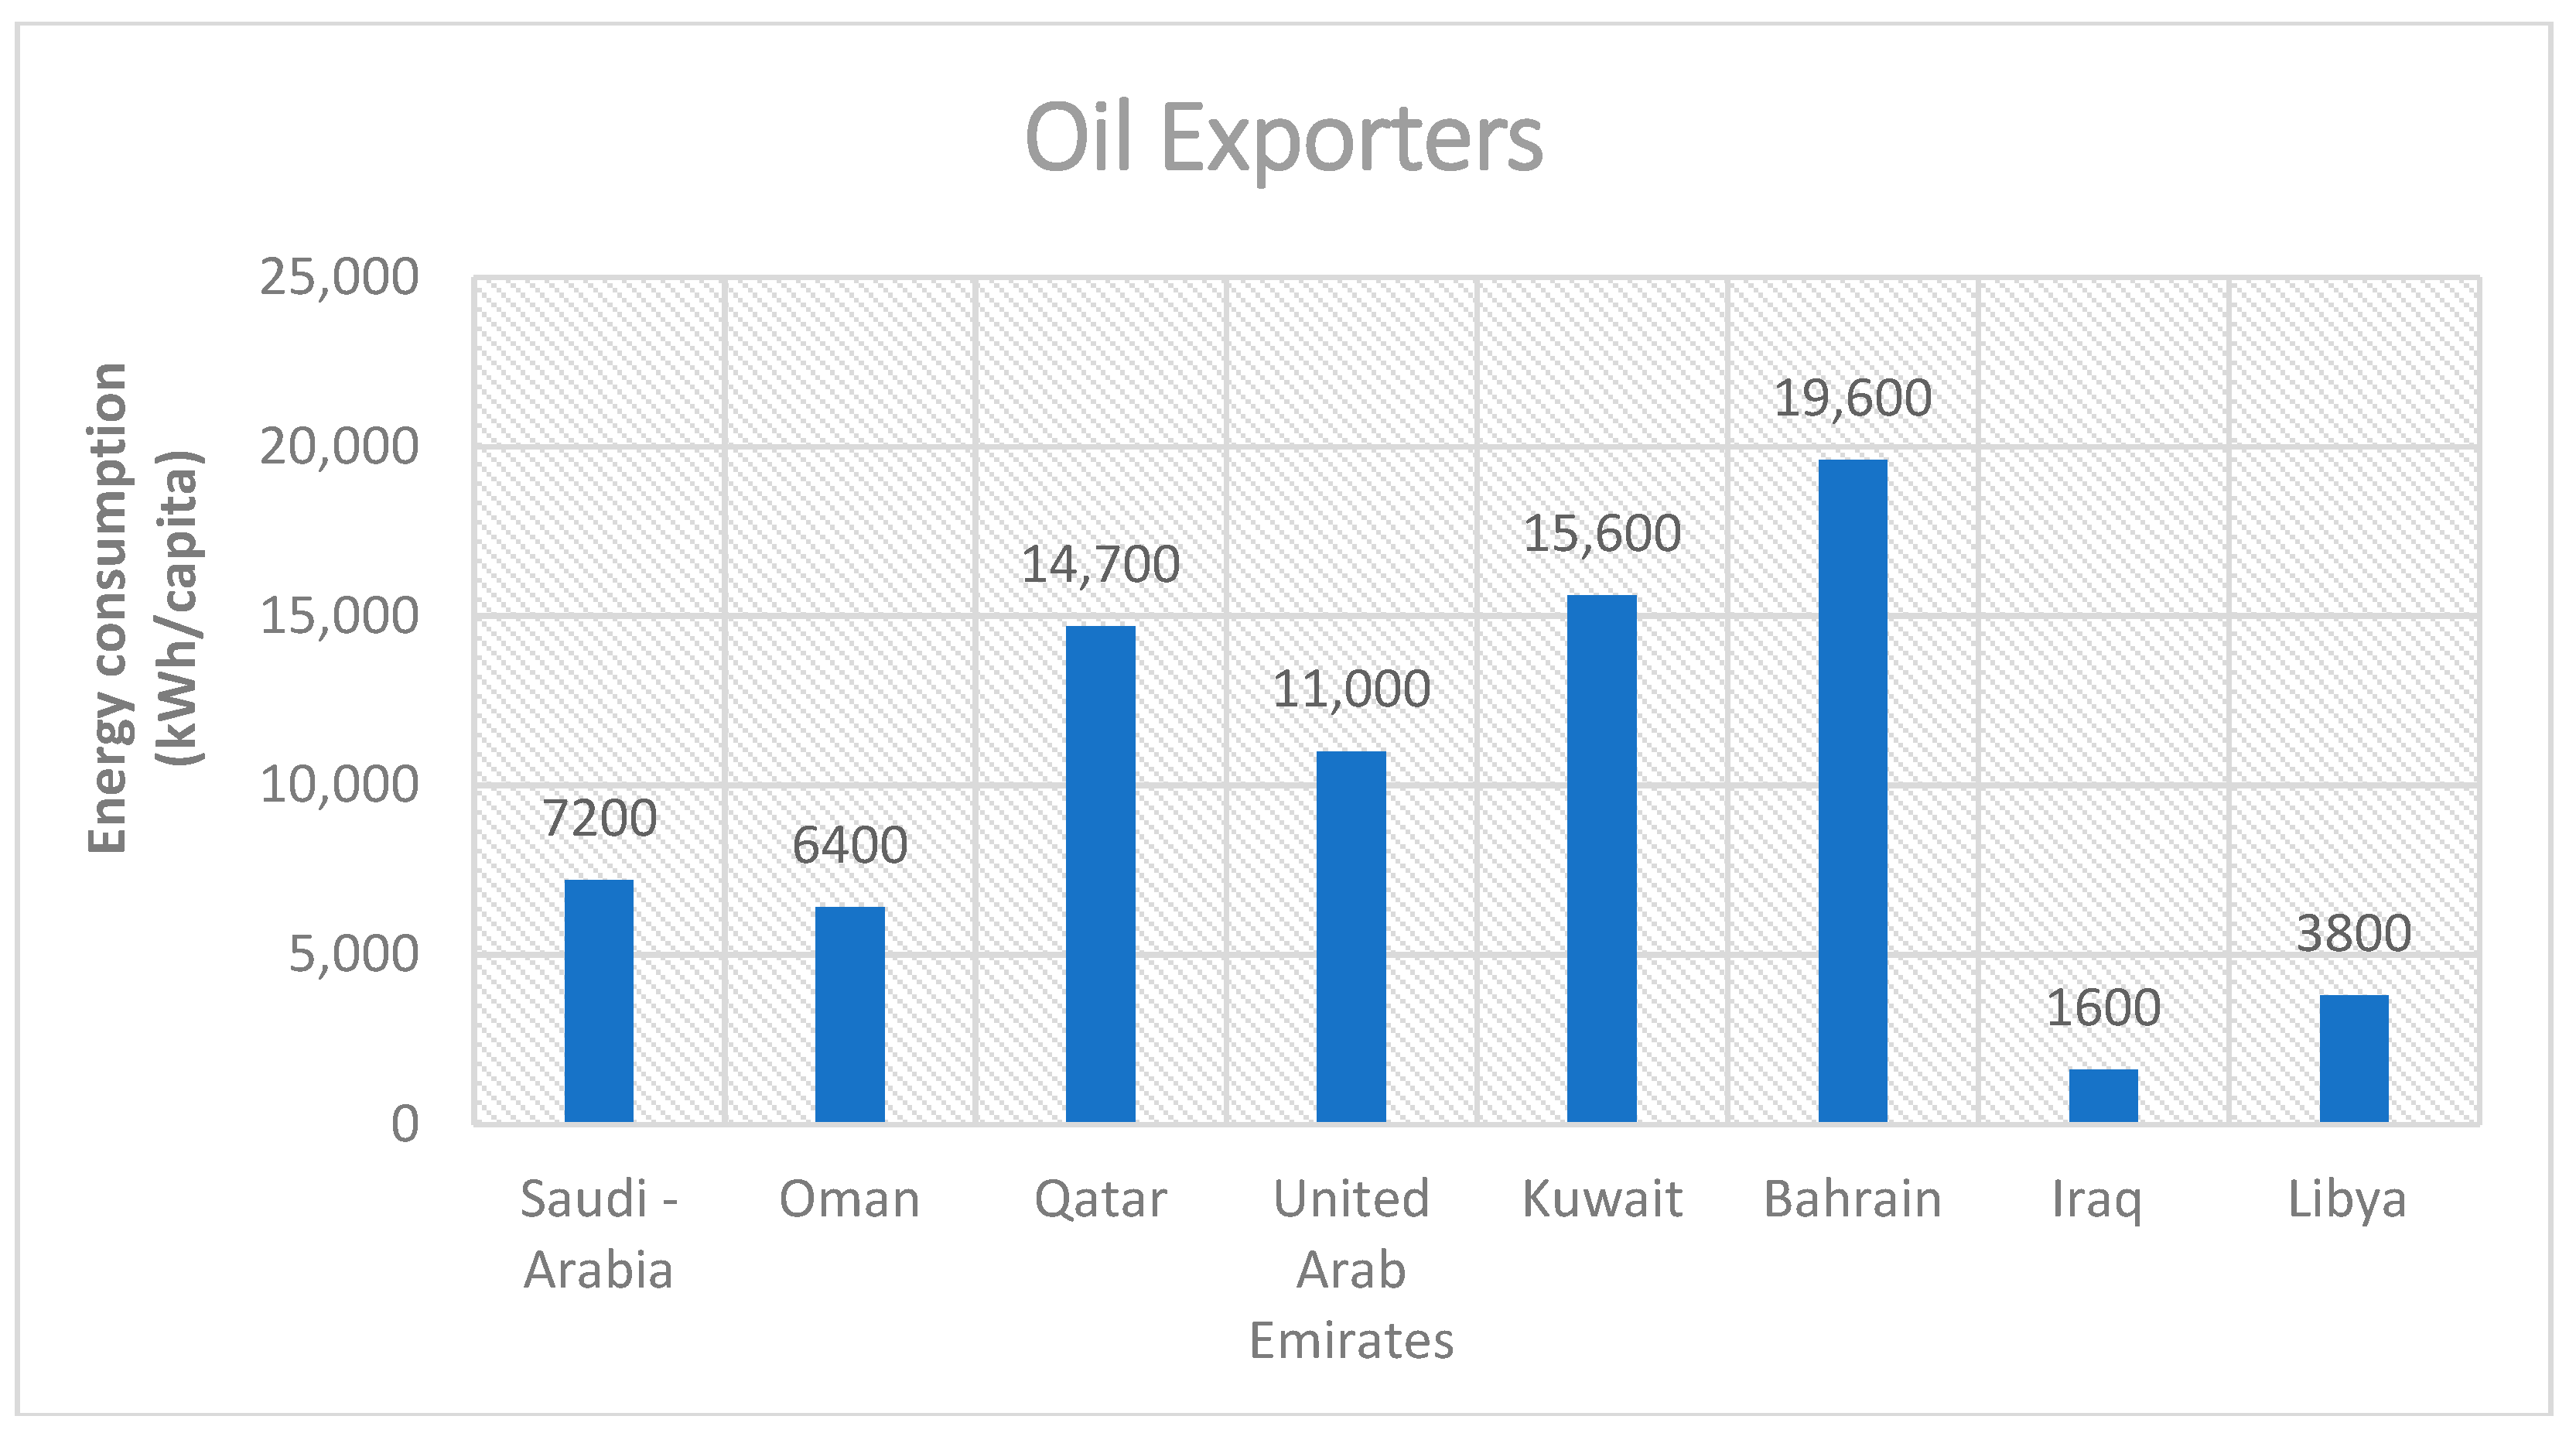
3. Energy Consumption
4. Higher Energy Consumption Than the Global Average and Dependency on Fossil Fuel
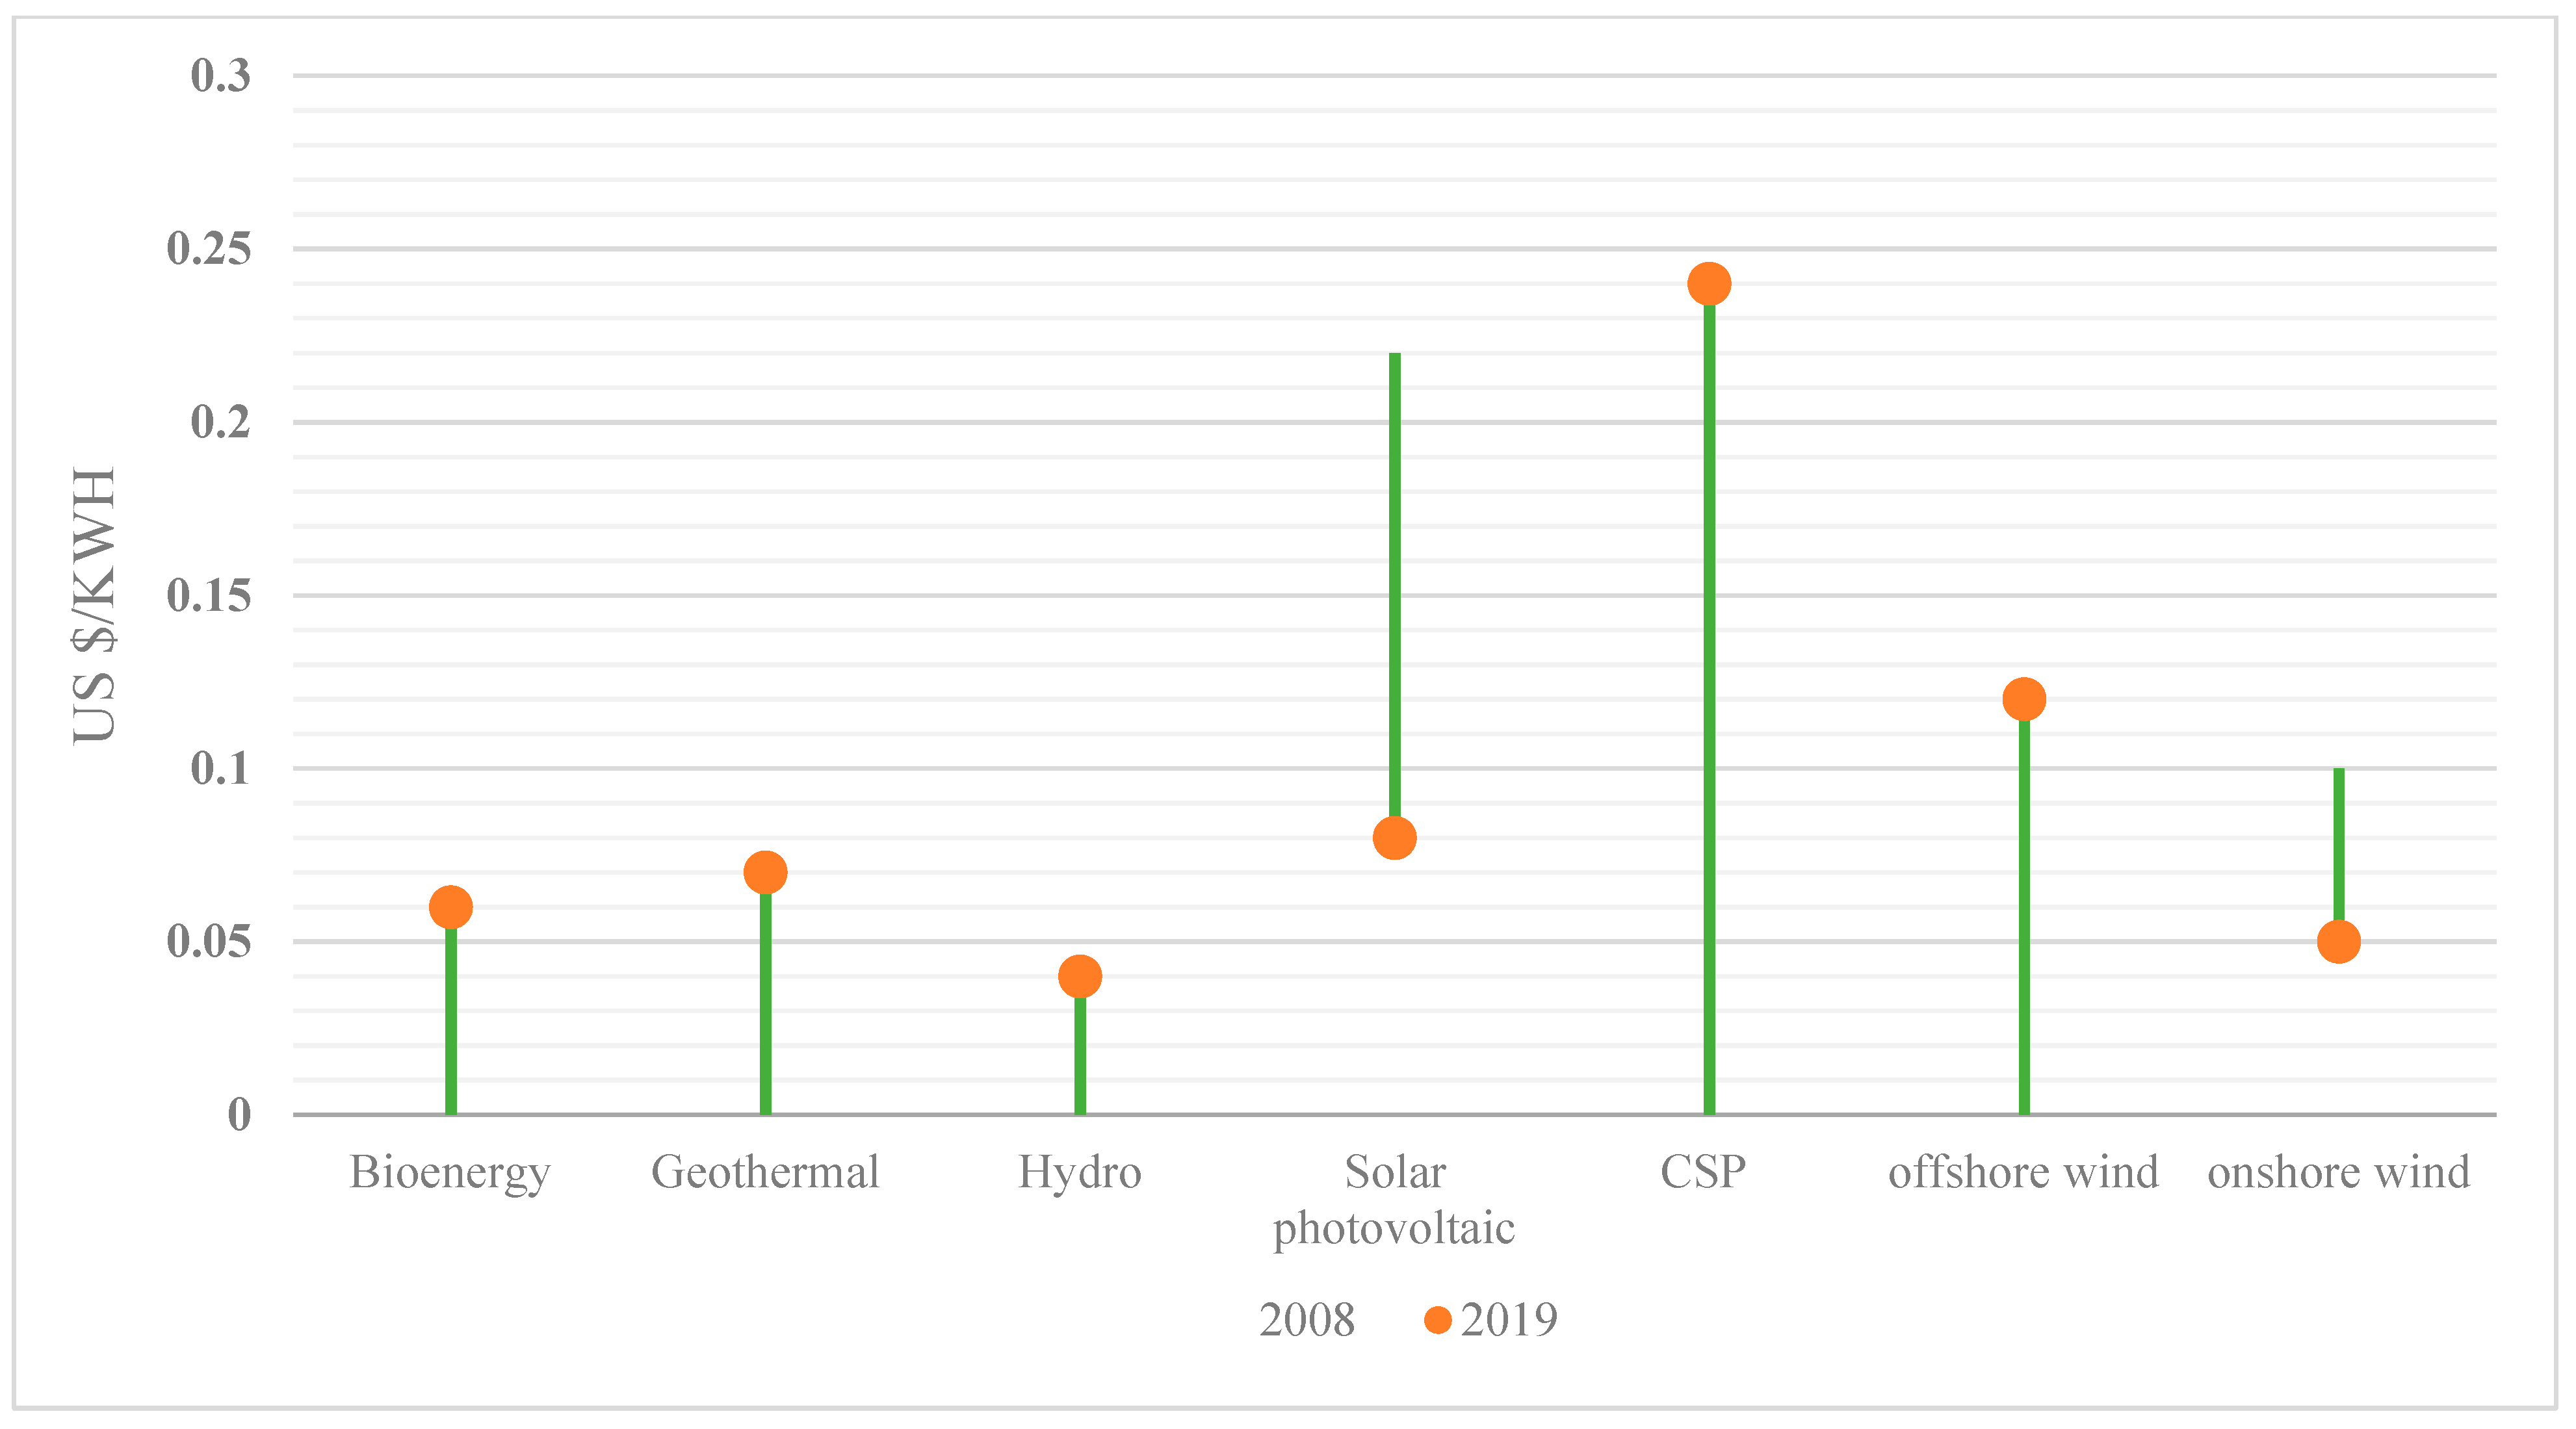
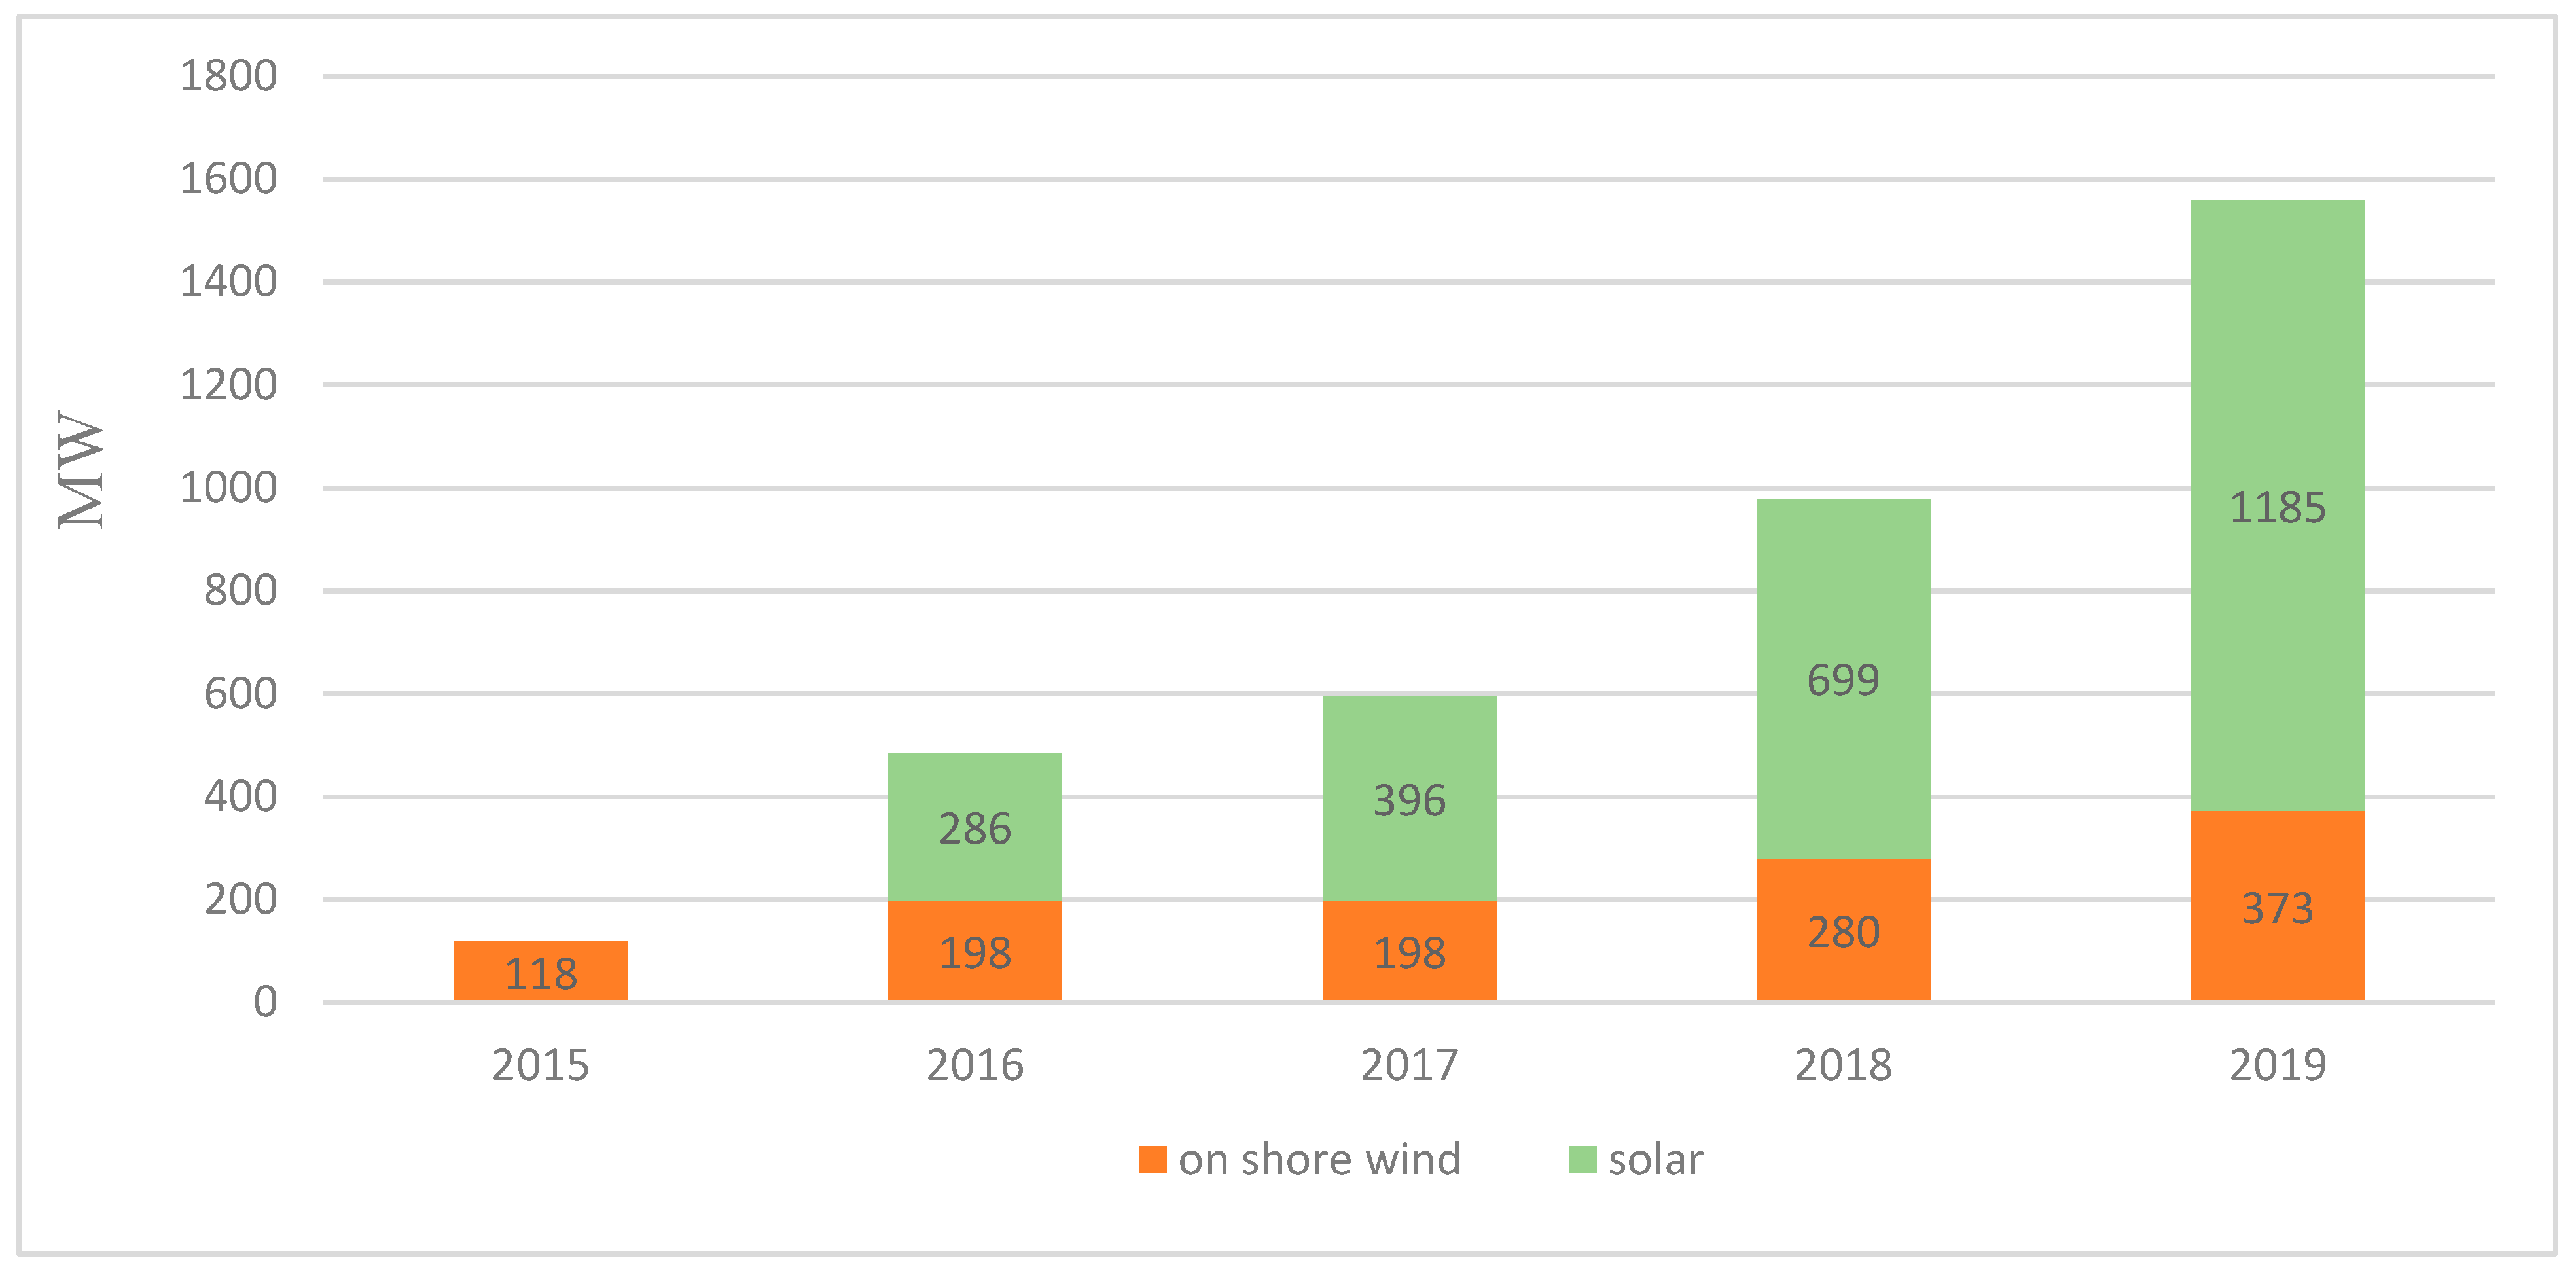
5. Renewable Energy Roadmap
6. Status of Renewable Energy in Jordan
7. Current Waste Management Situation
7.1. Quantities
7.2. Characterization
7.3. Disposal of Waste
8. Land Requirements for Landfill
9. Financing and Economic Aspects
- A fixed annual lump-sum fee (JOD 20 per household) that is paid in monthly instalments plus JOD 0.005 per KWh (for every KWh above 200 KWh consumption per month), levied with the monthly electricity bill and applicable to households in the Amman municipality;
- A fixed annual lump-sum fee (JOD 24, 15, or 8 per household depending on municipality class) that is paid in monthly instalments, levied with the monthly electricity bill, and is applicable to households in all municipalities except Amman;
- For any professional licensee of commercial, institutional, and industrial activities in municipalities including Amman, 20% of the professional license fee is levied annually.
- -
- -
- Poor enforcement and implementation of laws and regulations.
- -
- Financially:
- -
- Lack of financial resources needed for solid waste management as the available resources are not sufficient to cover the cost of the process.
- -
- Technically:
- -
- Recycling initiatives fail due to poor performance at the local government level;
- -
- Lack of expertise and human skills;
- -
- Lack of adequate equipment, tools, or facilities for successful recycling operations, in addition to poor maintenance;
- -
- Low public awareness of solid waste management issues—this leads to weaknesses in carrying out recycling operations, as well as creating negative practices in dealing with municipal solid waste and weak public participation in solid waste management [64].
- -
- Lack of institutional and administrative systems and weak coordination between different institutions;
- -
- Lack of supervisory processes for solid waste management;
- -
- Lack of coordination between the government and the private sector and a lack of separation between the different stages of the system (collection, disposal, and transfer) [64].
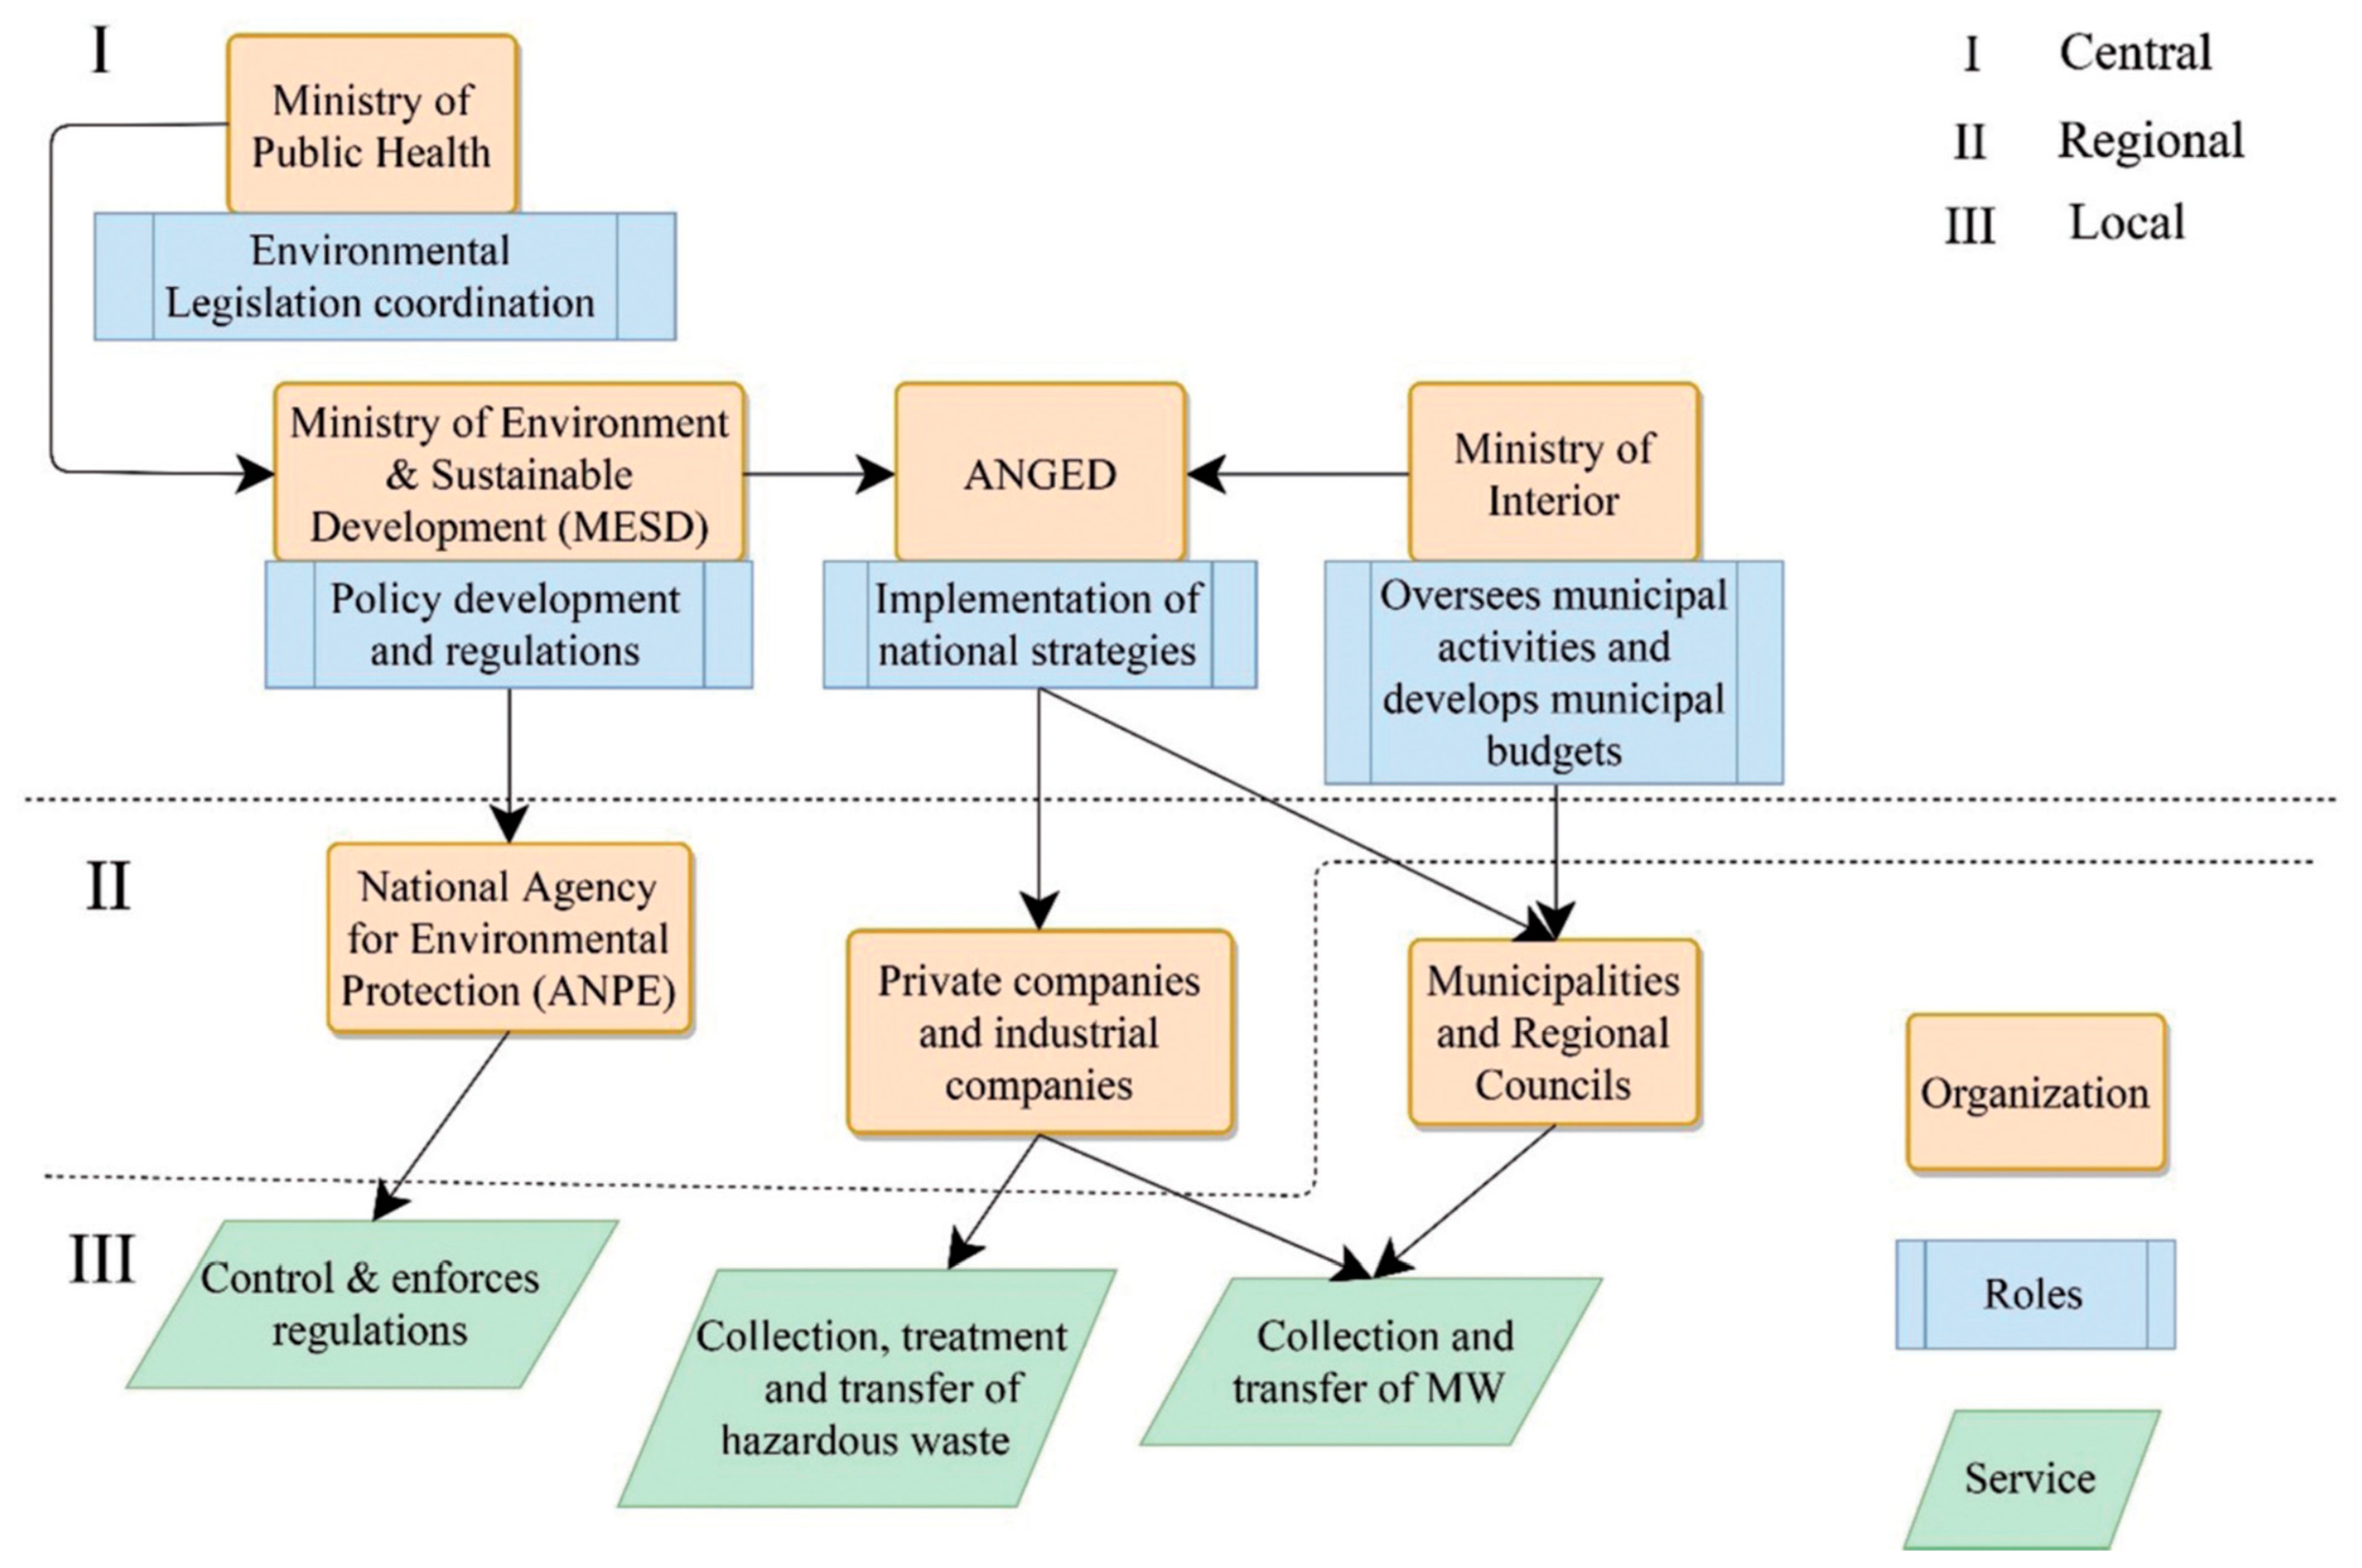
10. Institutional Framework
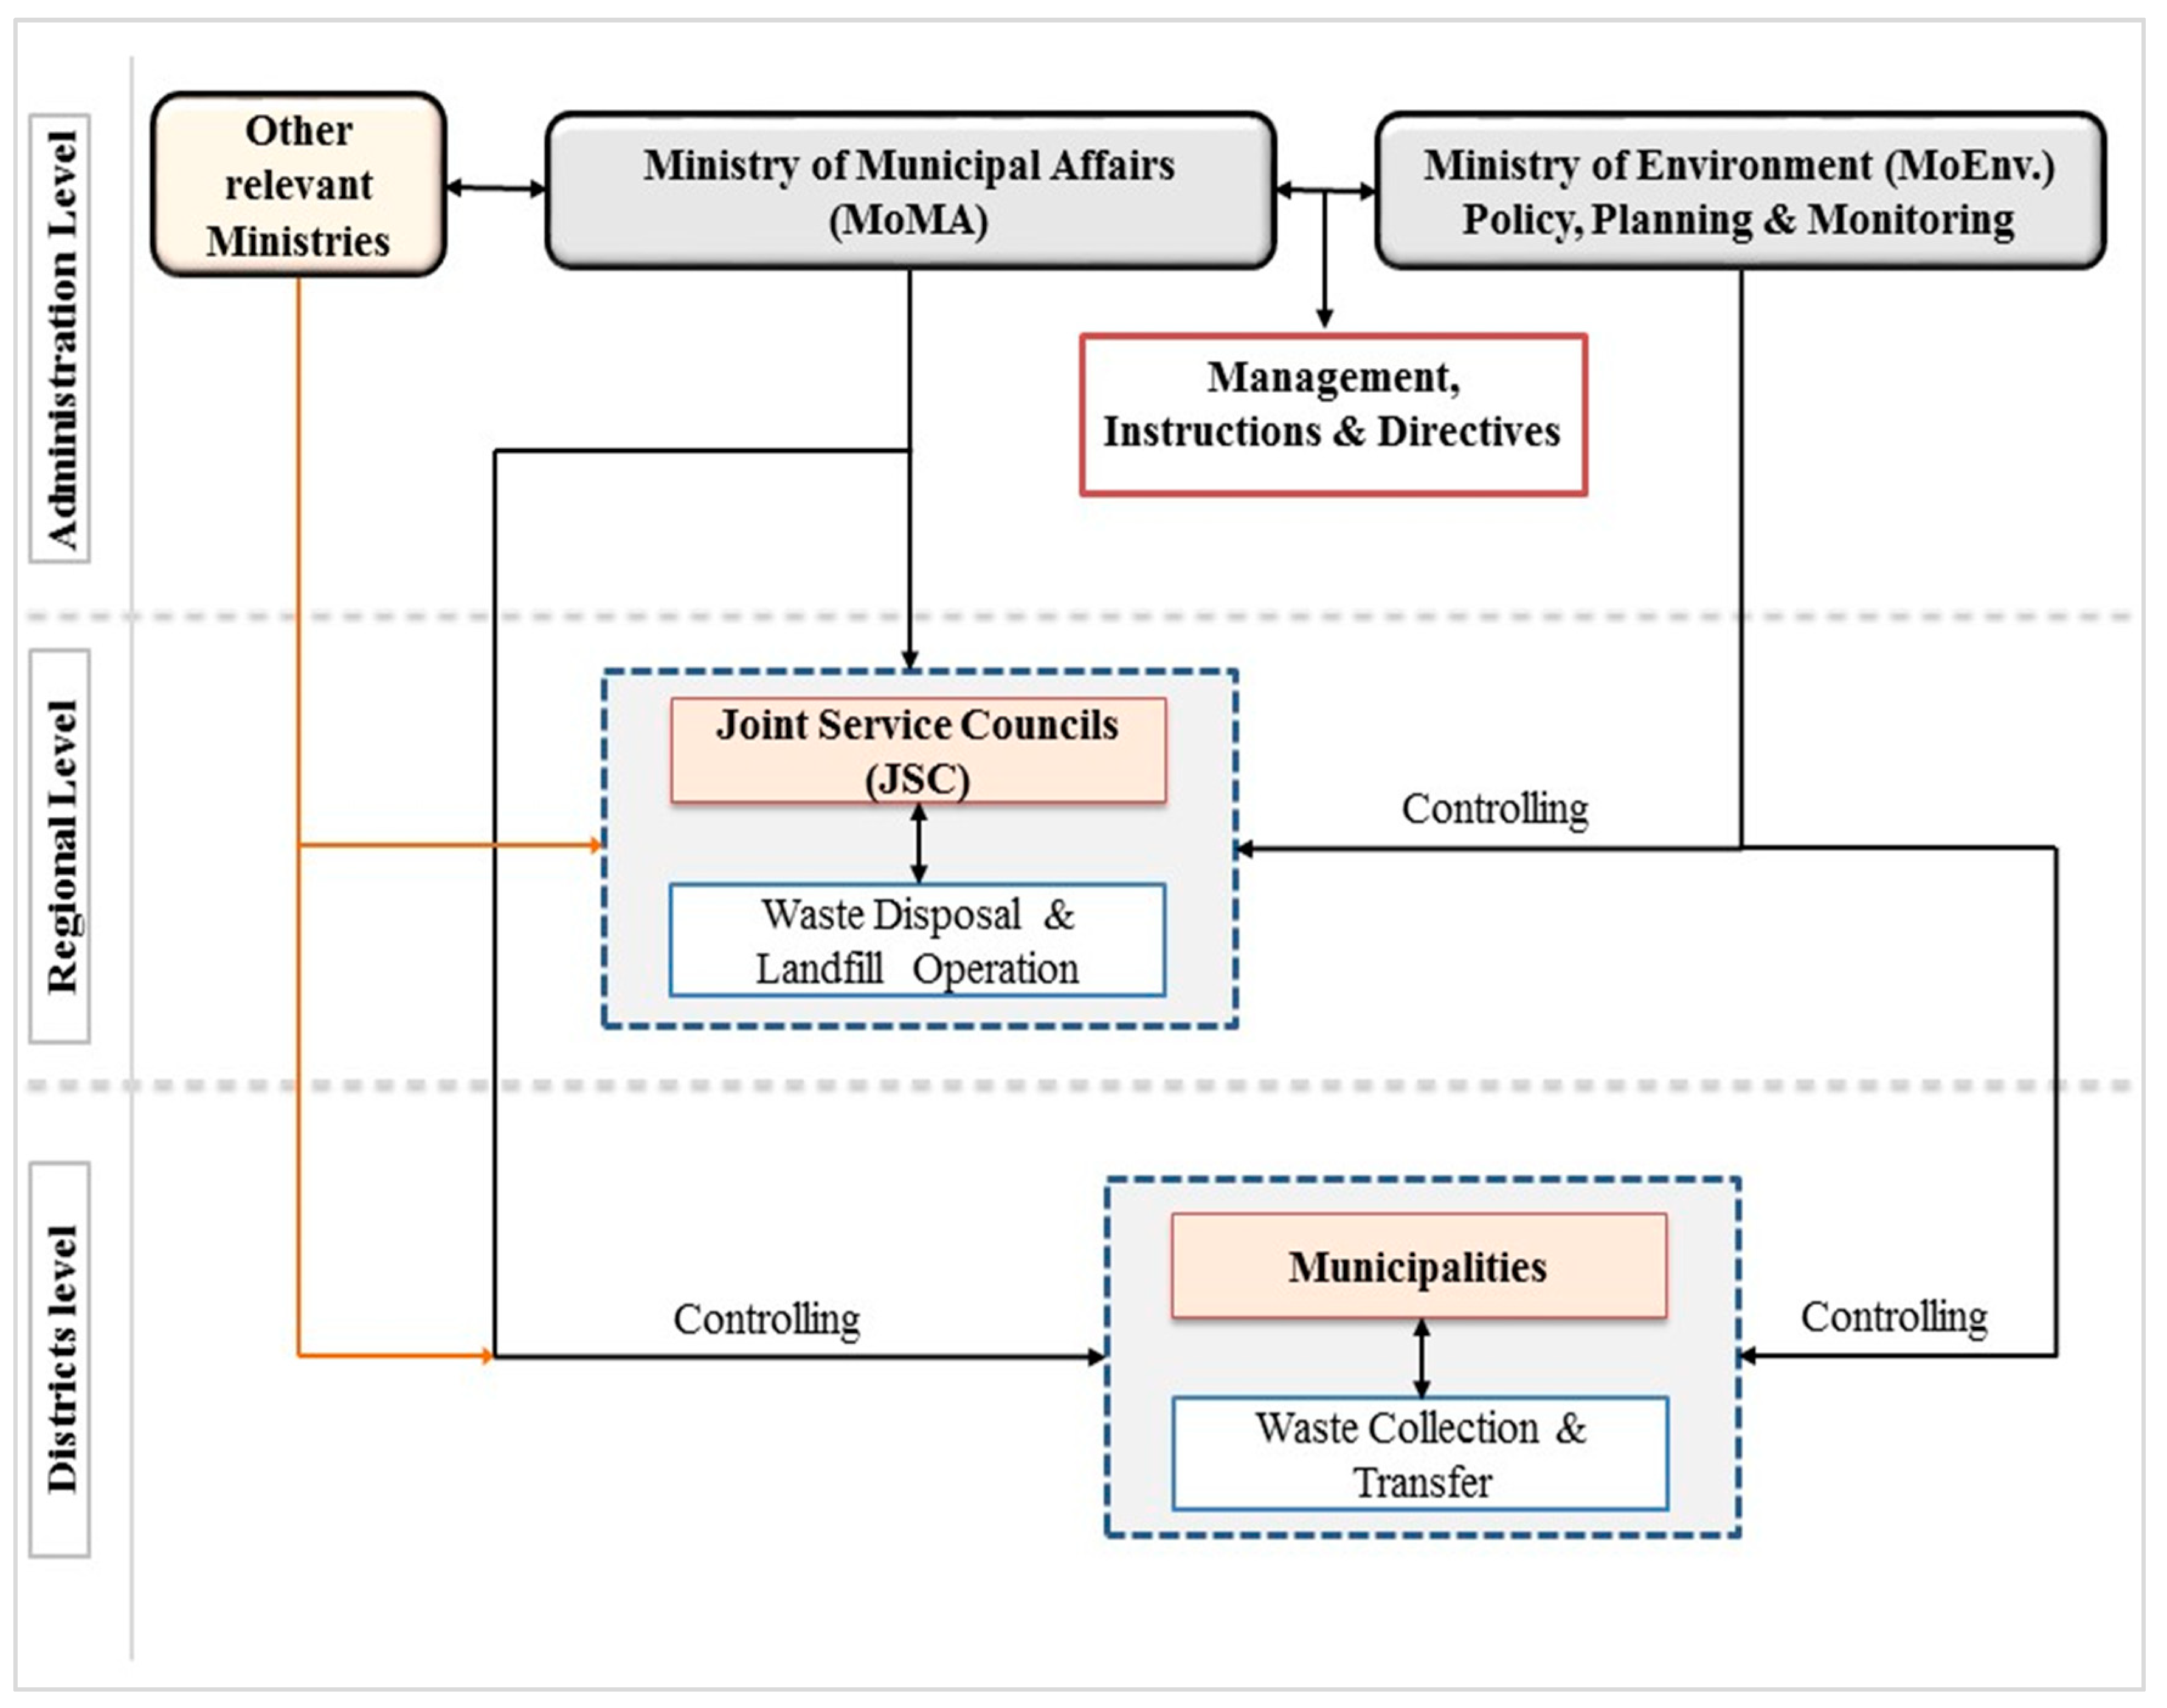
10.1. In Jordan
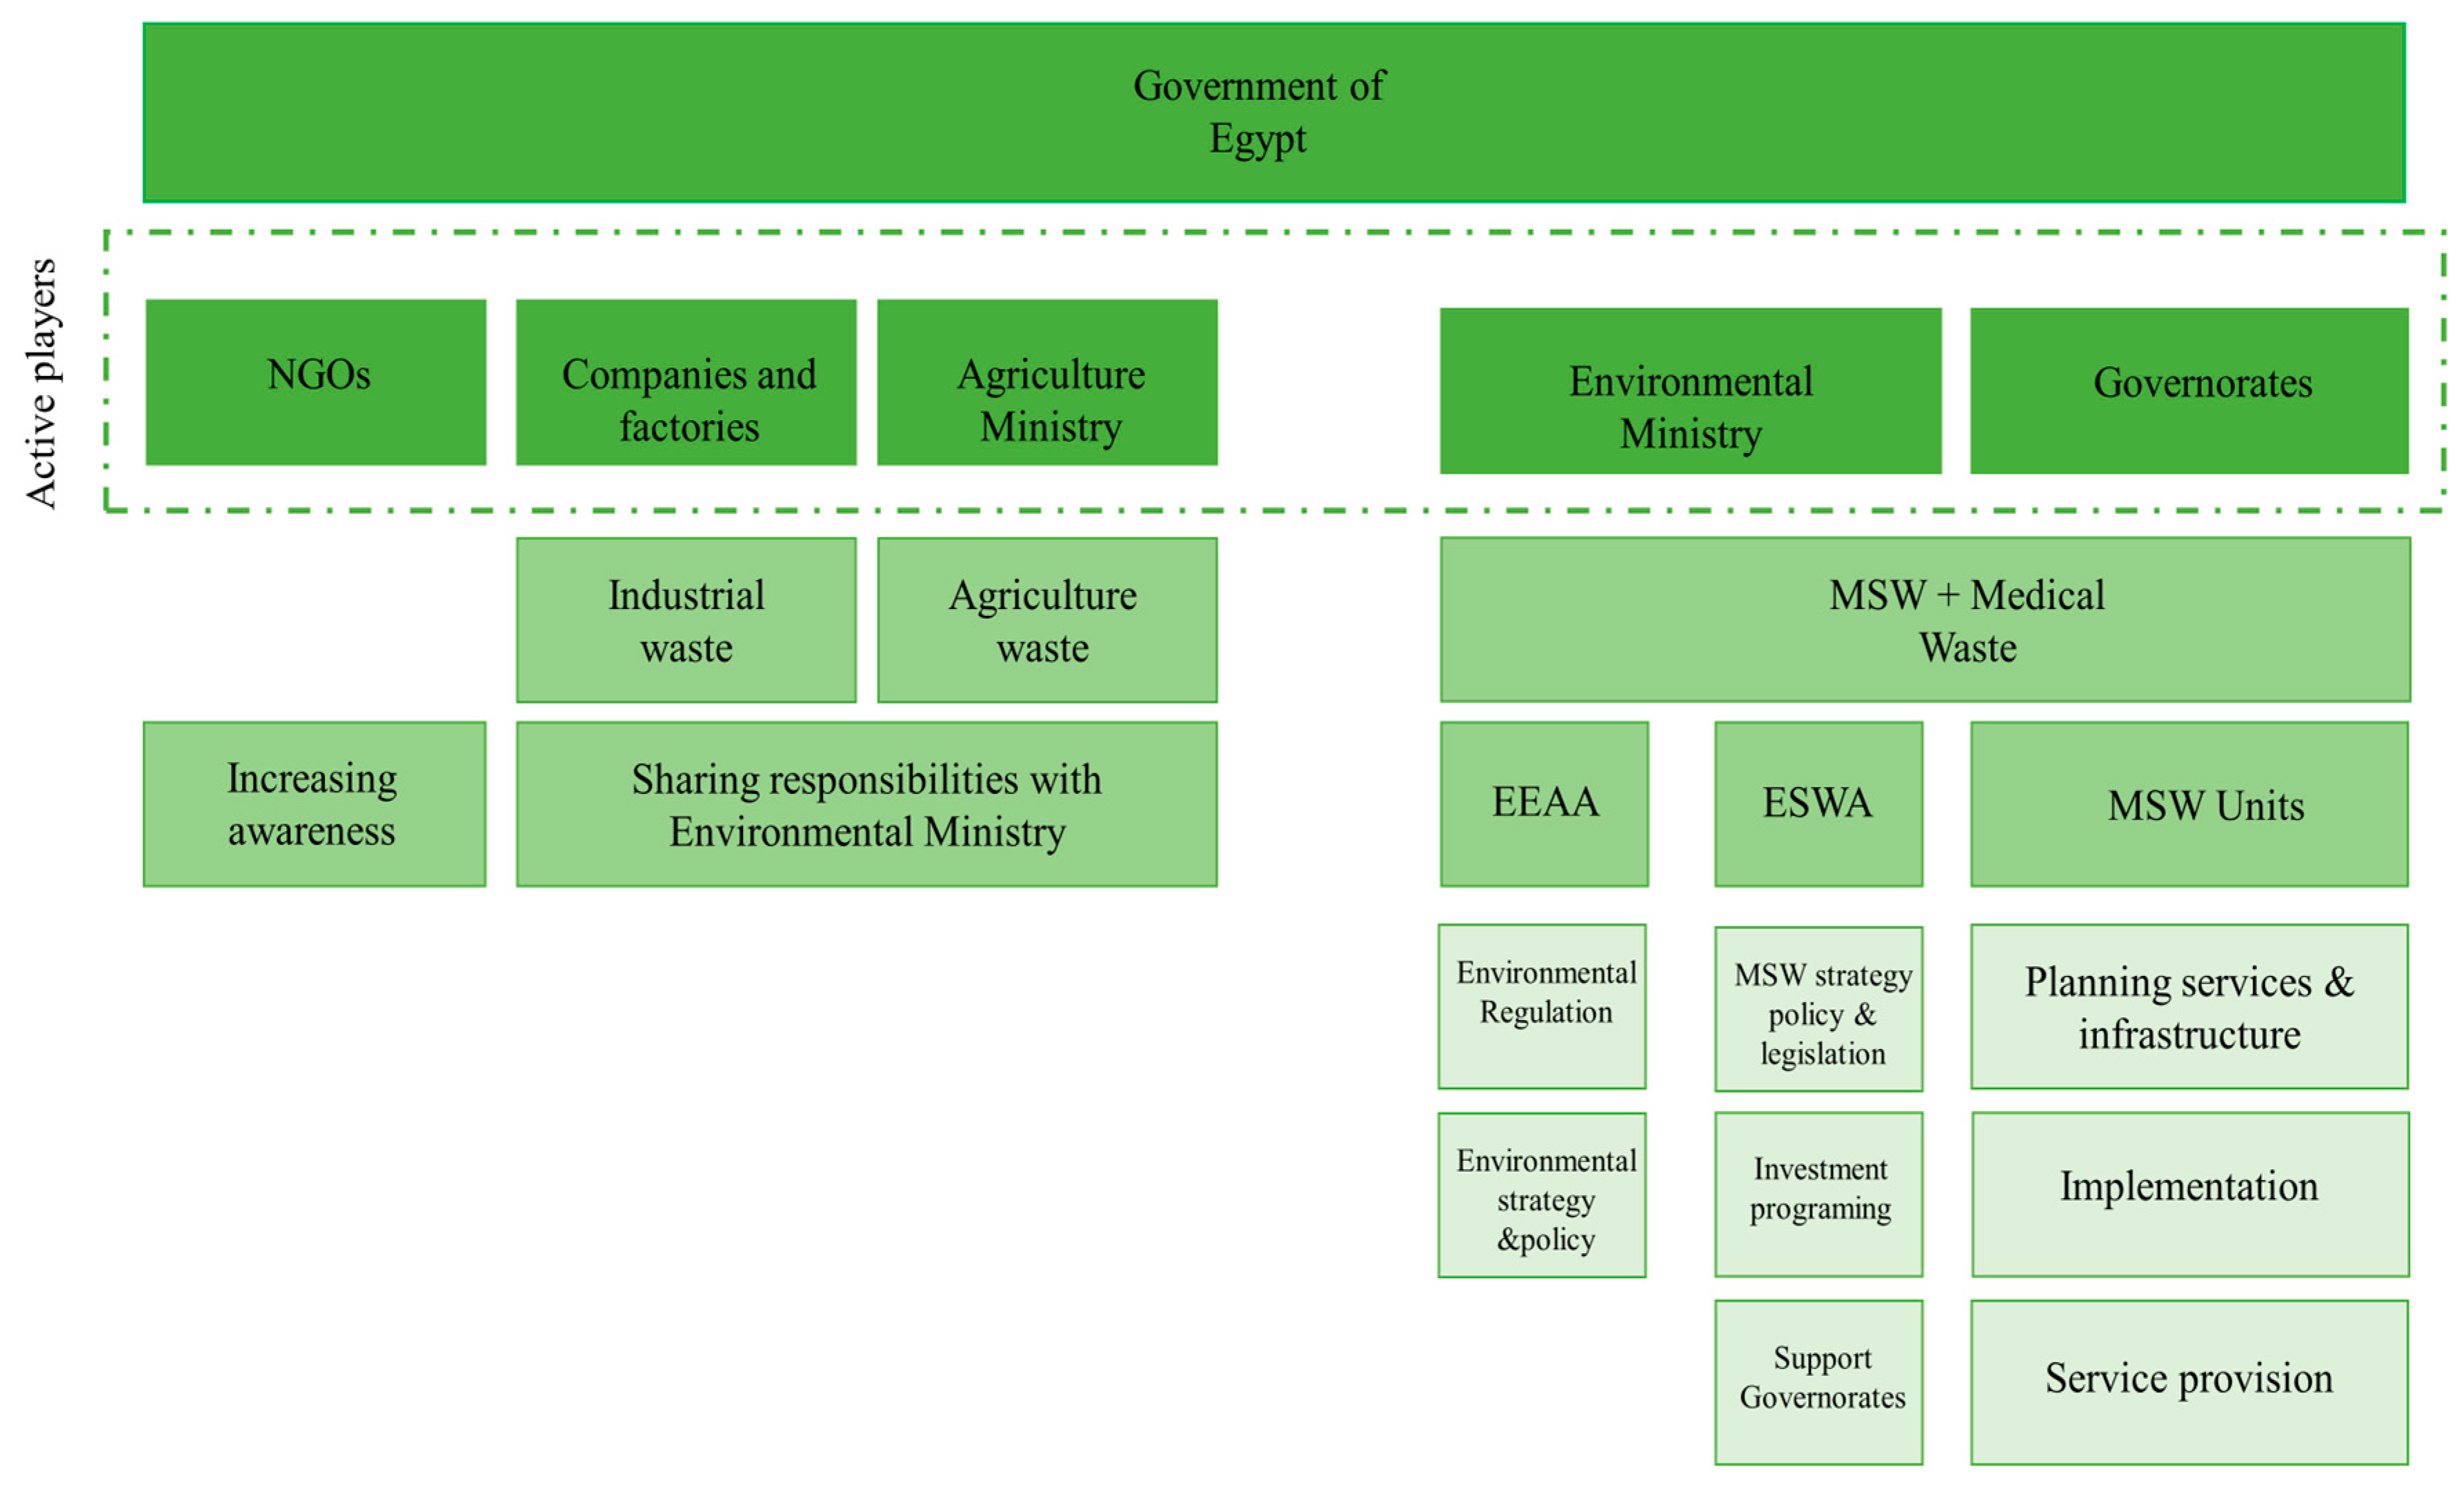
10.2. In Egypt
10.3. In Tunisia
11. Suggested Strategies for Dealing with MSW in the MENA Region and Future Research Work
- Sorting analysis of the MSW, at least for the main cities.
- Sorting is related to determining the major fractions of the MSW, while sampling must be implemented for each fraction. This means a detailed analysis in terms of water content, volatile content, and ash content for each fraction, rather than focusing on the lump sample, to precisely evaluate the LCV and obtain a precise percentage of water content in the MSW. Furthermore, elementary analysis is required for the combustible fraction.
- Sorting analysis must be performed for six months from January through to July. During this period, numerous parameters will affect the composition of the MSW, particularly the moisture content, where the behavior of the inhabitants tends to change. In addition, the effect of weather conditions will increase the evaporation rate during the summer months.
- New regulations and laws to support recycling and energy recovery from waste need to be implemented and discussed.
- Increasing the role of the private sector and motivating it to invest in recycling projects in terms of the PPA concept (public private associating), and involving the informal sector. The recycling rate must be increased to reach 30% of total generation.
- The concept of dry and wet containers needs to be activated and implemented, at least for the main cities. This will be the first step towards source separation. This concept expands the treatment possibilities in terms of composting and biogas production as the organic fraction will be pre-separated and prepared.
- The concept of energy recovery from waste needs to be well defined in institutional frameworks, which should be prepared to invest in this. Energy recovery should receive 20% of the generated waste. The European Union is always seeking ways to increase the recycling rate by issuing new laws and regulations. Despite this, around 25–30% of the total MSW generated in Europe is sent for incineration.
- Financing needs to be pre-prepared to build up comprehensive economic revenues for the waste system.
- Unifying the responsibility for decision making and putting in place all stakeholders to activate and discuss the applicable solution.
12. Discussion
13. Conclusions
- Inadequate rules and regulations to stop the dumping of waste and decreasing the landfilling process gradually by increasing and supporting other streams of waste treatments.
- Lack of a reliable database and trusted tracing systems for waste collection and transportation. A solid background and periodically updated data, especially regarding the amount of waste generation and composition, are essential for developing an integrated waste management system.
- Lack of regional cooperation across all countries of the region and a failure to exchange data.
- Unclear tariff scheme for waste services introduced by the municipalities for the citizenship. In the best case, cost recovery through tax or included in power bills covers 30–40% of the expenses of the government.
- Infrastructure unprepared to enable certain types of development or additives in the waste sector, such as separation at the source, and poor strategic plans to encourage the private sector to invest in the waste system.
- Some countries in the region (Algeria and Tunisia) have very efficient regulations regarding the industrial sector and their responsibility toward waste generation, known as extended producer responsibility (EPR). However, this needs to be applicable in reality and further developed, which requires an updated database for the industrial sector and extended cooperation and coordination among the responsible institutions.
- At present, waste is considered garbage that needs to be disposed of. Awareness is low among society about the importance of the waste sector as a viable component of the circular economy and environmental protection. Recently, waste management has begun to be included as a comprehensive engineering program in universities. Awareness of this sector needs to be increased among the poor strata of society to ensure the integrated development of the entire sector.
Author Contributions
Funding
Institutional Review Board Statement
Informed Consent Statement
Data Availability Statement
Conflicts of Interest
References
- Engelhard, H.; Schulz, F. Demographic Developments in the Middle East and North Africa; University of Amberg: Amberg, Germany, 2017. [Google Scholar]
- Roudi, F. Population Trends and challenges In the middle East and Norht Africa. Popul. Ref. Bur. 2001, 1–8. [Google Scholar]
- Population Reference Bureau. Available online: https://www.prb.org/ (accessed on 19 July 2021).
- Statista. Available online: https://www.statista.com/statistics/978535/mena-total-population/ (accessed on 19 July 2021).
- Kaza, S.; Yao, L.; Bhada-Tata, P.; Van Woerden, F. What a Waste 2.0 A Global Snapshot of Solid Waste Management to 2050; World Bank: Tokyo, Japan, 2018. [Google Scholar]
- El Amine, Y.; Abdallah Ch El Hajj, R.; Farajalla, N. Solid waste management in the MENA region: A comparative analysis of Lebanon, Jordan Tunisia. J. Politics Econ. Cult. Middle East 2018, 4, 33–48. [Google Scholar]
- Mohamed, A.; Abdallah Sh Mohamed, A.; Ahmad Sh Mohamad, A.; El-Sherbiny, R. Waste to energy potential in middle income countries of MENA region based on multi-scenario analysis for Kafr El-Sheikh Governorate, Egypt. J. Environ. Manag. 2019, 232, 58–65. [Google Scholar]
- Steduto, P.; Jagerskog, L.A.; Ward, C.; Borgomeo, E.; Ruckstuhl, S.M. Water Management in Fragile Systems, Building Reselience to Shocks and Protracted Crisis in the Middle East and North Africa; Food and Agriculture Organization of the United Nations: Cairo, Egypt, 2018. [Google Scholar]
- Mendonca, V.; Duehring, M.; van Diesen, A.; Beise, J.; Lee, S.; Lian BMshvidobadze, A.; You, D.; Dalling, E. MENA generation 2030 Investing in children and youth today to secure a prosperous region tomorrow. UNICEF Div. Data Res. Policy 2019, 1–110. [Google Scholar]
- World Bank. Beyond Scarcity, Water Secirity in the Middle East and North Africa; World Bank Publications: Washington, DC, USA, 2017. [Google Scholar]
- Organization of the Petroleum Exporting Countries. 2018. Available online: https://www.opec.org/opec_web/en/data_graphs/330.htm (accessed on 1 September 2021).
- Thabit, Q.; Nassour, A.; Nelles, M. Potentiality of Waste-to-Energy Sector Coupling in the MENA Region: Jordan as a Case Study. Energies 2020, 13, 1–20. [Google Scholar] [CrossRef]
- Thabit, Q.; Nassour, A.; Nelles, M. Flue Gas Composition and Treatment Potential of a Waste Incineration Plant. Appl. Sci. 2022, 12, 5236. [Google Scholar] [CrossRef]
- Outlook, R.E. Regional Economic Outlook Update. Middle East and Central Asia; International Monetary Fund: Washington, DC, USA, 2021. [Google Scholar]
- Our World in Data. Available online: https://ourworldindata.org/ (accessed on 2 September 2021).
- World Bank Data. Available online: https://data.worldbank.org/ (accessed on 4 September 2021).
- Shershneva, E.G. Analysis of Correlation between Waste Accumulation and Countries Welfare Level. IOP Conf. Ser. Earth Environ. Sci. 2022, 988, 022034 NIT Raipur. [Google Scholar] [CrossRef]
- Economic Data and Indicators Scoping Analysis; U.S. Environmental Protection Agency Office of Resource Conservation and Recovery: Washington, DC, USA, 2013.
- World Integrated Trade Solution. Available online: https://wits.worldbank.org/CountryProfile/en/Country/MEA/Year/2018/TradeFlow/EXPIMP/Partner/by-country (accessed on 5 September 2021).
- Kraft, J.; Kraft, A. On the Relationship Between Energy and GNP. J. Energy Dev. 1978, 3, 401–403. [Google Scholar]
- Menichetti, E.; El Gharras, A.; Duhamel, B.; Karbuz, S. The MENA Region in the Global Energy Markets. Foreign Policy Rev. 2018, 75–119, MENARA Working Papers. [Google Scholar]
- Statistical Review of World Energy 2015; British Petroleum: London, UK, 2015.
- Statistical Review of World Energy 2020, 69th ed.; British petroleum: London, UK, 2020.
- Gaies, B.; Kaabia, O.; Ayadi, R.; Guesmi Kh Abid, I. Financial development and energy consumption: Is the MENA region different? Energy Policy 2019, 139, 1–9. [Google Scholar] [CrossRef]
- World Bank. Generation of Municipal Solid Waste Worldwide in 2017, by Select Country (in Million Metric Tons). world Bank, 2018.
- Oil 2018 Analysis and Forecast to 2030; International Energy Agency: Paris, France; p. 201.
- Steinbacher, K.; Fichter, T.; Amazo, A.; Sach, T.; Schult, H.; Wigand, F. The Role of Coal in the Energy Mix of MENA Countries and Alternative Pathways; Navigant, a Guidehouse Company: Berlin, Germany, 2020. [Google Scholar]
- Adami, A.; Bakhshi, R. Nuclear Security in the Middle East: Challenges, Solutions and Regional Cooperation. Q. J. Political Stud. Islamic World 2021, 9, 75–97. [Google Scholar]
- Energy & Climate in the MENA Region Youth Perspective to a Sustainable Future; Friedrich-Ebert-Stiftung. Jordan & Iraq: Amman, Jordan, 2019; pp. 1–34.
- Hamedi, Z.; Korban, R.; Gönül, G.; Miketa, A.; Russo, D.; Gielen DJanssens, B. Power Sector Planning in Arab Countries: Incorporating Variable Renewables; International Renewable Energy Agency: Abu Dhabi, United Arab Emirates, 2020. [Google Scholar]
- IRENA. Renewable Energy Market Analysis:GCC; International Renewable Energy Agency: Abu Dhabi, United Arab Emirates, 2019. [Google Scholar]
- IRENA. Renewable Readiness Assessment: The Hashemite Kingdom of Jordan; International Renewable Energy Agency: Abu Dhabi, United Arab Emirates, 2021. [Google Scholar]
- REN21. Global Status Report: Renewables 2021; Global Renewable Energy Community: Abu Dhabi, United Arab Emirates, 2021. [Google Scholar]
- IRENA. Renewable Statues Report MENA; International Renewable Energy Agency: Abu Dhabi, United Arab Emirates, 2013. [Google Scholar]
- US Energy Information Admenstration. Available online: https://www.eia.gov/international/analysis/country/MAR (accessed on 10 September 2021).
- Solar Paces. Available online: https://www.solarpaces.org/csp-technologies/csp-projects-around-the-world/ (accessed on 10 September 2021).
- Mohamed, A.; El Makrini, A.; El Moussaoui, H.; Elmarkhi, H. Renewable Energy Potential and Available Capacity for Wind and Solar Power in Morocco Towards 2030. J. Eng. Sci. Technol. Rev. 2018, 11, 189–198. [Google Scholar]
- IRENA. Energy Transformation Middle East and North Africa; Internation Renewable Energy Agency: Abu Dhabi, United Arab Emirates, 2019. [Google Scholar]
- MEMR. Energy 2019-Facts & Figures; Ministry of Energy and Mineral Resources: Amman, Jordan, 2019. [Google Scholar]
- MEMR. Energy Balances (2005–2018); Ministry of Energy and Mineral Resources: Amman, Jordan, 2019. [Google Scholar]
- Fairbanks, W. Jordan’s Nepco: An end to operating losses? MEES 2019, 62. [Google Scholar]
- NEPCO. NEPCO Annual Report 2018; National Electric Power Company: Amman, Jordan, 2019. [Google Scholar]
- Abdelazim, M.N.; Shareef, N. Introduction to the “Waste Management in MENA Regions". In Waste Management in MENA Region; Springer: Berlin/Heidelberg, Germany, 2020; pp. 1–11. [Google Scholar]
- Cipsem. Available online: https://cipsem.wordpress.com/2020/01/29/e70-billion-trash-business-lessons-from-germanys-waste-management-system/ (accessed on 15 September 2021).
- Markic, D.N.; Carapina, H.S.; Bjelic, D.; Bjelic, L.S.; Ili´c, P.; Pesic, Z.S.; Kikanovic, O. Using Material Flow Analysis for Waste Management Planning. Pol. J. Environ. Stud. 2018, 28, 255–265. [Google Scholar] [CrossRef]
- Hemidat, S. Feasability Assesment of Waste Management and Treatment in Jordan; University of Rostock: Rostock, Germany, 2019. [Google Scholar]
- Chaabane, W. Solid Waste Management in Tourisim Destination in Tunisia: Diagnostic and Improvement Approaches; University of Rostock: Rostock, Germany, 2020. [Google Scholar]
- Hadidi, L.A.; Ghaithan, A.; Mohammed, A.; Al-Ofi, K. Deploying Municipal Solid Waste Management 3R-WTE Framework in Saudi Arabia: Challenges and Future. Sustainability 2020, 12, 5711. [Google Scholar] [CrossRef]
- Alsabbagh, M. Mitigation of CO2e Emissions from the Municipal Solid Waste Sector in the Kingdom of Bahrain. Climate 2019, 7, 100. [Google Scholar] [CrossRef] [Green Version]
- Elnaas, A. Actual Situation and Approach for Municipal Solid Waste in the Arab Region. Ph.D. Thesis, Rostock University, Rostock, Germany, 2016. [Google Scholar]
- Federal Ministry for the Environment, Nature Conservation and Nuclear Safety (BMU). Waste Management in Germany 2018|Facts, Data, Diagrams; Federal Ministry for the Environment, Nature Conservation and Nuclear Safety (BMU): Berlin, Germany, 2018. [Google Scholar]
- Salah, A.S.; Abu-Draisc, A. MSW composition analysis-case study: Amman city, jordan. In D-waste 2013. [Google Scholar]
- Nassour, A.; Hemidat, S.; Lemke, A.; Elnass, A.; Nelles, M. Seperation By manual sorting at home:state of the Art in Germany. In Source Separation and Recycling; Springer: Berlin/Heidelberg, Germany, 2017; Volume 63, pp. 67–87, The handbook of Environmental chemistry. [Google Scholar]
- Nassour, A.; Hemidat, S.; Chaabane, W.; Eickhof, I.; Nelles, M. Current Development in Waste Management in the Arab World; Erich Scmidt verlag: Berlin, Germany, 2018; pp. 157–216. [Google Scholar]
- Country report on the solid waste management in Jordan, Algeria, Tinisia, Yemen, Egypt, Lebanon, Morocco, Libya, Palestine. The Regional Solid Waste Exchange of Information and Expertise network in Mashreq and Maghreb countries (Sweepnet) and Deutshce Gesellschat für internationlae zusammenarbeit (GIZ). 2014. Available online: http://www.emwis.org/thematicdirs/events/2012/05/sweep-net-2nd-regional-forum-integrated-solid-waste-management (accessed on 1 September 2021).
- Hemidat, S.; Achouri, Q.; El Fels, L.; Elagroudy Sh Mohamed, H.; Chaouki, B.; Ahmed, M.; Hodgkinson, I.; Guo, J. Solid Waste Management in the Context of a Circular Economy in the MENA Region. Sustainability 2022, 14, 480. [Google Scholar] [CrossRef]
- Mariyam, S.; Cochrane, L.; Zuhara Sh McKay, G. Waste Management in Qatar: A Systematic Literature Review and Recommendations for System Strengthening. Sustainability 2022, 14, 8991. [Google Scholar] [CrossRef]
- Rogoff, M.; Screve, F. Waste-to-Energy Technologies and Project Implementation; Academic Press: Cambridge, MA, USA, 2012. [Google Scholar]
- Abdullah Mohammed, A.; Siddiqui, T.Z.; Khan, A.; Siddiqui, F. The Pathway to Zero Waste: Case Study of Saudi Arabia’s Solid Waste Management Techniques. Int. J. Sci. Eng. Res. 2019, 10, 7–11. [Google Scholar]
- Ossama, L.; Abid Manaf, L.B.; Bin Sharaai, A.H.; Mohamad, S.S.B. A review of Municipal Solid Waste Management practices in Saudi Arabia. J. Waste Manag. Dispos. 2020, 3, 1–7. [Google Scholar]
- Abdelazim, M.N.; Shareef, N. Waste Management in MENA Region; Springer: Cham, Switzerland, 2020. [Google Scholar]
- Ibrahim, N.A.; Abo El-Ata, G.A.; El-Hattab, M.M. Status, Problems and Challenges for Municipal Solid Waste Management in Assiut Governate. J. Environ. Stud. Res. 2020, 10, 362–384. [Google Scholar] [CrossRef]
- Egypt Today. Available online: https://www.egypttoday.com/Article/1/48915/Deliberating-waste-Awaiting-law-to-found-largest-recycling-plant (accessed on 17 September 2021).
- Hashem, E. Factors affecting Solid Waste Recycling in Egypt. J. Int. Bus. Econ. 2020, 8, 1–21. [Google Scholar] [CrossRef]
- Abdrabo, M.A.K. Assessment of economic viability of solid waste service provision in small settlements in developing countries: Case study Rosetta, Egypt. Waste Manag. 2008, 28, 2503–2511. [Google Scholar] [CrossRef]
- Program Implementation (LOT A) Assiut and Qina Governorates; Ministry of Environment: Cairo, Egypt, 2017.
- El Said, S.; Aghezzaf, E. Alternative strategies towards a sustainable municipal solid waste management system: A case study in Cairo. Waste Manag. Res. 2020, 38, 1–12. [Google Scholar]
- EL Mary, R. Good Governance and Integration for Sustainable Municipal Solid Waste Management: A case study of Egypt; American University of Cairo: Cairo, Egypt, 2018. [Google Scholar]
- JICA. Data Collection Survey on Waste Management in Northern Region Accepting Syrian Refugees in the Hashemite Kingdom of Jordan; Japan International Cooperation Agency: Tokyo, Japan, 2016. [Google Scholar]
- Hemidat, S.; Oelgemöller, D.; Nassour, A.; Nelles, M. Evaluation of key indicators of waste collection via GIS techniques as a planning and control tool for route optimization. Waste Biomass Valorization 2017, 8, 1533–1554. [Google Scholar] [CrossRef]
- Country report on the solid waste management system in Egypt. Destsche Gesellschaft für internationale zusammenarbeit GmbH (GIZ), 2014. In Country report on the solid waste management system in Egypt; Destsche Gesellschaft für internationale zusammenarbeit GmbH (GIZ): Bonn, Germany, 2014.
- Elnaas, A.; Abdallah, N.; Nelles, M. Waste Generation and Disposal Methods in Emerging Countries; in IRRC waste to Energy; Thom – Kozmiensky verlag: Vienna, Austria, 2014. [Google Scholar]
- Environmental Resource Management and EcoConServ Environmental Solutions. National Solid Waste Management Programme Egypt, Final Report. MoLD/EEAA/KfW/GIZ. 2011. Available online: https://documents1.worldbank.org/curated/fr/301901468248085190/pdf/RP11700v70Box30ne0RAP0English0Final.pdf (accessed on 1 September 2021).
- Ahmed, S.; Stretz, J. National SWM Programme in Egypt. In Proceedings of the Third SWEEP-Net Forum on integrated solid waste management, Cairo, Egypt, 1–14 May 2013. [Google Scholar]
- Mutz, D.; Hengevoss, D.; Hugi, C.; Gross, T. Waste-to-Energy Options in Municipal Solid Waste Management—A Guide for Decision Makers in Developing and emerging countries. Dtsch. Ges. Für Int. Zs. (GIZ) GmbH 2017, 1–58. [Google Scholar]
- Ouda, O.K.M.; Raza, S.A.; Nizami, A.S.; Rehan, M.; Al-Waked, R.; Korres, N.E. Waste to energy potential: A case study of Saudi Arabia. Renew. Sustain. Energy Rev. 2016, 61, 328–340. [Google Scholar] [CrossRef]
- Chakraborty, M.; Sharma, C.; Paney, J.; Gupta, P.K. Assessment of energy generation potentials of MSW in Delhi under different technological option. Energy Convers. Manag. 2013, 75, 249–255. [Google Scholar] [CrossRef]
- Ouda, O.K.M.; Raza, S.; Al-Waked, R.; Al-Asad, J.; Abdul-Sattar, N. Waste-to-energy potential in the Western Province of Saudi Arabia. J. King Saud Univ. Eng. Sci. 2017, 29, 212–220. [Google Scholar] [CrossRef] [Green Version]
- Mohamed, A.; Abdallah Sh Ahmad Sh Mohamad, A. "Financial feasibility of waste to energy strategies in the United Arab Emirates. Waste Manag. 2018, 82, 207–219. [Google Scholar]
- Ouda, O. Assessment of the Environmental Values of Waste-to-Energy in the Gaza Strip. Curr. World Environ. 2013, 8, 355–364. [Google Scholar] [CrossRef] [Green Version]
- Cudjoe, D.; Acquah, P. Environmental impact analysis of municipal solid waste incineration in African countries. Chemosphere 2021, 265, 129186. [Google Scholar] [CrossRef]
- Al-Hamamre, Z.; Saidan, M.; Hararah, M.; Rawajfeh, K.; Alkhasawneh, H.; Mohammad, A. Wastes and biomass materials as sustainable-renewable energy resources for Jordan. Renew. Sustain. Energy Rev. 2017, 67, 295–314. [Google Scholar] [CrossRef]
- Abdulrahim, A.; Chung, J. Hybridizing power and water cogeneration plants with biomass steam gasification systems: An Energy-Water-Waste (EW2) nexus case study. Energy Convers. Manag. 2021, 241, 114253. [Google Scholar] [CrossRef]
- Mohammed, E.; Khay, I.; El Maakoul, A.; Mohamed, B. Techno-economic and environmental assessment of anaerobic co-digestion plants under different energy scenarios: A case study in Morocco. Energy Convers. Manag. 2021, 245, 114553. [Google Scholar]
- Official Portal of UAE Government. Available online: https://u.ae/en/information-and-services/environment-and-energy/water-and-energy/types-of-energy-sources/waste-to-energy- (accessed on 21 September 2021).
- Abumoghli, I.; Goncalves, A. Environmental Challenges in the MENA Region. In Faith for Earth Initiative; United Nation – Environment program: New York, NY, USA, 2020. [Google Scholar]
- GEO-6 Regional Assessment for West for west Asia; United Nations Environment Programme: Nairobi, Kenya, 2016.


| Country | Population | Average MSW Generation (kg/Capita/Day) | Total Amount of Waste Generation (Ton/Year) × 106 |
|---|---|---|---|
| Egypt | 99,413,317 | 0.82 | 29.75 |
| Tunisia | 11,516,189 | 0.6 | 2.52 |
| Jordan | 10,458,413 | 0.9 | 3.44 |
| Iraq | 40,194,216 | 0.87 | 12.76 |
| Algeria | 41,657,488 | 0.9 | 13.68 |
| Lebanon | 6,100,075 | 0.6 | 1.34 |
| Libya | 6,754,507 | 0.77 | 1.9 |
| Syria | 19,454,263 | 0.5 | 3.55 |
| Saudi Arabia | 33,091,113 | 1.8 | 18.13 |
| Oman | 4,613,241 | 1.5 | 2.53 |
| Qatar | 2,363,569 | 1.8 | 1.29 |
| United Arab Emirates | 9,701,315 | 1.7 | 5.31 |
| Kuwait | 2,916,467 | 1.5 | 1.6 |
| Bahrain | 1,442,659 | 2.7 | 0.79 |
| Yemen | 28,667,230 | 0.6 | 6.28 |
| Morocco | 34,314,130 | 0.8 | 10.02 |
| Waste Fractions (%) | ||||||||
|---|---|---|---|---|---|---|---|---|
| Country | Paper | Plastic | Glass | Wood | Textiles | Organic | Metal | Others |
| Egypt | 6.3 | 11.8 | 1.2 | 0.1 | 2.3 | 66 | 4 | 8.3 |
| Tunisia | 11 | 7 | 2 | 0 | 3 | 68 | 4 | 5 |
| Jordan | 11 | 16.8 | 2.1 | 0 | 0 | 63 | 2.1 | 5 |
| Iraq | 1 | 1 | 1.6 | 0 | 0 | 63 | 1.1 | 32.3 |
| Algeria | 9 | 12 | 1 | 0 | 0 | 62 | 2 | 14 |
| Lebanon | 18 | 8 | 8 | 0 | 0 | 58 | 2.4 | 5.6 |
| Libya | 5.5 | 7.5 | 3.1 | 2.5 | 1.3 | 70.1 | 4.3 | 5.7 |
| Syria | 4 | 7 | 4 | 0 | 0 | 62 | 6 | 17 |
| Saudi Arabia | 27 | 5 | 5 | 7 | 5 | 38 | 6 | 7 |
| Oman | 15 | 25 | 5 | 1 | 5 | 30 | 0 | 19 |
| Qatar | 20 | 25 | 4 | 4 | 4 | 35 | 0 | 8 |
| United Arab Emirates | 20 | 25 | 4 | 4 | 4 | 35 | 0 | 8 |
| Kuwait | 20 | 15 | 4 | 4 | 4 | 45 | 0 | 8 |
| Bahrain | 10 | 30 | 3 | 3 | 5 | 38 | 0 | 11 |
| Yemen | 7 | 10 | 1 | 0 | 0 | 65 | 6 | 11 |
| Morocco | 10 | 10 | 3 | 0 | 0 | 65 | 4 | 8 |
| Country | Open Dump (%) | Controlled Landfill (%) | Sanitary Landfill (%) | Recycling (%) | Composting (%) | Anaerobic Digestion (%) | Incineration (%) |
|---|---|---|---|---|---|---|---|
| Algeria | 2 | 89 | 8 | 1 | |||
| Bahrain | 92 | 8 | In plan phase, to accommodate 390 Kilo ton/year | ||||
| Egypt | 80 | 5 | 10 | 5 | |||
| Iraq | 100 | no available data | no available data | no available data | no available data | ||
| Jordan | 45 | 48 | 7 | ||||
| Kuwait | 100 | In plan phase, to accommodate 1195 Kilo ton/year | |||||
| Lebanon | 29 | 48 | 8 | 15 | |||
| Morocco | 54 | 37 | 8 | 1 | |||
| Oman | 100 | In plan phase, to accommodate 390 Kilo ton/year by 2023 | |||||
| Qatar | 90 | 3 | |||||
| Saudi Arabia | 85 | 15 | Ambitious target of 3 GW for WtE facilities in 2030 | ||||
| Syria | 80 | 16 | 2.5 | 1.5 | |||
| Tunisia | 21 | 70 | 4 | 5 | |||
| Emirates | 62 | 9 | 20 | 9 | In plan phase, there are 4 projects in 4 cities with 2525 Kilo ton/year | ||
| Gaza | 67 | 32 | 0.5 | 0.5 | |||
| Yemen | 68 | 24 | no available data | 8 | no available data |
| Country | Total Amount of Waste/Year | 25% Is Sent to Waste Incineration Plant | 40% Dry Matter | Energy Produced by Incineration According to the Equation Below (Mwe) | MWh (7200 is the Operational Hours/Year of the Plant) | Number of Persons Receiving Their Energy from Waste Incineration |
|---|---|---|---|---|---|---|
| Egypt | 29,754,405 | 7,438,601 | 2,975,440 | 198.14 | 1,426,581 | 792,545 |
| Tunisia | 2,522,045 | 630,511 | 252,204 | 16.79 | 120,919 | 71,129 |
| Jordan | 3,435,588 | 858,897 | 343,558 | 22.88 | 164,720 | 74,872 |
| Iraq | 12,763,673 | 3,190,918 | 1,276,367 | 84.99 | 611,956 | 382,473 |
| Algeria | 13,684,484 | 3,421,121 | 1,368,448 | 91.13 | 656,105 | 410,065 |
| Lebanon | 1,335,916 | 333,979 | 133,591 | 8.90 | 64,050 | 35,583 |
| Libya | 1,898,354 | 474,588 | 189,835 | 12.64 | 91,016 | 23,951 |
| Syria | 3,550,403 | 887,600 | 355,040 | 23.64 | 170,224 | 85,112 |
| Saudi Arabia | 21,740,861 | 5,435,215 | 2,174,086 | 144.77 | 1,042,370 | 144,773 |
| Oman | 2,525,749 | 631,437 | 252,574 | 16.82 | 121,097 | 18,921 |
| Qatar | 1,552,864 | 388,216 | 155,286 | 10.34 | 74,452 | 5,064 |
| United Arab Emirates | 6,019,665 | 1,504,916 | 601,966 | 40.09 | 288,614 | 26,237 |
| Kuwait | 1,596,765 | 399,191 | 159,676 | 10.63 | 76,557 | 4907 |
| Bahrain | 1,421,740 | 355,435 | 142,174 | 9.47 | 68,165 | 3477 |
| Yemen | 6,278,123 | 1,569,530 | 627,812 | 41.81 | 301,005 | 1,368,208 |
| Morocco | 10,019,72 | 2,504,931 | 1,001,972 | 66.72 | 480,397 | 533,775 |
Disclaimer/Publisher’s Note: The statements, opinions and data contained in all publications are solely those of the individual author(s) and contributor(s) and not of MDPI and/or the editor(s). MDPI and/or the editor(s) disclaim responsibility for any injury to people or property resulting from any ideas, methods, instructions or products referred to in the content. |
© 2022 by the authors. Licensee MDPI, Basel, Switzerland. This article is an open access article distributed under the terms and conditions of the Creative Commons Attribution (CC BY) license (https://creativecommons.org/licenses/by/4.0/).
Share and Cite
Thabit, Q.; Nassour, A.; Nelles, M. Facts and Figures on Aspects of Waste Management in Middle East and North Africa Region. Waste 2023, 1, 52-80. https://doi.org/10.3390/waste1010005
Thabit Q, Nassour A, Nelles M. Facts and Figures on Aspects of Waste Management in Middle East and North Africa Region. Waste. 2023; 1(1):52-80. https://doi.org/10.3390/waste1010005
Chicago/Turabian StyleThabit, Qahtan, Abdallah Nassour, and Michael Nelles. 2023. "Facts and Figures on Aspects of Waste Management in Middle East and North Africa Region" Waste 1, no. 1: 52-80. https://doi.org/10.3390/waste1010005