Article

Challenges Associated with Cleaning Plastic Food Packaging for Reuse

1
Wolfson School of Mechanical, Electrical and Manufacturing Engineering, Loughborough University, Loughborough LE113TU, UK
2
Department of Materials, Loughborough University, Loughborough LE11 3TU, UK
*
Author to whom correspondence should be addressed.
Waste 2023, 1(1), 21-39; https://doi.org/10.3390/waste1010003
Submission received: 8 July 2022 / Revised: 5 September 2022 / Accepted: 9 September 2022 / Published: 16 September 2022

Abstract

:
Reuse of plastic packaging for food is a promising route to reduce the environmental burdens, but presents particular challenges due to the need to avoid cross-contamination of contents. This study investigates the challenges associated with cleaning and assessing existing recycled PET (rPET) food-to-go (FTG) pack forms and provides recommendations to enable a shift towards reusable food packaging systems. Pack forms were fouled under controlled conditions and washed in accordance published guidelines. Three fouling media were selected to represent food residue typically found in FTG packs. Investigated parameters included fouling type and quality, wash and rinse times, and detergent dosage. Cleanliness was assessed using adenosine triphosphate (ATP) swabbing and the effect on the material properties was studied via tensile testing, IR spectroscopy and differential scanning calorimetry. The results demonstrate that cleaning effectiveness is dependent on the quantity of fouling, the duration of the wash cycle and the dosing of detergent indicating the potential to optimise parameters for different fouling conditions. It is also concluded that ATP testing is an inappropriate cleanliness assessment method for food packaging due to many opportunities for it to produce false negative readings, its high cost, and slow response. The rPET material properties remained largely unchanged apart from a slight increase in stiffness, however packaging suffered significant deformation.

1. Introduction

Plastic packaging plays a vital role in protecting our food during transportation and storage and facilitates clean, undamaged, fresh, and cheap products to reach the consumer. It is a lightweight, durable method of protecting and distributing food whilst preventing tampering, displaying contents, and also extending shelf life [1,2], thereby reducing energy and emissions that would be generated by using alternative materials [3]. Packaging does, however, have many negative drawbacks: it is damaging to produce, is only used once, difficult to collect and recycle and, if disposed of incorrectly, dangerous to biological life [3]. Unfortunately, the vast majority of plastic packaging utilised for food is single use, which means that resources dedicated to its production are largely lost after only a very short use phase.
In 2019, UK workers produced 10.7 billion items of packaging waste per year from on-the-go lunches as reported by Hubbub Foundation UK [4]. Furthermore, almost two-thirds of consumers surveyed stated that they buy FTG products more frequently now than five years ago [5], indicating a growing demand of single use plastic packaging [6].
Therefore, the growing consumption of single-use plastics, and their associated environmental concerns [7], is driving innovation in reuse systems. Reuse systems combat single-use plastics by offering products in packaging that are returned at their end-of-use, cleaned, and then refilled for the new contents to be sold. An independent analysis, which looked at glass, paper, card, aluminium, and plastics, reveals reusable packaging is as much as 85% less environmentally damaging than single-use systems [8]. However, particularly in the food sector, the risk of cross-contamination between uses presents the hazard of foodborne illness to consumers, and the added complexity of circular use systems means it could make tracking and recalling contaminated products more difficult [9]. For this reason, it is essential that packaging for reuse is cleaned sufficiently while not excessively consuming resources such as water and energy.
The research work presented here seeks to demonstrate the challenges associated with cleaning and cleaning assurance of plastic food packaging for reuse. A selected pack form of single use recycled PET (rPET) packaging was used to (i) evaluate the effectiveness of current fouling detection for cleaning assurance assessed via ATP swabbing, (ii) investigate the impact of current industrial washing procedure (amount and type of fouling, cleaning time and detergent dose) on the pack form, (iii) establish any material degradation following simulated reuse (repeated wash cycles of appropriate industrial washing procedure), and (iv) highlight a number of implications and provide associated recommendations for the development of reusable polymer packaging, industrial cleaning process, and quality assurance checks.

2. Literature Review

Plastic packaging provides a durable, lightweight method of distributing food products [10] and has four main functions: protection and preservation of contents (including tampering), containment of items, convenience to supply chains and consumers, and as a method for communication [11]. Because of its low cost and convenience, plastic packaging has become increasingly prevalent over the last few decades. Indeed, in the UK it has been reported that 2.2 million tonnes of plastic packaging waste are generated by the market each year with only about one quarter of this collected for recycling [12]. At the point of disposal, plastic packaging typically still has many of its desired functional characteristics and could thus be reused if a number of technological, social, and economic barriers could be overcome.
To counteract the well reported impacts associated with single use plastic packaging waste, initiatives have been established to reduce the quantity of packaging (e.g., light weighting), improve recyclability, and also develop competencies around packaging reuse. In the UK, the Waste and Resources Action Programme (WRAP), with the support of the Ellen MacArthur Foundation developed the UK Plastics Pact, aims to deliver four key targets by 2025 by working with local authorities, governments, and plastic processing businesses. One of their goals include ensuring 100% of plastic packaging is reusable, recyclable, or compostable (WRAP 2019), which is supported by the UK government. The UK government also has the target of eradicating avoidable plastic waste by 2042 [3].
Of the options available, reuse systems are seen as more beneficial than light weighting and recycling at end-of-life since they better preserve expended resource use [13]. Indeed, it has been shown that environmental impacts associated with reuse of packaging would be much lower than those using virgin or recycled polymers [14]. However, the possibility of cross-contamination between uses presents the hazard of foodborne illness to consumers. Additionally, the added complexity of circular use systems means it could be more difficult to track and control outbreaks of contamination and hence recall dangerous products [9].
In comparison to single use compostable clamshell packaging, reusable containers are superior in terms of greenhouse gas emissions, energy consumption, and material waste [15]; the only area in which reusable containers are not preferable is water consumption, due to the washing process between uses. This finding shows that optimisation of the washing process is influential in minimising the environmental impact of reuse systems.
Clearly, for food packaging reuse systems, the implementation of a sufficient cleaning process is essential for ensuring food safety and preventing foodborne illnesses [16]. The Zero-Waste e-commerce company, Loop, whose packaging solutions comprise mainly of glass or aluminium, clean their packaging in accordance with the European Food Safety Authority [17]. However, they do not disclose the washing parameters used or how they ensure all packaging items are cleaned to this standard. Indeed, there is a distinct lack of standards that specifically refer to the cleaning of reusable packaging, presumably because of the infancy of such systems. There are, however, a range of standards which address cleaning requirements for industrial warewashers, but they have some variance. For example, the UK Food Standards Agency advises a rinse temperature at 70 °C to ensure effective sanitation against transferrable bacteria and viruses, whilst the German Institute for Standardisation (DIN Standard 10512) defines that commercial, one-tank dishwashers must wash at 60–65 °C and rinse at 80–85 °C when no sanitising chemicals are used (German Institute for Standardization, 2008, as cited in [18]. The American National Standards Institute states, however, that commercial dishwashers must achieve a minimum of 99.999% reduction in bacteria and must perform a final rinse at 165 °F (74 °C) for stationary rack dishwashers and 180 °F (82 °C) for other commercial washers [19]. With a lack of clear guidance for washing reusable packaging, it is important to establish suitable parameters that achieve safe and effective results, but which are also sensitive to the specific requirements of polymers (e.g., low glass transition temperatures).
With any cleaning process, it is important to have an assurance process to confirm the effectiveness of fouling and contamination removal. The current industry standard for cleanliness assessment is the ATP (adenosine triphosphate) bioluminescence assay, which involves swabbing a standard area of the surface of interest and inserting the swab into a handheld luminometer device [20]. ATP is an enzyme found in all organic matter, and when mixed with the enzyme luciferin, displays bioluminescence [21].
Adenosine triphosphate assay readers typically give a reading in Relative Light Units (RLU), which indicates the quantity of ATP present and thus surface’s ability to host microbial growth [22]. Although ATP testing is widely used, the results can vary greatly between user, practice, and fouling type [23]. Furthermore, environmental factors can affect ATP readings. For example, the presence of alkaline foam cleansers can ‘quench’ the chemical reaction occurring during the test, reducing the bioluminescent signal [24]. It is important, therefore, to establish the applicability and reliability of such an assessment technique for reusable plastic packaging.
Here we present a scientific study that seeks to better understand these technical issues associated with plastic packaging reuse systems—namely the impact of washing parameters on pack form and material properties, and the suitability of ATP bioluminescence assay for determining cleanliness.

3. Materials and Methods

3.1. Selection of Pack Form

The pack form used in this study was rPET (W × L × H, 150 × 210 × 40 mm, plastic thickness approx. 0.30–0.35 mm) sourced from Klöckner Pentaplast, Featherstone, UK. The particular pack form used also had suitable dimensions for easy fouling application and assessment as well as producing samples for material testing. Whilst the investigated packaging is designed only for single use, this study aims to establish problems associated with current designs and thereby provide possible recommendations for rPET to 2rPET (recycled reuse PET) packaging development. In this study, the majority of test samples were used only once, unless otherwise stated.

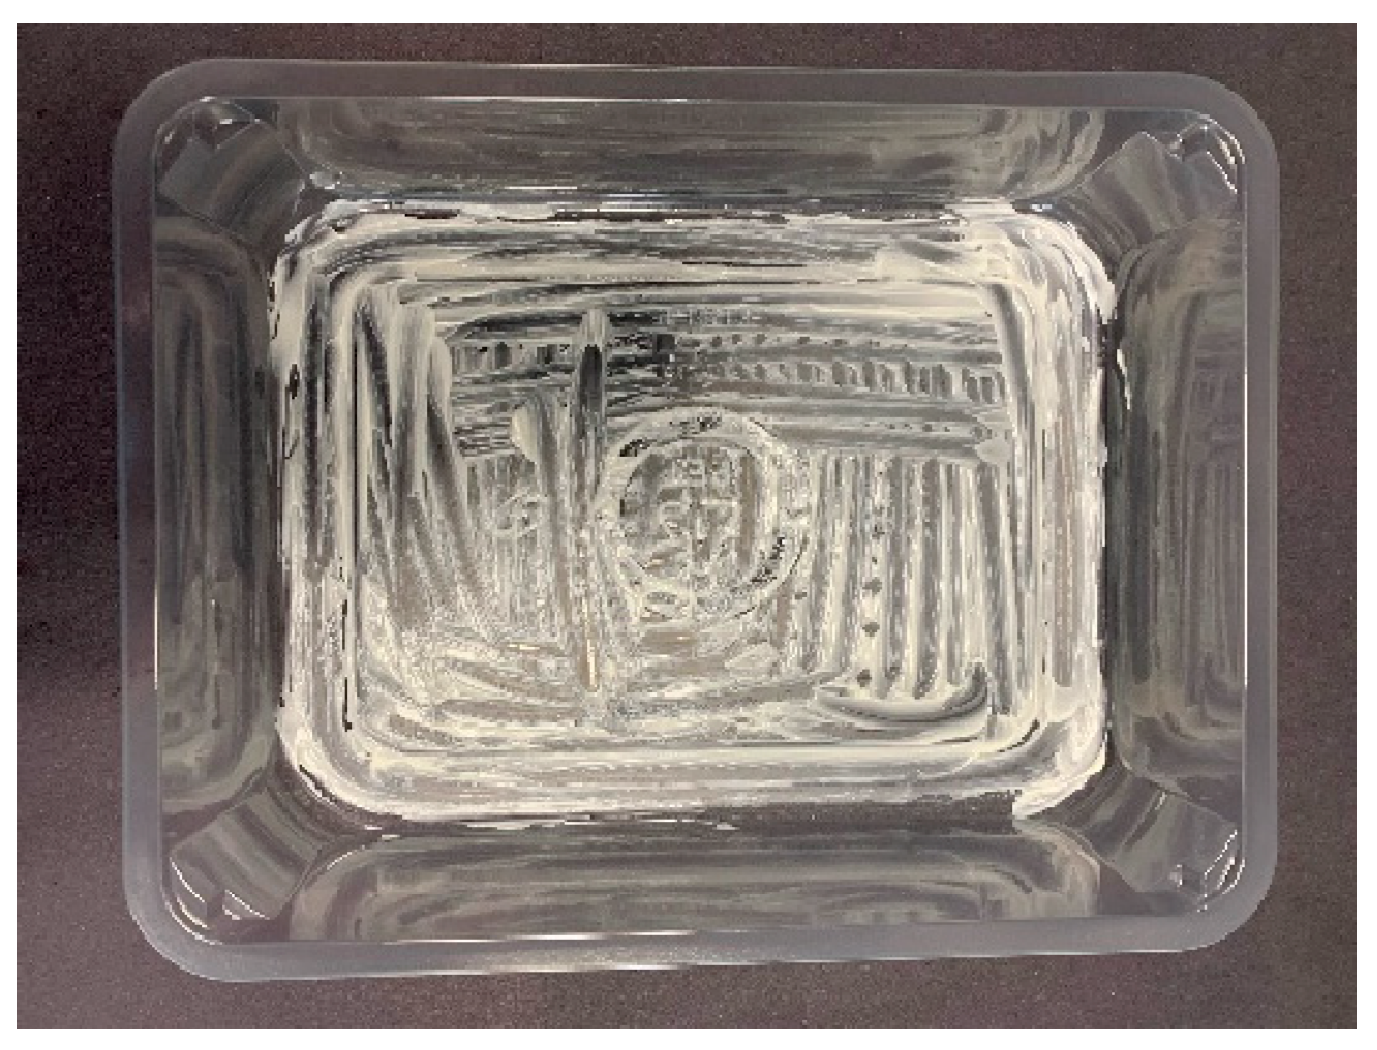
3.2. Fouling Types and Fouling Deposition Method

Three different fouling types were selected from well-known brands, namely orange juice (Tropicana®, Smooth), mayonnaise (Hellmann’s®), and cream cheese (Philadelphia®), to simulate the representative types of fouling which may commonly be found on various food-to-go packs. Moreover, the performance evaluation of various ATP detecting units has been published by Silliker (Food Safety and Quality Solutions) using orange juice [22], which has been used as a reference in the present study. A measured quantity of the artificial fouling was deposited onto the rPET pack forms using a spatula to spread the sample across the base of the container. Figure 1 shows an example of the investigated containers fouled with cream cheese. The fouling was then dried to emulate the state of the fouling that could be found on reusable packaging. The cream cheese samples were air dried, and the orange juice samples were dried using a forced air flow. The fouling was distributed as evenly as possible; however, the orange juice typically became unevenly distributed upon drying due to its low viscosity and the contours of the pack form.

3.3. Simulated Reuse

The reuse of the rPET pack forms was simulated by subjecting the artificially fouled packs to repeated cycles of appropriate industrial washing procedures using a commercial warewasher (Classeq® Glasswasher G400 Duo, purchased from Nisbets Plc. Catering Equipment Supplies, Bristol, UK). The containers were washed on the lower layer of the 400 × 400 mm two-layer warewasher rack. Additionally, a bespoke silicone band bracing system was designed and installed to hold the plastic packaging in place preventing movement during wash cycles. The warewasher has two settings, ‘light’ and ‘standard’, with wash durations between 72 and 102 s wash cycles, respectively, followed by a 10 s rinse phase. Both settings operated at a nominal 55 °C wash and 70 °C rinse. These temperatures ensure effective sanitation against transferrable bacteria and viruses, as advised by the Food Standards Agency [25].

3.4. Cleaning Parameters

The investigated washing parameters were wash time, detergent dose, and quantity of fouling, as briefly described below. The influence of the wash and rinse temperature was not investigated due to limitations in control of the warewasher utilised. All tests were conducted at the standard wash and rinse temperatures ±2 °C.
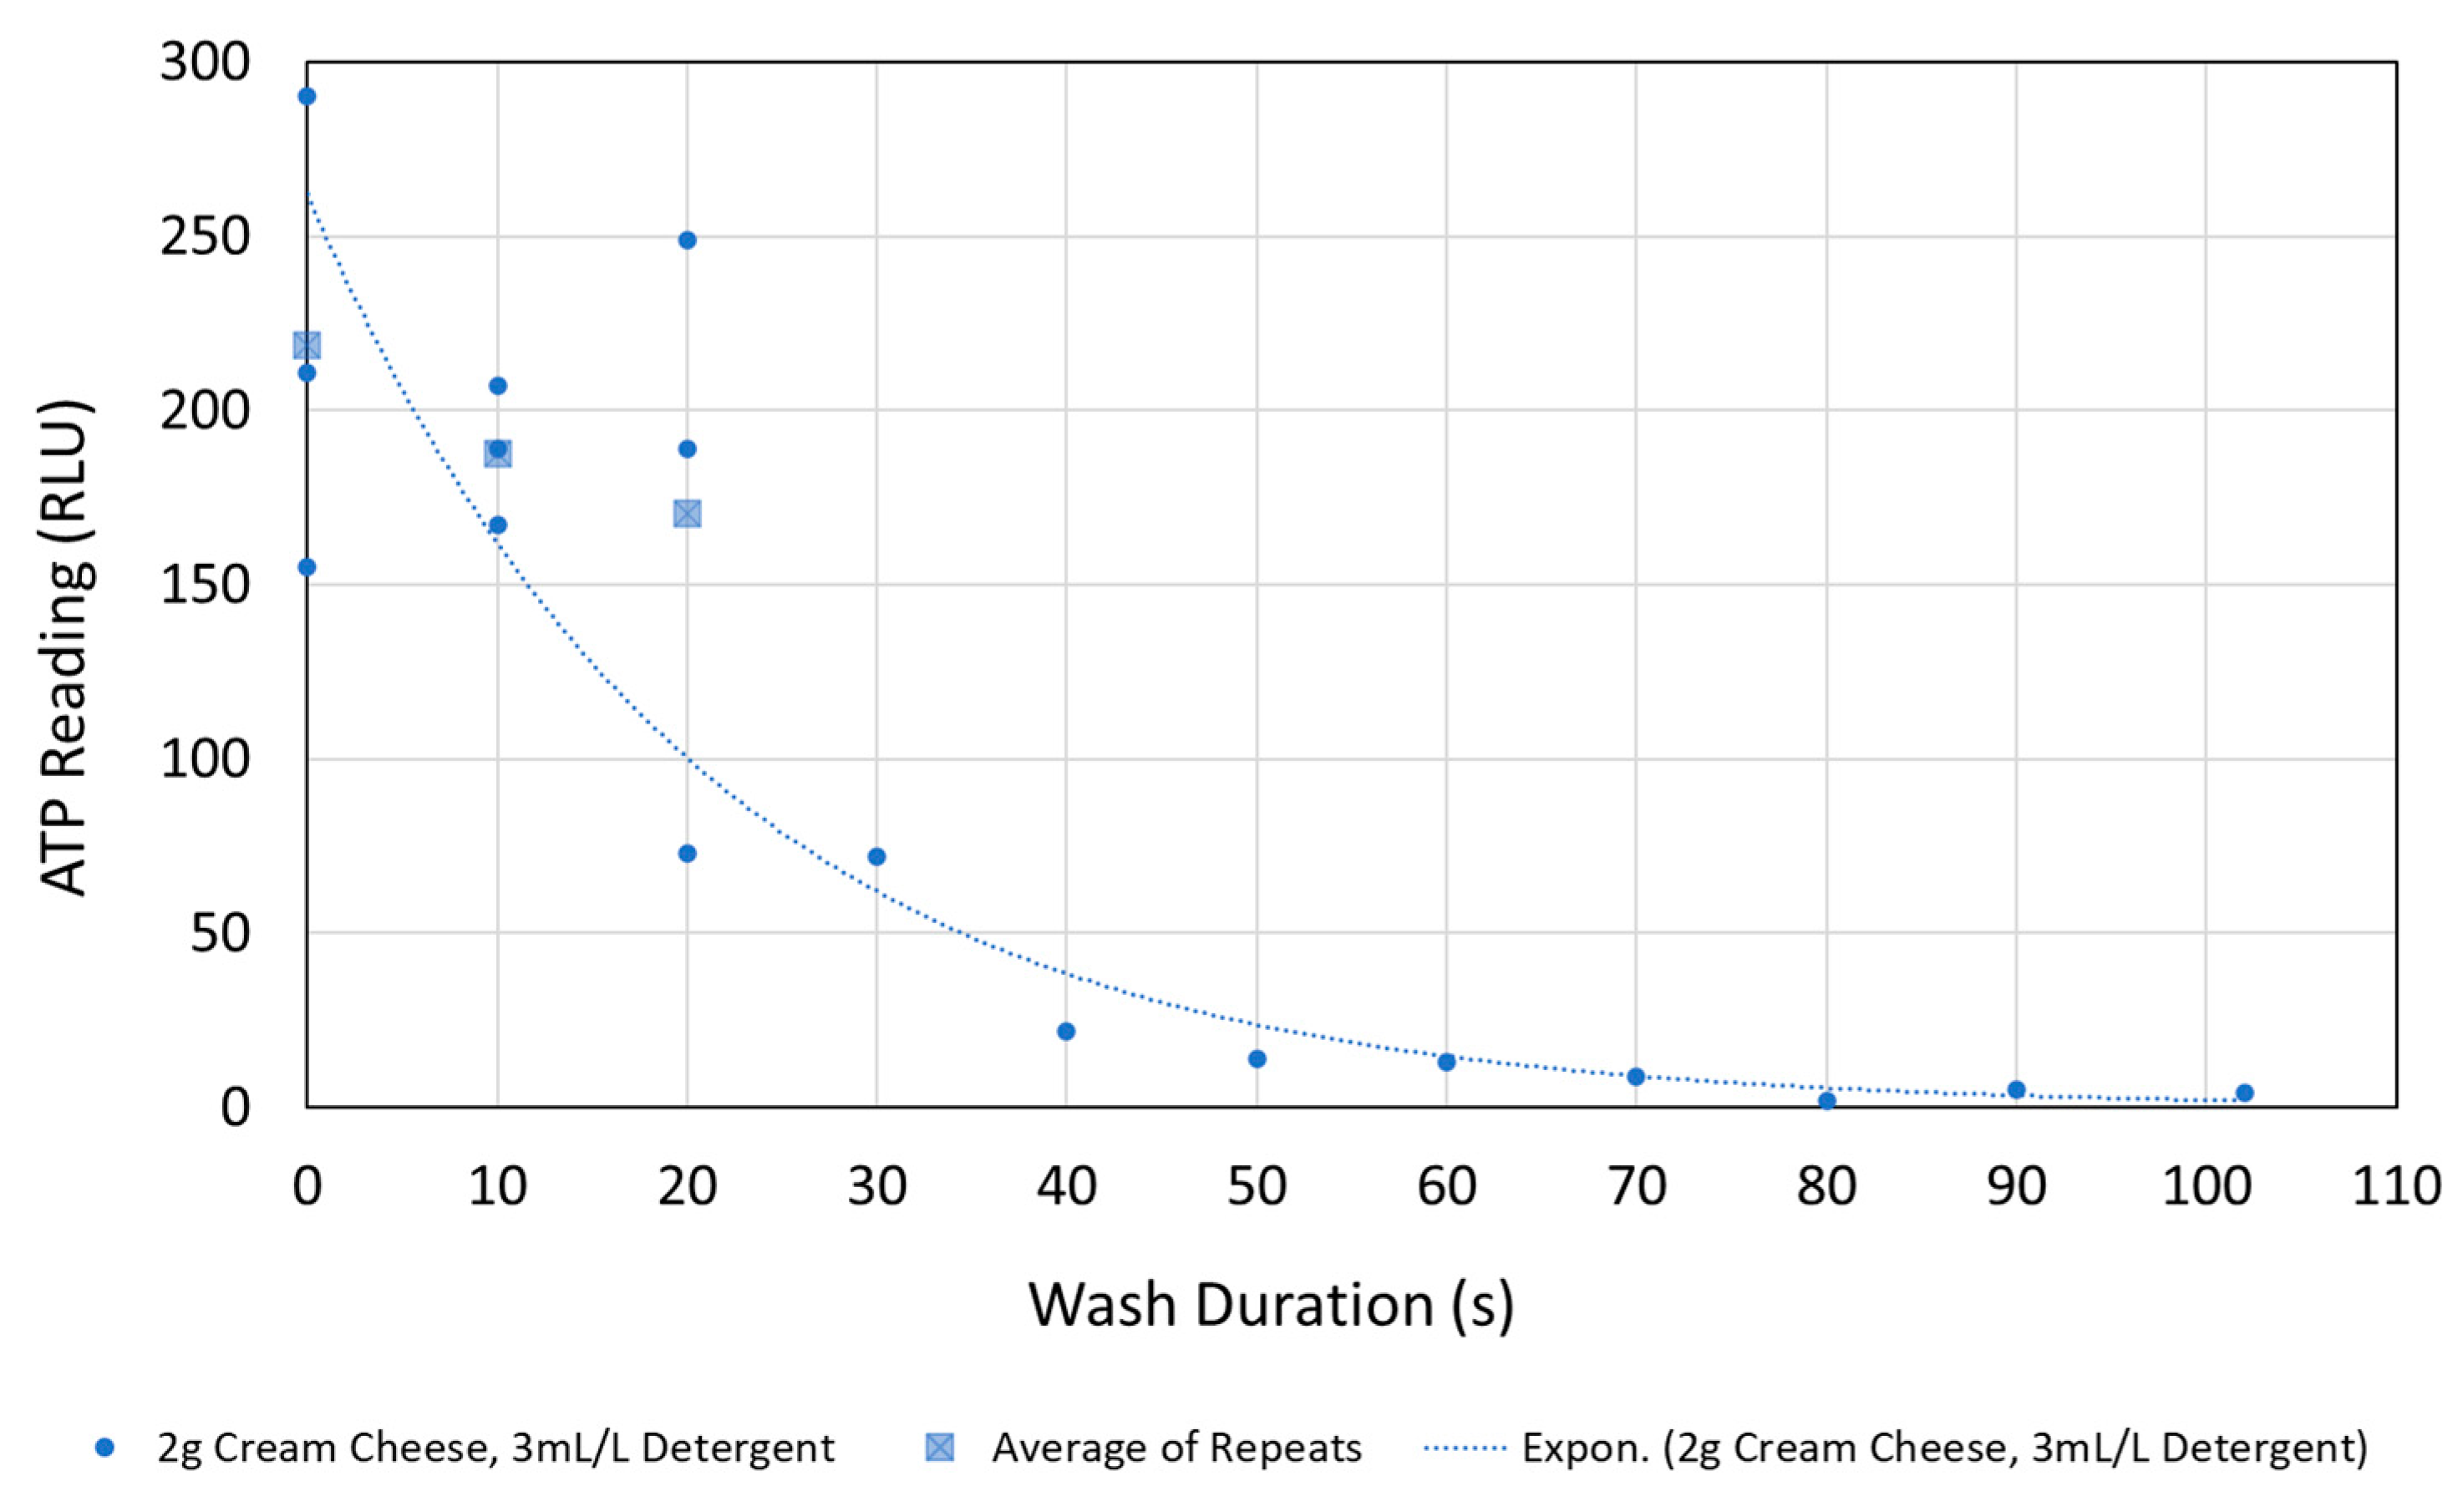
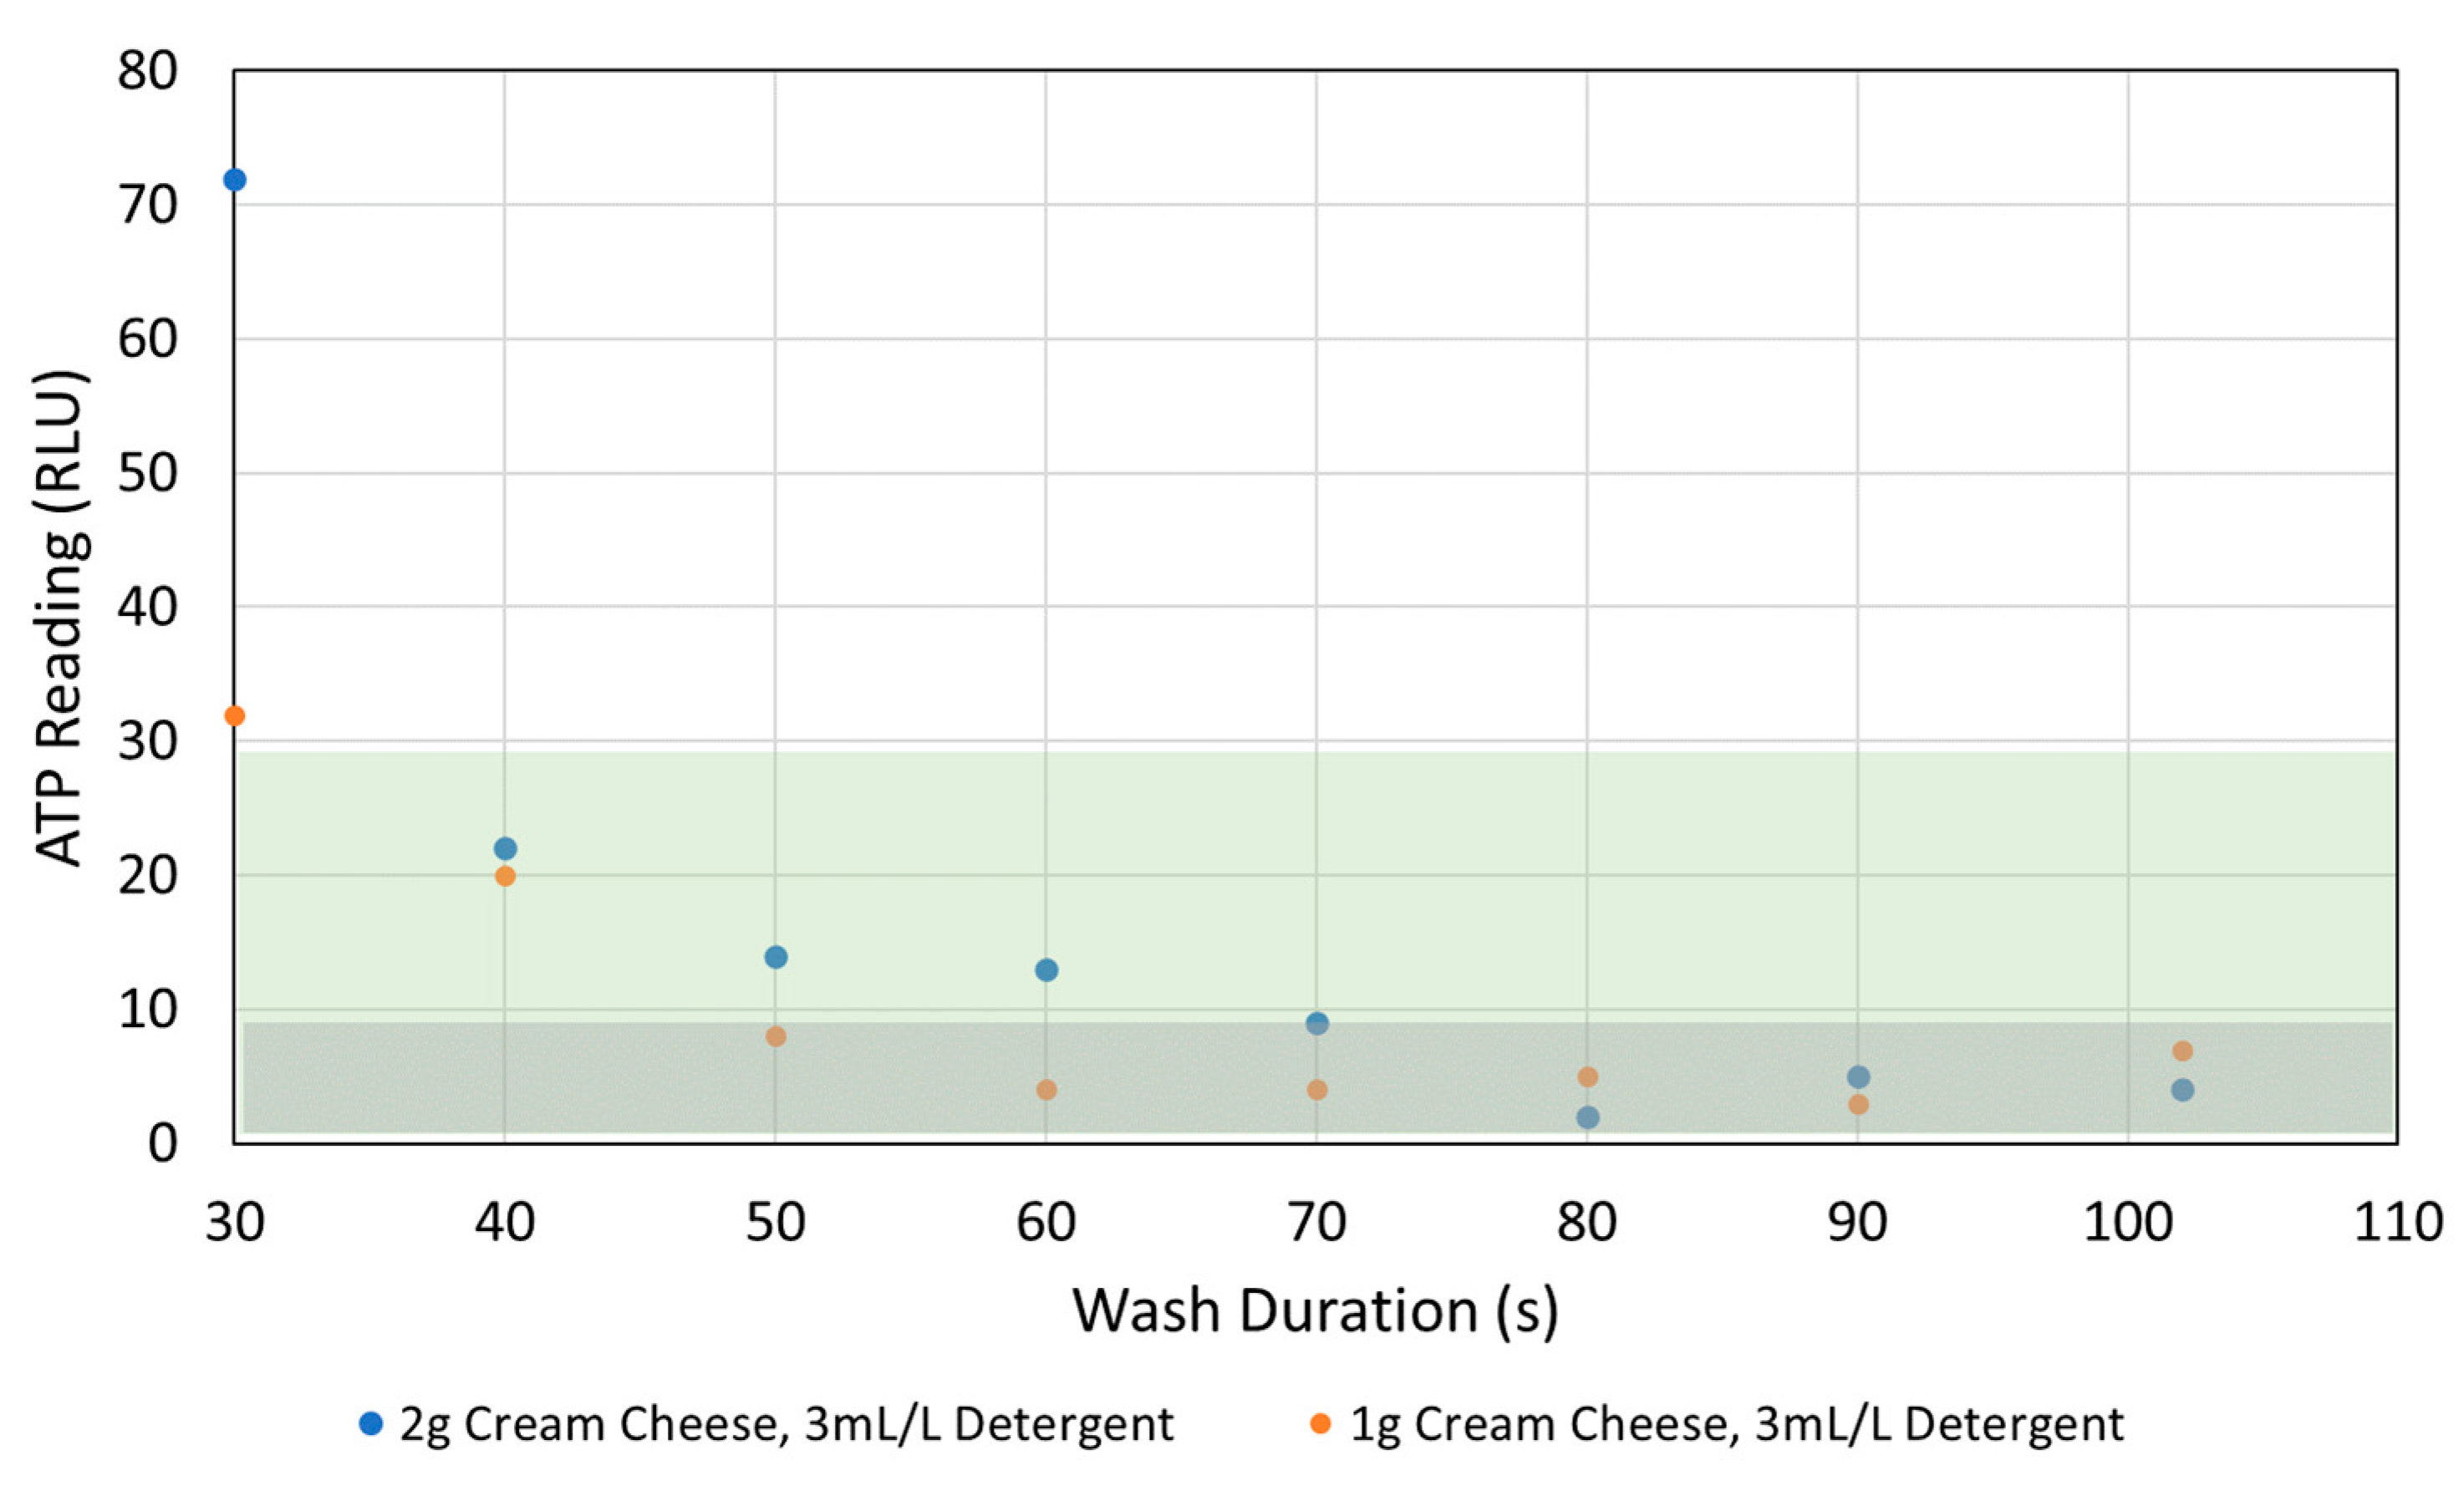
  • Wash duration: Containers fouled with 2.00 g (±0.05) of food sample were cleaned for various wash durations with the standard 10 s rinse in the warewasher. For this test, the detergent (Jantex Pro Glass Wash Detergent 0.25% caustic soda, Bristol, UK) dose was set to 3 mL/L on the warewasher (i.e., 0.075% actual caustic soda concentration).
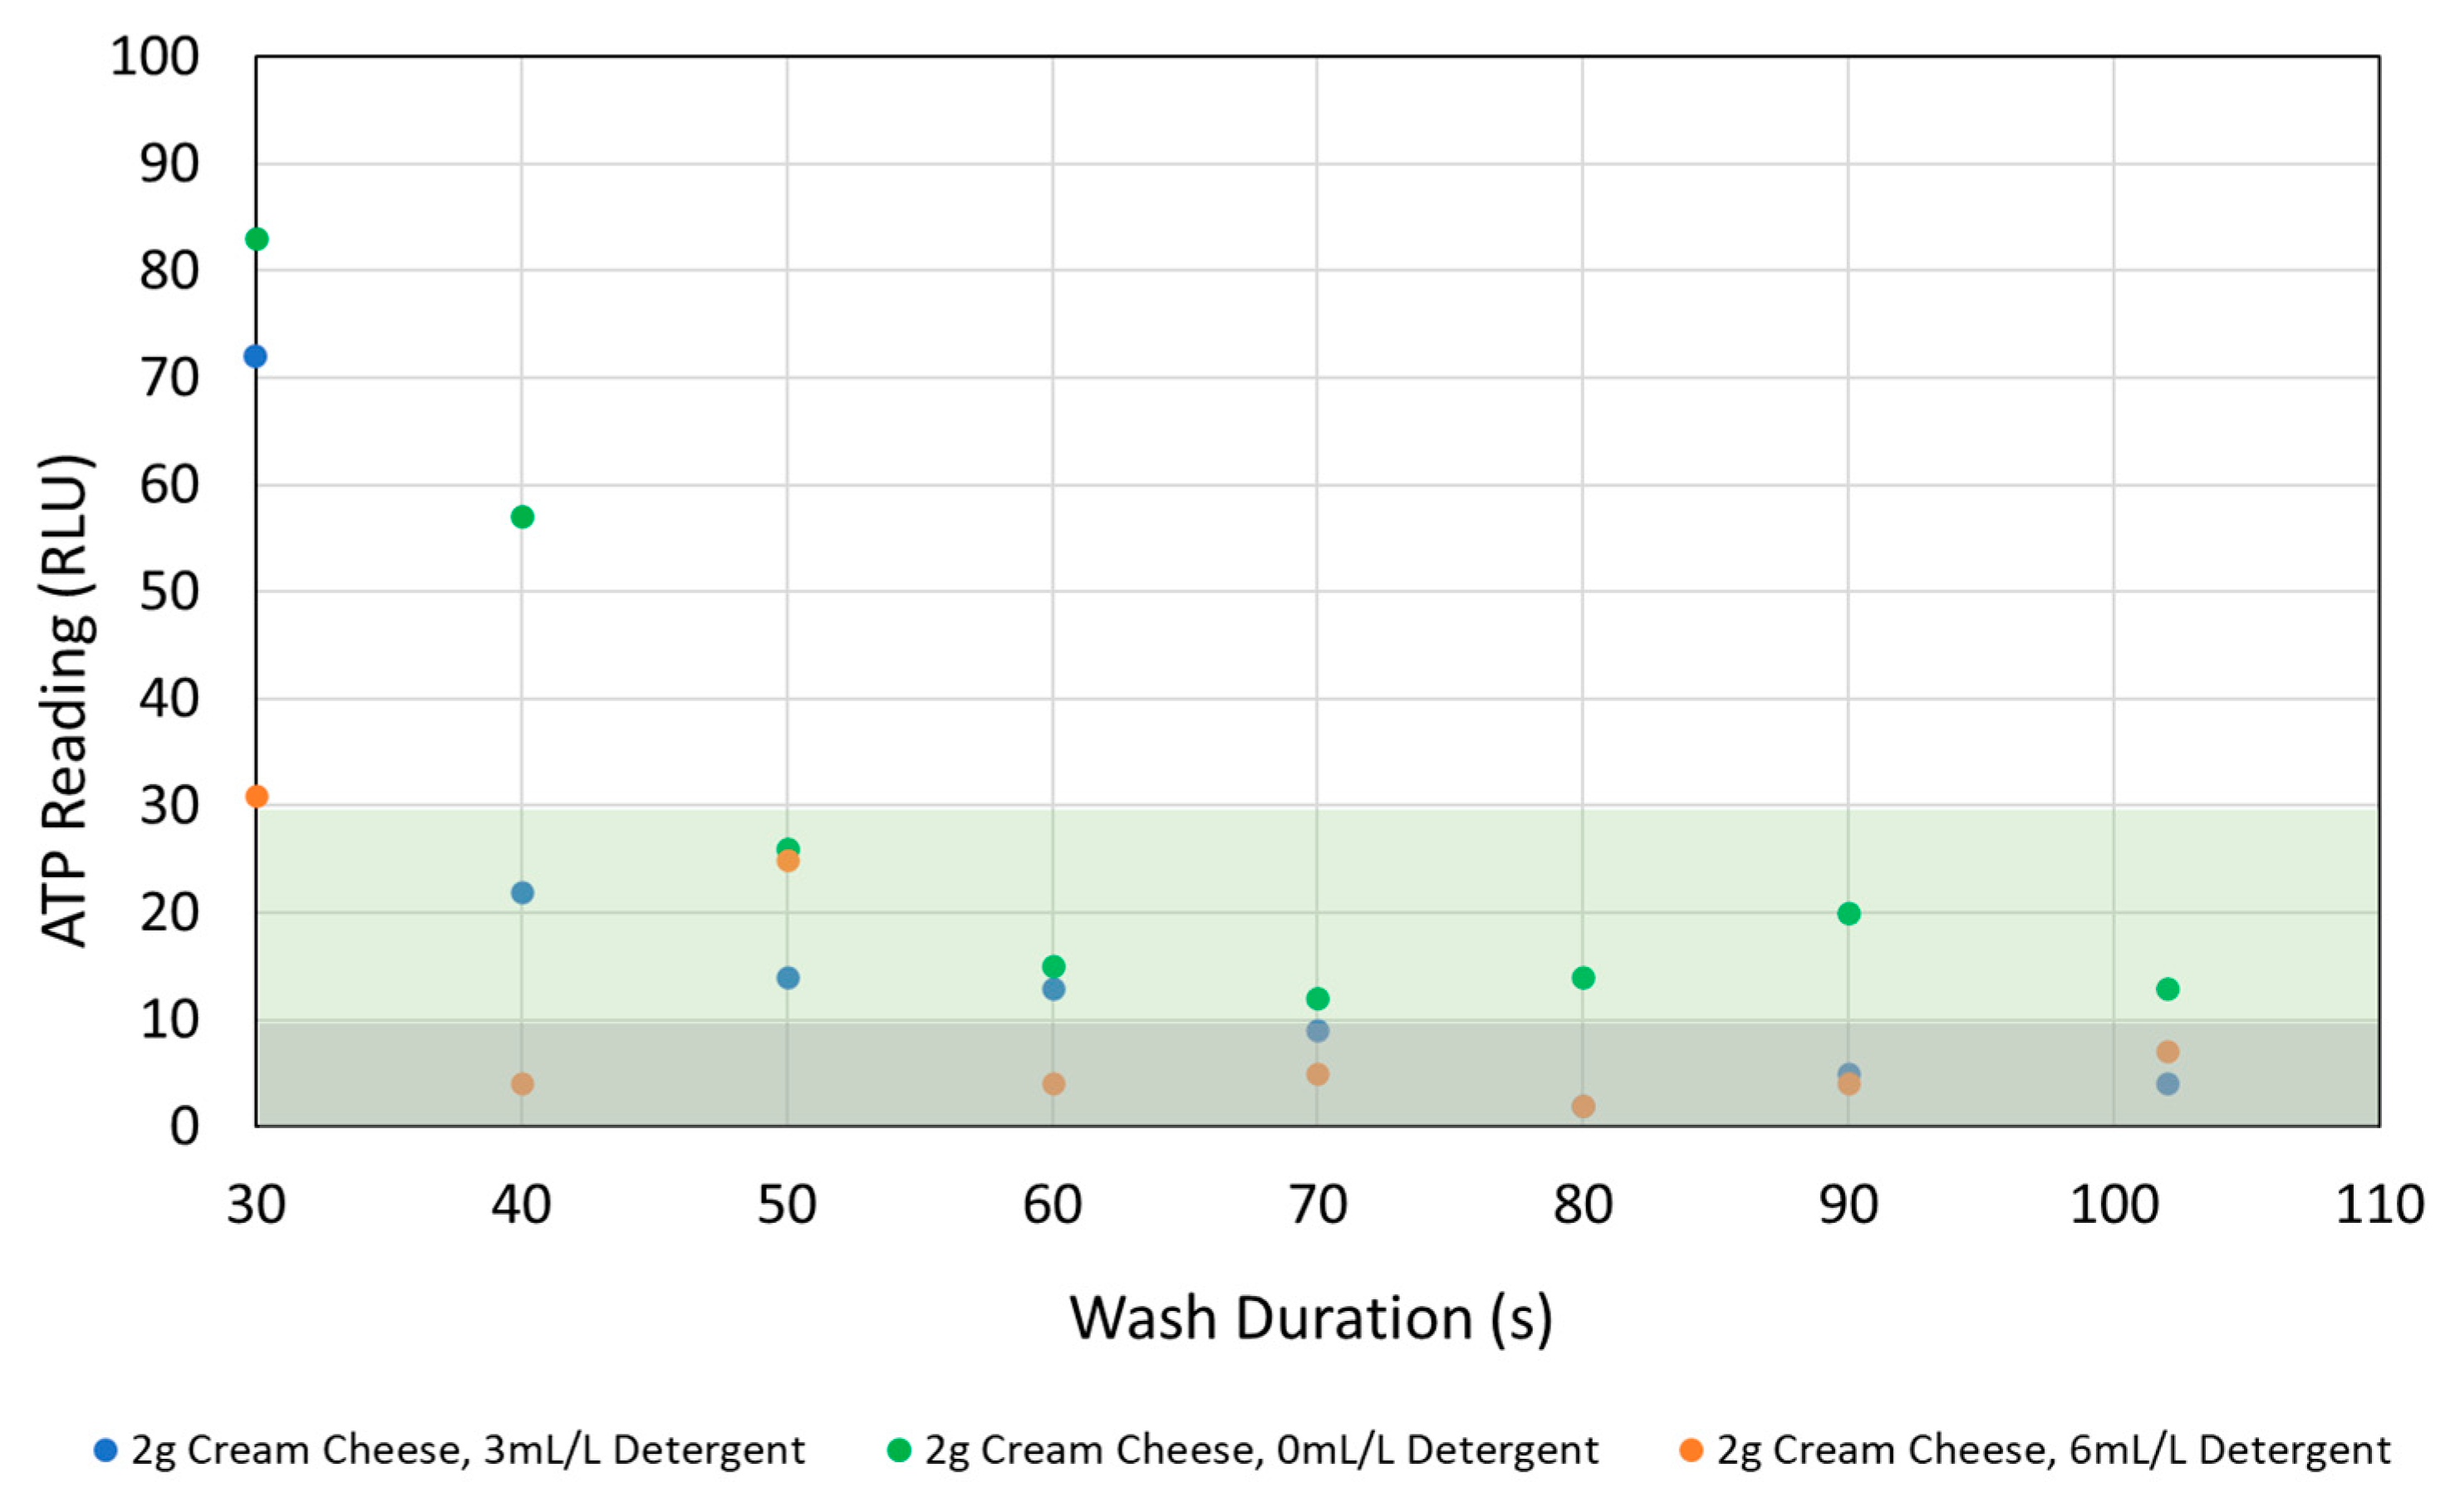
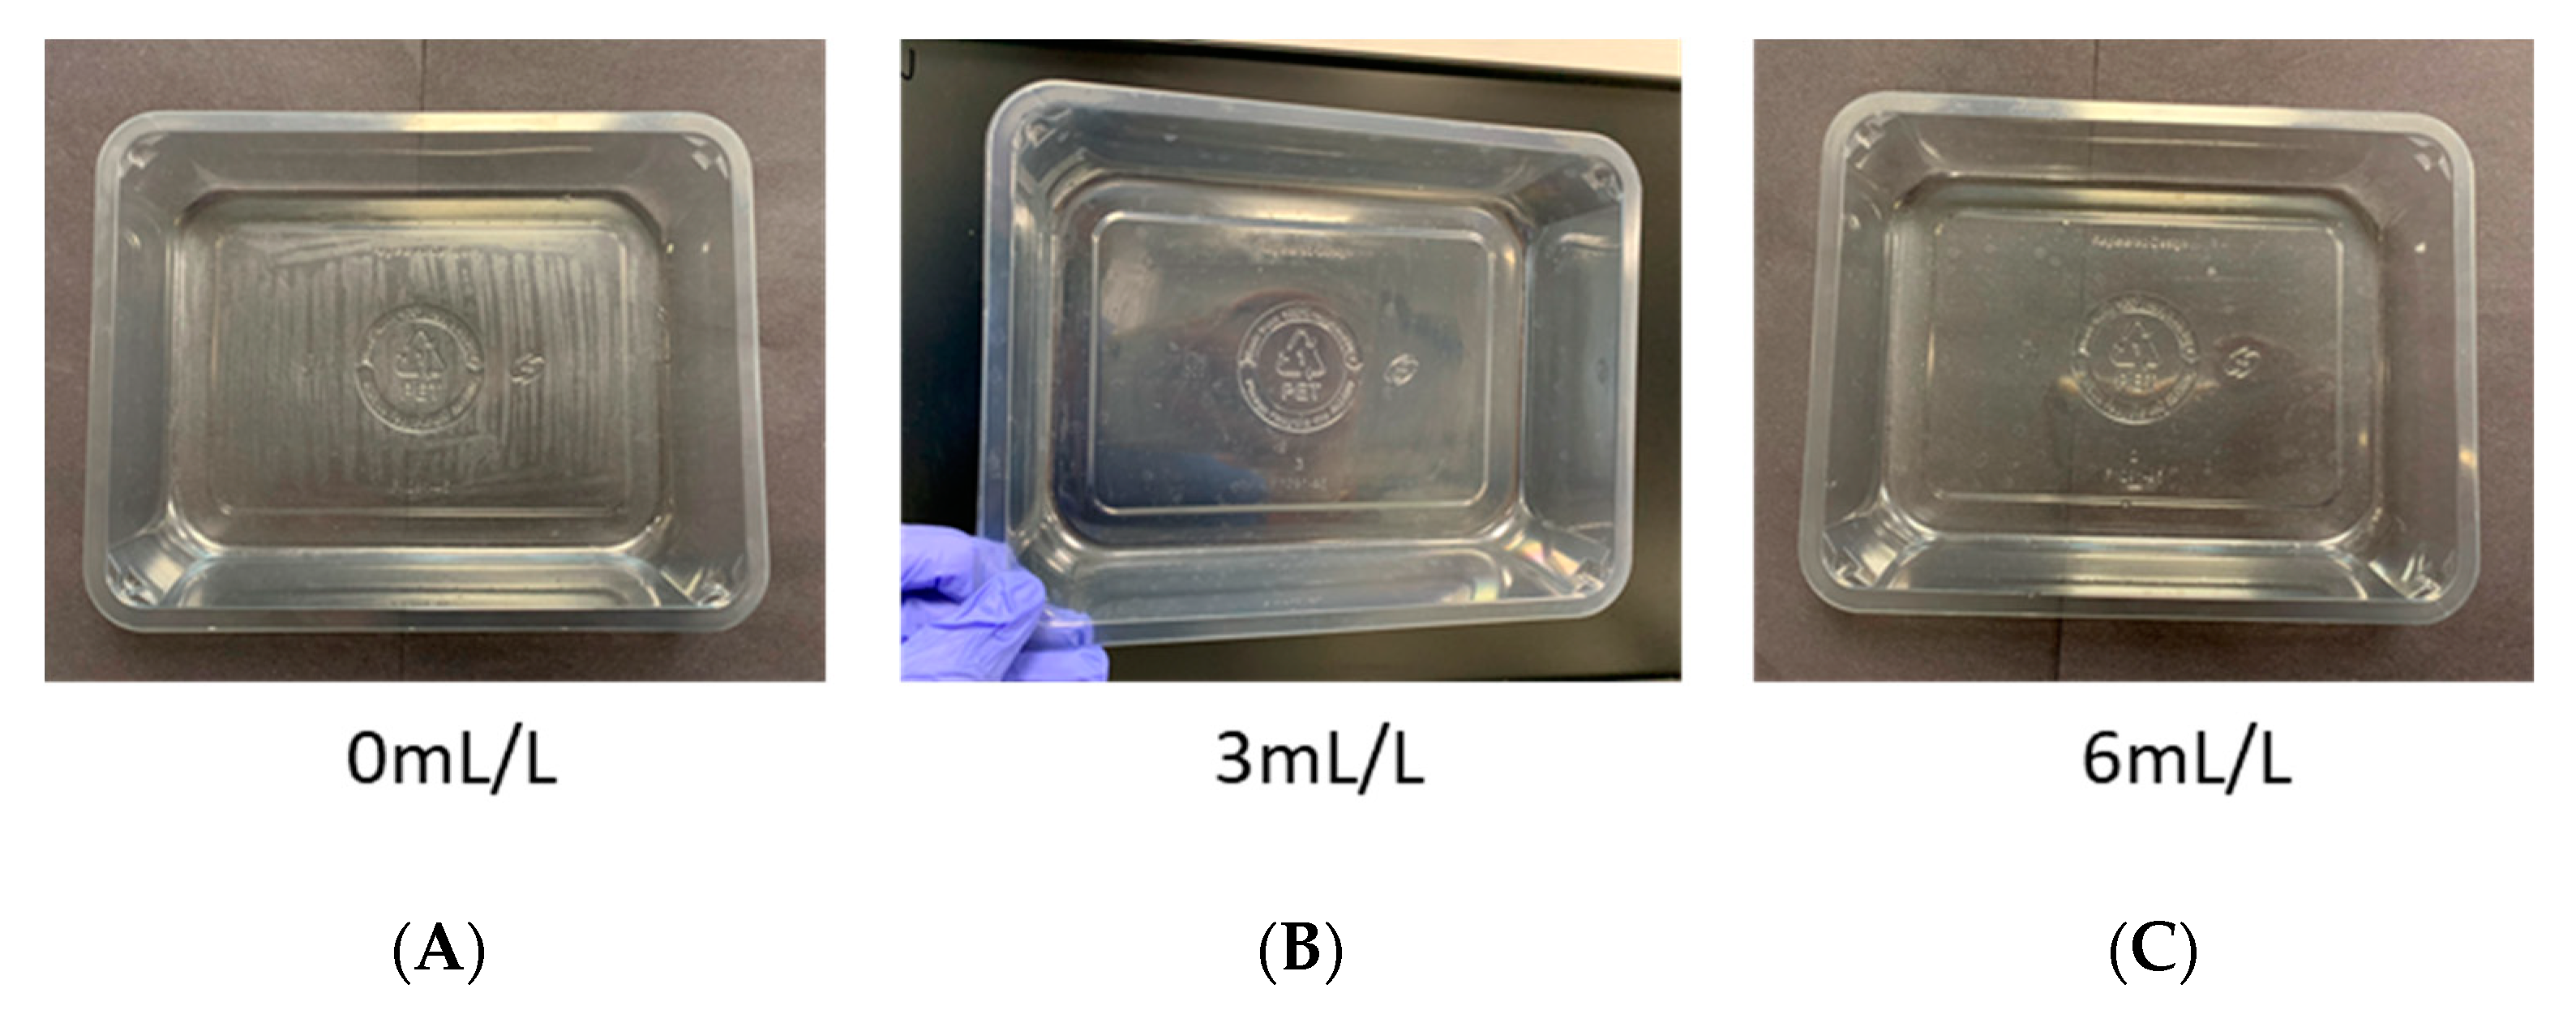
  • Detergent dose: To investigate the influence of the detergent dose, containers were fouled and washed for various durations with 0 mL/L, 3 mL/L, and 6 mL/L of detergent. Detergent was only dispensed during the wash stage. The machine was drained before changing the detergent dose and run multiple times before use to ensure the correct dose of detergent was delivered.
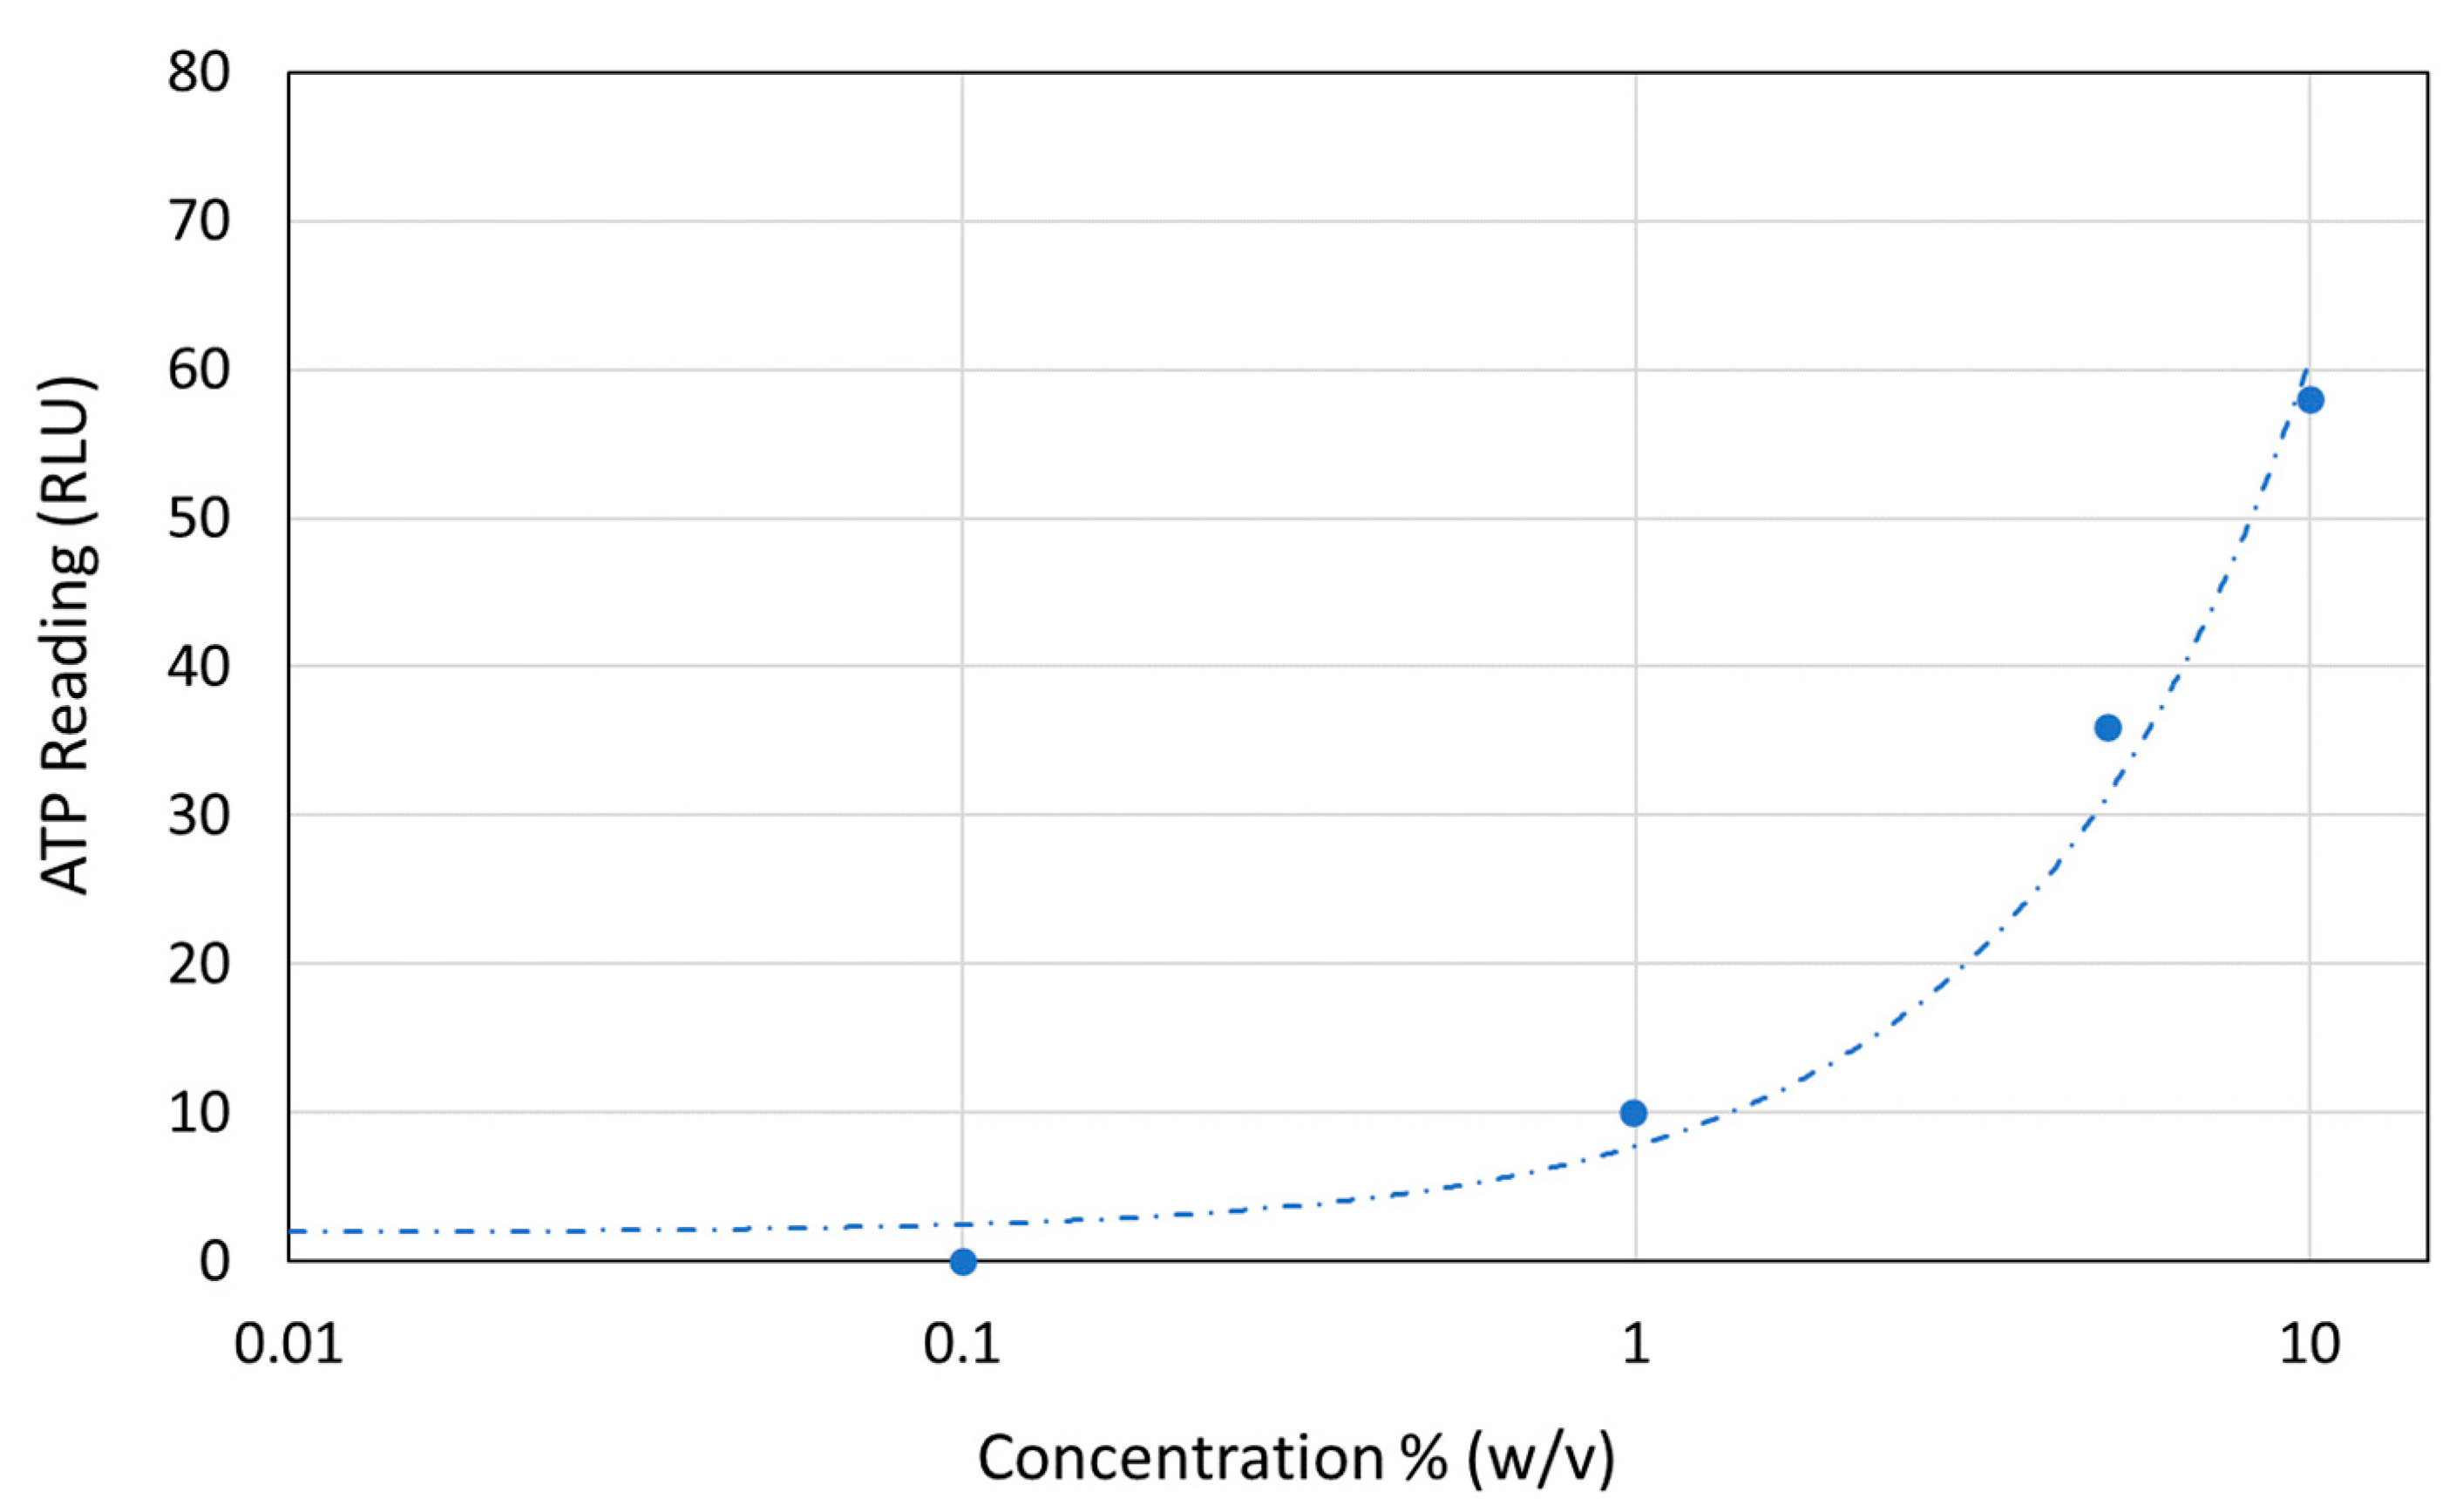
  • Fouling quantity: For orange juice, the quantity of fouling was determined by fouling a container before inverting it. It was found that when fouled with 2.00 g (±0.05) of orange juice, there was little to no dripping, therefore this quantity represented a realistic quantity of food residue. The same quantity was considered as an appropriate maximum amount of fouling for cream cheese. As the initial investigation with mayonnaise represented 0 RLU for the ATP reading, this fouling type was not studied further unless stated otherwise.

3.5. Cleanliness Assessment Method

The cleanliness assessment was performed using ATP swab test method (Hygiena SystemSURE PlusTM luminometer with UltraSnap swab, Complete Safety Supplies, Berkhamsted, UK), which is the best available technique extensively used in the food industry for food contact surfaces [26,27], receptive to different types of food fouling. Prior to investigating the washing parameters, series of diluted aqueous solutions were prepared using the three fouling types (orange juice, mayonnaise, and cream cheese) at known fouling concentrations. These solutions were then ATP tested so that results from the investigation could be compared to an equivalent solution concentration. This also allowed for the ATP monitoring set to be validated as the results were compared to that of the manufacturer [23] where possible.
Before assessing the cleanliness of the washed pack forms by ATP testing, the container was dried using a forced air flow, such that the ATP swab did not become saturated with water, preventing the pickup of fouling. For the particular ATP device used, the measurement range is 0–9999, and 30 RLU (relative light units) or above is classed as a failure [28]. Hygiena luminometers are present with Pass and Fail RLU limits of 10 and 30 RLU for the SystemSURE Plus. These limits are based on industry standards and published study recommendations, and corresponding RLU indicate surface is considered as clean. For this system, a 100 × 100 mm area was swabbed based on the manufacturer guideline [28] with an outline placed under the container to provide a visual guide, and swabbing was always done at a similar location on pack forms regardless of the presence of visual fouling. The swabs were removed from the refrigerator 10 min before use, as recommended in the instruction manual [28].
Furthermore, to conclude whether the presence of the caustic soda detergent may influence the ATP test, a quick quenching test was performed. In this test, 10 µL of 1:100 orange juice to deionise water and 10 µL of 3mL/L detergent solution was deposited onto an ATP swab. No difference in ATP test results was observed when the orange juice solution was tested with and without the detergent solution. In addition to ATP swab testing, visual inspection of the cleaned packs was undertaken and is noted, where relevant, in the reported results.

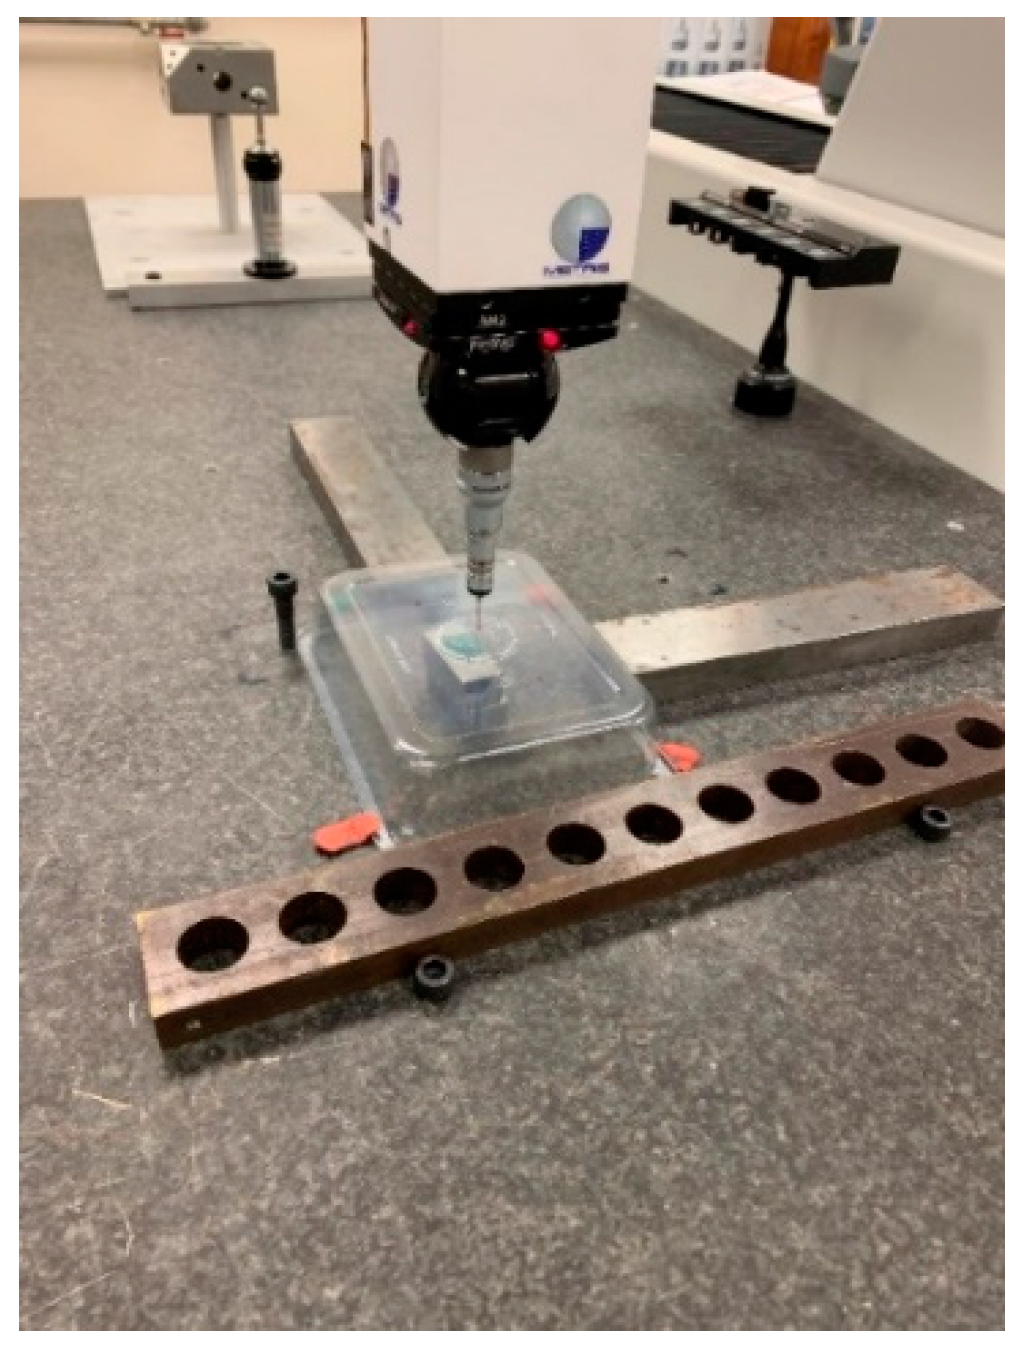
3.6. Deformation and Material Properties

To investigate the influence of repeated washing on the rPET material properties, packs were washed 0, 5, 10, 15, 20, 25, and 30 times using the ‘standard’ warewasher setting with 3 mL/L detergent dose. Between tests, the rack containing the pack forms was briefly tilted to remove any rinse water from the top of the containers. The deformation of the pack forms was investigated by metrological methods as well as monitored qualitatively by taking respective images. The width and length of the packs washed 0, 15, and 30 times were measured using digital callipers and the height using a LK Metrology® Metris Ultra coordinate-measuring machine (CMM), Derby, UK. The packs were placed upside down on the CMM (Figure 2) so that four points on the base (defined by the pre-existing texture on the container base, shown in Figure 3) could be located using the machine. The four points were used to calculate an average height of the pack, and a point in the centre was measured to determine the assumed minimum height, where most deflection occurred.
The volumes of the washed packs were calculated by filling the containers with water until the meniscus broke, causing the water to spill out of the container. This approach was not applicable to the containers washed 5 and 10 times as the deformed base deflected under the weight of the water.

3.7. Analysis of Physio-Chemical Properties

Those samples subjected to dimension deformation measurement then underwent material testing to monitor changes to the plastic due to the washing process. Testing comprised of tensile testing, differential scanning calorimetry (DSC) to identify changes to the material’s thermal properties, and infrared spectroscopy to detect changes to the material’s chemical structure.
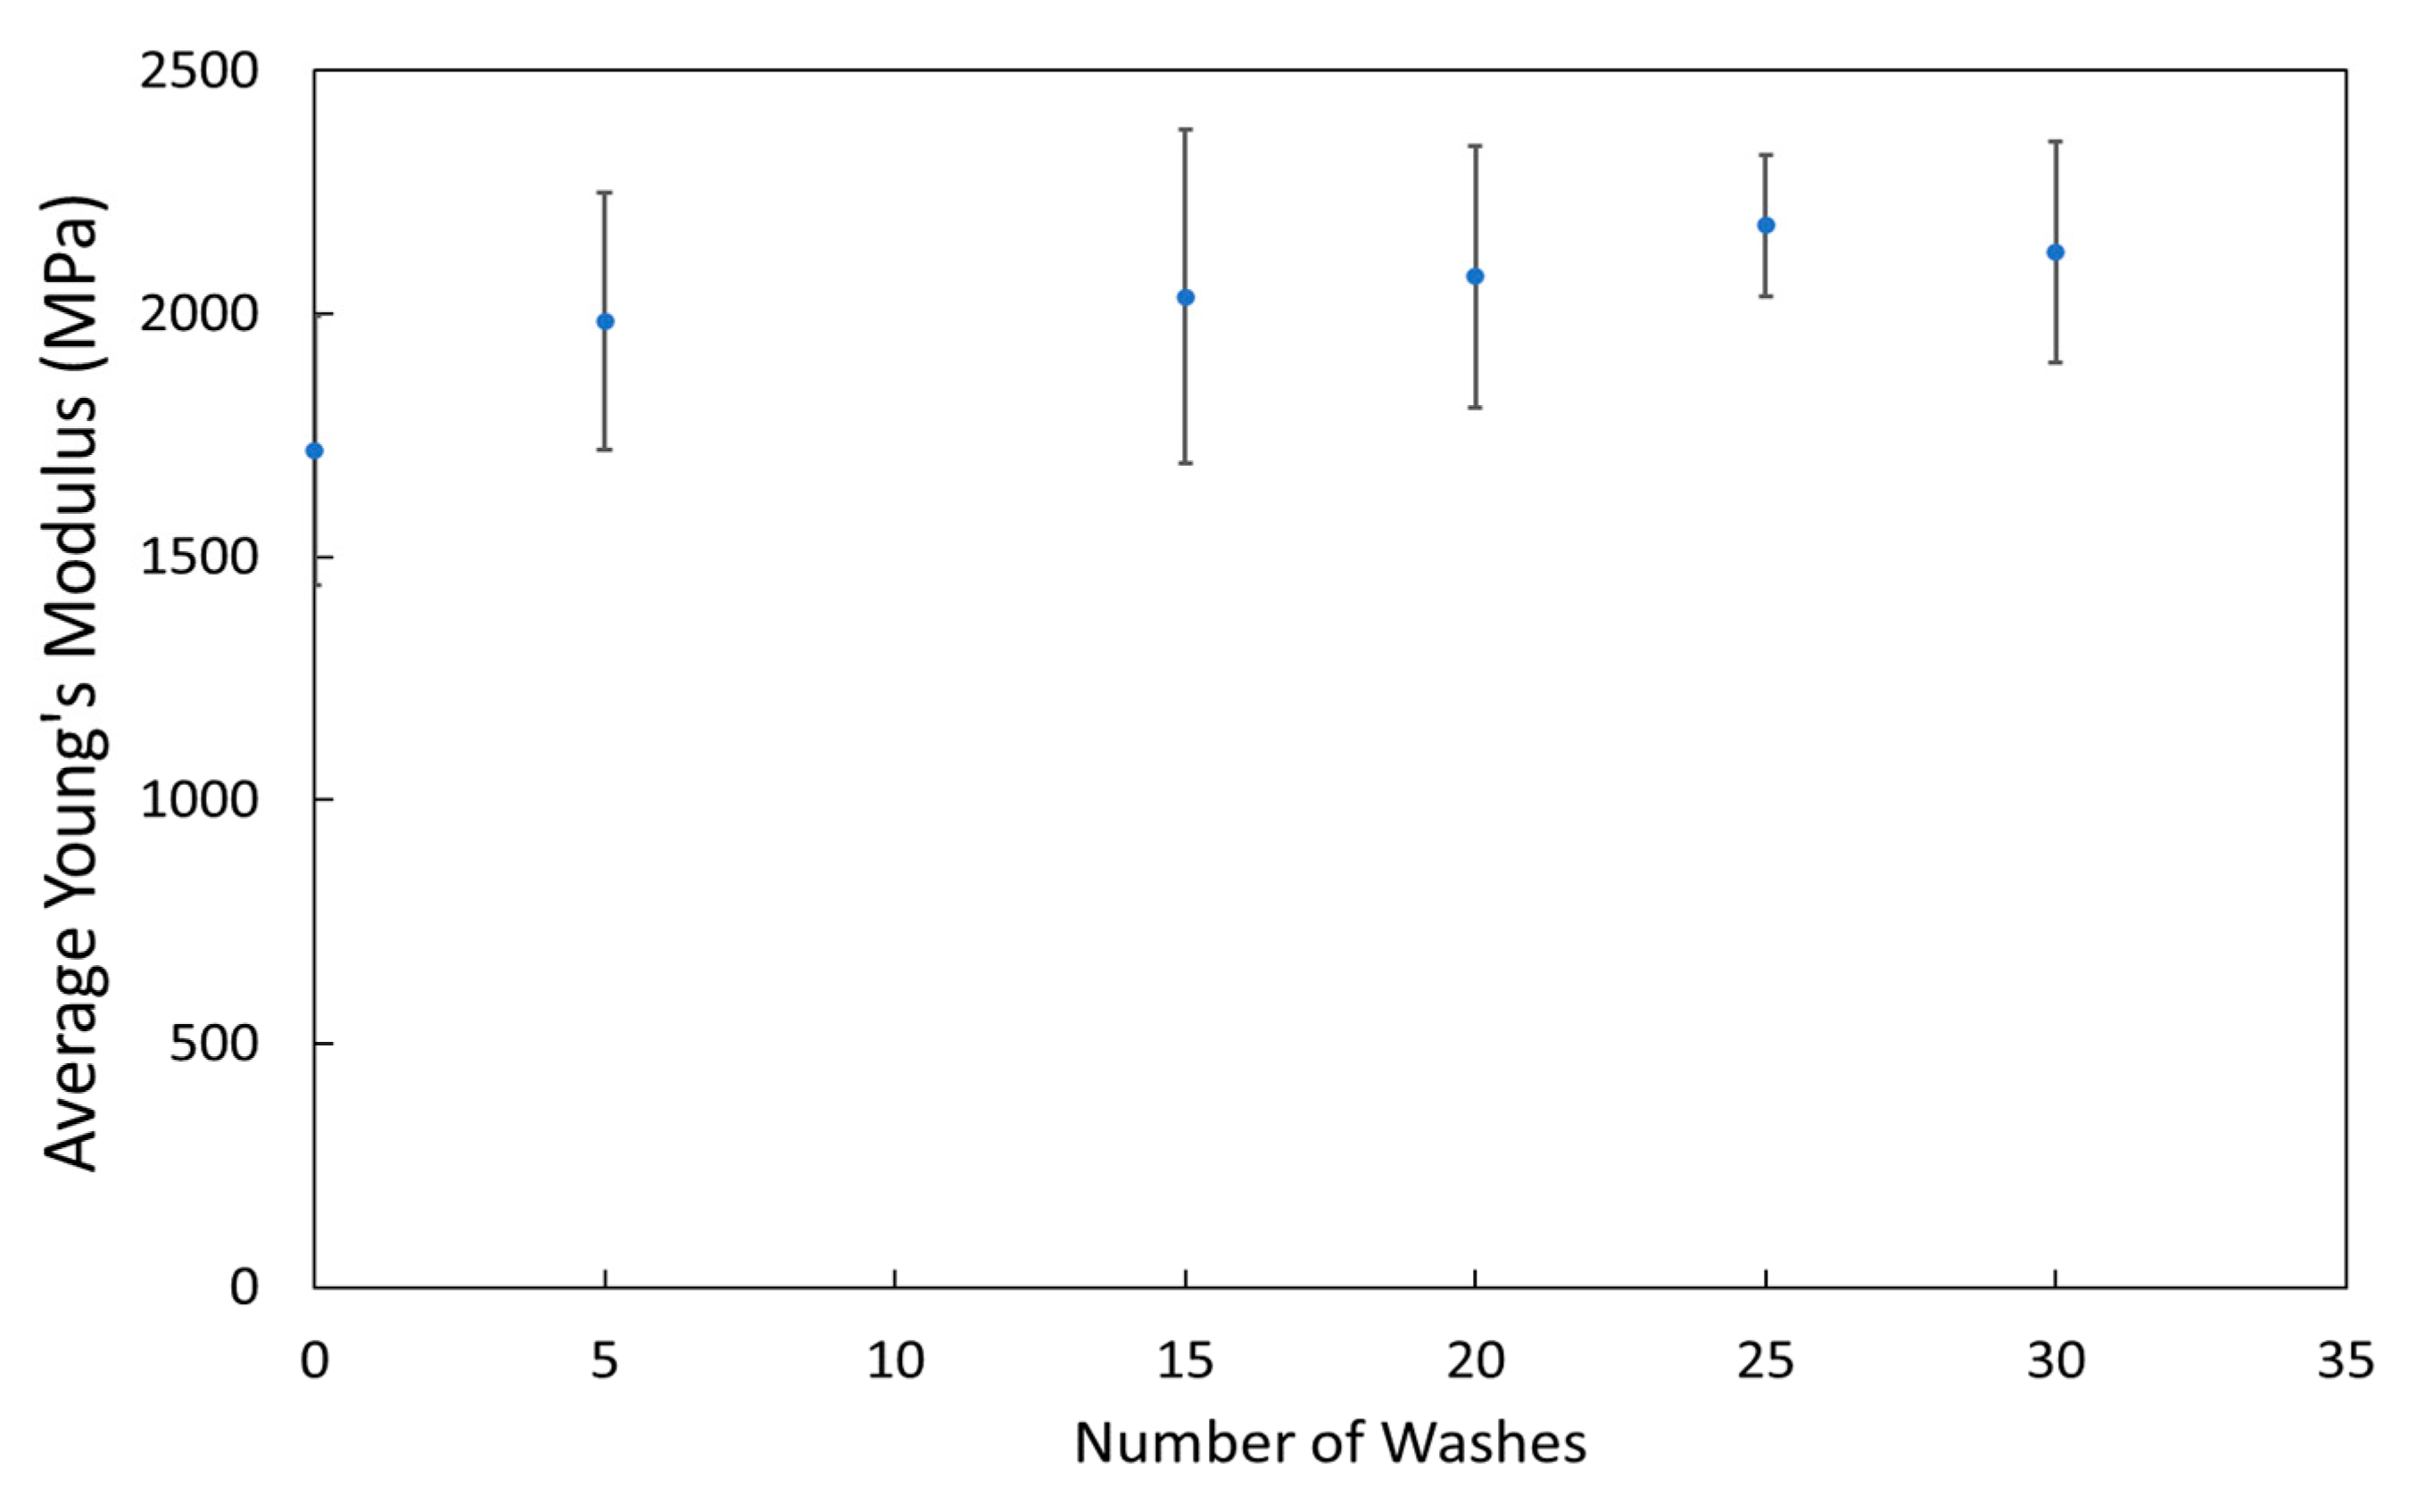
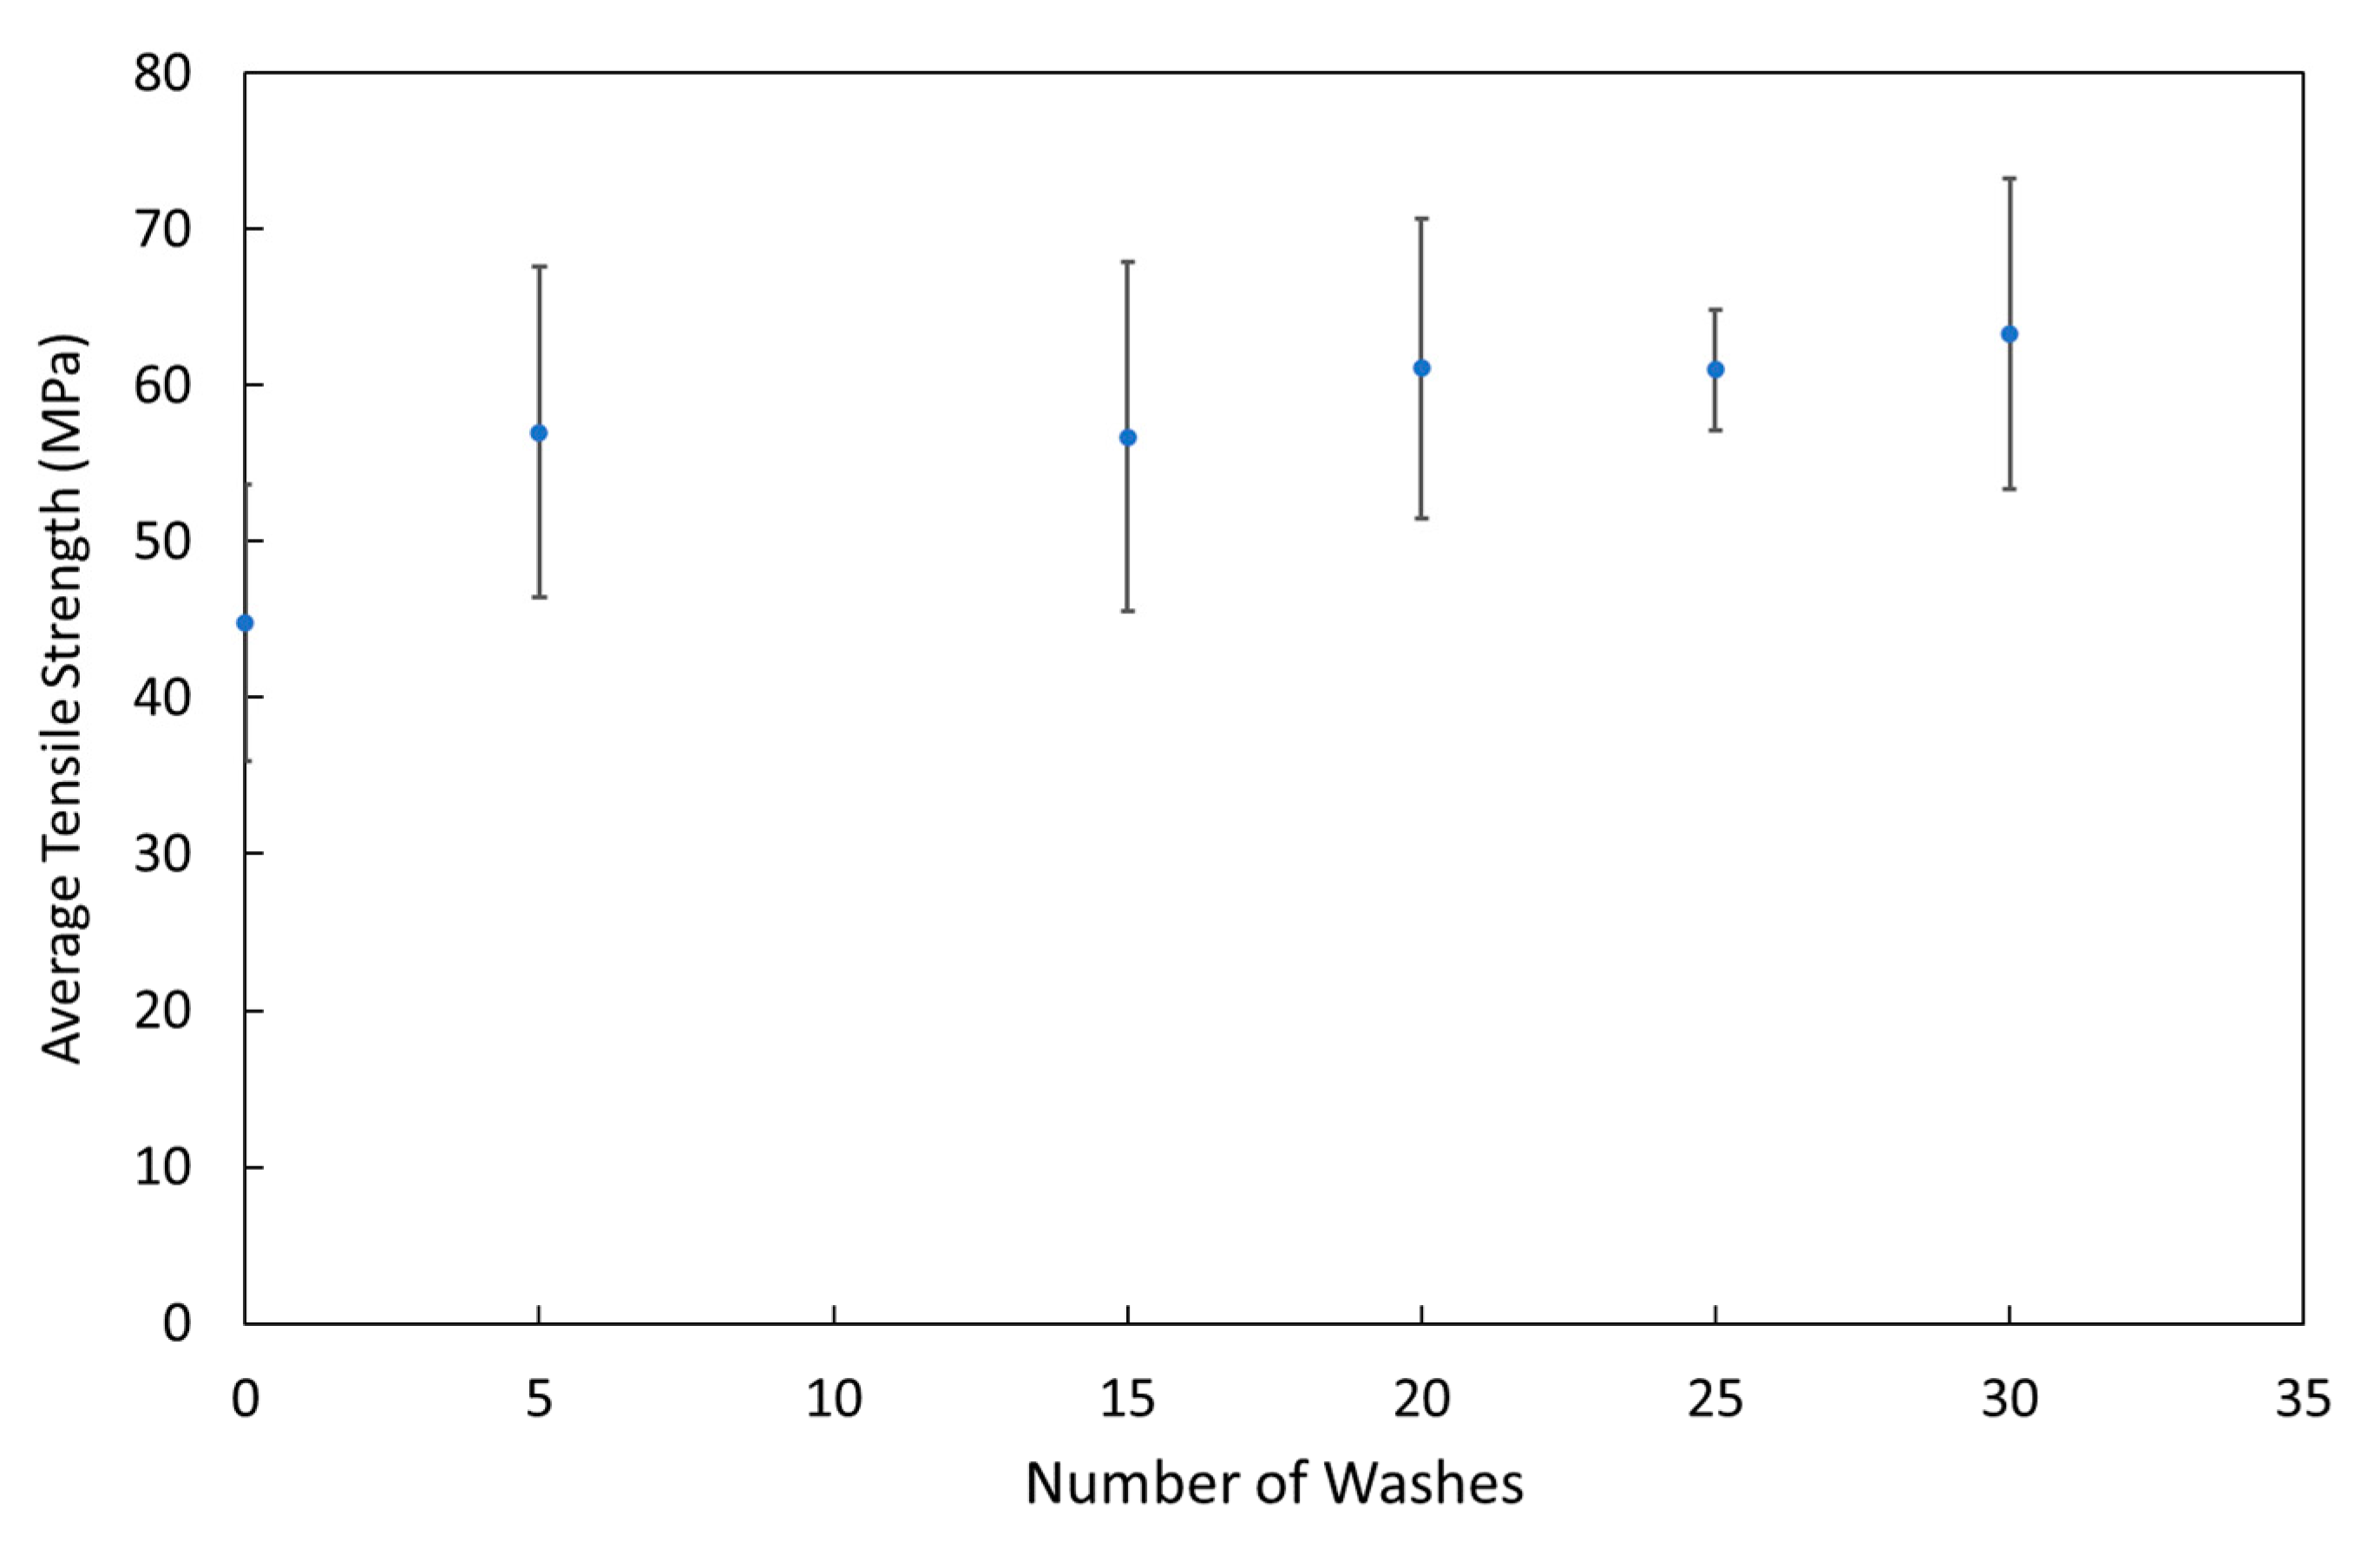
  • Tensile Testing: Before testing, the rPET packs were cut into small dumbbell shaped samples and equilibrated at 25 °C and 50% relative humidity. Tensile strength at yield and Young’s Modulus of the pack samples were measured using an Instron® 3366 universal testing system according to the ISO 527-2 standard testing parameters at a tensile rate of 80 mm/min. Measurements were performed on 6 samples across the area of the packs and the average results were recorded.
  • Differential Scanning Calorimetry (DSC): The thermal characterisation of the packs was performed using TA instruments® Q200 DSC, New Castle, DE, USA. Approximately 5 mg of sample was heated from room temperature to 300 °C at a rate of 10 °C/min. Thermal transition values were determined using TA® Universal Analysis software, New Castle, DE, USA. Measurements were performed on 3 samples across the area of the packs and the average results were recorded.
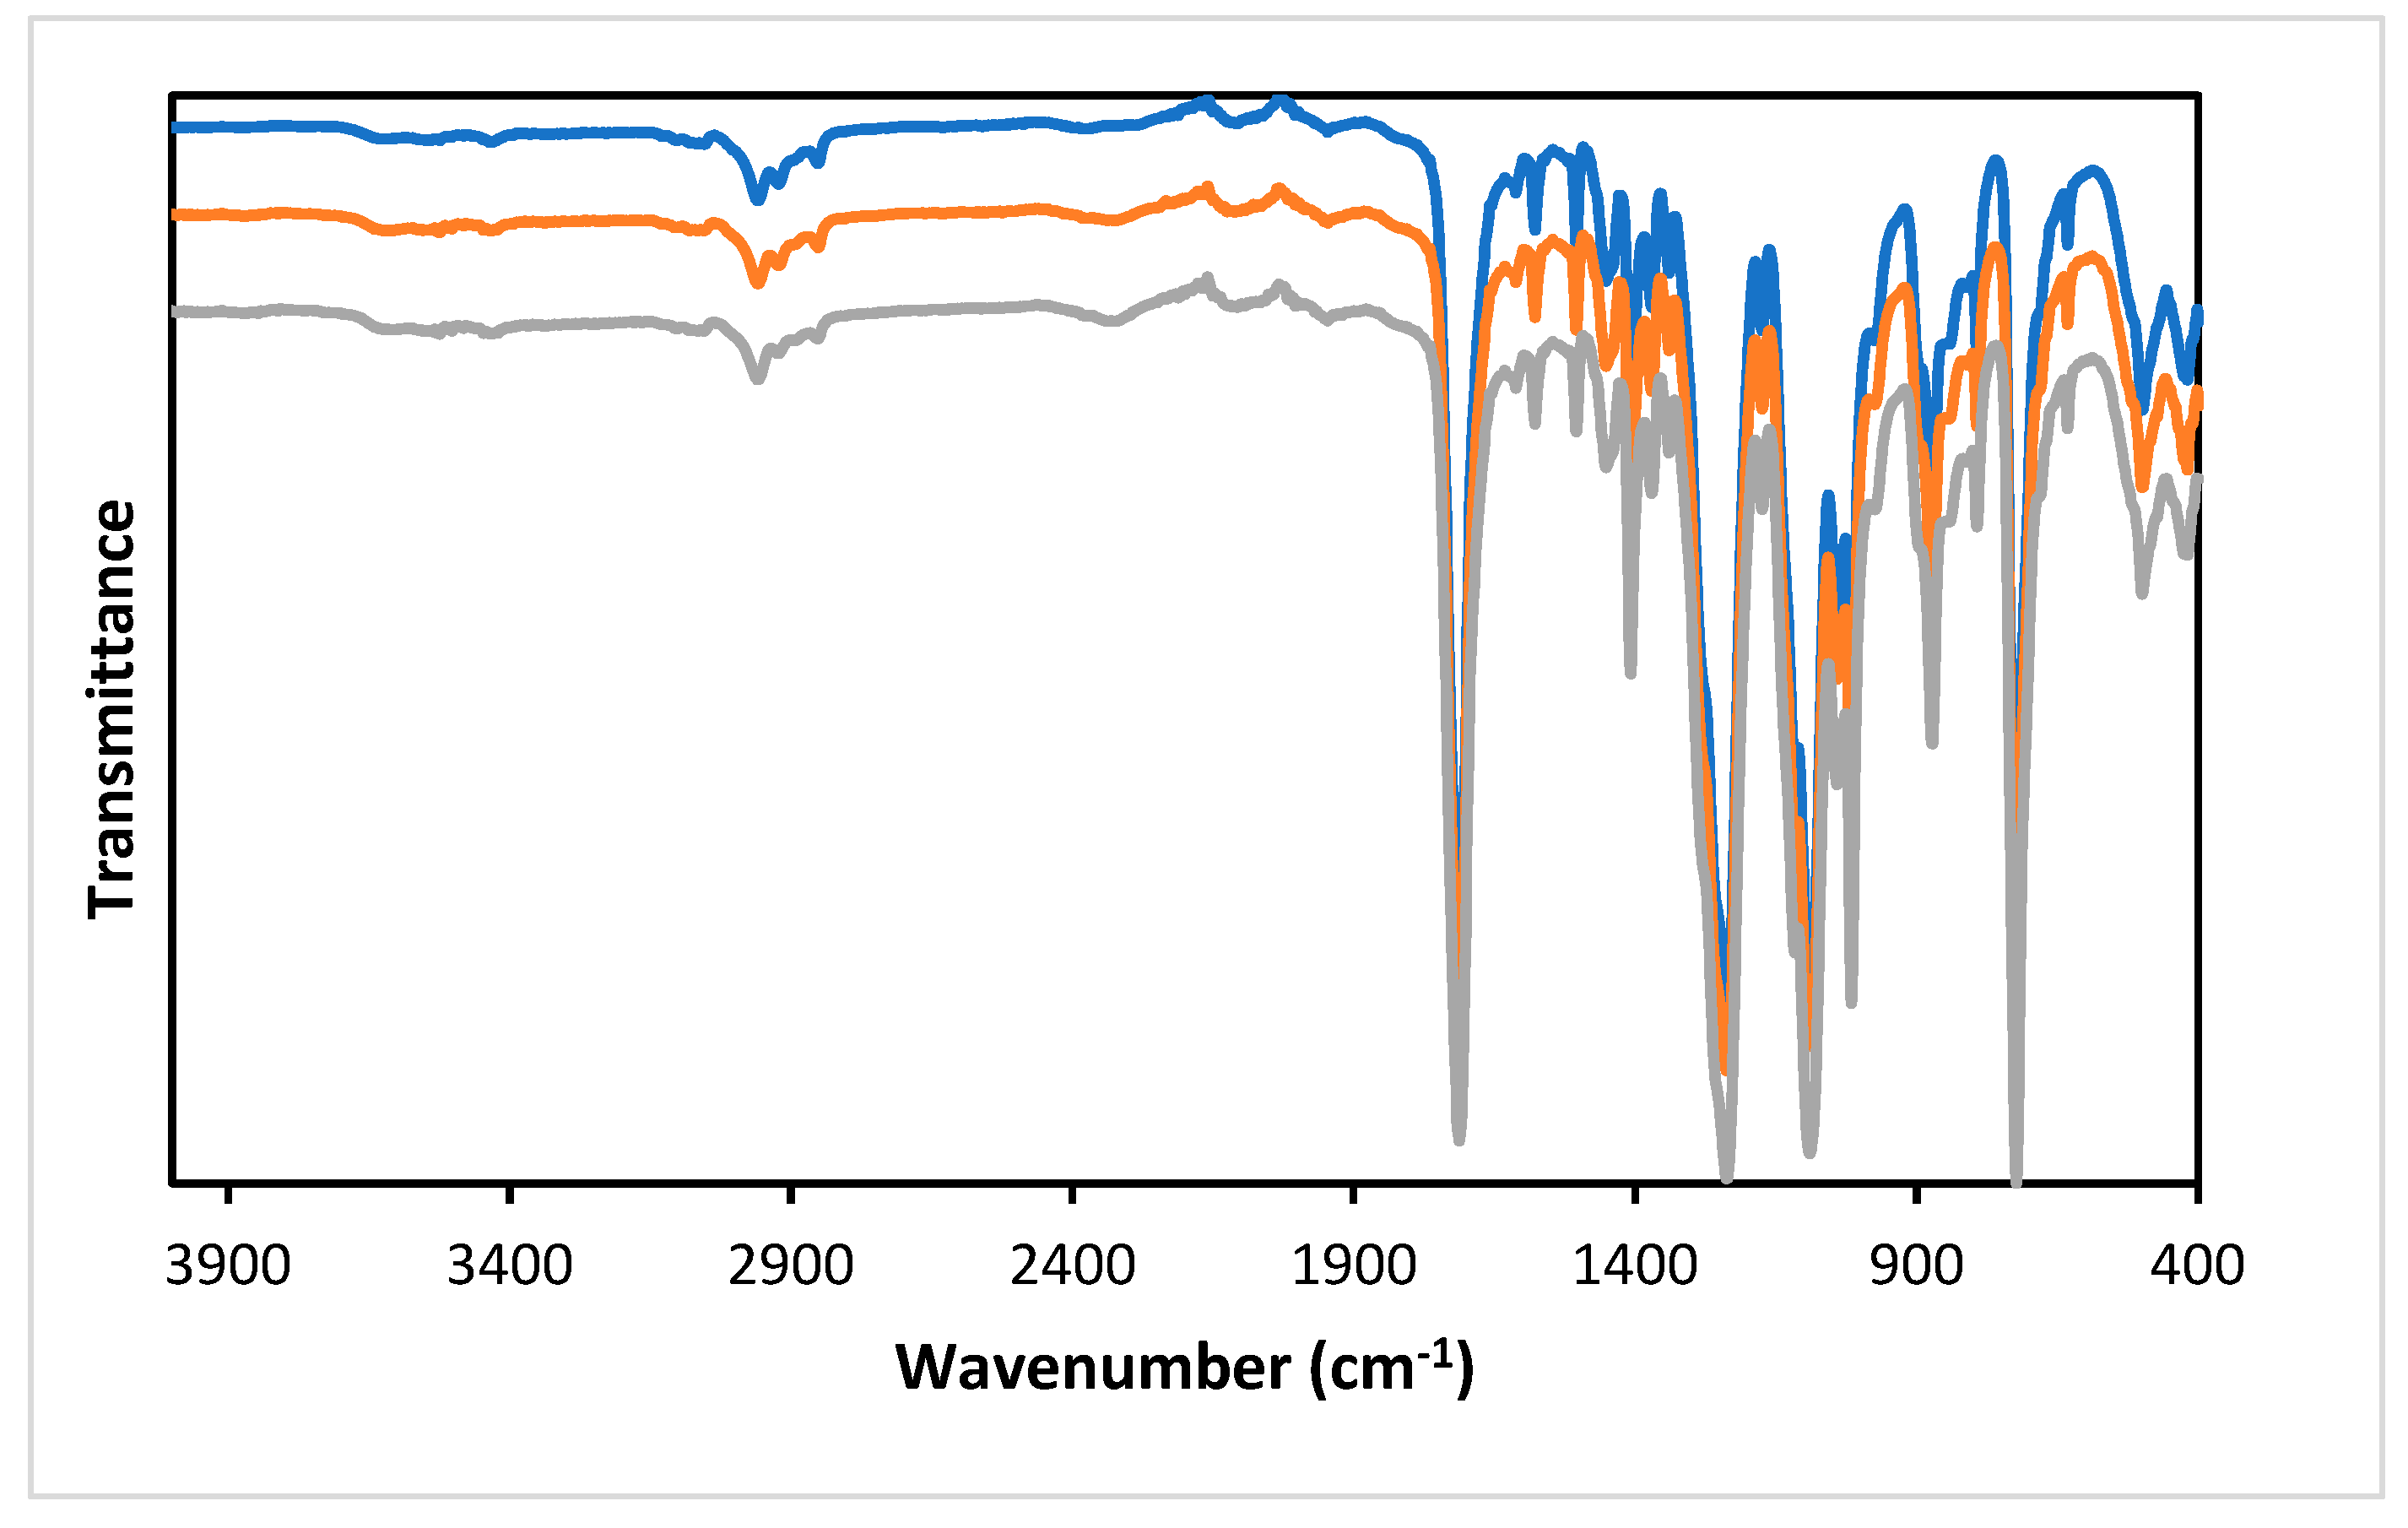
  • Fourier Transform Infrared (FTIR) Spectroscopy: FTIR spectroscopy was performed directly on small cut sections on the packs using a Shimadzu® IRTracer-100, Milton Keynes, UK, equipped with an attenuated total reflectance (ATR) attachment. Data was collected in the region of 400 to 4000 cm−1.

4. Results and Discussion

4.1. Cleaning Assurance Assessment Using ATP Swab Test
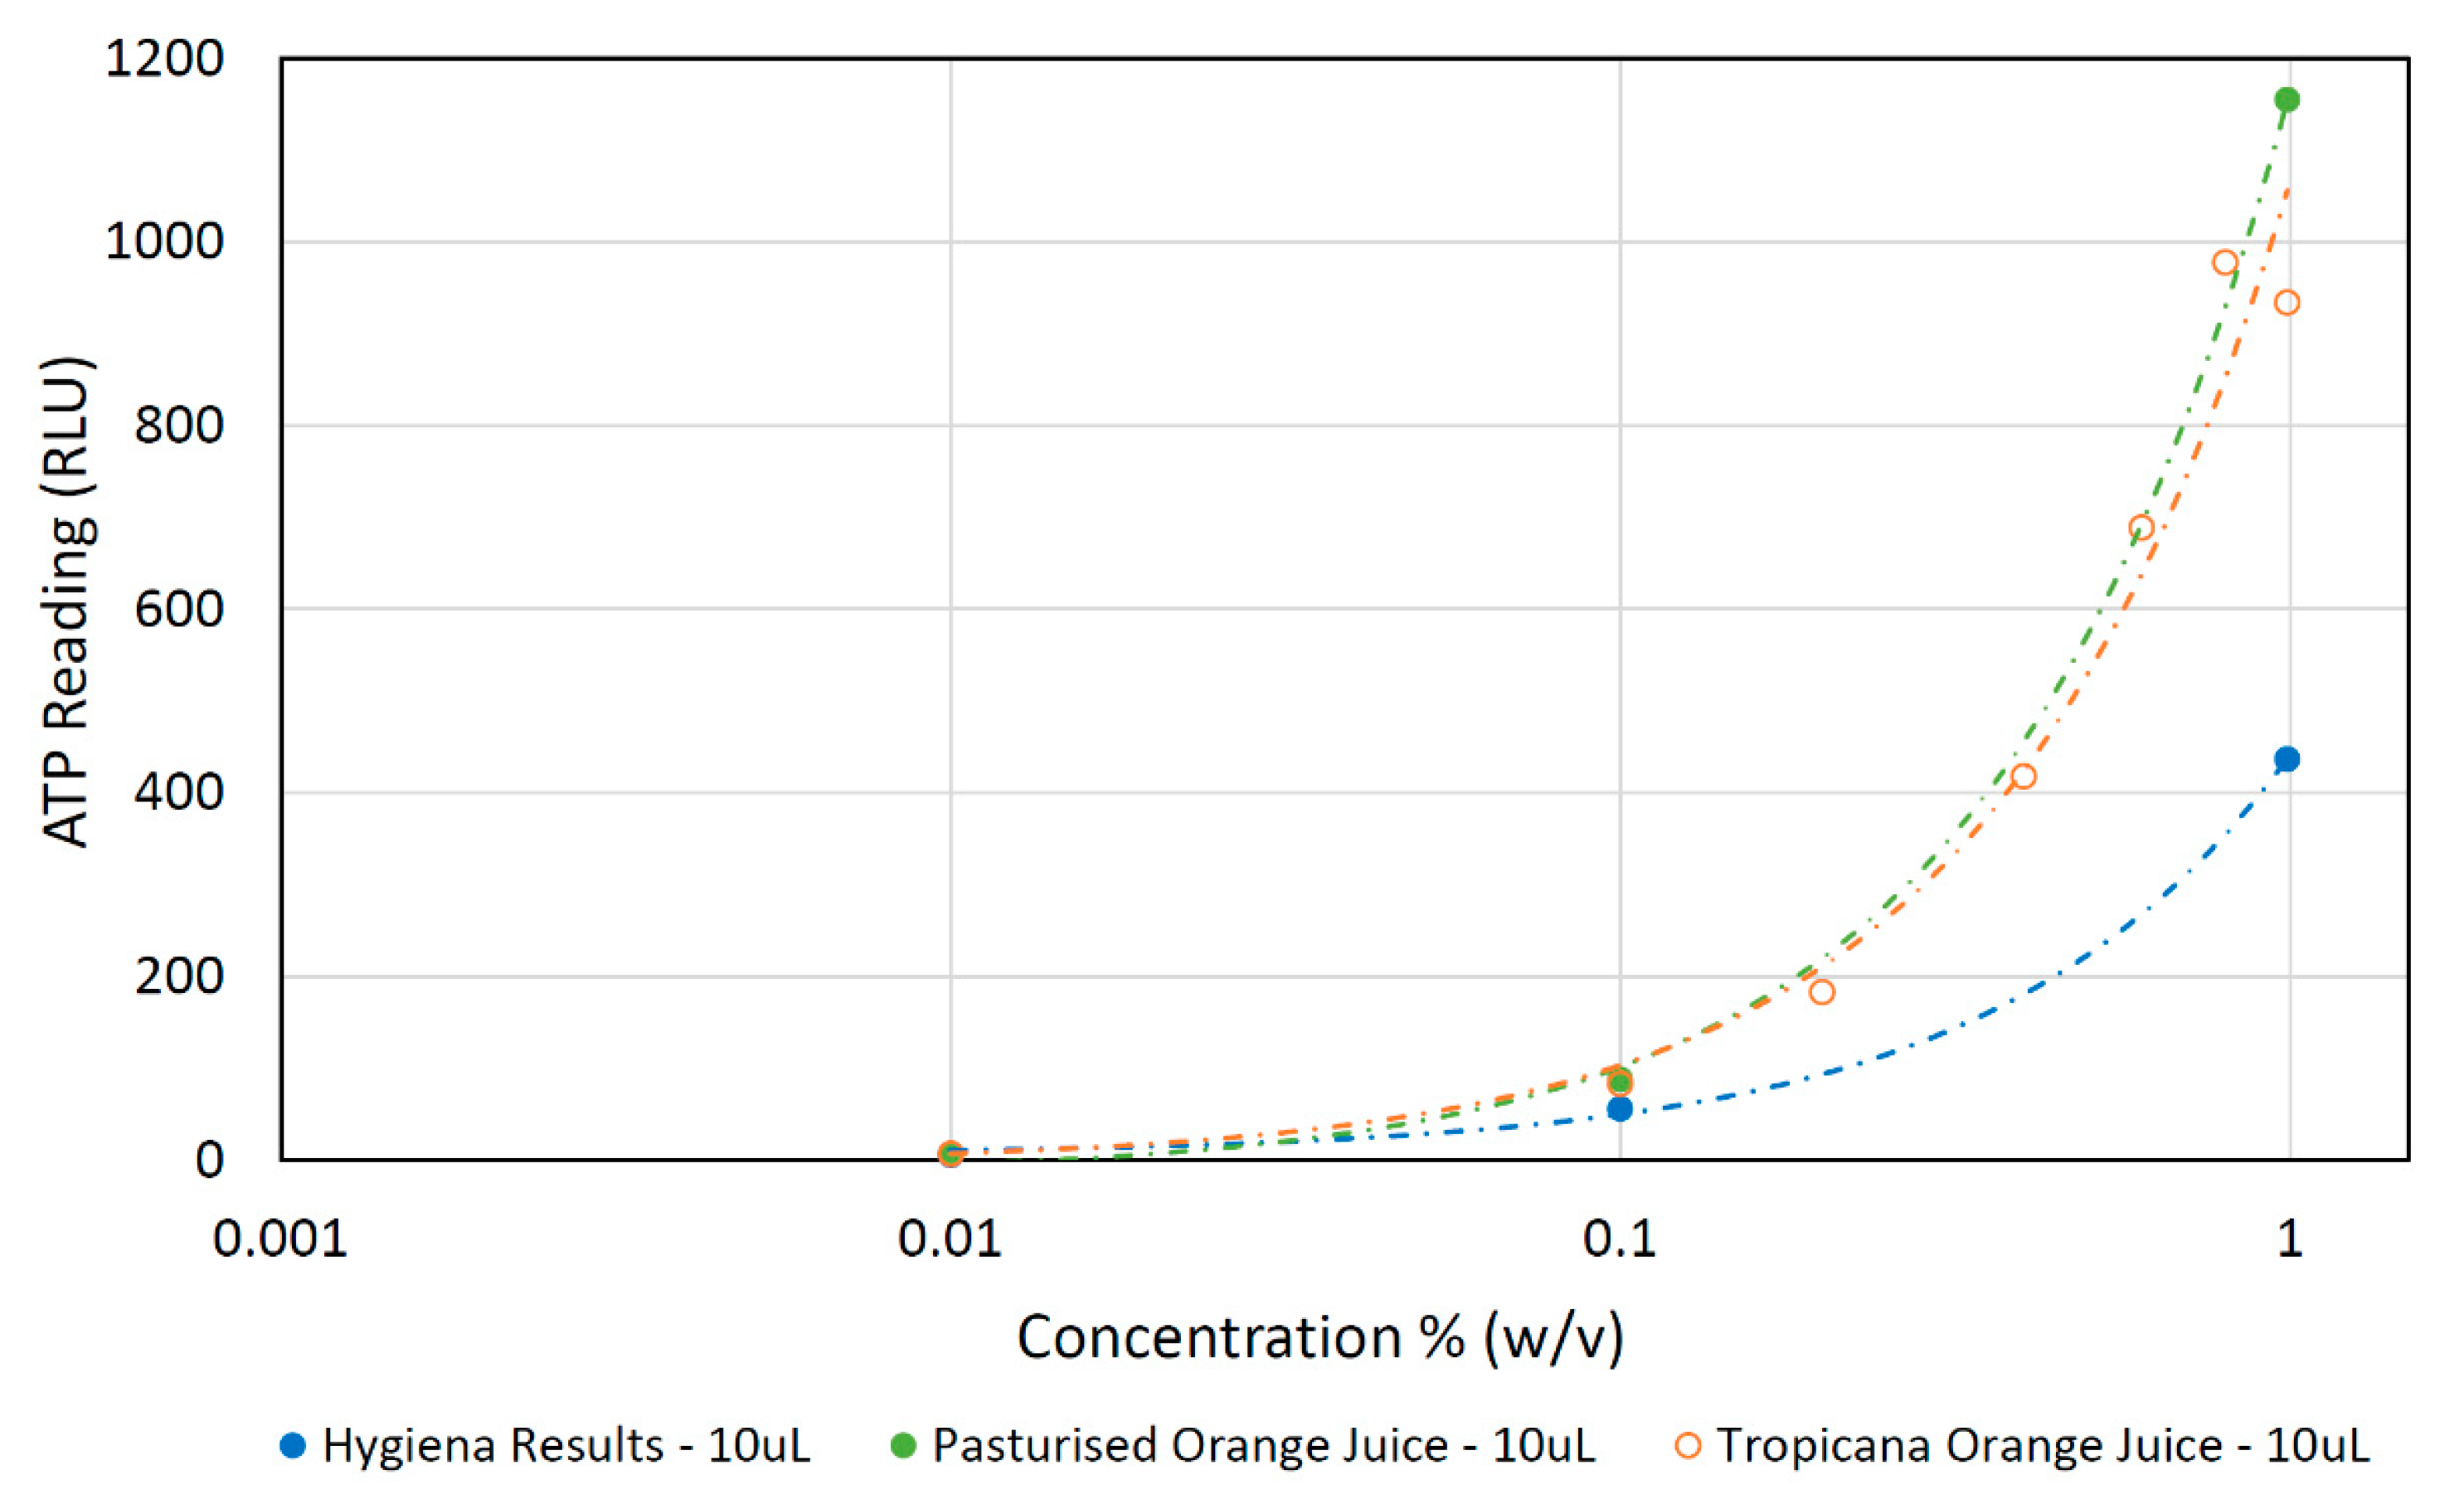
ATP testing was used to assess the cleanliness of the washed packs (tables of results shown in Appendix B), however this technique’s susceptibility to error causes uncertainty in the ATP results collected as investigated, with three different fouling types as outlined below.

4.1.1. Orange Juice

The experiment was performed using a pipette to deposit 10 µL of the orange juice solution ranging from 1 to 0.1% (w/v) onto an ATP swab, so that the obtained results could be compared with those concentrations published by Hygiena [29,30]. This test was repeated with Tropicana® Smooth No Bits Orange Juice and Morrisons® 100% Fruit Smooth Orange Juice (pasteurised) as the published report [23] by the manufacturer specifies pasteurised orange juice. All tests were conducted with the ATP handheld device upright in accordance with user guidelines. The results in Figure 4 show similar ATP readings between the two brands with both following linear relationships. However, both sets of results are greater than the results stated in the published report [23], indicating an unidentified deviation between the two methodologies. In any case, the obtained results allow the generation of a calibration curve based on the sample and the process utilised in this research.

4.1.2. Mayonnaise

For all concentration of mayonnaise tested, ranging from 5 to 0.1% (w/v), the ATP reading was 0, suggesting this method of cleanliness validation is not suitable for this type of fouling. In this test, the ATP swabs were dipped into the solution. Corbitt et al. [31] found that the detection limit for mayonnaise, using ATP bioluminescence, is more than 80,000 times less than that of orange juice due to its low ATP content. Their findings also suggest that the quantity of mayonnaise needed to cause a signal using the ATP system may be far greater than the quantities tested. Furthermore, this limit may be outside the maximum sample volume the ATP system can accommodate.

4.1.3. Cream Cheese

Cream cheese was diluted to five concentrations ranging between 10–0.01% w/v. The results from this test showed readings significantly lower than that of the orange juice; readings ranged from 58 RLU at 10% to 0 RLU at 0.1% and 0.01%. Despite the reduced signal, the results do appear to follow a linear relationship, as shown in Figure 5. Similar to the mayonnaise, these results could be due to a low ATP content in cream cheese.
The ATP testing of the fouling solutions suggested the mayonnaise and cream cheese have a lower ATP content than orange juice. For this reason, ATP testing could misrepresent the cleanliness of a surface, particularly if comparing between two different fouling types. Additionally, when ATP testing the washed containers, the area swabbed might have not been representative of the whole container since fouling is likely to occur outside of the swabbed are and may not be evenly distributed. Moreover, the process is time consuming, contaminates the surface despite not checking the whole surface, and has a consumables cost (£1–£2 per swab), which is many times the value of the pack.

4.2. Impact of Washing Procedure on the Pack Form

Two types of fouling, Tropicana® orange juice and Philadelphia® Cream Cheese, were investigated to study the impact of washing procedure on the pack form, and testing revealed that the required wash time was found to be quite dependent on fouling type. This presents the opportunity to optimise the wash time depending on the food residue present, which could lead to resource and time savings.

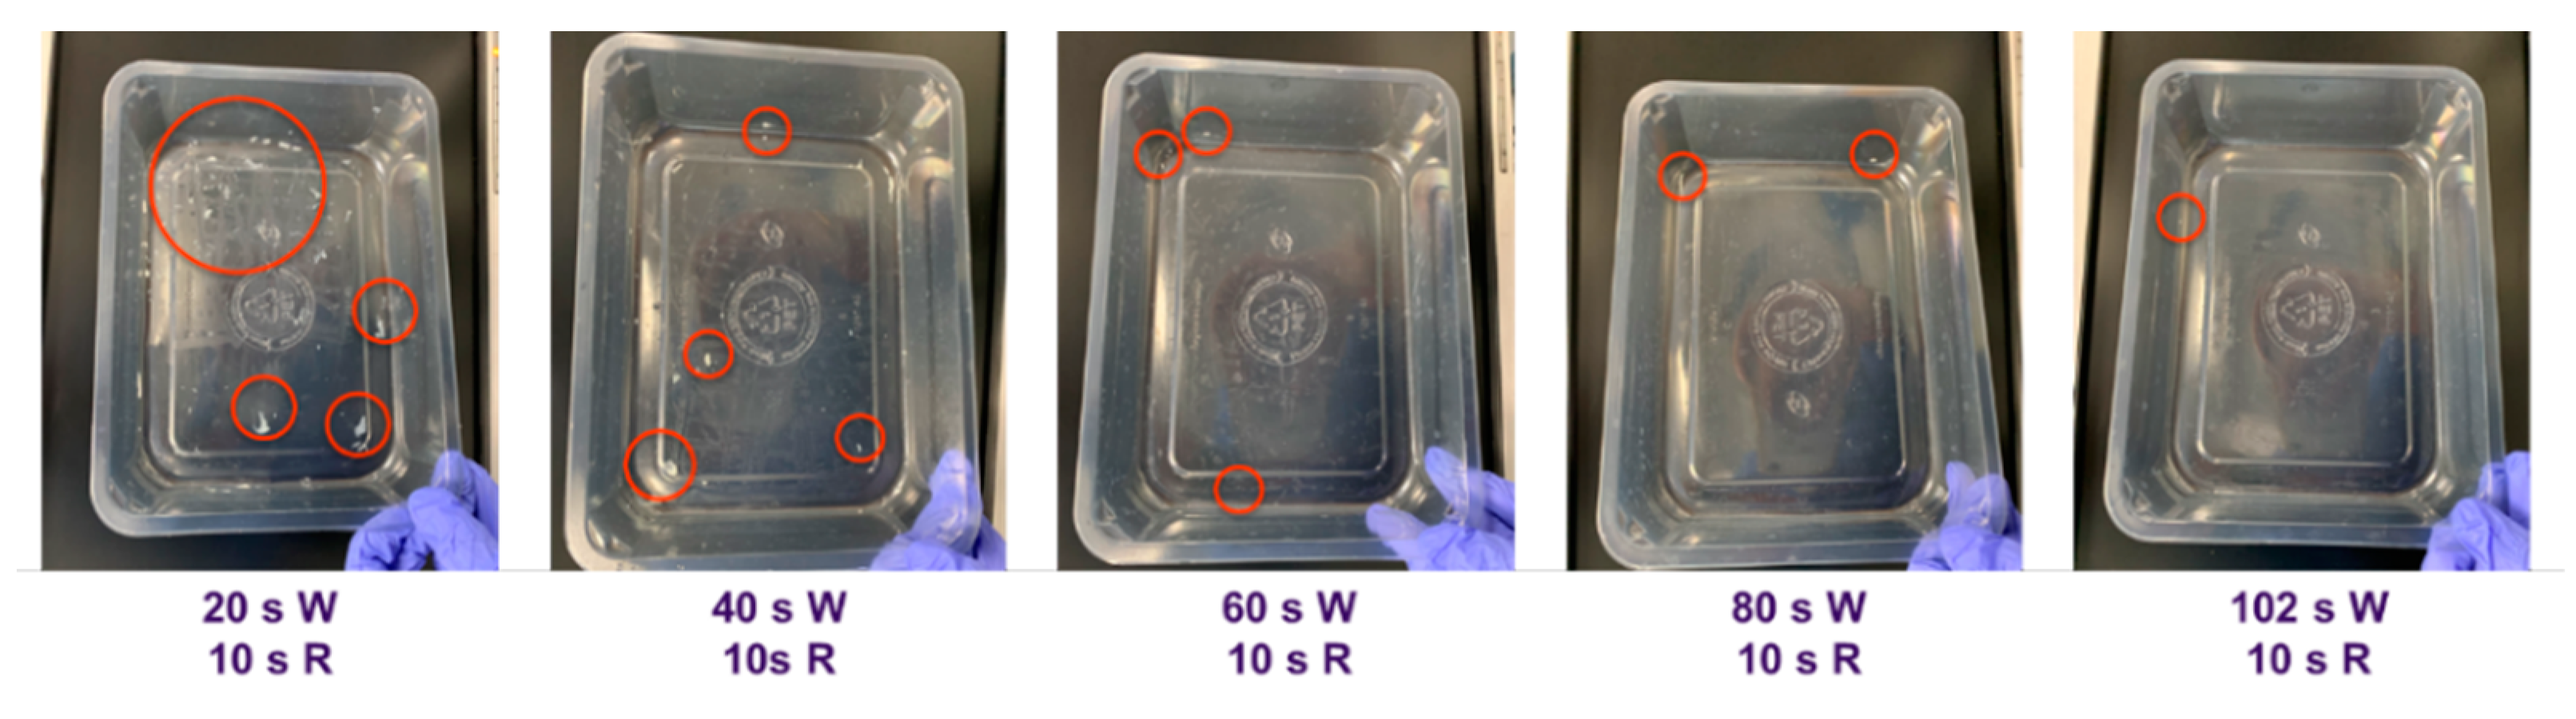
4.2.1. Wash Duration

Packs fouled with 2.00 g (±0.05) of dried-on orange juice were cleaned for various wash durations using 3 mL/L of detergent, as reported in Table 1. It was found that with only a 10 s rinse (no wash), the container passed the ATP test. Therefore, the rinse time was reduced. After 7 s the containers still passed the ATP test, but failed after only a 5 s rinse. For this reason, the effect of dose on the efficiency of cleaning containers fouled with orange juice was not investigated. Similarly, the quantity of fouling was not reduced.
Containers fouled with 2.00 g (±0.05) of dried-on cream cheese were cleaned for a range of wash durations with a standard 10 s rinse. The results show a decrease in ATP result as the wash time increases and passing the ATP test after a 40 s wash with 10 s rinse (Figure 6). However, for all tests, visible fouling remained on the container after the wash, as shown in Figure 7. This indicates two major disadvantages of ATP testing. Firstly, the fouling type (and hence ATP content) will largely influence the accuracy of the test. It was revealed when testing the different fouling concentration solutions that cream cheese displays less bioluminescence than orange juice. Therefore, this could lead to a false negative result, that is, an absence of a high reading in the presence of elevated fouling levels. Secondly, the ATP test relies on the 100 mm × 100 mm sample area being representative of the whole area of interest. If not representative, the ATP could give a reduced reading, which could also contribute to a false negative.
Wash durations 0–20 s were repeated three times. The results of these repeats, as displayed in Figure 6, show significant variation in the results of the shorter wash durations. This is likely to be because ATP testing is not intended for use on visible fouling, and overloading the swab can cause inaccurate readings as the bioluminescent reaction is inhibited [32].

4.2.2. Detergent Dose

The test was repeated with 0 mL/L and 6 mL/L of detergent, with 30–102 s washes. The exponential trendline, shown in Figure 8, represents that a higher detergent concentration improves the cleaning efficiency of the cycle; after a 40 s wash with 10 s rinse, the 3 mL/L and 6 mL/L dosing pass the ATP threshold (30 RLU, olive shaded area), but the 0 mL/L trendlines only passes after a 54 s with 10 s rinse. After 70 s, the difference in ATP response between the 0 mL/L and 3 mL/L trendlines becomes very similar and falls into the higher standard cleaning region (10 RLU, grey shaded area); therefore, for sufficient cleaning, the required quantity of detergent is dependent on the wash duration.
Again, all containers had visible fouling remaining after the wash, with the exception of the container washed for 102 s using 6 mL/L of detergent. Another observation made during testing was the presence of a film of cream cheese residue on the containers washed without detergent. Figure 9A–C show the containers after the maximum wash duration. Figure 9A shows visible streaks of food residue, whereas this was not observed when detergent was used (Figure 9B,C).

4.2.3. Fouling Quantity

The experiment was repeated with 1 g (±0.05) of cream cheese and 3 mL/L of detergent. Comparing the results to those obtained with 2 g (±0.05) of cream cheese (Figure 10) shows the quantity of fouling on the container does affect the duration of the wash needed to pass the ATP test, as can be seen from the shaded region outlined with corresponding acceptable RLU values for satisfying industry standards. However, this difference is most evident at shorter wash durations. After 80 s, the trendlines become indistinguishable.
When fouled with 1 g (±0.05) of cream cheese, four containers showed no visible fouling after the cleaning process (60 s, 70 s, 80 s, and 102 s), which further suggests that the quantity of fouling influences the required cleaning time.
It can be concluded that other food residues typically found on food-to-go (FTG) packaging would need to be investigated to identify any fouling types that are particularly difficult to clean. Furthermore, it is possible that the packaging may be exposed to other unexpected types of fouling, which may include non-food substances during the use stage. Therefore, the fouling residues may not be constrained to only those found in the FTG product. The prospect of saving resources and time is also dependent on the infrastructure used during the cleaning process. If multiple different packaging items are cleaned using the same machine, the wash time will have to accommodate the worst case hardest-to-clean fouling type. Therefore, any saving in time or resources may be lost. Water temperature and water pressure were not investigated, however, in order to design and fully optimise a washing process for resource efficiency, it would be prudent to also investigate the environmental impact of these washing parameters.

4.3. Pack Form Appearance under Simulated Reuse

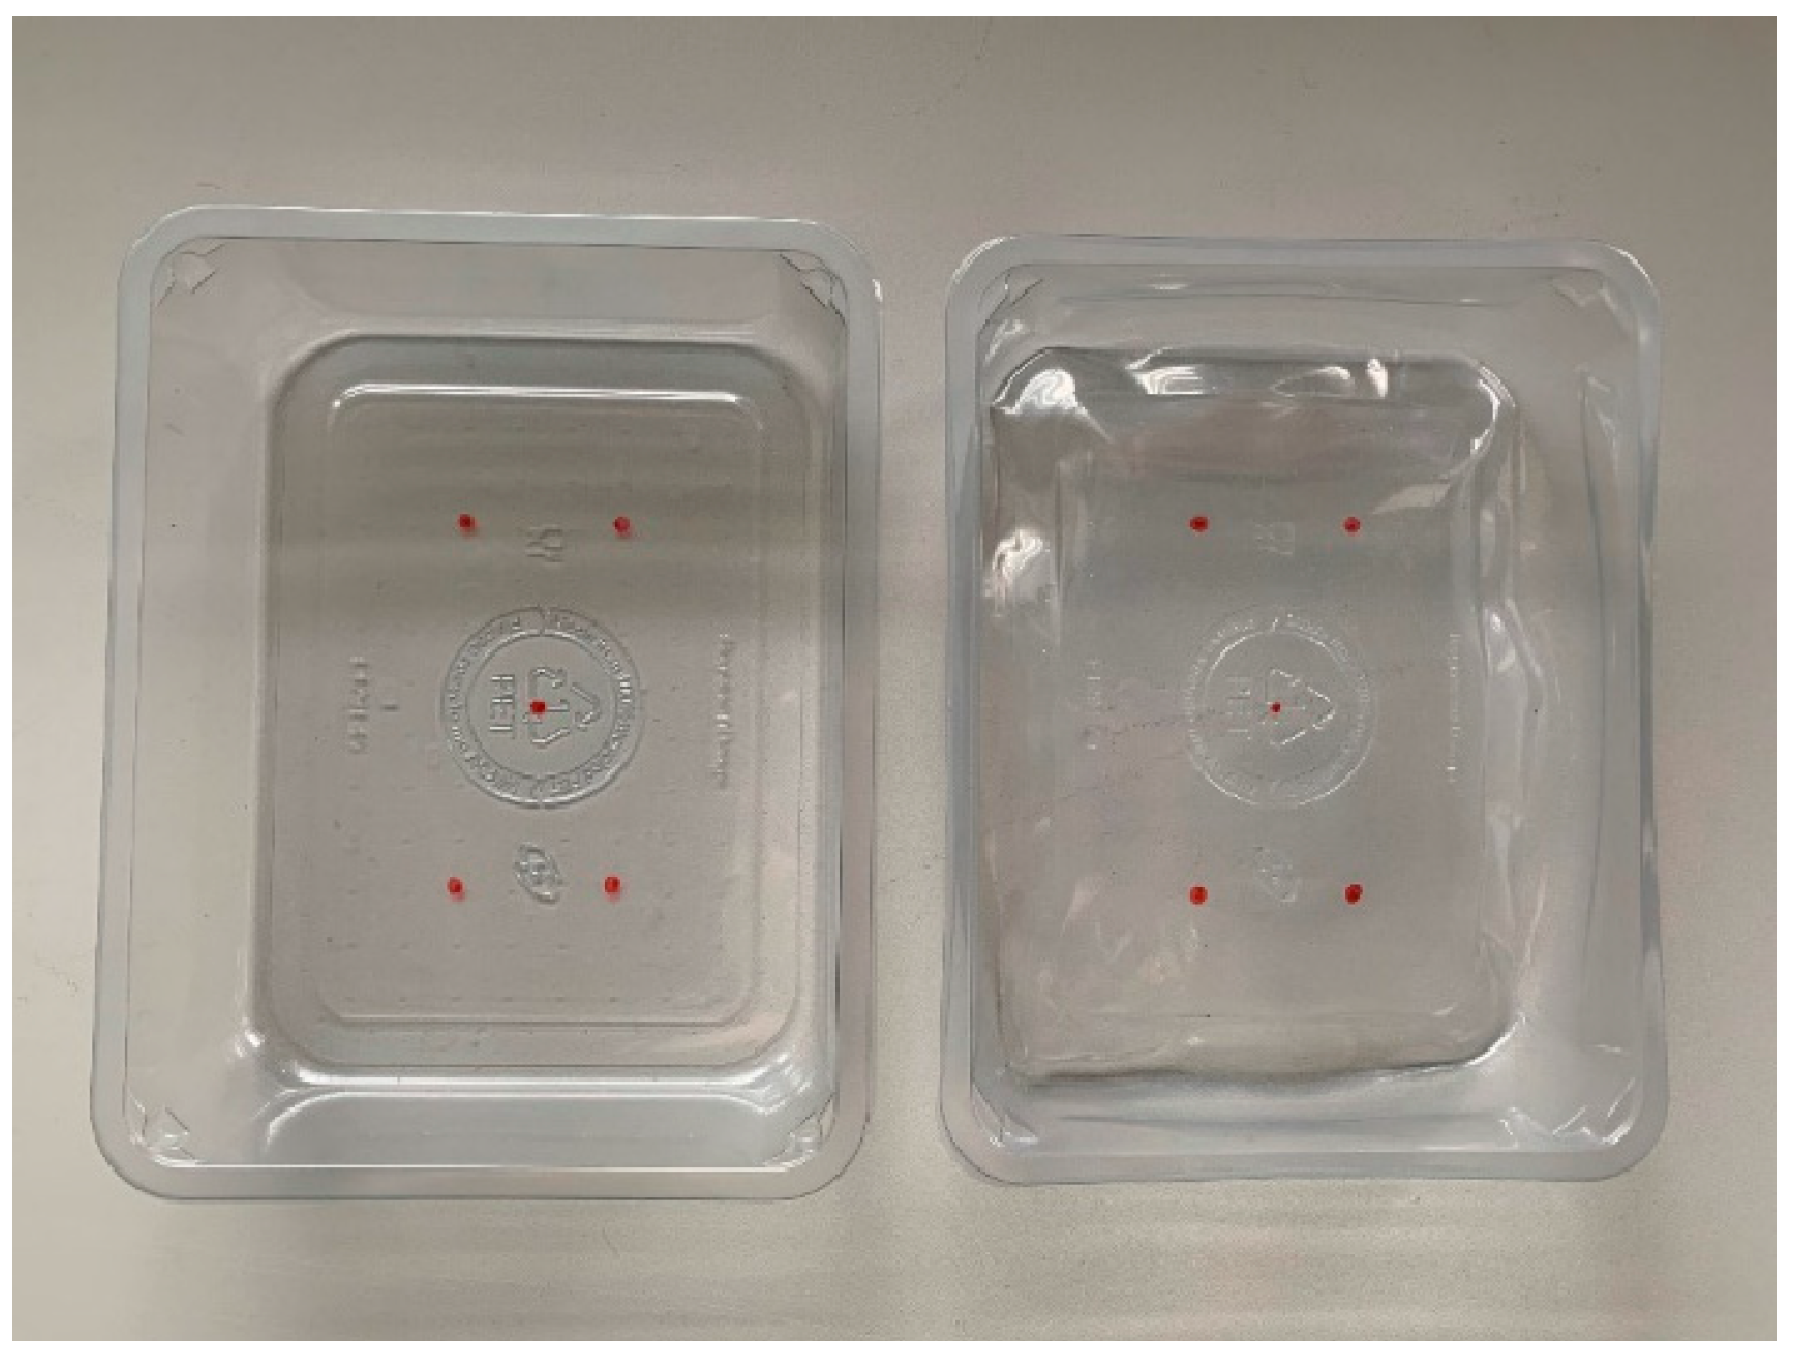
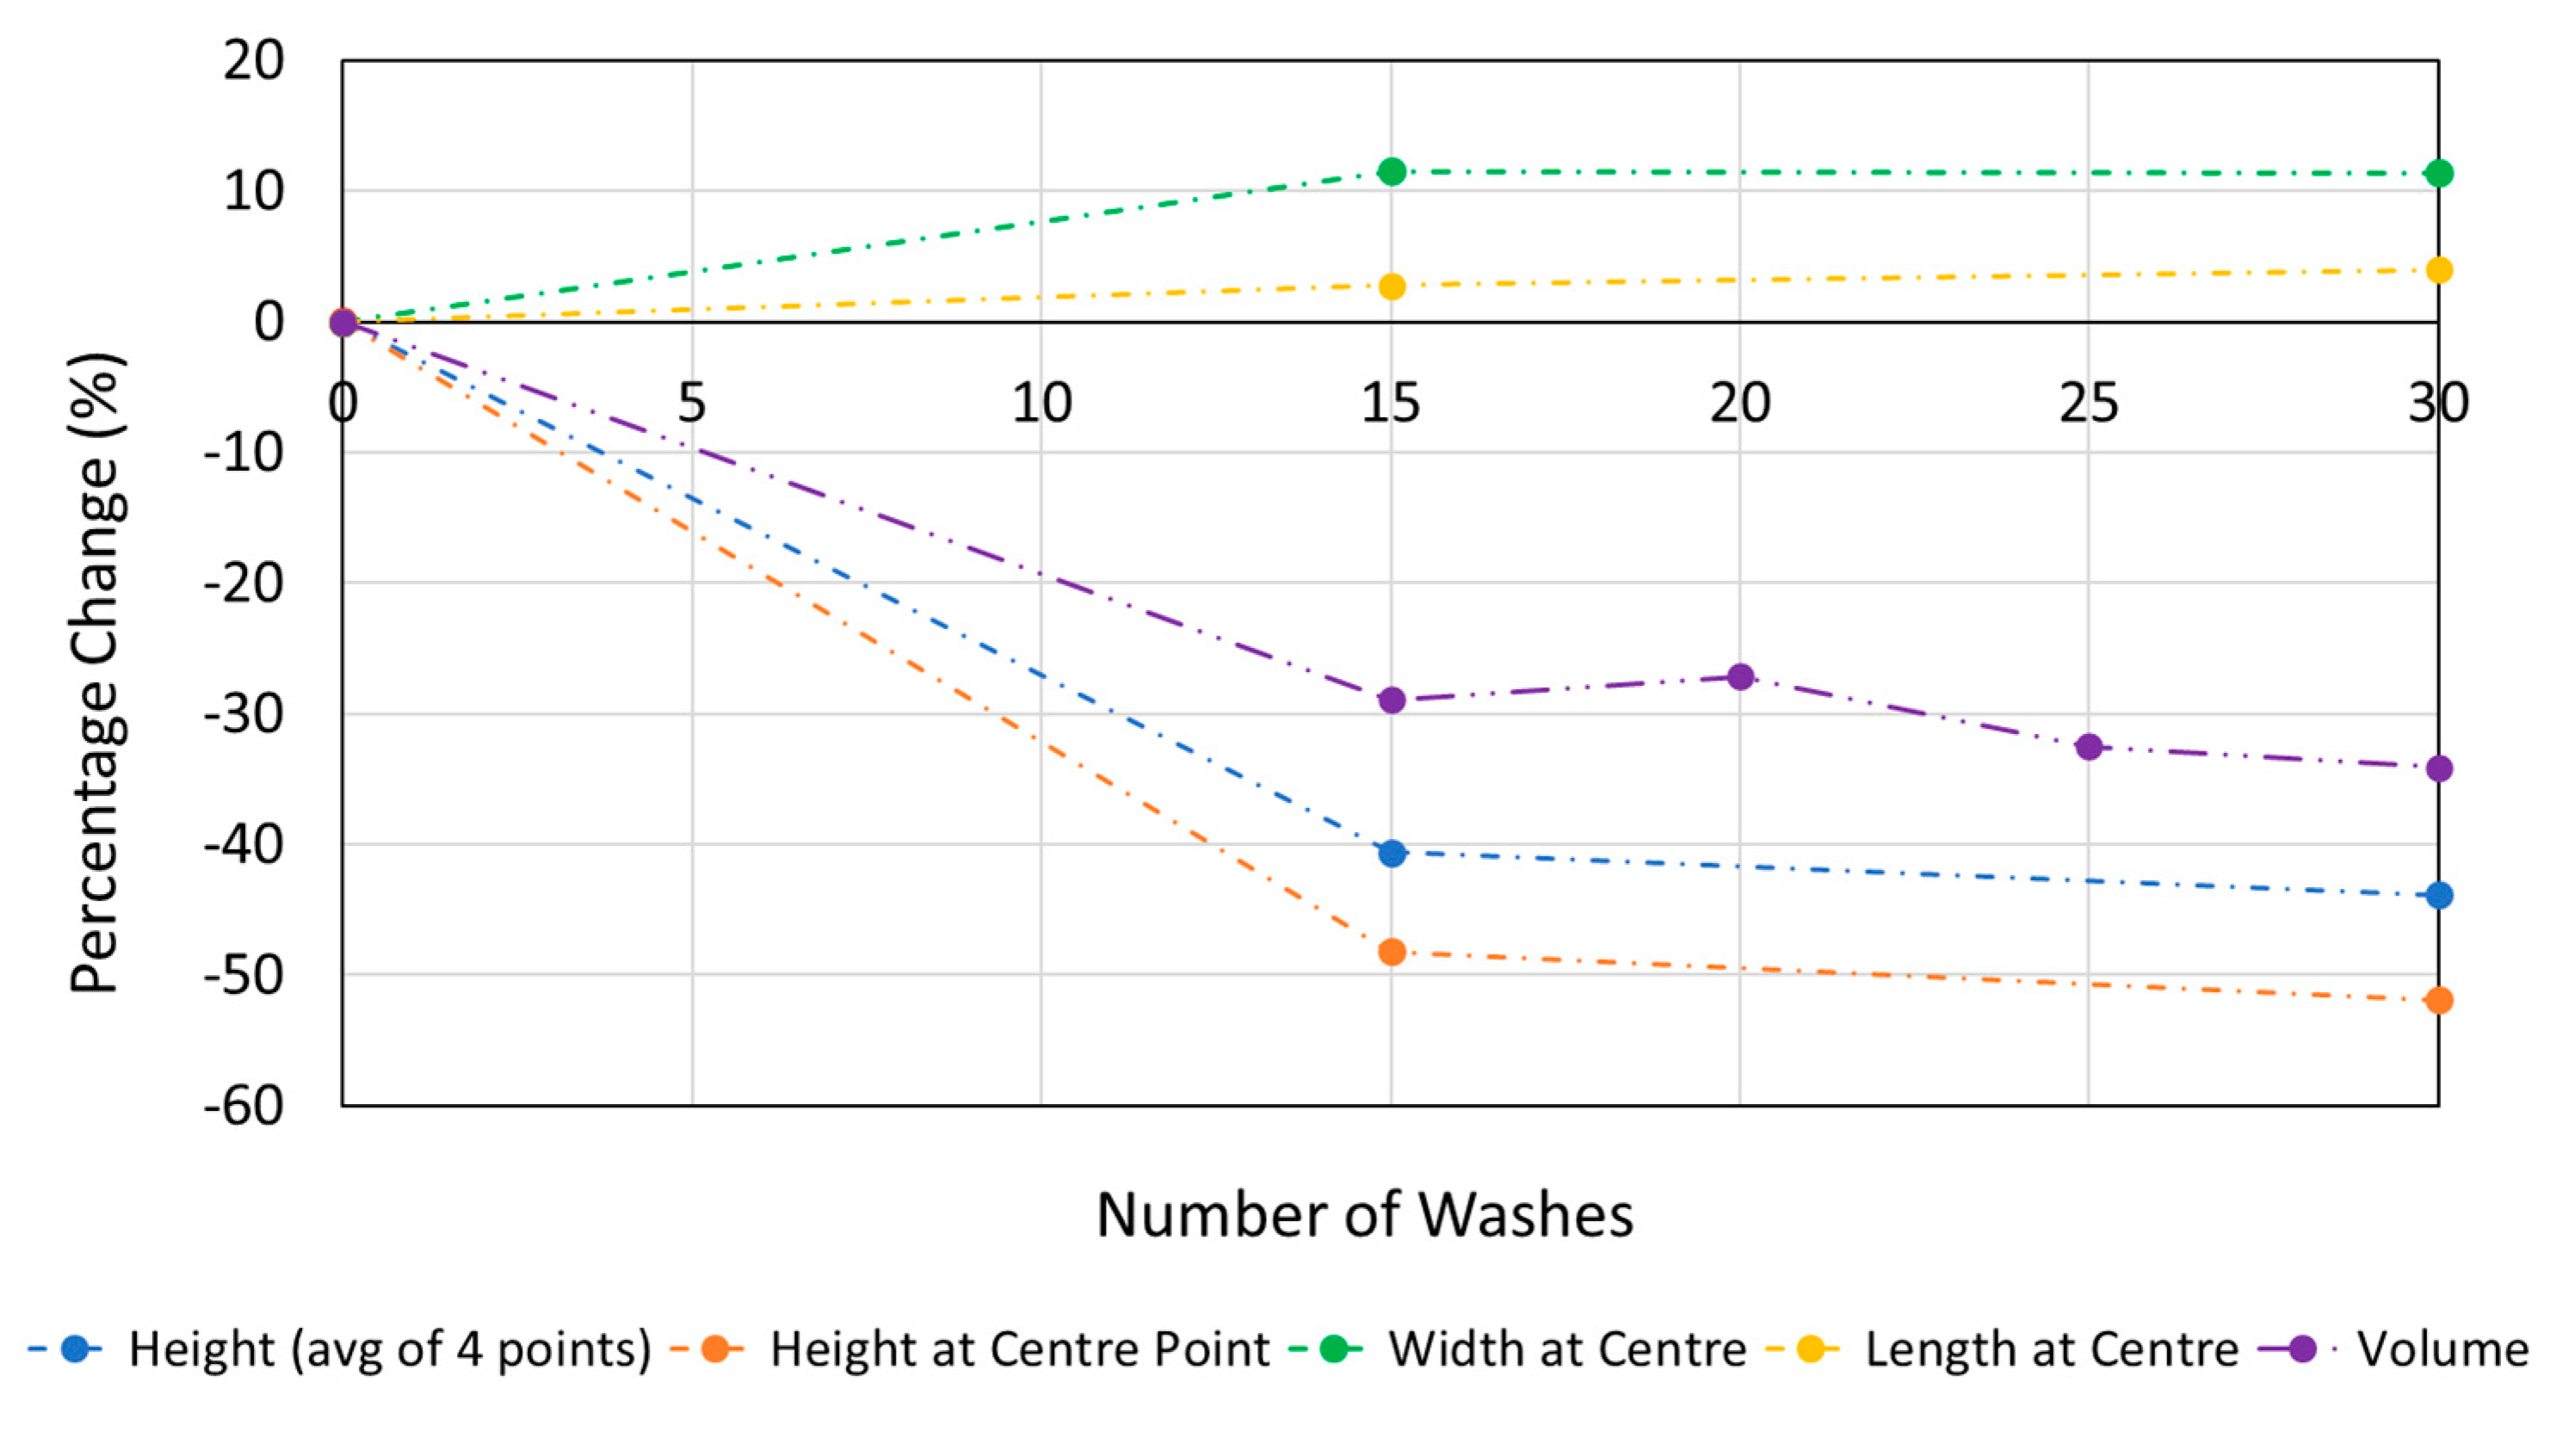
4.3.1. Physical Deformation

During the washing process, the packs were temporarily raised to near the glass transition temperature (Tg for PET is 60–76 °C [33] and rinse temperature is 70 °C), which is likely to have led to the observed visible deformation. Furthermore, the containers were exposed to a low concentration of the caustic detergent during the cycle, which may also have contributed to the deformation.
Figure 11 displays the percentage change of the washed pack dimensions and shows that the length and width of the packs increased while the height decreased. The width experienced more deformation than the length, and the height at the centre decreased by almost 50% after 15 washes. It is also evident that the majority of the deformation occurred within the first 15 washes, which is consistent with the visual appearance of the containers, as shown in Table 2. Similarly, the volumes of the washed packs decreased by almost 30% between 0 and 15 washes, but only decreased by a further 5% after 15 more washes.
Repeatedly washing the packs decreased the internal volume by as much as 34% after 30 wash cycles, which would likely influence the ability to refill the container correctly with the required food product. However, the packaging used in this investigation is not designed or intended to be used more than once, and so these results are not unexpected. Pack deformation due to washing will not only impact customer acceptance, but also the success of reverse logistics. During transit and refilling, it is likely that the used containers would require nesting and de-nesting, which may be disrupted by pack deformation. Moreover, deformation could influence the ability to seal the packs with a single use film lid or other appropriate close-fit sealing mechanism. The implications of this study could support the design of reusable packs, which may include specific features to combat deformation and hence extend the container’s life.

4.3.2. Mechanical Deformation

The results of tensile testing (data shown in the Appendix A) indicated a slight increase in stiffness (Young’s Modulus) and tensile strength with washing, with the largest increase seen after only 5 washes (Figure 12 and Figure 13). This stiffening may be due to the polymer chains relaxing and contracting due to the elevated temperatures during the cleaning cycle. The standard variation in the six results from each pack, shown by the error bars, indicates a margin of error associated with the results. This is undoubtedly due to the inconsistency of the rPET material across the different areas of the pack, caused by the thermoforming manufacturing process. Additionally, physical warping of the washed packs likely influenced the accuracy of these results, for example, more variable thickness of the material across the test specimens would influence the accuracy of the calculated tensile stress. It was found that after 30 washes, the tensile strength increase appeared to plateau at 18.5 MPa, about 40% more compared to the unwashed pack. This increase in strength and stiffness is most likely a sign of increased packing density of rPET polymer chains upon relaxation when washed at 70 °C, supporting the observed shrinkage of the pack dimensions.

4.3.3. Thermal (DSC) and Chemical (IR) Degradation

The DSC analysis (reported in Appendix C) represents a minor increase in the Tg after 15 washes, again, likely due to the increased density of the rPET chains. However, this increase was extremely low and there were also no clear changes in the melt transitions of the plastic. This confirms there was no significant thermal degradation of the rPET from the repeated washing.
In addition, infrared (IR) spectroscopy analysis showed no noticeable change in the chemical bonding with the rPET material when washing, as shown in Figure 14. Chemical degradation of the rPET would be indicated by a larger OH stretching band (~3000–3400 cm−1) and reduced C-C-O band (1240 cm−1). Neither were observed here.
Despite the deformation of the containers, IR spectroscopy, DSC, and tensile tests confirm that the plastic rPET material did not noticeably degrade. This represents a crucial advantage over the current use of most PET packaging, whereby the plastic is mechanically recycled after each use. This is because continued mechanical recycling of PET is liable to break the polymer chains and drastically impede the material properties after only a small number of cycles [34].

5. Conclusions

Sufficient cleaning of reusable packaging without causing excessive resource consumption is essential for preventing cross-contamination between uses and facilitating successful reuse systems. The research conducted has revealed some of the challenges associated with cleaning plastic food packaging, perhaps most importantly the requirement for the optimisation of washing parameters and their effect on the packaging dimensions and appearance. For the first time in the application of polymer packaging, it has been shown that the wash duration required to pass an ATP test is dependent on the type of fouling, the quantity of fouling, and the detergent dose. More importantly, the ATP assay has been found to be an inappropriate method for assessing the cleanliness of surfaces fouled with visible fouling, as there is the possibility for false negatives (passes) to be produced. This can be partly attributed to errors due to the swabbing process and the representativity of the sample area, and partly due to very high levels of fouling which can lead to erroneously low readings. Furthermore, ATP testing is an inappropriate method for assessing the cleanliness of surfaces contaminated with substances with low ATP content, such as mayonnaise and cream cheese, which may also yield false negative results. It should be noted that although these studies have been undertaken on packs designed for single-use, rather than ones purposely designed for reuse, it is anticipated that these results would be valid for all types of plastic packaging use scenarios.
In terms of pack integrity, it has been demonstrated that material degradation for rPET is low and insignificant, even after being subject to a large number of wash cycles. However, for the single use pack forms investigated, the temperature of the wash and rinse cycles led to unacceptable deformation. Although pack washing and reuse has been identified as an effective method to retain the value of plastic resources, it is clear that reusable FTG pack forms need to be specifically designed to withstand the repeated washing conditions outlined in this study. Examples of design considerations may be to use thicker walled packs, carefully thermally set polymers to reduce stress points in the packs, or utilise materials with higher glass transition temperatures. Acceptable tolerances of industrial handling and sealing systems should also be investigated in the context of minor pack deformation.
To be able to optimise the cleaning process and minimise resource consumption, further research into factors such as water temperature and water pressure, and their respective environmental impacts, is required. In addition, new methods for the detection of fouling are required if every pack destined for reuse is to have its cleanliness assessed, since ATP swabbing techniques are time consuming and prohibitively expensive for comprehensive testing. Optical techniques that are able to rapidly visualise and assess the full surface area are likely to be a more acceptable and viable approach. The impact of any material degradation from repeated contact with food and chemicals used during the wash cycle will need to be investigated for new reusable packaging designs. Ultimately, packaging wash and cleanliness assessment methods need to be developed within the context of, and sensitive to the requirements of, emerging circular economy industrial systems which should be able to deliver the throughput, reliability, and integrity that is currently delivered by single use packaging.

Author Contributions

Conceptualization, S.N. and E.W.; methodology, S.N., M.S., R.L. and E.W.; formal analysis, S.N., M.S. and R.L.; investigation, S.N., M.S. and R.L.; resources, E.W.; data curation, S.N., M.S. and R.L; writing—original draft preparation, S.N., M.S., R.L. and E.W.; writing—review and editing, S.N., M.S., R.L., F.L.H. and E.W.; visualization, S.N., M.S. and R.L.; supervision, S.N., F.L.H. and E.W.; project administration, E.W. and F.L.H.; funding acquisition, S.N., F.L.H. and E.W. All authors have read and agreed to the published version of the manuscript.

Funding

This work was supported by funds from the EPSRC DTP 2020–2021 Loughborough University fund [EP/T518098/1] and the NERC Perpetual Plastic for Food to Go (PPFTG) project [NE/V01076X/1].

Institutional Review Board Statement

Not applicable.

Informed Consent Statement

Not applicable.

Data Availability Statement

Not applicable.

Acknowledgments

The authors would like to thank Klöckner Pentaplast for providing the packaging samples used in this investigation and are also grateful for the assistance provided in metrology analysis by David Thompson, Loughborough University.

Conflicts of Interest

The authors here declare no conflict of interest.

Appendix A

Summary of Tensile Testing Data
Number of WashesTensile Strength
(MPa)
Young’s Modulus
(MPa)
Yield Stress
(MPa)
Strain at Yield
(%)
044.8 ± 8.91717 ± 27749.4 ± 5.43.67 ± 0.21
557.0 ± 10.61984 ± 26651.9 ± 7.23.89 ± 0.09
1556.7 ± 11.22035 ± 34457.6 ± 1.03.97 ± 0.07
2061.1 ± 9.62076 ± 26861.2 ± 1.04.17 ± 0.07
2561.0 ± 3.92181 ± 14561.3 ± 0.63.97 ± 0.01
3063.3 ± 10.02127 ± 22860.5 ± 3.64.02 ± 0.08

Appendix B

Cream Cheese—2 g of Fouling—3 mL/L of Detergent on Machine
Wash Time (s)Rinse Time (s)ATP Test Result
(RLU)
Observations after Wash
010290Visible fouling
211Visible fouling
155Visible fouling
1010167Visible fouling
207Visible fouling
189Visible fouling
2010249Visible fouling
73Visible fouling
189Visible fouling
301072Visible fouling
401022Visible fouling
501014Visible fouling
601013Visible fouling
70109Visible fouling
80102Visible fouling
90105Visible fouling
102
(Standard wash)
104Visible fouling
Cream Cheese—2 g of Fouling—0 mL/L of Detergent on Machine
Wash Time (s)Rinse Time (s)ATP Test Result
(RLU)
Observations after Wash
201066
301083Visible fouling
401057Visible fouling
501026Visible fouling
601015Visible fouling
701012Visible fouling
801014Visible fouling
901020Visible fouling
102
(Standard wash)
1013Visible fouling
Cream Cheese—2 g of Fouling—6 mL/L of Detergent on Machine
Wash Time (s)Rinse Time (s)ATP Test Result
(RLU)
Observations after
Wash
201042Visible fouling
301083Visible fouling
401057Visible fouling
501026Visible fouling
601015Visible fouling
701012Visible fouling
801014Visible fouling
901020Visible fouling
102
(Standard wash)
1013No noticeable fouling
Cream Cheese—1 g of Fouling—3 mL/L of Detergent on Machine
Wash Time (s)Rinse Time (s)ATP Test Result
(RLU)
Observations after
Wash
201063Visible fouling
301032Visible fouling
401020Visible fouling
50108Visible fouling
60104Visible fouling
70104No noticeable fouling
80105No noticeable fouling
90103Visible fouling
102
(Standard wash)
107No noticeable fouling

Appendix C

DSC Data0515202530
Tg (°C) (±standard deviation)66.4 (±0.5)66.3 (±0.8)70.4 (±0.9)70.0 (±0.2)70.2 (±0.1)69.8 (±0.1)
Tc (°C) (±standard deviation)125.9 (±0.5)124.5 (±2.9)124.3 (±2.0)124.5 (±0.5)124.1 (±0.4)123.4 (±0.3)
Tm (±standard deviation) (°C)247.7 (±0.2)249.3 (±2.2)248.1 (±0.8)247.7 (±0.2)247.8 (±0.2)247.7 (±0.1)

References

  1. Ellen MacArthur Foundation. The New Plastics Economy, Rethinking The Future of Plastics. Available online: https://www.mckinsey.com/~/media/McKinsey/dotcom/client_service/Sustainability/PDFs/The%20New%20Plastics%20Economy.ashx (accessed on 6 September 2021).
  2. Gogliettino, M.; Balestrieri, M.; Ambrosio, R.L.; Anastasio, A.; Smaldone, G.; Proroga, Y.T.R.; Moretta, R.; Rea, I.; De Stefano, L.; Agrillo, B.; et al. Extending the Shelf-Life of Meat and Dairy Products via PET-Modified Packaging Activated with the Antimicrobial Peptide MTP1. Front. Microbiol. 2020, 10, 2963. [Google Scholar] [CrossRef] [PubMed]
  3. Smith, L. A House of Commons Library Briefing Paper on plastic waste in the UK. Briefing Paper Number 08515. Available online: https://researchbriefings.files.parliament.uk/documents/CBP-8515/CBP-8515.pdf (accessed on 17 May 2022).
  4. Smithers, R. ‘Lunch on The Go’ Habit Generates 11bn Items of Packaging Waste a Year. The Guardian, London. Available online: https://www.theguardian.com/environment/2019/may/14/lunch-on-go-habit-generates-11bn-items-packaging-waste-year-uk (accessed on 11 November 2021).
  5. Clark, N.; Trimingham, R.L.; Wilson, G.T. Incorporating consumer insights into the UK food packaging supply chain in the transition to a Circular Economy. Sustainability 2020, 12, 6106. [Google Scholar] [CrossRef]
  6. The Grocer Vision. Whitepapers on ‘Grocery Packaging in A Sustainable Future’. Available online: https://drlkaenwvxlk9.cloudfront.net/Uploads/l/z/m/grocervisionpwcbeyondplastics_869862.pdf (accessed on 5 July 2022).
  7. Ross, S.; Evans, D. The environmental effect of reusing and recycling plastic-based packaging system. J. Clean. Prod. 2003, 11, 561–571. [Google Scholar] [CrossRef]
  8. Zero Waste Europe. Press Release ‘Reusable vs. Single-Use packaging: A Review of Environmental Impact’. Available online: https://zerowasteeurope.eu/library/reusable-vs-single-use-packaging-a-review-of-environmental-impact/ (accessed on 28 September 2021).
  9. McDowell, D.A. Food Hygiene Challenges in Replacing Single Use Food Service Ware with Reusable Food Service Items. Available online: https://www.eppa-eu.org/uploads/Bestanden/FINAL%20EPPA%20Report%20-%20Professor%20David%20McDowell.pdf (accessed on 22 July 2021).
  10. Pilz, H.; Brandt, B.; Fehringer, R. The Impact of Plastic packaging on Life Cycle Energy Consumption and Greenhouse Gas Emissions in Europe, Plastics Europe. Available online: http://matchpack2015.web2016.netivity.nl/data/filling/pdf/105/The-impact-of-plastics-on-life-cycle-energy-consumption-and-greenhouse-gas-emissions-in-Europe.pdf (accessed on 11 November 2021).
  11. Wohner, B.; Pauer, E.; Heinrich, V.; Tacker, M. Packaging-related food losses and waste: An overview of drivers and issues. Sustainability 2019, 11, 264. [Google Scholar] [CrossRef]
  12. Hahladakis, J.N.; Purnell, P.; Iacovidou, E.; Velis, C.A.; Atseyinku, M. Post-consumer plastic packaging waste in England: Assessing the yield of multiple collection-recycling schemes. Waste Manag. 2018, 75, 149–159. [Google Scholar] [CrossRef] [PubMed]
  13. Megale Coelho, P.; Corona, B.; Klooster, R.; Worrell, E. Sustainability of reusableackaging–Current situation and trends. Resour. Conserv. Recycl. X 2020, 6, 100037. [Google Scholar] [CrossRef]
  14. Hopewell, J.; Dvorak, R.; Kosior, E. Plastics recycling: Challenges and opportunities. Philos. Trans. R. Soc. B Biol. Sci. 2009, 364, 2115–2126. [Google Scholar] [CrossRef] [PubMed]
  15. Harnoto, M.F. A Comparative Life Cycle Assessment of Compostable and Reusable Takeout Clamshells at the University of California, Berkeley. Available online: https://nature.berkeley.edu/classes/es196/projects/2013final/HarnotoM_2013.pdf (accessed on 22 July 2021).
  16. Reloop, Zero Waste Europe. Reusable vs. Single-Use packaging—A Review of Environmental Impacts. Available online: https://zerowasteeurope.eu/wp-content/uploads/2020/12/zwe_reloop_report_reusable-vs-single-use-packaging-a-review-of-environmental-impact_en.pdf.pdf_v2.pdf (accessed on 22 July 2021).
  17. Loop. Cleaning Systems. Available online: https://loopstore.co.uk/cleaning (accessed on 11 August 2021).
  18. Food Standards Australia New Zealand. A Guide to the Food Safety Standards Appendix 6- Cleaning and Sanitising Surfaces and Utensils, 3rd ed. Available online: https://www.foodstandards.gov.au/publications/Pages/safefoodaustralia3rd16.aspx (accessed on 13 August 2021).
  19. NSF. Dishwashers. Available online: https://www.nsf.org/knowledge-library/dishwashers (accessed on 15 July 2021).
  20. Guh, A.; Carling, P. Options for Evaluating Environmental Cleaning, Centres for Disease Control and Prevention. Available online: https://www.cdc.gov/hai/pdfs/toolkits/Environ-Cleaning-Eval-Toolkit12-2-2010.pdf (accessed on 11 August 2021).
  21. Thermo Fischer Scientific. Hygiene and Sanitation Monitoring Using ATP Bioluminescence. Available online: https://www.thermofisher.co.nz/Uploads/file/Scientific/Microbiology-Products/1542342447_ATP-Hygiene-monitoring_White-Paper_FDB_NZ.PDF (accessed on 11 August 2021).
  22. Hygiena. ATP Testing: A Proven Method to Measure Cleanliness. Available online: https://www.hygiena.com/wp-content/uploads/2020/09/ATP-Testing-A-Proven-Method-to-Measure-Cleanliness.pdf (accessed on 11 August 2021).
  23. Kupski, B.; Ceylan, E.; Stewart, C. Performance Evaluation of Various ATP Detecting Units; Silliker, Inc.: Chicago, IL, USA, 2009. [Google Scholar]
  24. Shama, G.; Malik, D.J. The uses and abuses of rapid bioluminescence-based ATP assays. Int. J. Hyg. Environ. Health 2013, 216, 115–125. [Google Scholar] [CrossRef] [PubMed]
  25. Food Standards Agency, Cleaning. Available online: https://www.food.gov.uk/print/pdf/node/194 (accessed on 21 September 2021).
  26. Costa, P.D.; Nélio, J.A.; Sebastião, C.C.B.; Frederico, J.V.P.; Nilda, F.F.S. ATP-bioluminescence assay as an alternative for hygiene-monitoring procedures of stainless-steel milk contact surfaces. Braz. J. Microbiol. 2006, 37, 345–349. [Google Scholar] [CrossRef]
  27. Griffith, C. Improving surface sampling andetection of contamination. In Handbook of Hygiene Control in Theood Industry; Lelieveld, H.L.M., Mostert, M.A., Holah, J., Eds.; Woodhead Publishing: Sawston, UK, 2005; pp. 588–618. [Google Scholar]
  28. Hygiena. Hygiena SystemSURE Plus™: Instruction Manual. Available online: https://www.sanitationtools.com/media/luminometer-operators-manual-v4.0.pdf (accessed on 12 August 2021).
  29. Hygiena (noate—A). A Comparative Study of Commercial ATP Hygiene Monitoring Systems. Available online: https://d163axztg8am2h.cloudfront.net/static/doc/9a/72/6a2bdc2f5e07097e41972ba05d66.pdf (accessed on 12 August 2021).
  30. Hygiena (noate—B). Lower and Upper RLU Limitsor ATP Monitoring Programs. Available online: https://d163axztg8am2h.cloudfront.net/static/doc/c1/b1/d472875da397448c7747d185c9e2.pdf (accessed on 6 September 2021).
  31. Corbitt, A.J.; Bennion, N.; Forsythe, S.J. Adenylate kinase amplification of ATP bioluminescence for hygiene monitoring in the food and beverage industry. Lett. Appl. Microbiol. 2000, 30, 443–447. [Google Scholar] [CrossRef]
  32. Hygiena. Hygiena UltraSnap ™ Surface ATP Test: Instruction Manual. Available online: https://cdn.brandfolder.io/VZSMQ4LE/at/mj3w6kh453z8mk28xx98n/ATP-UltraSnap-Kit-Insert.pdf (accessed on 3 September 2021).
  33. Wypych, G. Handbook of Polymers, 2nd ed.; ChemTec Publishing: Scarborough, ON, Canada, 2016; pp. 398–403. ISBN 978-1-895198-92-8. [Google Scholar] [CrossRef]
  34. Schyns, Z.O.G.; Shaver, M.P. Mechanical Recycling of Packaging Plastics: A Review. Macromol. Rapid Commun. 2021, 42, 2000415. [Google Scholar] [CrossRef]
Figure 1. Selected pack form artificially fouled with cream cheese.
Waste 01 00003 g001
Figure 2. CMM setup.
Waste 01 00003 g002
Figure 3. Unwashed (left) and washed (right) packaging measurement points.
Waste 01 00003 g003
Figure 4. Orange Juice Concentration vs. ATP Reading—Comparison to results published by Hygiena (n.d.-B).
Waste 01 00003 g004
Figure 5. Linear line of best fit applied to ATP response from tested concentrations of cream cheese fouling.
Waste 01 00003 g005
Figure 6. ATP response from packs with controlled initial fouling levels washed for different durations.
Waste 01 00003 g006
Figure 7. Visible fouling observed for longer wash duration—2 g of cream cheese deposited and air dried for 22 h. Areas of visible fouling have been highlighted by the red circles.
Waste 01 00003 g007
Figure 8. ATP response from packs cleaned using different detergent doses. The light green area indicates results classed as a pass for food safety, whilst the grey area indicates passes for high control environments.
Waste 01 00003 g008
Figure 9. (AC) Containers after a 102 s wash and 10 s rinse. 0 mL/L, 3 mL/L, and 6 mL/L respectively.
Waste 01 00003 g009
Figure 10. ATP response from packs cleaned using different initial fouling conditions. The light green area indicates results classed as a pass for food safety, whilst the grey area indicates passes for high control environments.
Waste 01 00003 g010
Figure 11. Effect of washing on pack dimensions and volume.
Waste 01 00003 g011
Figure 12. Effect of washing on Young’s Modulus.
Waste 01 00003 g012
Figure 13. Effect of washing on tensile strength.
Waste 01 00003 g013
Figure 14. Effect of washing on the chemical degradation. Plots artificially separated for ease of viewing.
Waste 01 00003 g014
Table 1. Wash duration results—orange juice.
Wash Time (s)Rinse Time (s)ATP Test Result (RLU)Average (RLU)
201044
101066
01042.67
2
2
07716.33
16
26
05322398.67
155
719
Table 2. Summary of mechanical testing.
Number of Standard WashesTotal Wash and Rinse Time (m:s)Images
Top ViewBottom ViewSide View
0- Waste 01 00003 i001 Waste 01 00003 i002 Waste 01 00003 i003
58:30 wash
0:50 rinse
Waste 01 00003 i004 Waste 01 00003 i005 Waste 01 00003 i006
1017:00 wash
1:40 rinse
Waste 01 00003 i007 Waste 01 00003 i008 Waste 01 00003 i009
1525:30 wash
2:30 rinse
Waste 01 00003 i010 Waste 01 00003 i011 Waste 01 00003 i012
2034:00 wash
3:20 rinse
Waste 01 00003 i013 Waste 01 00003 i014 Waste 01 00003 i015
2542:30 wash
4:10 rinse
Waste 01 00003 i016 Waste 01 00003 i017 Waste 01 00003 i018
3051:00 wash
5:00 rinse
Waste 01 00003 i019 Waste 01 00003 i020 Waste 01 00003 i021
Disclaimer/Publisher’s Note: The statements, opinions and data contained in all publications are solely those of the individual author(s) and contributor(s) and not of MDPI and/or the editor(s). MDPI and/or the editor(s) disclaim responsibility for any injury to people or property resulting from any ideas, methods, instructions or products referred to in the content.

